2. natural climate variability 2.1 introduction 2.2 interannual variability 2.3 decadal variability...
TRANSCRIPT

2. Natural Climate Variability
2.1 Introduction
2.2 Interannual Variability
2.3 Decadal Variability
2.4 Climate Prediction
2.5 Variability of High Impact Weather
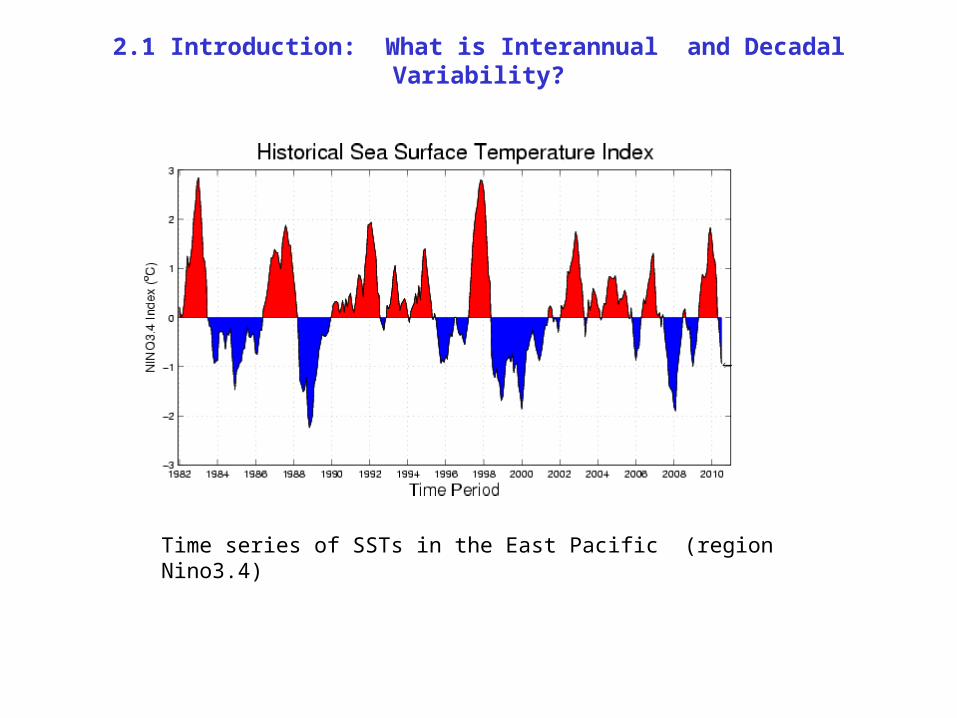
Time series of SSTs in the East Pacific (region Nino3.4)
2.1 Introduction: What is Interannual and Decadal Variability?
2.1 Introduction: What is Interannual and Decadal Variability?
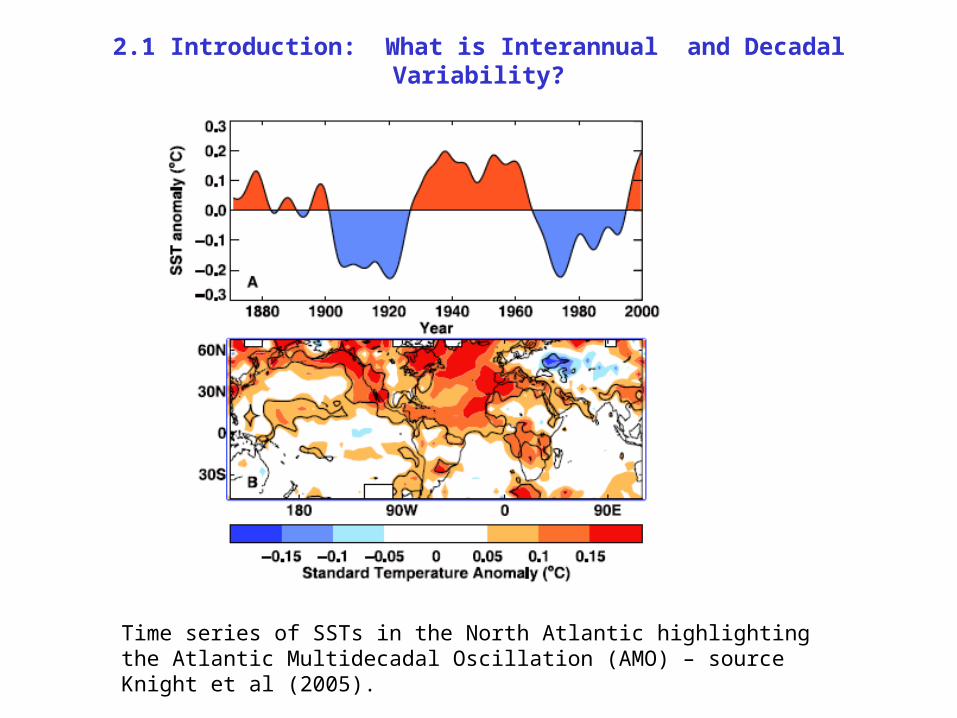
Time series of SSTs in the North Atlantic highlighting the Atlantic Multidecadal Oscillation (AMO) – source Knight et al (2005).
2.1 Introduction: What is Interannual and Decadal Variability?
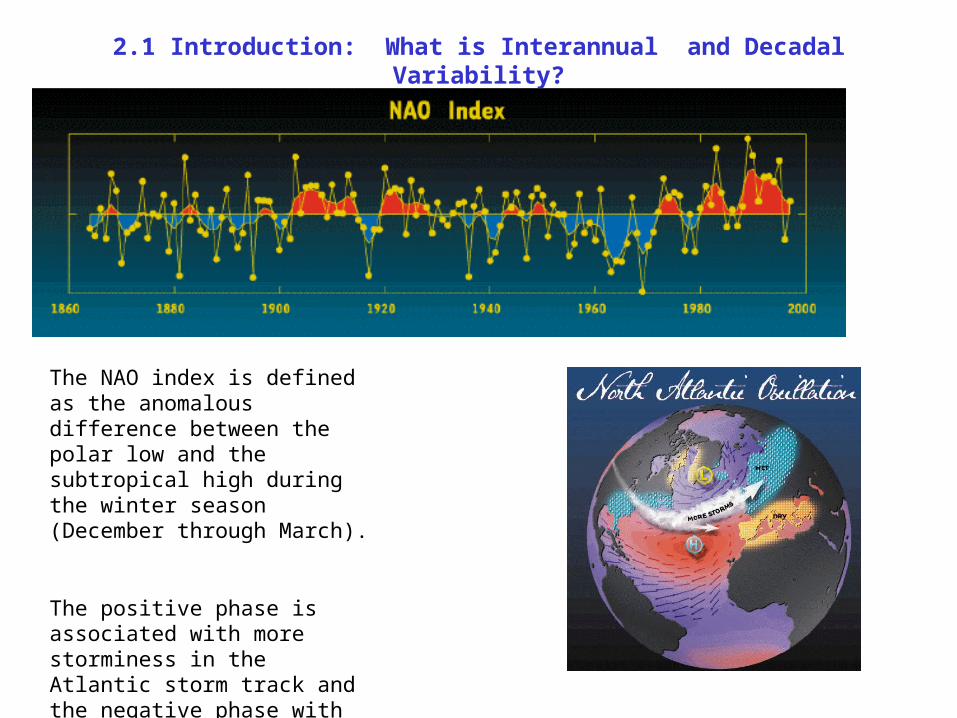
The NAO index is defined as the anomalous difference between the polar low and the subtropical high during the winter season (December through March).
The positive phase is associated with more storminess in the Atlantic storm track and the negative phase with reduced storminess.
2.1 Introduction: Why is Climate Variability important?
Interannual-to-Decadal Variability impacts Societies:
•Food resources
•Water security
•Health
•Demographics
• Energy
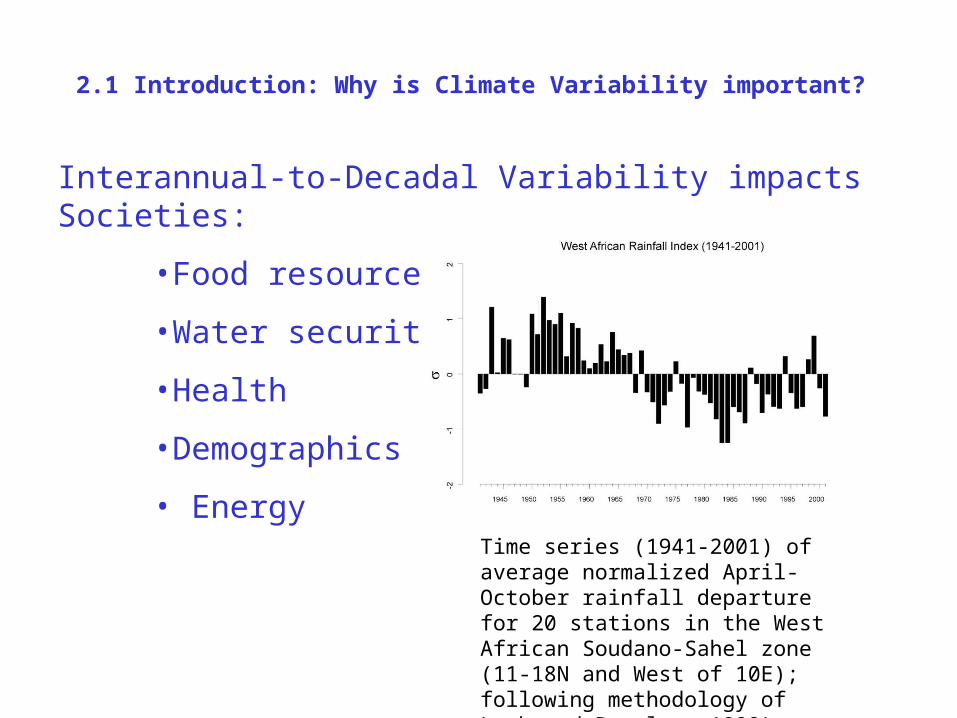
Time series (1941-2001) of average normalized April-October rainfall departure for 20 stations in the West African Soudano-Sahel zone (11-18N and West of 10E); following methodology of Lamb and Peppler, 1992).

2.1 Introduction: Can we predict SI Variability?

Section 2.2 Interannual Variability
2.2.1 El Nino Southern Oscillation (ENSO)
(i) Observations(ii) Theory for ENSO(iii) Impacts
2.2.2 Interannual variability in Atlantic SSTs
2.2.3 The North Atlantic Oscillation (NAO)

2.2.1 ENSO: Observations
• Philander, S.G.H, 1990: El Nino, La Nina and the Southern Oscillation
• Useful El Nino pages:
http://www.pmel.noaa.gov/tao/elnino/nino-home.html
http://www.gfdl.noaa.gov/~atw/enso

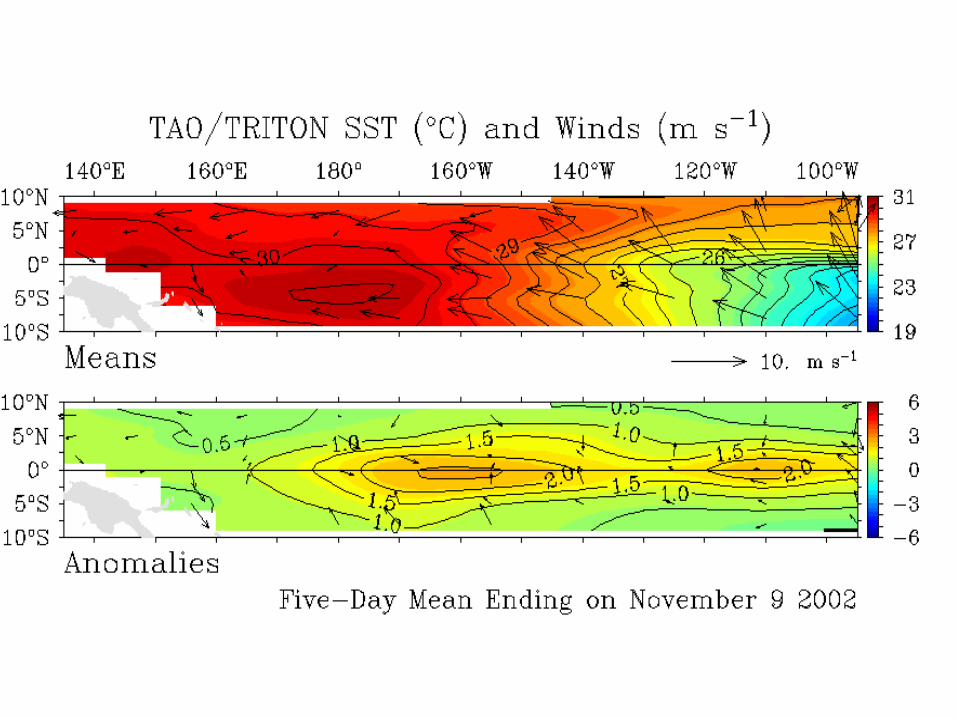
Mean State of the tropical Pacific coupled Ocean-Atmosphere System
• Warmest SSTs in west, “cold tongue” in east• Precipitation associated with warmest SSTs• Easterly trade winds advect equatorial surface
waters westward
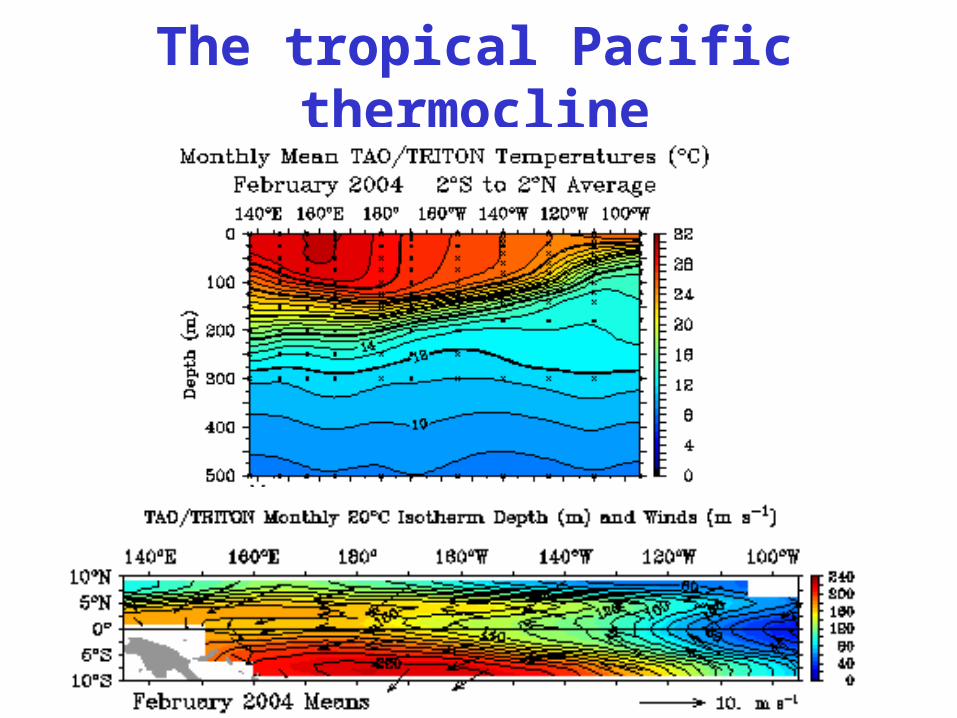
The tropical Pacific thermocline

The Walker Circulation
• Mean ascent, and low surface pressure, over warmest SST associated with deep convection
• Subsidence, and high surface pressure, in non-convecting regions
• Equatorial trades blow from high to low pressure (balanced by friction since Coriolis force =>0)
Low slp
High slp
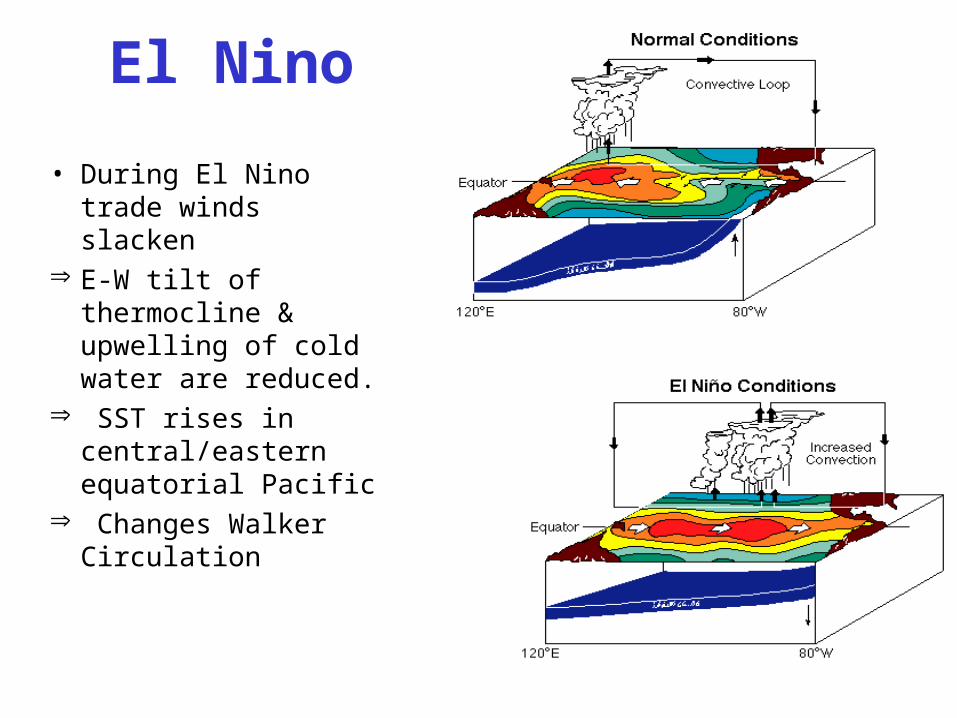
El Nino
• During El Nino trade winds slacken
E-W tilt of thermocline & upwelling of cold water are reduced.
SST rises in central/eastern equatorial Pacific
Changes Walker Circulation
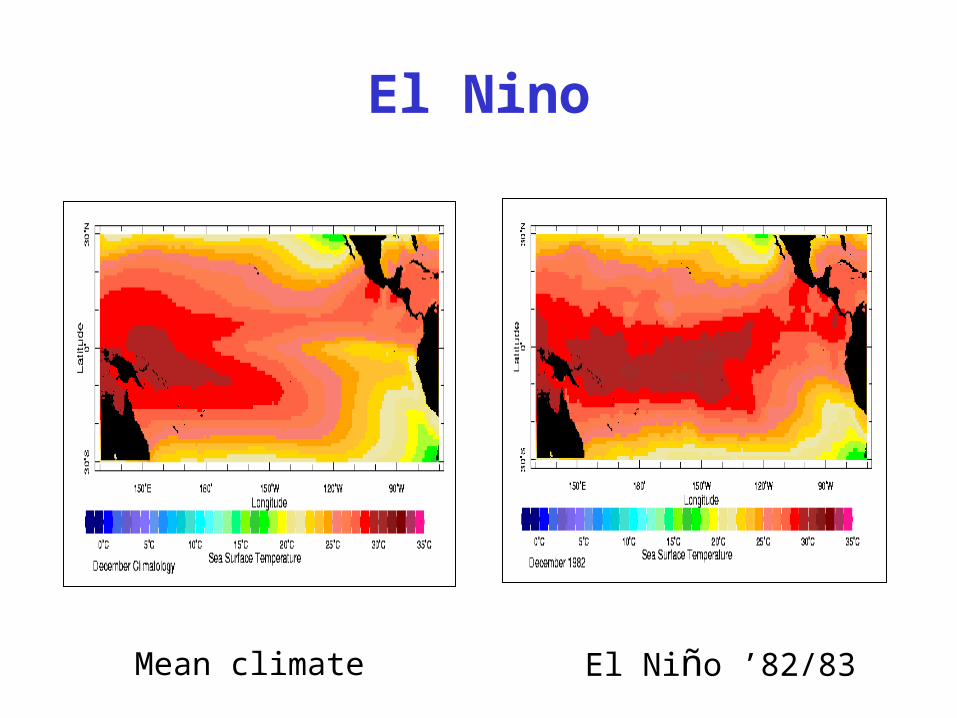
Mean climate El Niño ’82/83
El Nino

SST anomalies during El Nino
Dec 1982
Sept 1987

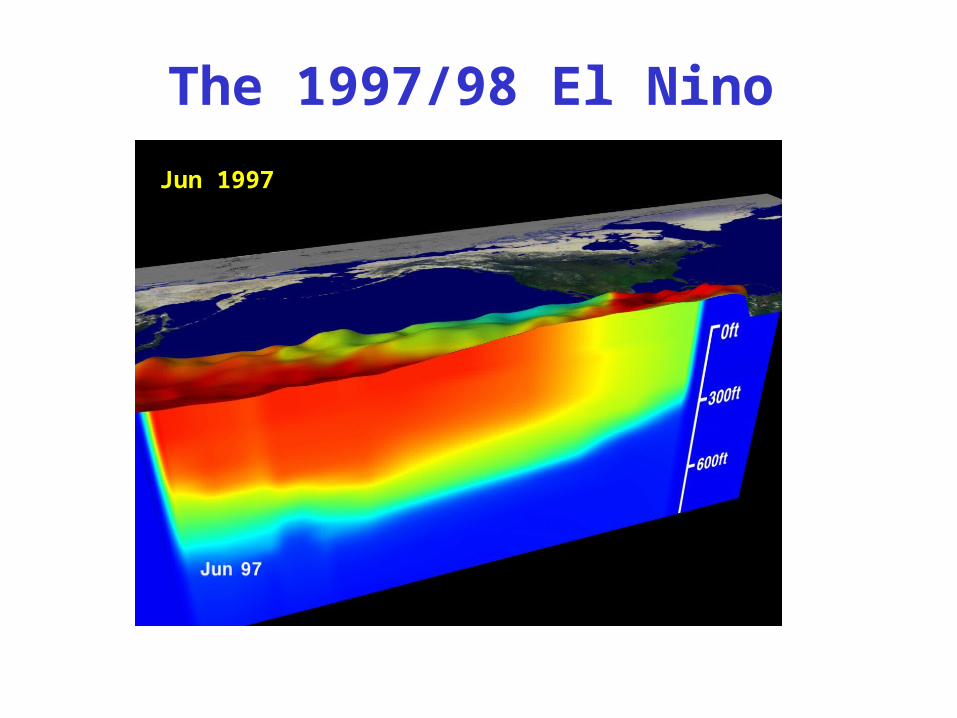
The 1997/98 El Nino
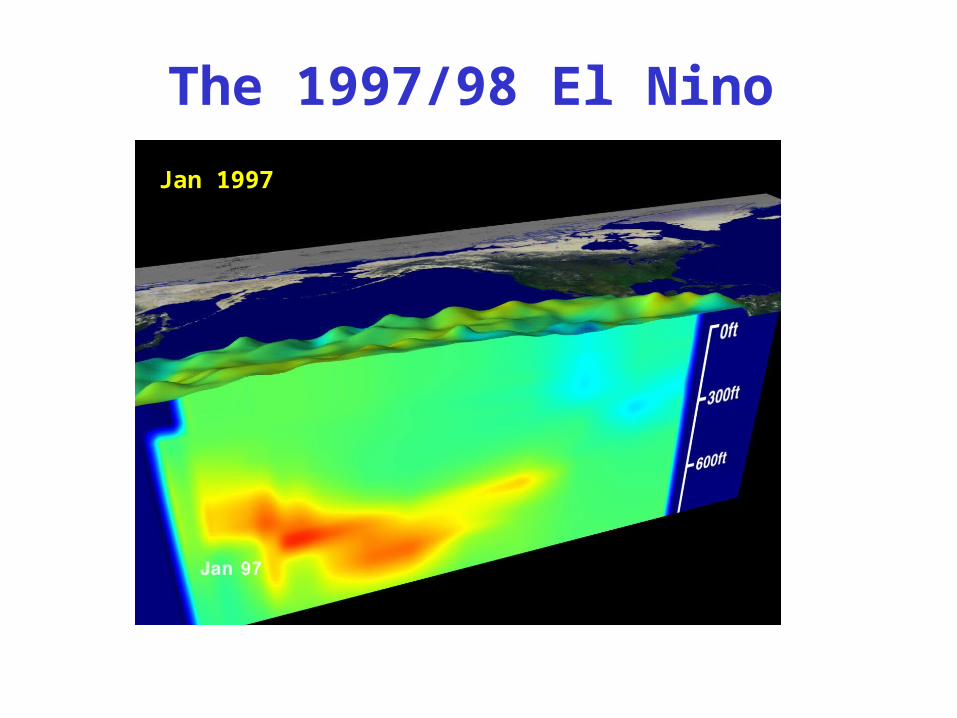
Jan 1997
The 1997/98 El Nino
Nov 1997Jun 1997
The 1997/98 El Nino
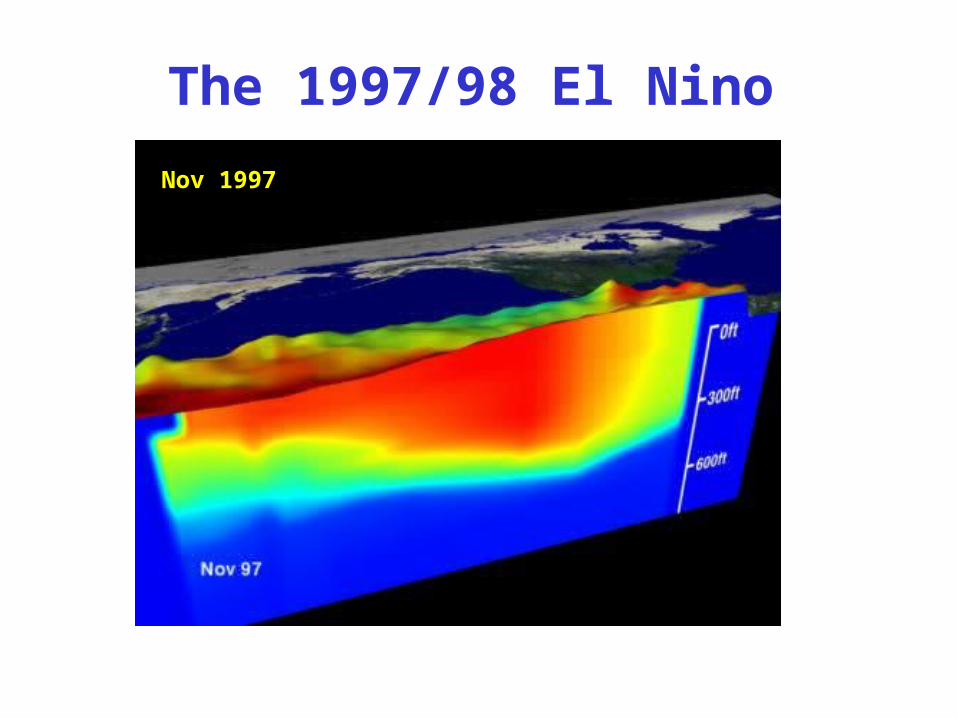
Nov 1997
The 1997/98 El Nino
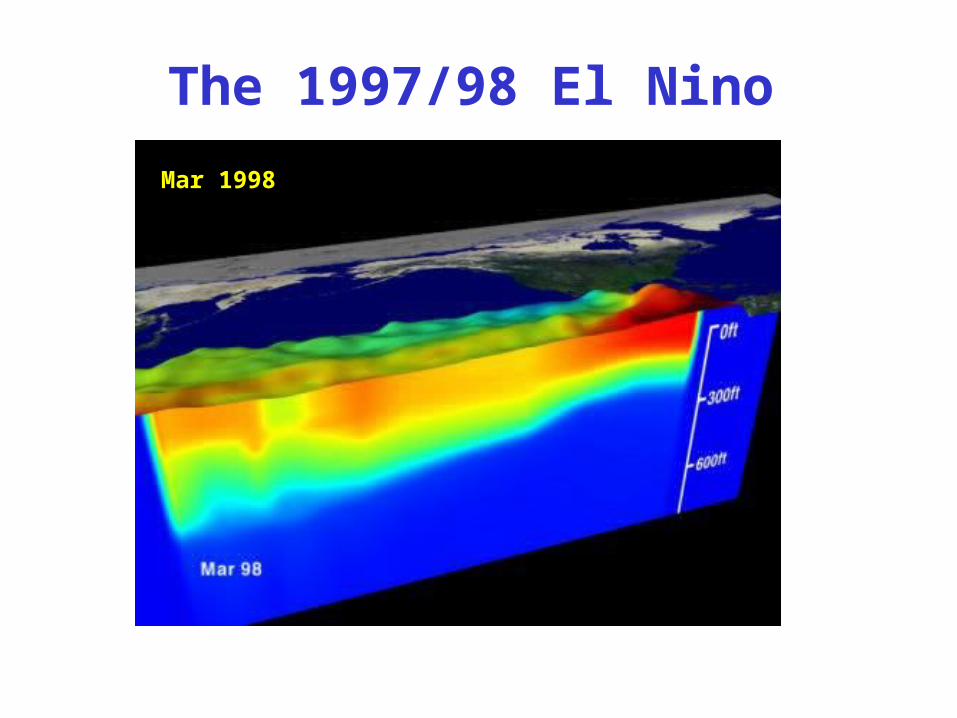
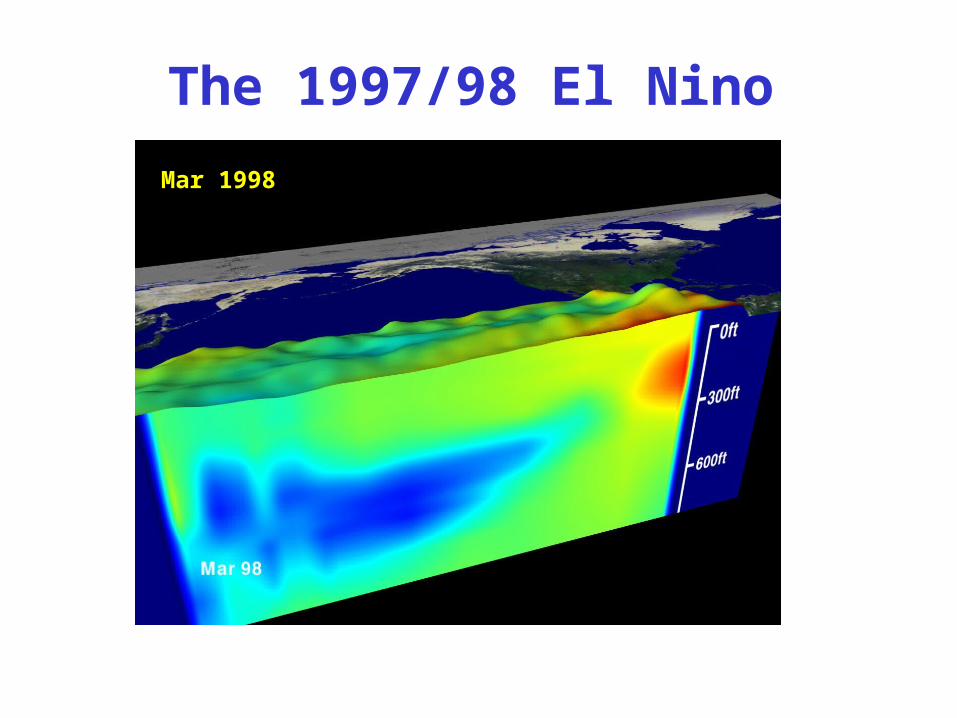
Mar 1998
The 1997/98 El Nino
Mar 1998Jan 1997

The 1997/98 El Nino
Jun 1997

The 1997/98 El Nino
Nov 1997
The 1997/98 El Nino
Mar 1998

What about La Nina?
Dec 1982
Nov 1988
La Nina conditions sometimes occur in the year following an El Nino event (e.g. 1988 followed 1987 El Nino)
In La Nina conditions SST in the central and eastern equatorial Pacific is unusually cold & easterly trade winds are unusually strong
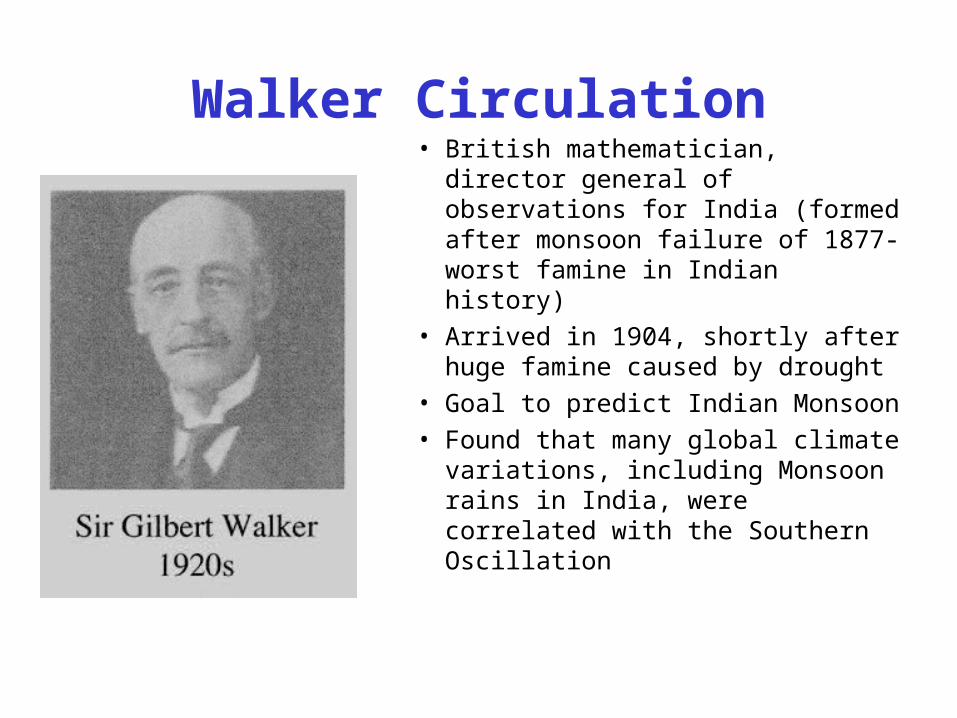
Walker Circulation• British mathematician, director
general of observations for India (formed after monsoon failure of 1877- worst famine in Indian history)
• Arrived in 1904, shortly after huge famine caused by drought
• Goal to predict Indian Monsoon• Found that many global climate
variations, including Monsoon rains in India, were correlated with the Southern Oscillation

Tahiti
Darwin
• Mean pressure is lower at Darwin than Tahiti• The term “Southern Oscillation” was also coined by Gilbert Walker• The SOI measures the strength of the Pacific Walker circulation
The Southern Oscillation Index
x

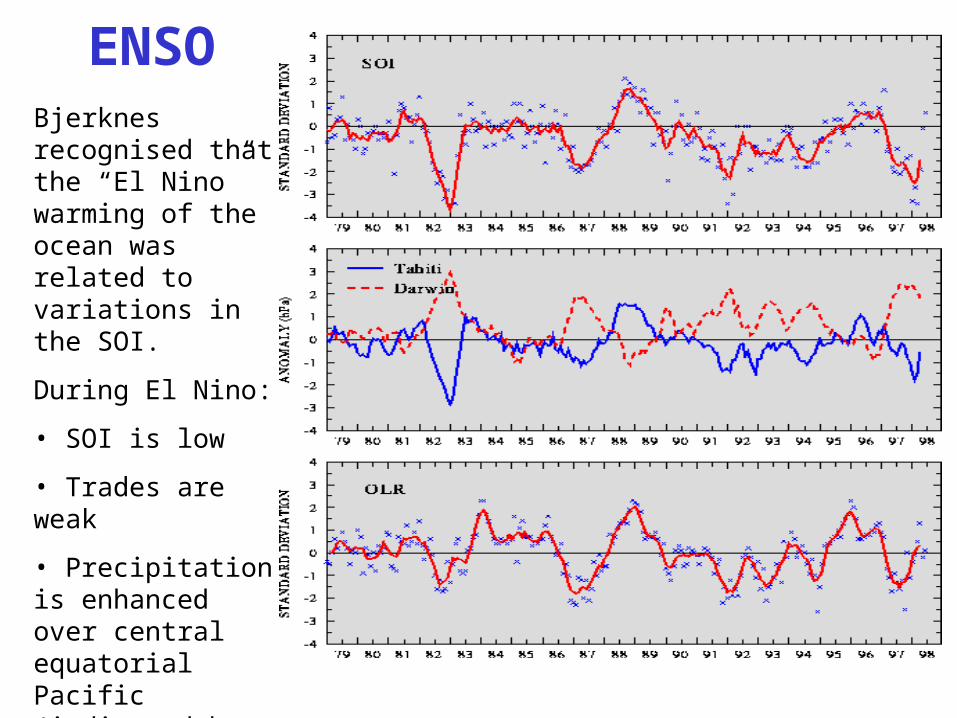
Bjerknes recognised that the “El Nino” warming of the ocean was related to variations in the SOI.
During El Nino:
• SOI is low
• Trades are weak
• Precipitation is enhanced over central equatorial Pacific (indicated by low OLR)
ENSO
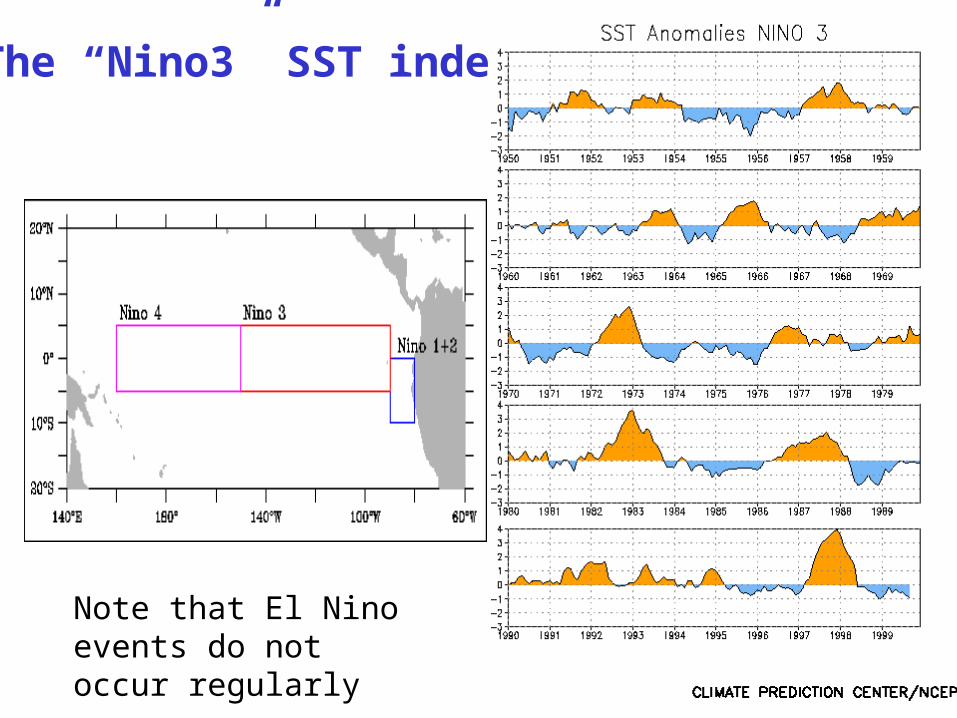
The “Nino3” SST index
Note that El Nino events do not occur regularly

Why is El Nino important?
• Major climate and economic impacts on countries around the tropical Pacific, and further afield.
• Droughts in some regions, floods in others• Collapse of coastal
fishery in Peru(largest average
annual catch of marine fish in
the world)

Impacts on global climate, ecosystems and society


Observing El Nino


TAO Data
TAO on Youtube:
https://www.youtube.com/watch?v=nzBAWirHMvA
Live TAO data:
http://www.pmel.noaa.gov/tao/jsdisplay/
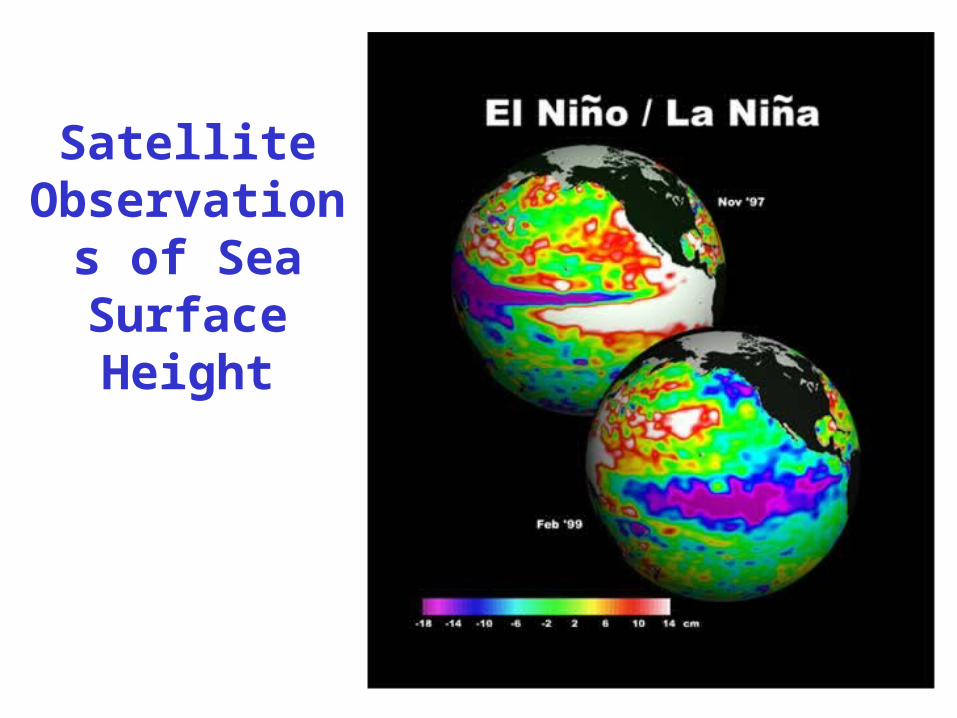
Satellite Observations
of Sea Surface Height

Chronology of Events in the History of Understanding El Niño and La Niña
late 1800s Fishermen coin the name El Niño to refer to the periodic warm waters that appear off the coasts of Peru and Ecuador around Christmas.
1928 Gilbert Walker describes the Southern Oscillation, the seesaw pattern of atmospheric pressure readings on the eastern and western sides of the Pacific Ocean.
1957 Large El Niño occurs and is tracked by scientists participating in the International Geophysical Year. Results reveal that El Niño affects not just the coasts of Peru and Ecuador but the entire Pacific Ocean.
1969 Jacob Bjerknes, of the University of California, Los Angeles, publishes a seminal paper that links the Southern Oscillation to El Niño.

1975 Klaus Wyrtki, of the University of Hawaii, tracks sea levels across the Pacific and establishes that an eastward flow of warm surface waters from the western Pacific causes sea surface temperatures to rise in the eastern Pacific.
1976 Researchers use an idealized computer model of the ocean to demonstrate that winds over the far western equatorial Pacific can cause sea surface temperature changes off Peru.

1982 A severe El Niño develops in an unexpected manner, but its evolution is recorded in detail with newly developed ocean buoys.
1985 Several nations launch the Tropical Ocean-Global Atmosphere (TOGA) program, a 10-year study of tropical oceans and the global atmosphere.
1986 Researchers design the first coupled model of ocean and atmosphere that accurately predicts an El Niño event in 1986.

1988 Researchers explain how the "memory" of the ocean--the lag between a change in the winds and the response of the ocean--influences terminations of El Niño and the onset of La Niña.
1996-1997 The array of instruments monitoring the Pacific, plus coupled ocean-atmosphere models, enable scientists to warn the public of an impending El Niño event.

Section 2.3 Interannual Variability
2.3.1 El Nino Southern Oscillation (ENSO)
(i) Observations(ii) Theory for ENSO(iii) Impacts
2.3.2 Interannual variability in Atlantic SSTs
2.3.3 The North Atlantic Oscillation (NAO)
Section 2.2.1 (ii) Theory of ENSO
The “Bjerknes Feedback”: A mechanism for growth of El Nino or La Nina
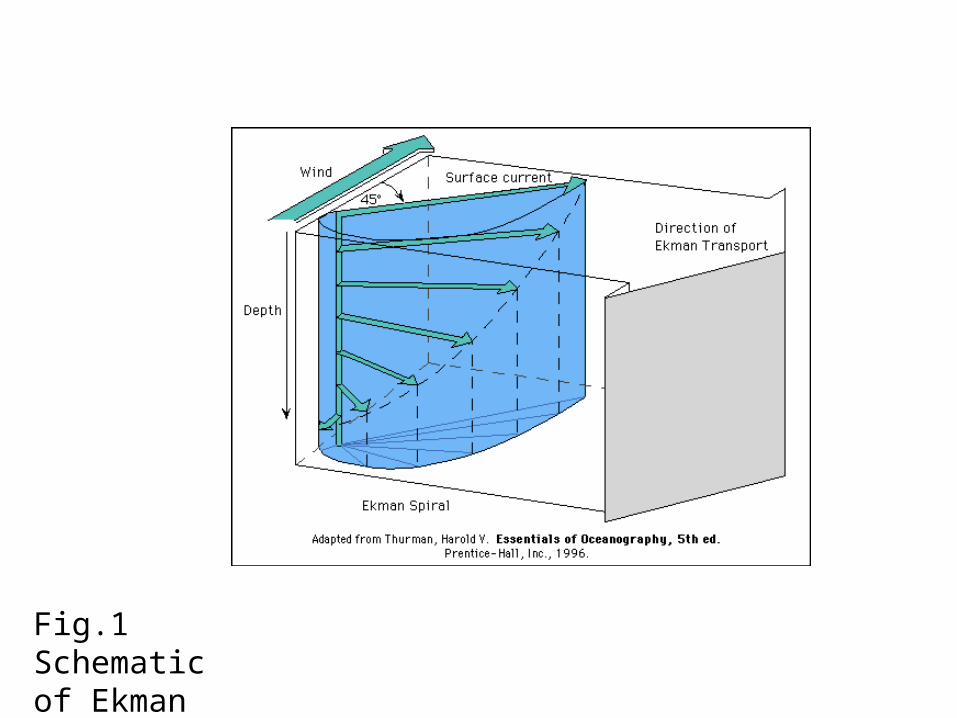
Fig.1 Schematic of Ekman Spiral in the Ocean
Spring 2013
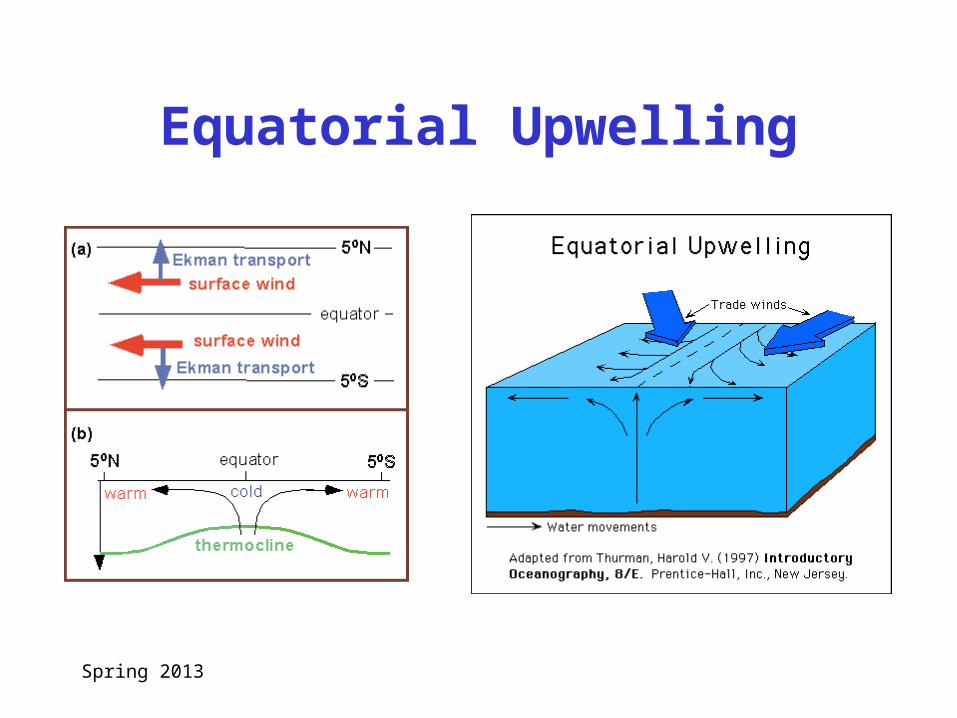
Equatorial Upwelling

Spring 2013
Coastal Upwelling
• Motion of surface waters away from coast requires upwelling of water from below to satisfy continuity of mass.
Andes Mts.
S. Pacific Ocean

Observed SST Distribution
Equatorial Upwelling
Coastal Upwelling
Winds have amajor influenceon tropical SSTpattern.
Spring 2013
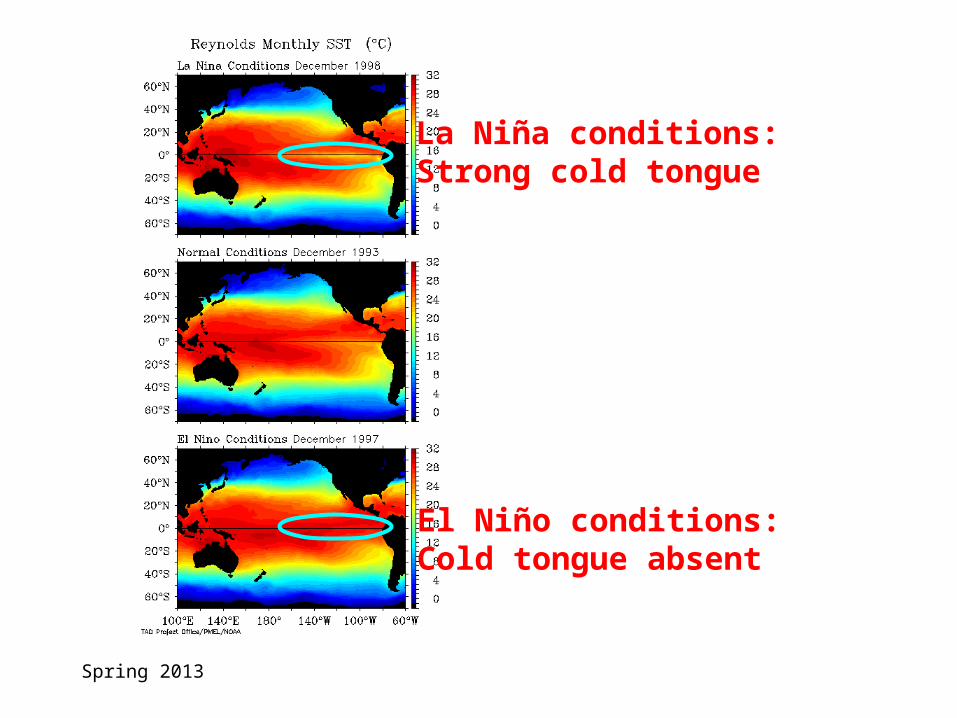
La Niña conditions:Strong cold tongue
El Niño conditions:Cold tongue absent

Upwelling linked to hurricanes
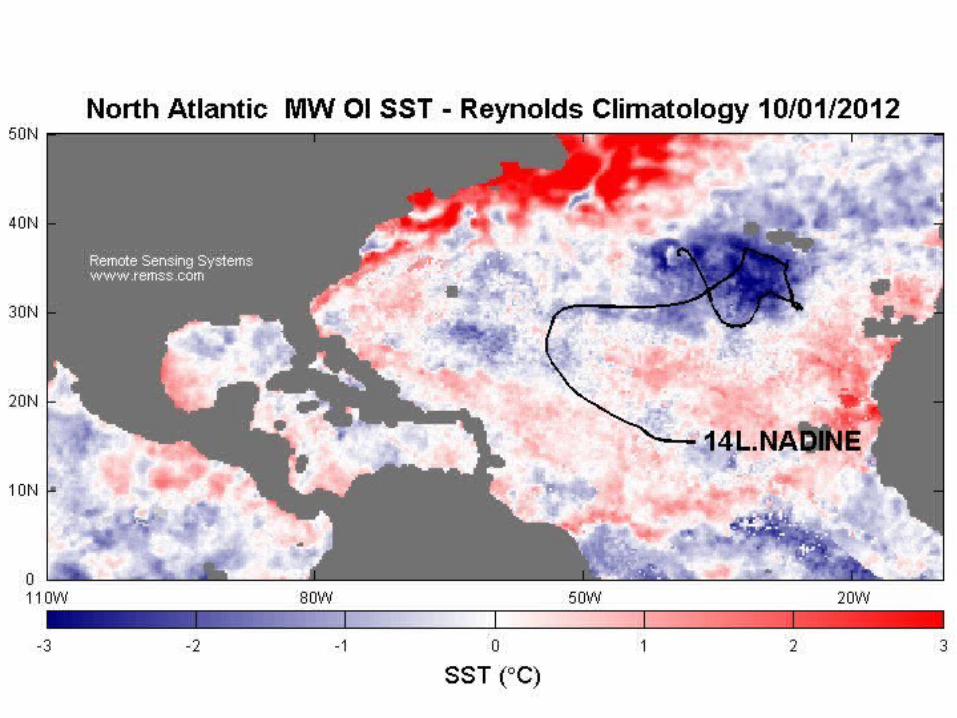

Fig.3 From S.-P. Xie (U Hawaii)

ENSO mechanism: the Bjerknes feedback
Fig.4

Bjerknes feedback - equatorial sections
ocea
n
longitude
atm
os
longitudeFig.5
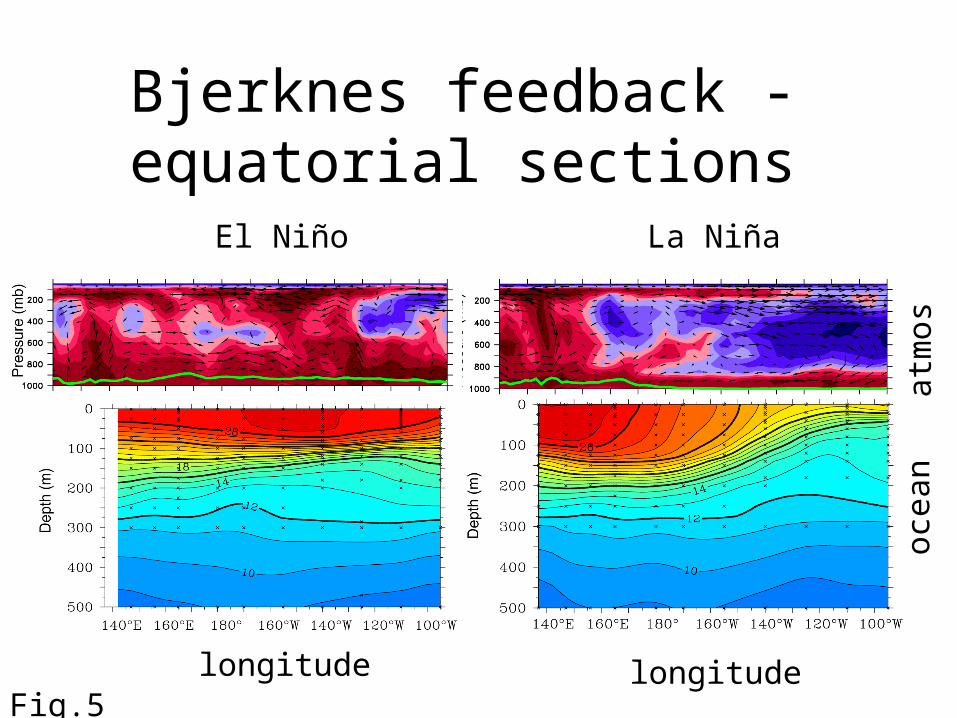
Bjerknes feedback - equatorial sections
El Niño
ocea
n
longitude
La Niña
atm
os
longitudeFig.5
Section 2.2.1 (ii) Theory of ENSO
The Delayed Oscillator
• How does the phase of ENSO reverse?
• What triggers an El Nino event?

Power Spectrum
•What determines the 4-year periodicity?

Recent History of El Niño and La Niña

Temporal Evolutionof El Niño/La Niña
Equatorial Waves
• Equatorial waves in the ocean are believed to play an important role in the onset and variability of ENSO
• Two types:– Kelvin waves (propagate eastward along the
equator and also along coasts)– Rossby waves (long waves propagate westward)
• The relevant waves are baroclinic: internal to the ocean, propagating along the density contrast of the thermocline
• Equatorial Kelvin waves travel 3 times faster than the fastest equatorial Rossby waves

How does the phase of ENSO reverse?
xBattisti and Hirst, 1989; Suarez and Schopf, 1988
Thermocline depth
Delayed Oscillator Theory
• Westerly winds force downwelling on Equator and upwelling to North and South
=> Excites Kelvin and Rossby waves
Figures from IRI: http://iri.columbia.edu/climate/ENSO/theory/

Delayed Oscillator Theory 2
25 days
100 days50 days
75 days
Upwelling Rossby waves
Downwelling Kelvin wave

Delayed Oscillator Theory 3
125 days
275 days175 days
225 days
Phase has reversed

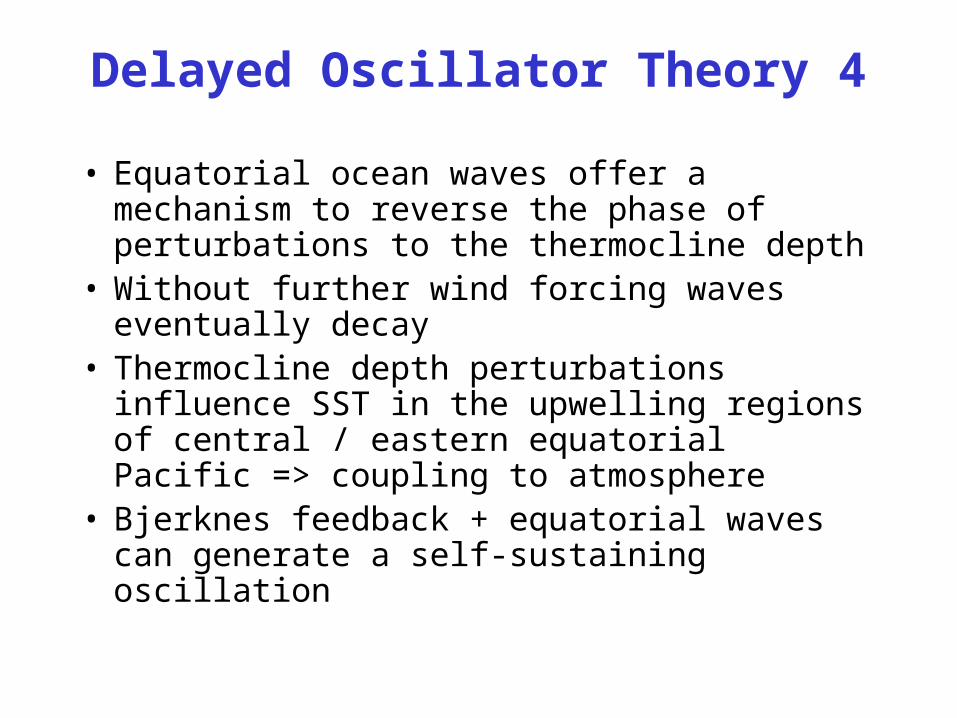
Delayed Oscillator Theory 4
• Equatorial ocean waves offer a mechanism to reverse the phase of perturbations to the thermocline depth
• Without further wind forcing waves eventually decay
• Thermocline depth perturbations influence SST in the upwelling regions of central / eastern equatorial Pacific => coupling to atmosphere
• Bjerknes feedback + equatorial waves can generate a self-sustaining oscillation
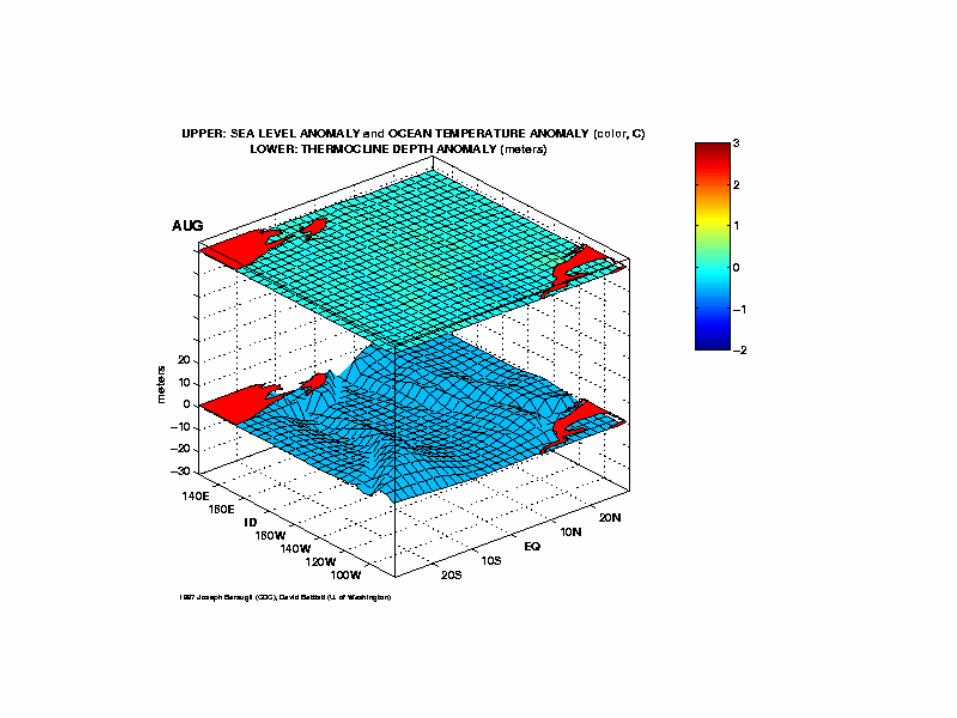

discharging
discharged
recharged
Recharge/Discharge theory (Jin, 1997)
•Prior to El Nino heat content in equatorial region builds up
•During El Nino heat is “discharged” eastward and polewards
Source: A. Timmermann

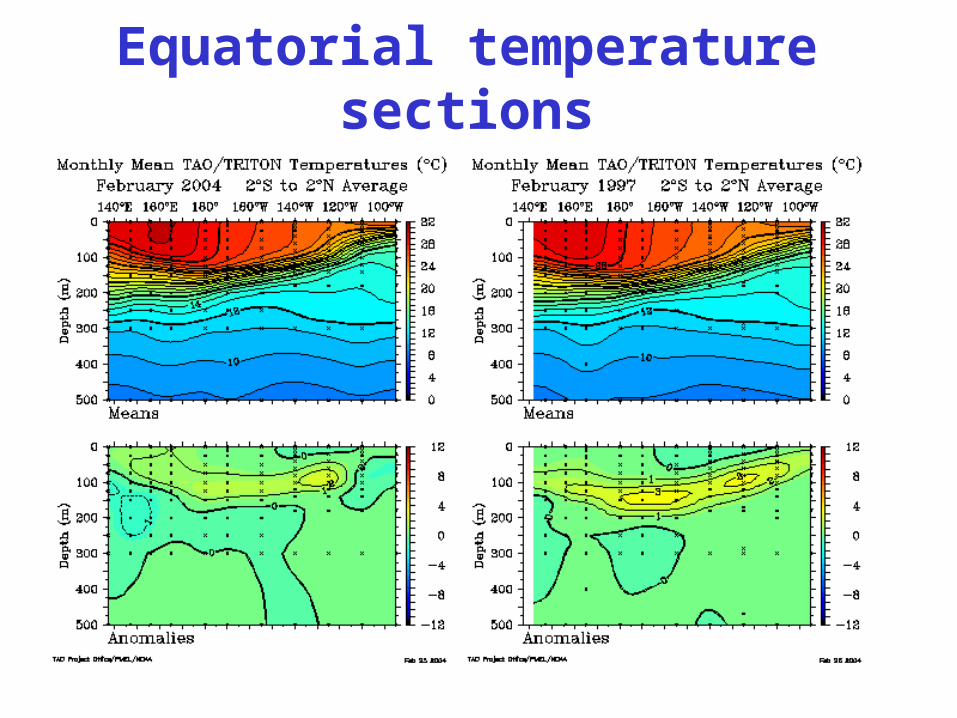
Equatorial temperature sections
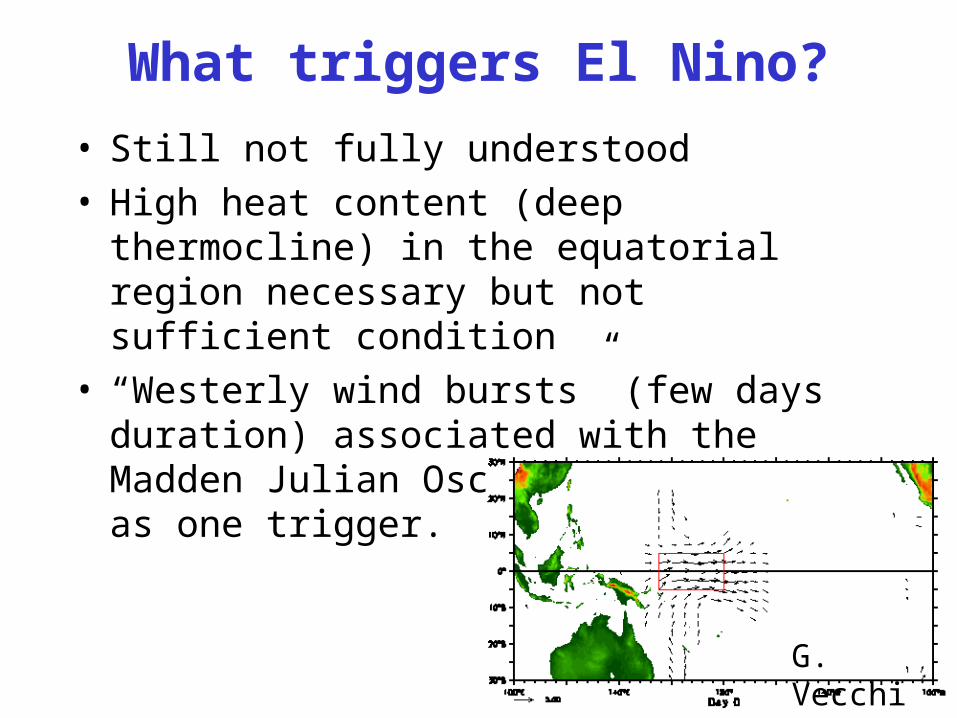
What triggers El Nino?
• Still not fully understood• High heat content (deep thermocline) in the
equatorial region necessary but not sufficient condition
• “Westerly wind bursts” (few days duration) associated with the Madden Julian Oscillation may act as one trigger.
G. Vecchi
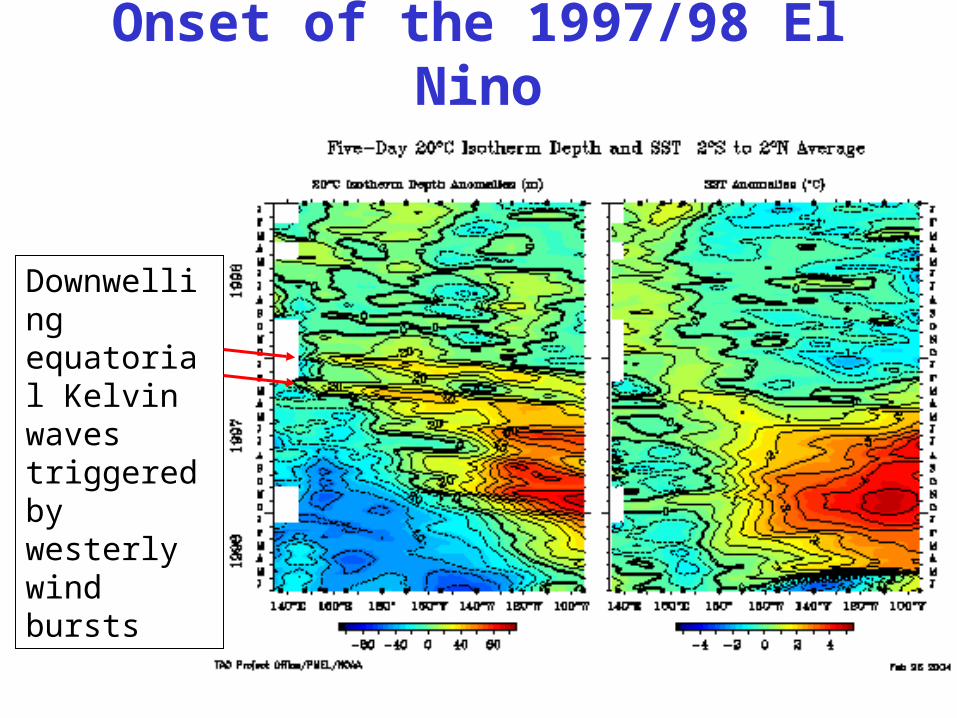
Onset of the 1997/98 El Nino
Downwelling equatorial Kelvin waves triggered by westerly wind bursts
Summary of El Nino onset
• Need high heat content in equatorial Pacific
• Triggering by wind fluctuations (e.g. WWBs) over central/western Pacific
• Growth through Bjerknes positive feedback mechanism

Theories for ENSO Oscillations• Delayed Oscillator (e.g. Battisti and
Hirst, 1989; Suarez and Schopf, 1988• Recharge/discharge theory (Jin,
1997)• Western Pacific Oscillator (e.g.
Weisberg, R. H., and C. Wang, 1997)• Advective-Reflective Oscillator (e.g.
Picaut et al, 1997)• Unified Oscillator (Wang, 2001 J Clim)

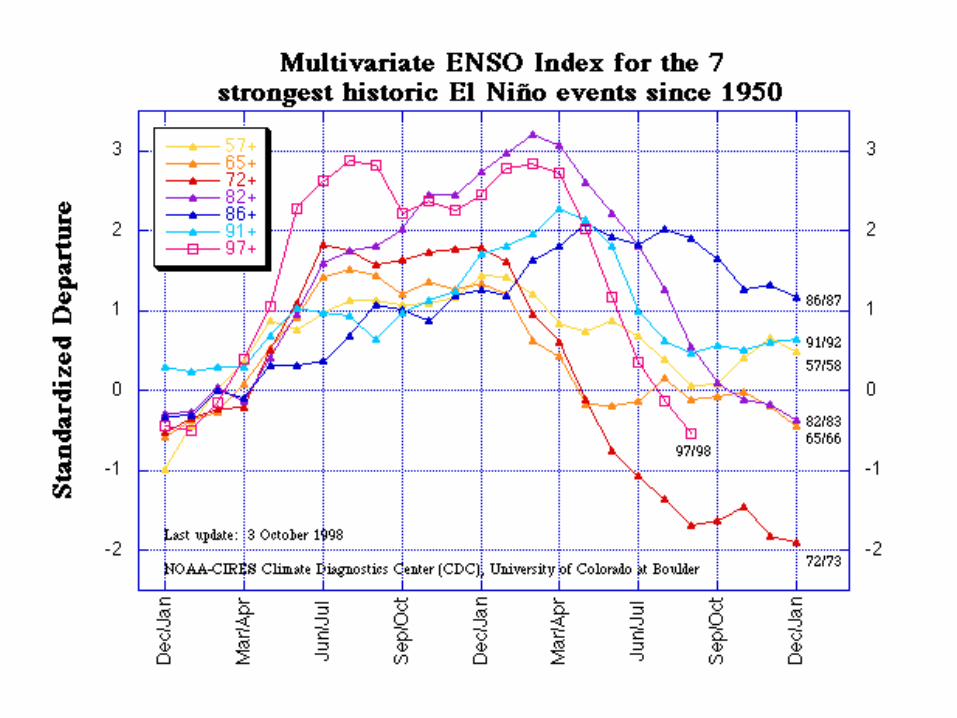
The 1997/98 ENSO event


Multivariate ENSO Index (upto October 3rd 2014)
http://www.esrl.noaa.gov/psd/people/klaus.wolter/MEI/
Index is based on 6 parameters relevant to phase of ENSO:
sea level pressure zonal and meridional wind at surfacesea surface temperature air temperaturecloudiness
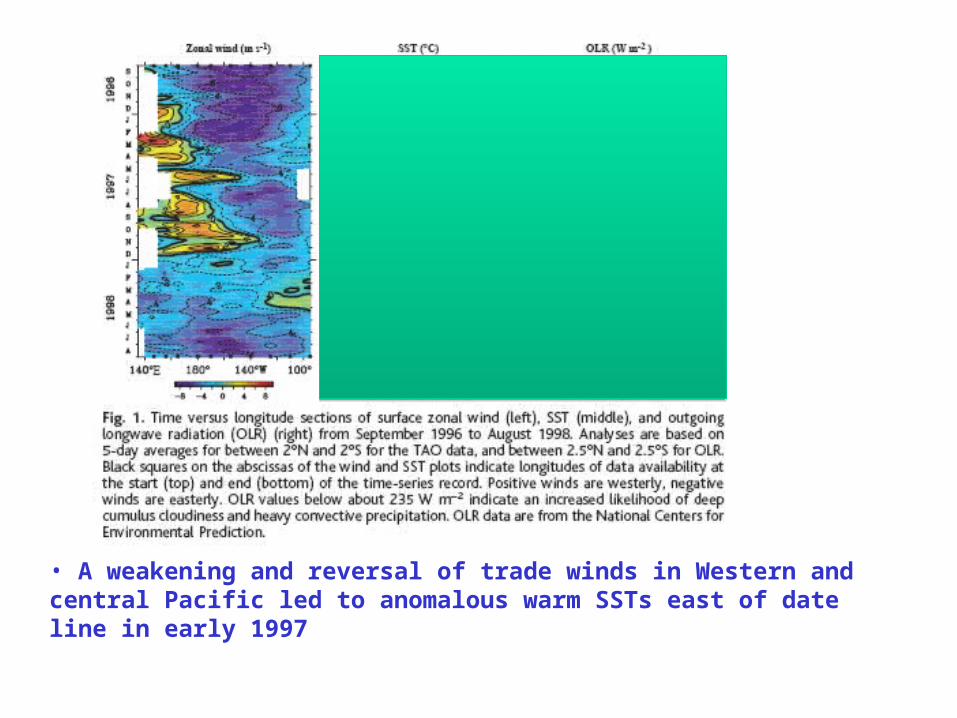
• A weakening and reversal of trade winds in Western and central Pacific led to anomalous warm SSTs east of date line in early 1997

• A weakening and reversal of trade winds in Western and central Pacific led to anomalous warm SSTs east of date line in early 1997
• Warm waters (> 29C migrated eastwards, collapse of cold tongue in east, which failed to develop.

• A weakening and reversal of trade winds in Western and central Pacific led to anomalous warm SSTs east of date line in early 1997
• Warm waters (> 29C migrated eastwards, collapse of cold tongue in east, which failed to develop.

• El Nino developed so rapidly that each month between June-Dec 1997 a new monthly record high was set for SSTs in eastern equatorial Pacific.

• Development of El Nino in equatorial Pacific was significantly modulated by higher frequency variability.
• Weakening and reversal of trades was punctuated by a number of westerly wind bursts of increasing intensity along the equator (linked to several MJOs)
• Ocean currents forced by these WWBs, advected warm water eastwards.
• Also, WWBs forced downwelling K-waves (thermocline depth decreased by 90m in eastern Pacific by end of 97) – opposite anomaly in western Pacific.

• Rossby waves excited by the initial weakening of the trades propagated westwards towards the west.
•Net result was a flattening of the thermocline and disapperance of “normal” east-west gradient across the equator, resulting in a weakening of the trades etc etc etc (Bjerknes Feedback).
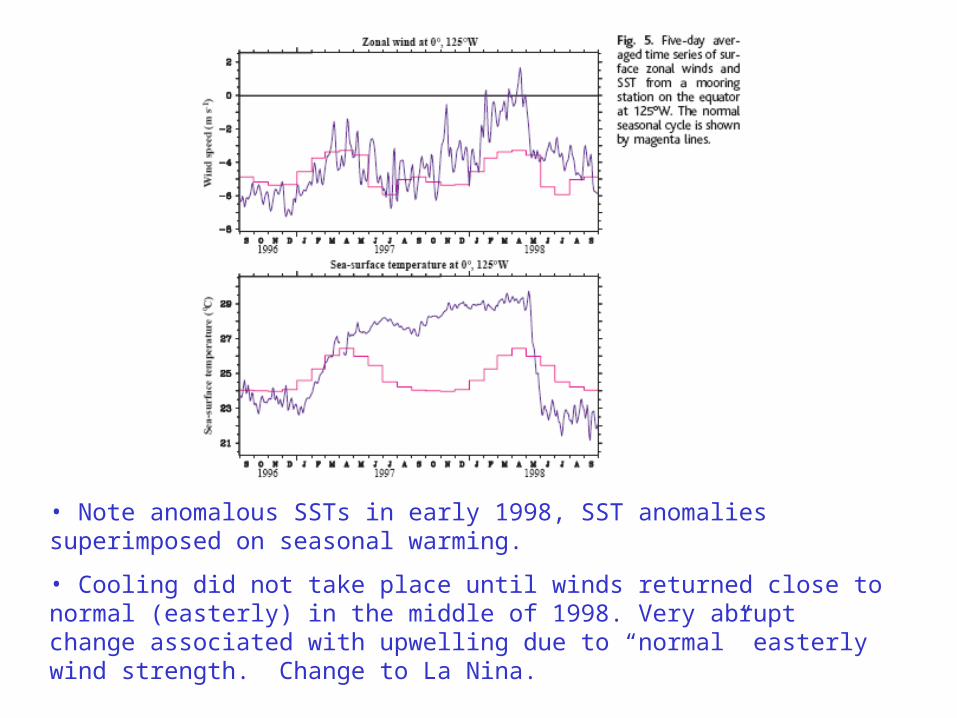
• Note anomalous SSTs in early 1998, SST anomalies superimposed on seasonal warming.
• Cooling did not take place until winds returned close to normal (easterly) in the middle of 1998. Very abrupt change associated with upwelling due to “normal” easterly wind strength. Change to La Nina.

• Note build up of heat content in Western Pacific at least a year before onset of the 97/98 El Nino – due to stronger than normal trade winds (linked to weak La Nina).
• Although these conditions helped to set the stage for the development of El Nino – the onset did not occur until the intensification of the MJO in late 1996.
Observed heat content anomalies (from 0 to 400m) averaged between 2N and 2S from the TAO array

The delayed oscillator theory and the 1997/98 El Nino
• Evolution of equatorial Pacific on interannual timescales is governed by interplay between large-scale equatorial wave processes and atmosphere-ocean feedbacks.
• The only downwelling Kelvin waves seen in 1997/98 were associated with a succession of MJOs.
• DO theory predicts demise of El Nino to be associated with reflected upwelling Rossby waves at the western boundary – which was seen to occur after the onset of the El Nino.
• In addition there was direct wind-forcing of upwelling Kelvin waves associated with appearance of easterly wind anomalies in the West Pacific in late 1997 early 1998; so the demise was likely associated with upwelling Kelvin waves due to two different processes.
Section 2.2 Interannual Variability
2.2.1 El Nino Southern Oscillation (ENSO)
(i) Observations(ii) Theory for ENSO(iii) Impacts
2.2.2 Interannual variability in Atlantic SSTs
2.2.3 The North Atlantic Oscillation (NAO)

2.2.1 El Nino Southern Oscillation (ENSO) (iii) Impacts

Questions
What are the impacts?
What are the causes of the impacts?
How does ENSO variability impact remote regions and why?

Different Ways of viewing Impacts
1. Schematic Overviews
2. Station Data Statistics
3. Gridded Data Statistics
4. Specific Events
Important to consider these as a function of season, location and variable.
Most common variables considered are T and PPN

Schematic Overviews


IRI impacts website:
http://iridl.ldeo.columbia.edu/maproom/ENSO/Impacts.html
NOAA impacts website:
http://www.pmel.noaa.gov/tao/elnino/impacts.html
Composite ENSO plots:
http://www.esrl.noaa.gov/psd/enso/enso.composite.html
Risk of extremes:
http://www.esrl.noaa.gov/psd/enso/climaterisks/
Statistics

Events
http://www.esrl.noaa.gov/psd/enso/enso.different.html

Mechanisms for Local Impacts
Teleconnections
Mechanisms for Remote Impacts
Mechanisms for remote impacts
• Latent heating associated with tropical precipitation anomalies excites waves in the atmosphere:– Atmospheric equatorial Kelvin and Rossby waves
propagate zonally. Associated subsidence warms troposphere and suppresses precipitation
– Rossby waves can also propagate into extratropics (especially in winter) causing large-scale circulation anomalies which impact weather. (Note that propagation requires a westerly mean flow and the relevant Rossby waves have an eastward group velocity)

Source: D. Neelin

Source: D. Neelin

Current ENSO Advisory:
http://www.cpc.noaa.gov/products/analysis_monitoring/enso_advisory/