research article seasonality, interannual variability, and...
TRANSCRIPT

Hindawi Publishing CorporationThe Scientific World JournalVolume 2013 Article ID 490857 10 pageshttpdxdoiorg1011552013490857
Research ArticleSeasonality Interannual Variability and Linear Tendency ofWind Speeds in the Northeast Brazil from 1986 to 2011
Alexandre Torres Silva dos Santos12 and Claacuteudio Moiseacutes Santos e Silva3
1 Program Post-Graduate in Climate Sciences Center of Exact Sciences Federal University of Rio Grande do NorteCampus Universitario sn 59072-970 Natal RN Brazil
2 Center for Gas Technology and Renewable Energy (CTGAS-ER) Avenida Capitao-Mor Gouveia 1480 Lagoa Nova59063-400 Natal RN Brazil
3 Department of Theoretical and Experimental Physics (DFTE) Federal University of Rio Grande do Norte (UFRN)Campus Universitario sn 59072-970 Natal RN Brazil
Correspondence should be addressed to Alexandre Torres Silva dos Santos atss santosyahoocombr
Received 12 July 2013 Accepted 4 September 2013
Academic Editors S Beguerıa G-C Fang and J Sun
Copyright copy 2013 A Torres Silva dos Santos and C M Santos e Silva This is an open access article distributed under the CreativeCommons Attribution License which permits unrestricted use distribution and reproduction in any medium provided theoriginal work is properly cited
Wind speed analyses are currently being employed in several fields especially in wind power generation In this study we usedwindspeed data from records of Universal Fuess anemographs at an altitude of 10m from 47 weather stations of the National Instituteof Meteorology (Instituto Nacional de Meteorologia-INMET) from January 1986 to December 2011 The objective of the study wasto investigate climatological aspects and wind speed trends To this end the following methods were used filling of missing datadescriptive statistical calculations boxplots cluster analysis and trend analysis using the Mann-Kendall statistical method Theseasonal variability of the average wind speeds of each group presented higher values for winter and spring and lower values inthe summer and fall The groups G1 G2 and G5 showed higher annual averages in the interannual variability of wind speedsThese observed peaks were attributed to the El Nino and La Nina events which change the behavior of global wind circulation andinfluence wind speeds over the region Trend analysis showed more significant negative values for the G3 G4 and G5 groups forall seasons of the year and in the annual average for the period under study
1 Introduction
Information on wind speeds near the surface is used toassist in projects in various fields such as in coastal erosionpollutant dispersion civil engineering and the constructionof wind farms for power generationThe growth of the worldeconomy increases the demand for energy and renewableenergy sources such aswindpower have proven to be a viablealternative that can be widely employed
Pereira et al [1] reported that the production of windenergy in Brazil grew from 22 MW in 2003 to 602 MW in2009 This can be attributed to incentive programs of thefederal government such as Incentive Program for Alter-native Sources of Electric Power (Programa de Incentivoas Fontes Alternativas de Energia Eletica-PROINFA) Theseauthors found that according to the projections of themodels
of the last report of the Intergovernmental Panel on ClimateChange (IPCC) scenarios A1 and B2 point to an increase inwind speeds exceeding 20 by 2100 in Northeastern Brazil(NEB) particularly in its northern and eastern parts
To identify the wind potential of a location it is necessaryto have a time series with observations of wind speeds ata suitable height In Brazil the regions with the greatestpotential are the coastlines of the South Atlantic especially inthe states of NEB where the trade winds from the southeast(SE) in the Southern Hemisphere are strong
Recent studies have emphasized that climate change mayaffect wind speed trends In China a decrease in wind speedshas been observed between 1956 and 2004 [2] but theseresults may be the result of urbanization which increasesfriction near the surface In Australia Troccoli et al [3]considered two different periods (1975ndash2006 and 1989ndash2006)
2 The Scientific World Journal
and observed a negative trend for wind speeds at 2m anda positive one for those at 10m from the surface Otherstudies have also dealt with the climatological aspects of windspeeds over the continent at 10m from the surface employingstatistical analyses such as the clustering method to identifyhomogeneous areas and long-term aspects of changes inwindspeed [4ndash8]
Wind speed data obtained from meteorological stationsor through numerical modeling has been used in differentparts of the globe to identify the characteristics of seasonaland interannual variabilities [9ndash12] As an explanation of thevariability of wind speed results presented in this study thestudy of Troccoli et al [3] points to the following associatedconditions (i) the steep relief and aerodynamic roughness ofthe terrain (ii) the presence of orography causing thermalstability (iii) the overlap of atmospheric circulation on dif-ferent spatial scales (global synoptic mesoscale and micromesoescala) which influences the seasonal and interannualvariabilities of the wind regime
Some recent studies on wind speeds have revealed theirimportance for wind energy which is also affected by climatechange as can be seen from the significant negative trendsSome examples are the studies by McVicar et al [6] for theentire globe and by Cradden et al [13] for the UK
It is known that NEB is a region with high wind potentialThe studies that support this statement however have beenrealized with short data series that is less than 10 yearsThere are no studies on NEB with series of observationaldata exceeding 20 years that investigate climatological aspectsand wind speed trends neither are there studies on trendsin recent years Therefore the objective of this paper is toinvestigate the climatological aspects and wind speed trendsin NEB for a period of 26 years in 47 weather stationsWe hope that the results presented here may contribute tothe (scientific and political) discussion on the generation ofrenewable energy in Brazil
2 Materials and Methods
21 Area of Study The NEB region is situated at the eastern-most end of South America bathed in the north and eastby the Atlantic Ocean It is located in the NEB between thegeographical coordinates 1∘021015840 to 18∘201015840 south and 34∘201015840to 48∘301015840 west It covers an area of 15611778 km2 whichrepresents 183 of the Brazilian territory Its populationis 53081950 hab divided over nine states Alagoas (AL)Bahia (BA) Ceara (CE) Maranhao (MA) Paraıba (PB)Pernambuco (PE) Piauı (PI) Rio Grande doNorte (RN) andSergipe (SE)
Rainfall in NEB is irregular varying in both spatialand temporal distribution The rainy season is concentratedbetween January and June and the dry season stretches fromJuly to December [14] The climatological annual average is1800mm at the coast (coastal area) and below 400mm inthe central area (semiarid) [15] According to the INMETthe average annual temperature in NEB varies from 207∘Cto 274∘C The maximum and minimum temperatures reach
338∘C and 168∘C respectively The annual average windspeed measured at 10m varies from 05 to 55ms
22 Data The wind speed data used were recorded byFuess anemographs universal model AH-100 installed at10m above the surface and managed by the INMET Thisequipment is intended to record the direction of the windby a vane or arrow (pointing to the spot whence the wind)and wind speed throughout the day with the three shells(httpwwwinmetgovbr) The original set consisted of 92anemographs however an inventory of each anemographwas made using the number of missing observations eachyear as an objective criterion If the missing data valuesexceeded 15 of the total number of observations the dataof these anemographs was discarded which reduced the setto 47 weather stations The 1200 UTC was established as thetime of observation and the date was collected in the periodfrom 1986 to 2011 The spatial distribution of the 47 stationsused in this study is shown in Figure 1
23 Filling in of Missing Data We used the method ofMultivariate Imputation by Chained Equations (MICE) to fillin themissing data According to Van Buuren andGroothuis-Oudshoorn [16] the MICE technique can be used in variousresearch areas such as healthcare politics psychology andsociology or any other field of science that deals withmissingdata in their time series The Predictive Mean Matching(PMM) was used to compensate for these missing data usingthe data from the four geographically closest meteorologicalstations [17]
24 Cluster Analysis Cluster analysis is an exploratorytechnique for multivariate data analysis that enables theclassification of a set of observations into classes according totheir similarities [5] Cluster analysis was applied to the windspeed data for the period under study using Wardrsquos hierar-chical classificationmethod For similarity or dissimilarity weused the Euclidean distance method The Euclidean distancemethod is being increasingly used to identify homogeneousregions for wind speeds recorded at meteorological stationsin various parts of the world [18ndash21]
By applying cluster analysis we were able to identify 5homogeneous groups according to the monthly averages ofthe historical time series (1986ndash2011) Figure 2(a) shows thedendrogram for the time series of monthly average windspeeds It shows the connection of the locations with similarregimes As can be seen in Figure 2(b) the geographicaldistance of the analyzed locations does not guarantee that thewind speed regimes are similar in data
In some cases weather stations are clustered in the samegroup even when they are in different regions of NEB Theweather stations of Salvador (BA) and Balsas (MA) are classi-fied asG3 but they are separated by 1023 km in a straight lineIt is important to emphasize that the meteorological stationin Salvador (BA) is located in the coastal area of NEB in theState of Bahia Its rainfall climatology is totally different fromthe weather station in Balsas (MA) which is located in thesouth of the state of Maranhao (Northern NEB)
The Scientific World Journal 3
minus1
minus2
minus4
minus5
minus6
minus7
minus8
minus9
minus10
minus11
minus12
minus13
minus14
minus15
minus16
minus17
minus18
minus19
minus32
minus33
minus34
minus35
minus36
minus37
minus38
minus39
minus40
minus41
minus42
minus43
minus44
minus45
minus46
minus47
minus48
minus49
minus50
1200
1100
1000
900
800
700
600
500
400
300
200
100
0
Topography (m)
Longitude (
∘)
Latit
ude(
∘
)
Meteorological
N
EW
Sminus3
station
NNNNNNNNNNN
EE
S
WWWWWWWWWWWWWWW
Figure 1 Spatial distribution of meteorological stations used in the study superimposed on the topography of NEB
25 Seasonal and Interannual Variabilities There are severalways to study a one-dimensional data set In this study weapplied the statistical boxplot technique described by Wilks[22] to establish the seasonal and interannual variabilitiesof wind speeds in the selected groups This methodologyincludes information on estimated values their location(mean or median) scale (interquartile range) and asym-metry (difference between quartile and median) Anomalycomputation of intensity variations above or below theannual average wind speeds showed that the El Nino and LaNina events influence large-scale circulations increasing ordecreasing the intensity of winds over NEB
26 Mann-Kendall Test The nonparametric Mann-Kendalltest has been suggested by the World Meteorological Orga-nization (WMO) to assess the data trends in time series ofenvironmental variables [23] This test consists of comparingeach value of the time series with the other values remainingin the sequential order This test is based on the statisticalterm 119878 defined as follows
119878 =
119899
sum
119894=2
119894minus1
sum
119895=1
sign (119909119894minus 119909119895) (1)
where 119909119895are the values of the sequential data point 119899 is the
length of the time series sign(119909119894minus 119909119895) is minus1 for (119909
119894minus 119909119895) lt 0
0 for (119909119894minus 119909119895) = 0 and 1 for (119909
119894minus 119909119895) gt 0 The mean 119864[119878] and
the variance 119881[119878] are calculated according to the followingequations
119864 [119878] = 0
VAR (119878) = 118[119899 (119899 minus 1) (2119899 + 5)
minus
119902
sum
119901=1
119905119901(119905119901minus 1) (2119905
119901+ 5)]
(2)
where 119905119901is the number of connections to the 119901th value and
119902 is the number of connected groups The values for 119878 andVAR(119878) are used to calculate the standardized 119885 test statisticas follows
119885 =
119878 minus 1
radicVAR (119878)if 119878 gt 0
0 if 119878 = 0119878 + 1
radicVAR (119878)if 119878 lt 0
(3)
The presence of a statistically significant trend is analyzedusing the value of 119885 A positive 119885 value indicates a positivetrend while a negative 119885 value points to a negative trendTo test the level of significance 120572 of the trend increase ordecrease the 119867
0(null hypothesis) is rejected if the absolute
value of 119885 is greater than 1198851minus1205722
where 1198851minus1205722
is obtainedfrom the cumulative standard normal distribution tables [24]In our case the levels of the significance test 120572 are 0001 001005 and 01
3 Results
The mean median maximum minimum and standarddeviations in the time series separated by the groups selected
4 The Scientific World Journal
Clus
ter m
ergi
ng d
istan
ce
0
50
100
150
200
250
300
Meteorological station
Turia
cu-M
AIg
uatu
-CE
Fort
alez
a-CE
Mor
ada N
ova-
CEPo
rto
de P
edra
s-A
LJa
guar
uana
-CE
Cam
pina
Gra
nde-
PBPa
tos-
PBCr
uzet
a-RN
Nat
al-R
NIr
ece-
BAA
gua B
ranc
a-A
LG
uara
mira
nga-
CEM
orro
do
Chap
eu-B
ABo
m Je
sus d
o Pi
aui-P
IBa
rrei
ras-
BAIm
pera
triz
-MA
Bom
Jesu
s da L
apa-
BALe
ncoi
s-BA
Caro
lina-
MA
Barr
a do
Cor
da-M
ABa
lsas-
MA
Alto
Par
naib
a-M
ASa
lvad
or-B
ACa
navi
eira
s-BA
Ala
goin
has-
BABa
rra-
BAEs
pera
ntin
a-PI
Ibip
etub
a-BA
Baca
bal-M
AZe
Doc
a-M
ABa
rbal
ha-C
ECa
xias
-MA
Rem
anso
-BA
Carin
hanh
a-BA
Itiru
cu-B
AM
onte
San
to-b
aPa
ulo
Afo
nso-
BACi
po-B
AVi
toria
da C
onqu
ista-
BAPa
lmei
ra d
os In
dios
-AL
Ara
caju
-SE
Itaba
iani
nha-
SECa
rave
las-
BAPr
opria
-SE
Chap
adin
ha-M
ARe
cife
-PE
(a)
40
36
32
28
20
16
12
Wind speed (ms)
Group
minus1
minus2
minus4
minus5
minus6
minus7
minus8
minus9
minus10
minus11
minus12
minus13
minus14
minus15
minus16
minus17
minus18
Latit
ude(
∘
)
minus3
minus33
minus34
minus35
minus36
minus37
minus38
minus39
minus40
minus41
minus42
minus43
minus44
minus45
minus46
minus47
minus48
minus49
minus50
Longitude (
∘)
24
(b)
Figure 2 Formation of homogeneous groups for historical average wind speeds (a) (b) spatial distribution of the groups across NEB
in the cluster analysis are shown in Table 1 The averagewind speed is highest in the G1 (337ms) G2 (114ms)and G5 (283ms) groups and lowest in the G3 (135ms)and G4 (214ms) groups The minimum speed varies from030ms for groupG4 to 129ms for G2 while themaximumranges from 365ms for G3 to 771ms for G2The variability(indicated by the standard deviation) is highest for G1(097ms) and lowest for G3 (055ms)
31 Seasonal Variability In Figures 3(a)ndash3(e) the boxplotsfor the selected groups are traced The boxplots for thehistorical average wind speeds for each season of the yearsuggest the presence of some apparently atypical values(outliers represented by the symbol ∘) especially in winter(Figure 3(c)) for the G1 and G2 groups In Figures 3(a)ndash3(d)we can observe that winter (June July and August-JJA) andspring (September October and November-SON) produce
The Scientific World Journal 5
Win
d sp
eed
(ms
)
0
1
2
3
4
5
G1 G2 G3 G4 G5
Group
(a)
Win
d sp
eed
(ms
)0
1
2
3
4
5
G1 G2 G3 G4 G5
Group
(b)
Win
d sp
eed
(ms
)
0
1
2
3
4
5
G1 G2 G3 G4 G5
Group
(c)
Win
d sp
eed
(ms
)
0
1
2
3
4
5
G1 G2 G3 G4 G5
Group
(d)
Win
d sp
eed
(ms
)
0
1
2
3
4
5
G1 G2 G3 G4 G5
Group
(e)
Figure 3 Boxplot showing the variability of the seasonal average wind speed of the groups (a) summer (b) autumn (c) winter (d) springand (e) the historical annual wind speed average
Table 1 Descriptive statistical analysis for each group of the time series
Group Period Minimum (ms) Maximum (ms) Median (ms) Mean (ms) Standard deviation (ms)G1 1986ndash2011 060 589 347 337 097G2 1986ndash2011 129 771 407 411 084G3 1986ndash2011 010 365 127 135 055G4 1986ndash2011 030 450 206 214 064G5 1986ndash2011 117 663 278 283 072
the highest wind speed values for the selected groups G5presents a highermedian in spring with 33ms (Figure 3(d))while in other seasons this value ranges between 250 and286ms
The highest median values were observed in the G1 andG2 groups during winter and spring while the lowest valuesoccurred in groups G3 and G4 during summer and autumn(March April and May-MAM) According to the boxplotsvalues presented in Figures 3(a) and 3(b) groups G3 and
G4 have less variability in wind speed for each seasonaltransition
The variability of the average annual wind speeds of thegroups for the period 1986ndash2011 is presented in the bloxplotof Figure 3(e) The largest variability around the median ispresented by group G5 and the highest median values areobserved in the groups G1 G2 and G5 (Figure 3(e)) Thelowest variability is presented by groups G3 and G4 with amedian equal to 127 and 26ms respectively
6 The Scientific World Journal
Group G2 which has meteorological stations located onthe east coast and semiarid region of NEB registers highermedians than the other groups (Figures 3(a)ndash3(e)) This isthe region that is most influenced by trade winds associatedwith the South Atlantic High and the sea breeze G2 standsout in the comparison with other groups for all seasons withwinds averaging between 40 and 50ms Another factorcontributing to the high wind speed values in the G2 groupis the topographic elevation of the semiarid region in NEBwhich is defined by high plateaus
The monthly cycle of the groups is shown in Figure 4Theminimumwind intensity values occur during themonthscorresponding with the rainy season in the NEB region fromFebruary to May and the maximum values occur in themonths of August to October
32 Interannual Variability The interannual analysis showsthat the groups present higher values in the dry seasons(winter and spring) than in the rainy seasons (summer andfall) as can be seen in Figures 5(a)ndash5(e) The wind intensityof groups G1 and G2 is also influenced by the IntertropicalConvergence Zone (ITCZ) localization In August (winter)and September (spring) the land-ocean thermal gradientswiden as the ITCZ migrates north Consequently the tradewinds intensify through their joint action with the sea breezeConversely in the rainy season (in particular in the February-summer and March-autumn months) the movement ofthe ITCZ [9] to the south decreases wind speeds Weatherstations located in the south east coast of NEB belongingto the group G5 have lower wind speed values than thosein groups G1 and G2 (Figures 5(c) and 5(d)) because of theweakening of the trade winds as a result of the localizationof stations with respect to the equator in combination witha moderate sea breeze (lower ocean-land thermal gradient)Winds in G5 intensify in spring This is the dry season withits higher solar radiation and consequently a higher thermalgradient between ocean-land (sea breeze) associated with thetrade winds (Figure 5(d))
The low values observed for G3 in all seasons withvalues below 20ms (Figures 5(a)ndash5(d)) is determined by theproximity of the weak pressure gradients associated with theequatorial depression [25] the high surface friction causedby its dense vegetation and its relatively low topographicalposition The same vegetation and topography factors applyto the weather stations of group G5
Figure 5(e) presents the annual average wind speedswithin the groups for the time series We can observe thatG1 G2 and G5 have the highest average wind speed valueswhile G3 and G4 with their own characteristics regardingcirculation patterns and geomorphology have the lowestannual average In Figure 5(e) the variability of each year canbe observed with wind speeds staying above below or closeto the historical average in a particular group
Table 2 presents the descriptive statistics of the interan-nual variability of the groups for the time series taking intoaccount the influence of El Nino and La Nina events on thechange in wind intensity over NEB
60
55
50
45
40
35
30
25
20
15
10
05
00
G1
G2
G3
G4
G5
Jan Feb Mar Apr May Jun Jul Aug Sep Oct Nov Dec
Figure 4 Average monthly wind speeds for the analyzed groups inthe period from 1986 to 2011 in NEB
The 1987 El Nino classified as moderate is reflectedin the maximum wind intensities of G1 G3 G4 and G5(Figure 5(e)) which stayed above their historical averages(G1 337ms G3 135ms G4 142ms and G5 283ms)These groups reach other maximums in the El Nino of 1993In 1998 a strong El Nino event produced higher values thanthe historical averages for all groups (Table 2)
In the La Nina events of 2000 and 2008 the wind speedintensity was always below the average especially in 2000with G3 presenting the largest anomaly 015ms In 2008 G5was the biggest outlier with 025ms
33 Trend Analysis The trend analysis tests with the Mann-Kendall method are summarized in Table 3 We can observethat the average annual wind speeds for groups G3 G4 andG5 have a negative trend with a significance level of 119875 lt0001 while G1 and G2 did not show any significance in theirtrend tests
In summer the decrease in speeds was more pronouncedinG3 andG5 with significance levels of119875 lt 0001This trendwas highest in groupG5 with a119885 value ofminus406 representingan impact of climate variability and on wind resources Insome locations of this group wind intensity was greater than30ms
Other important findings were the negative trend inwinter and spring for G3 and G5 In G4 a negative trend canbe observedwith119885 values ofminus264 andminus251 and significancelevels of 119875 lt 001 and 119875 lt 005 for winter and springrespectively This period is characterized by higher windintensity according to its climatology The highest values inthe Mann-Kendall trend test were found for summer and fallin all groups For the rest of the analyses significant levels of119875 lt 0001 and 119875 lt 001 were observed
4 Discussion and Final Remarks
In accordance with the study from Oliveira and Costa [26]the highest wind speeds were found in the period fromAugust to November When we look at the NEB region
The Scientific World Journal 7
60
55
50
45
40
35
30
25
20
15
10
05
00
1986 1989 1992 1995 1998 2001 2004 2007 2010
(a)
60
55
50
45
40
35
30
25
20
15
10
05
00
1986 1989 1992 1995 1998 2001 2004 2007 2010
(b)
60
55
50
45
40
35
30
25
20
15
10
05
00
1986 1989 1992 1995 1998 2001 2004 2007 2010
(c)
60
55
50
45
40
35
30
25
20
15
10
05
00
1986 1989 1992 1995 1998 2001 2004 2007 2010
(d)
50
45
40
35
30
25
20
15
10
05
00
G1
G2
G3
G4
G5
1986 1989 1992 1995 1998 2001 2004 2007 2010
(e)
Figure 5 Quarterly ((a)ndash(d)) and annual (e) average wind speed graphs for the period 1986ndash2011
8 The Scientific World Journal
Table 2 Years with El Nino and La Nina events which are responsible for changes in wind intensity over the studied region Years with ElNino and La Nina activities were established based on the data from the Center for Weather Forecasting and Climate Studies-CPTECINPE(httpenoscptecinpebr)
Meteorological phenomenon Year Observed mean (ms) Anomaly (ms)G1 G2 G3 G4 G5 G1 G2 G3 G4 G5
El Nino 1987 338 402 151 231 327 001 minus009 016 017 044La Nina 1988 322 410 154 227 306 minus015 minus001 019 013 023El Nino 1993 364 444 137 219 300 027 038 002 005 017El Nino 1998 367 451 131 216 302 030 040 minus004 002 019La Nina 2000 327 406 120 202 271 minus010 minus005 minus015 minus012 minus012El Nino 2005 362 415 137 222 286 025 004 002 008 003La Nina 2008 322 391 123 208 258 minus015 minus020 minus012 minus006 minus025
Table 3 Results of the Mann-Kendall tests of the groups for seasonal and interannual variabilities
Group Period Average (ms) Mann-Kendall test (119885) Signific (119875)
G1
Annual 337 minus044 mdashDJF (summer) 305 minus062 mdashMAM (autumn) 239 026 mdashJJA (winter) 384 026 mdashSON (spring) 417 minus128 mdash
G2
Annual 411 minus159 mdashDJF (summer) 391 minus150 mdashMAM (autumn) 349 minus128 mdashJJA (winter) 434 minus154 mdashSON (spring) 470 minus022 mdash
G3
Annual 135 minus414 lt0001DJF (summer) 111 minus361 lt0001MAM (autumn) 112 minus401 lt0001JJA (winter) 159 minus273 lt001SON (spring) 158 minus344 lt0001
G4
Anual 214 minus410 lt0001DJF (summer) 199 minus264 lt001MAM (autumn) 164 minus282 lt001JJA (winter) 216 minus264 lt001SON (spring) 275 minus251 lt005
G5
Anual 283 minus414 lt0001DJF (summer) 290 minus406 lt0001MAM (autumn) 246 minus309 lt001JJA (winter) 264 minus392 lt0001SON (spring) 333 minus326 lt001
regarding its viability for wind energy projects only groupsG1 and G2 prove to be favorable locations with historicalaverages above 3ms
De Lucena et al [27] used numerical weather models forfuture scenarios and presented results for thewind conditionsin the northern coastline of NEB that prove favorable forinvestments in wind power This could lead to an expansionin the use of renewable energy in this region Three of thefour weather stations in G1 are located in this area and thewind speed values were considerable NEB has a greater windpower potential in the second semester especially the G1and G2 groups Pasicko et al [28] argue in a detailed study
that for the development of a climatologically viable windfarm project wind speeds exceeding 3ms and in a constantdirection are required
Based on the data analyzed in this study we observed aseasonal variability in the groups of the NEB region whichcan be seen in Figures 3 and 4 Lima and Filho [29 30]have also demonstrated the existence of seasonality in windspeeds with data obtained from two anemometric towerslocated in the central NEB region (semiarid) (Triumfo0705010158401710158401015840S 3800610158400610158401015840Wand Sao Joao do Cairi 0702210158405410158401015840S3603110158403810158401015840W) with maximum values in the months of July toNovember and minimums in March and April The seasonal
The Scientific World Journal 9
wind speed variability of G1 G2 G3 G4 and G5 presentedmaximum and minimum values in these same months Inaddition Rehman [31] also confirmed seasonality in windspeed data collected at different points in Saudi Arabia withthe highest values occurring during the summer months(winter in the southern hemisphere) and the lowest duringthe winter months (summer in the southern hemisphere)
Regarding the interannual variability in the groups weobserved that wind speeds increased during El Nino eventsand decreased during La Nina which can be confirmed bythe anomalies presented in Table 2 Vieira [32] observed anincrease in wind speeds during the dry season along thecoast of the state of Ceara of approximately 2ms for the ElNino year of 1983 In the strong La Nina event of 1999 headded to these results by observing that in the rainy seasonof the northern sector of NEB the average wind speed valuesdecreased in relation to the climatological average
Rehman [31] performed a statistical trend analysis withthe Mann-Kendall method on the average annual data forthe entire time series (1970ndash2006) from stations located inSaudi Arabia The Al-Ahsa weather station presented a 119885 testvalue that indicates a decreasing annual average wind speedtrend Similar decreasing trends were observed in Al-BahaGuriat Sharourah Taif and Yanbo with significant levels of119875 lt 001 in addition to Gizan Tabouk Medinah Nejranand Qaisumah which had a significance of 119875 lt 0001 TheG3 G4 and G5 groups present decreasing trends with 119885test values and significance levels similar to those found byRehman [31] Pereira et al [1] have shown a decreasing trendin their historical series of average annual wind speeds forweather stations in the NEB region (Caravels-BA ParnaıbaSul region-PI Maceio-AL) The results for G1 and G2 didnot present significant annual trends in their results Pereiraet al [1] state in their conclusion that the large number ofnonsignificant results is a consequence of the few availablemeteorological stations with longer time series which wouldenable more conclusive results
Based on the results present the conclusions main can besummarized in the following points
(i) In the analysis of 47 meteorological stations of theNEB region divided into five homogenous groupsthe highest annual average wind speed (at 10m fromthe surface) of 411ms was observed in G2 and thelowest was 135ms in G3
(ii) The highest median values for seasonal variabilitywere observed in winter and spring except for G5which had its highest median value in spring witha value of 33ms The variability of the averageannual wind speeds in the boxplots showed a greatervariability in group G5 The lowest variability waspresented by G3 and G4 The groups with the highestmedian values were G1 G2 and G5 We also foundthat the locations of G2 with an elevated topographyspecifically central NEB (semiarid) favor an increasein wind intensity
(iii) The G1 G2 and G5 groups presented the highestannual averages for interannual variabilityThe lowestwere observed in G3 and G4 We found that in the
years 1987 (G1 G3 G4 and G5) 1993 (G1ndashG5) 1998(G1 G2 G4 and G5) and 2005 (G1ndashG5) the averagewind speeds were above the historical average Theintensification of circulation in the NEB region forthese years is caused by El Nino events During the LaNina events of the years 1988 (G1 and G2) 2000 (G1ndashG5) and 2008 (G1ndashG5) the annual average speedsremained below their historical averages
(iv) The analysis of wind speed trends enables us to drawthe following conclusions (i) the groups G3 G4 andG5 showed a negative trend in annual average speedswith a high significance (119875 lt 0001) (ii) no significanttrendwas identified for groups G1 andG2 (iii) duringthe summer a more pronounced decrease in windspeeds was observed inG3 andG5 with a significancelevel of119875 lt 0001 and119885 test values ofminus361 andminus406(iv) in winter and spring group G4 presented thestrongest negative trend with 119885 values of minus264 andminus252 and significant levels of 119875 lt 001 and 119875 lt 005respectively (vi) the highest 119885 values were found inthe summer and fall for all groups
(v) The study indicates that the regions G1 and G2 havethe greatest potential for expanding the use of windpower since these are the areas with highwind speedsand no significant trends
(vi) It should be noted that these results were obtainedfrom conventional meteorological stations at a spe-cific time (12119885) This analysis should therefore beextended and at the same time the results portrayedhere should be interpreted with caution Improve-ments can be made by including a greater number ofwind speed data measured by conventional (at fourtimes 00 06 12 18119885) and automatic (every hour)meteorological stations in NEBThese stations shouldalso have a lower percentage of missing data Webelieve however that the results presented here areof great value for the planning of future investmentsin wind power in NEB
Acknowledgments
The authors would like to thank REUNI and CAPES forthe doctorate grant awarded to Alexandre Torres Silva dosSantos
References
[1] E B Pereira F R Martins M P Pes E I da Cruz Segundoand A D A Lyra ldquoThe impacts of global climate changes onthe wind power density in Brazilrdquo Renewable Energy 2012
[2] Y Jiang Y Luo Z Zhao and S Tao ldquoChanges in windspeed over China during 1956ndash2004rdquo Theoretical and AppliedClimatology vol 99 no 3-4 pp 421ndash430 2010
[3] A Troccoli K Muller P Coppin R Davy C Russell and A LHirsch ldquoLong-term wind speed trends over Australiardquo Journalof Climate vol 25 no 1 pp 170ndash183 2012
[4] P A Pirazzoli and A Tomasin ldquoRecent near-surface windchanges in the central Mediterranean and Adriatic areasrdquo
10 The Scientific World Journal
International Journal of Climatology vol 23 no 8 pp 963ndash9732003
[5] J M Gutierrez R Cano A S Cofino and M A RodriguezldquoClustering methods for statistical downscaling in short-rangeweather forecastrdquo Monthly Weather Review vol 132 pp 2169ndash2183 2004
[6] T R McVicar T G Van Niel L T Li et al ldquoWind speedclimatology and trends for Australia 1975ndash2006 capturingthe stilling phenomenon and comparison with near-surfacereanalysis outputrdquo Geophysical Research Letters vol 35 no 20Article ID L20403 2008
[7] T Usbeck T Wohlgemuth C Pfister R Volz M Beniston andM Dobbertin ldquoWind speed measurements and forest damagein Canton Zurich (Central Europe) from 1891 to winter 2007rdquoInternational Journal of Climatology vol 30 no 3 pp 347ndash3582010
[8] S C Pryor J T Schoof andR J Barthelmie ldquoWinds of changeprojections of near-surface winds under climate change sce-nariosrdquo Geophysical Research Letters vol 33 no 11 Article IDL11702 2006
[9] J AMason J B Swinehart H Lu XMiao P Cha and Y ZhouldquoLimited change in dunemobility in response to a large decreasein wind power in semi-arid northern China since the 1970srdquoGeomorphology vol 102 no 3-4 pp 351ndash363 2008
[10] P A Jimenez J F Gonzalez-Rouco E Garcıa-Bustamante et alldquoSurface wind regionalization over complex terrain evaluationand analysis of a high-resolution WRF simulationrdquo Journal ofAppliedMeteorology andClimatology vol 49 no 2 pp 268ndash2872010
[11] T Mathaba M Mpholo and M Letuma ldquoVelocity and powerdensity analysis of the wind at Letseng-la-terae in LesothordquoRenewable Energy vol 46 pp 210ndash217 2012
[12] A Mostafaeipour A Sedaghat M Ghalishooyan et al ldquoEval-uation of wind energy potential as a power generation sourcefor electricity production in Binalood Iranrdquo Renewable Energyvol 52 pp 222ndash229 2013
[13] L C Cradden G P Harrison and J P Chick ldquoWill climatechange impact on wind power development in the UKrdquoClimatic Charge vol 115 no 3-4 pp 837ndash852 2012
[14] S Hastenrath ldquoExploring the climate problems of BrazilrsquosNordeste a reviewrdquoClimatic Change vol 112 no 2 pp 243ndash2512012
[15] V D P R da Silva ldquoOn climate variability in Northeast ofBrazilrdquo Journal of Arid Environments vol 58 no 4 pp 575ndash5962004
[16] S van Buuren and K Groothuis-Oudshoorn ldquoMice multivari-ate imputation by chained equations in Rrdquo Journal of StatisticalSoftware vol 45 no 3 pp 1ndash67 2011
[17] T Raghunathan and I Bondarenko ldquoDiagnostics for MultipleImputationsrdquo SSRN 2007 httpssrncomabstract=1031750
[18] A Johnson X Wang M Xue and F Kong ldquoHierarchicalcluster analysis of a convection-allowing ensemble duringthe hazardous weather testbed 2009 spring experiment PartII ensemble clustering over the whole experiment periodrdquoMonthly Weather Review vol 139 no 12 pp 3694ndash3710 2011
[19] V Guldal and H Tongal ldquoCluster analysis in search of windimpacts on evaporationrdquo Applied Ecology and EnvironmentalResearch vol 6 no 4 pp 69ndash76 2008
[20] J Najac J Boe and L Terray ldquoA multi-model ensembleapproach for assessment of climate change impact on surfacewinds in Francerdquo Climate Dynamics vol 32 no 5 pp 615ndash6342009
[21] G Ratto R Maronna and G Berri ldquoAnalysis of wind rosesusing hierarchical cluster andmultidimensional scaling analysisat La Plata Argentinardquo Boundary-Layer Meteorology vol 137no 3 pp 477ndash492 2010
[22] D S Wilks Statistical Methods in the Atmospheric Sciences vol100 of International Geophysics Series Elsevier New York NYUSA 3rd edition 2011
[23] V D P R da Silva P V De Azevedo R S Brito and J H BDa Cunha Campos ldquoEvaluating the urban climate of a typicallytropical city of northeastern Brazilrdquo Environmental Monitoringand Assessment vol 161 no 1ndash4 pp 45ndash59 2010
[24] R Modarres and V de Paulo Rodrigues da Silva ldquoRainfalltrends in arid and semi-arid regions of Iranrdquo Journal of AridEnvironments vol 70 no 2 pp 344ndash355 2007
[25] C D Ahrens Essentials of Meteorology An Invitation to theAtmosphere BrooksCole Cengage Learning Stamford ConnUSA 6th edition 2011
[26] J L Oliveira and A A Costa ldquoEstudo de variabilidade dovento em escala sazonal sobre o nordeste Brasileiro utilizandoo RAMS os casos de 1973-1974 e 1982-1983rdquo Revista Brasileirade Meteorologia vol 26 no 1 pp 53ndash66 2011
[27] A F P de Lucena A S Szklo R Schaeffer and R M DutraldquoThe vulnerability of wind power to climate change in BrazilrdquoRenewable Energy vol 35 no 5 pp 904ndash912 2010
[28] R Pasicko C Brankovic and Z Simic ldquoAssessment of climatechange impacts on energy generation from renewable sourcesin Croatiardquo Renewable Energy vol 46 pp 224ndash231 2012
[29] L A Lima and C R B Filho ldquoWind energy assessmentand wind farm simulation in Triunfo-Pernambuco BrazilrdquoRenewable Energy vol 35 no 12 pp 2705ndash2713 2010
[30] L A Lima and C R B Filho ldquoWind resource evaluation in SaoJoao doCariri (SJC)-Paraiba BrazilrdquoRenewable and SustainableEnergy Reviews vol 16 no 1 pp 474ndash480 2012
[31] S Rehman ldquoLong-termwind speed analysis and detection of itstrends using Mann-Kendall test and linear regression methodrdquoArabian Journal for Science and Engineering vol 38 no 2 pp421ndash437 2013
[32] C F A Vieira Sensibilidade do modelo WAsP aos efeitosda estabilidade atmosferica no Nordeste do Brasil Dissertacao(Mestrado em Cienciais Fısicas Aplicadas) [MS thesis] Univer-sidade Estadual do Ceara Fortaleza Brazil 2008
Submit your manuscripts athttpwwwhindawicom
Hindawi Publishing Corporationhttpwwwhindawicom Volume 2014
ClimatologyJournal of
EcologyInternational Journal of
Hindawi Publishing Corporationhttpwwwhindawicom Volume 2014
EarthquakesJournal of
Hindawi Publishing Corporationhttpwwwhindawicom Volume 2014
Hindawi Publishing Corporationhttpwwwhindawicom
Applied ampEnvironmentalSoil Science
Volume 2014
Mining
Hindawi Publishing Corporationhttpwwwhindawicom Volume 2014
Journal of
Hindawi Publishing Corporation httpwwwhindawicom Volume 2014
International Journal of
Geophysics
OceanographyInternational Journal of
Hindawi Publishing Corporationhttpwwwhindawicom Volume 2014
Journal of Computational Environmental SciencesHindawi Publishing Corporationhttpwwwhindawicom Volume 2014
Journal ofPetroleum Engineering
Hindawi Publishing Corporationhttpwwwhindawicom Volume 2014
GeochemistryHindawi Publishing Corporationhttpwwwhindawicom Volume 2014
Journal of
Atmospheric SciencesInternational Journal of
Hindawi Publishing Corporationhttpwwwhindawicom Volume 2014
OceanographyHindawi Publishing Corporationhttpwwwhindawicom Volume 2014
Advances in
Hindawi Publishing Corporationhttpwwwhindawicom Volume 2014
MineralogyInternational Journal of
Hindawi Publishing Corporationhttpwwwhindawicom Volume 2014
MeteorologyAdvances in
The Scientific World JournalHindawi Publishing Corporation httpwwwhindawicom Volume 2014
Paleontology JournalHindawi Publishing Corporationhttpwwwhindawicom Volume 2014
ScientificaHindawi Publishing Corporationhttpwwwhindawicom Volume 2014
Hindawi Publishing Corporationhttpwwwhindawicom Volume 2014
Geological ResearchJournal of
Hindawi Publishing Corporationhttpwwwhindawicom Volume 2014
Geology Advances in
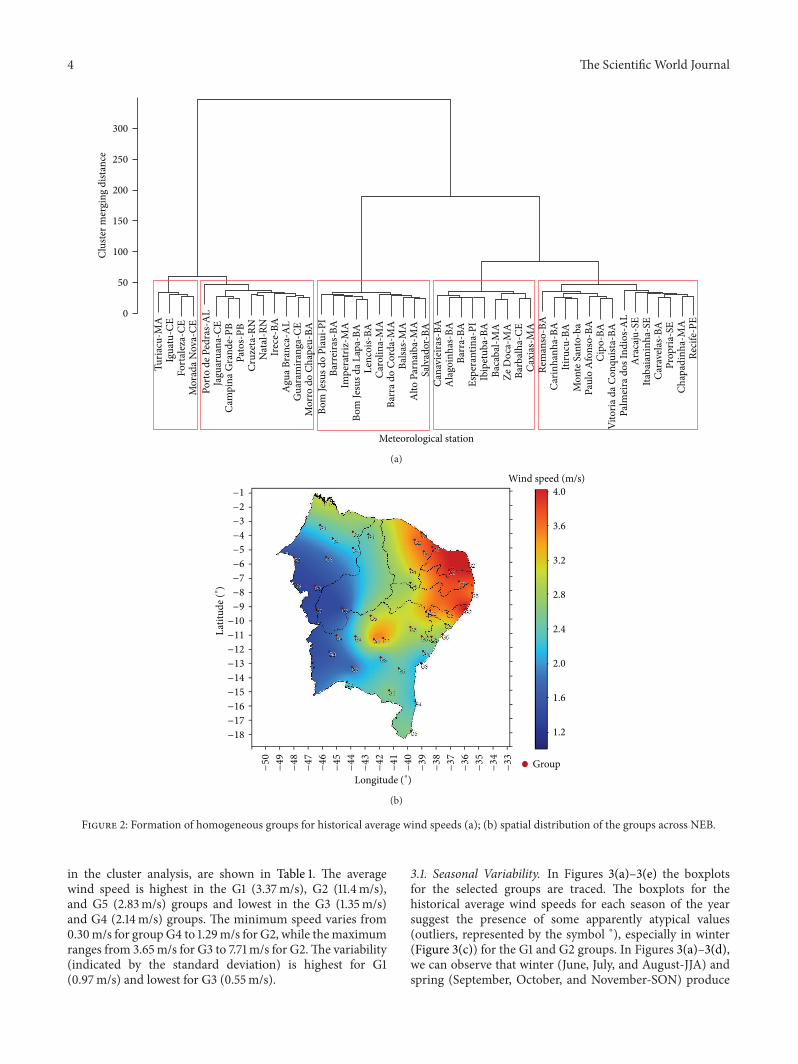