presenter: jennifer logalbo rhp 8 monthly learning collaborative call november 14, 2014 1
TRANSCRIPT
1
Business Process Mapping as a Continuous Quality Improvement Tool
Presenter: Jennifer LoGalboRHP 8 Monthly Learning Collaborative Call
November 14, 2014
2
Objectives Welcome and Introductions Review Traditional Management vs. Systems Thinking Define Business Process Mapping (BPM) Review Brief History and Overview of BPM Discuss Various BPM Tools Share Resources/Examples Q&A
3
What is Systems Thinking?
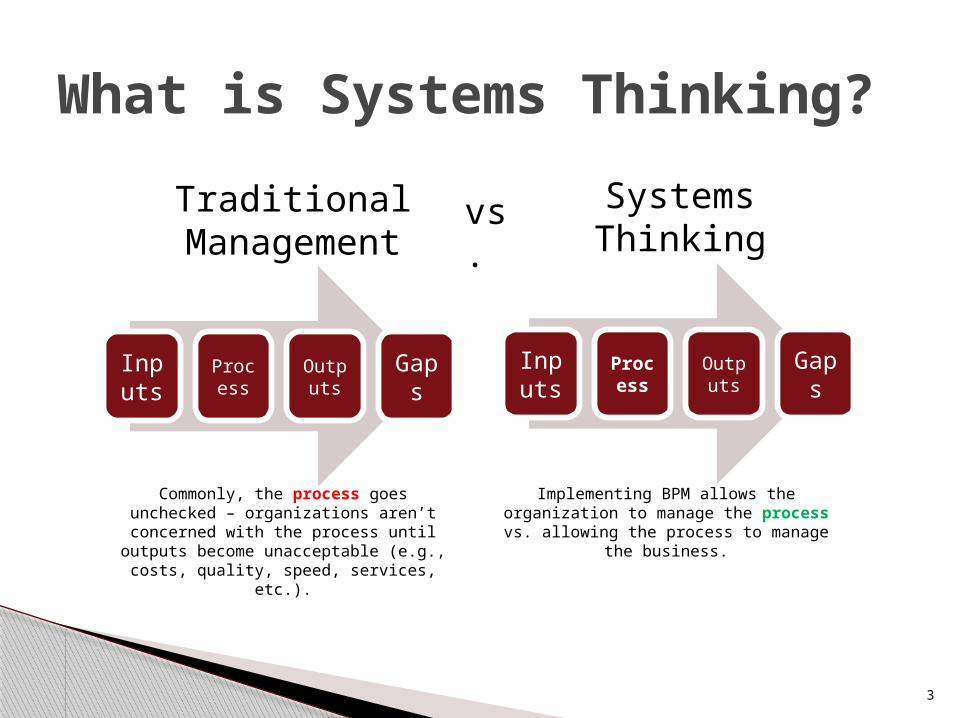
Traditional Management
vs. Systems Thinking
Commonly, the process goes unchecked – organizations aren’t concerned with the
process until outputs become unacceptable (e.g., costs, quality, speed,
services, etc.).
Implementing BPM allows the organization to manage the process vs. allowing the
process to manage the business.
Inputs
Process
Outputs
Gaps
Inputs
Process
Outputs
Gaps
4
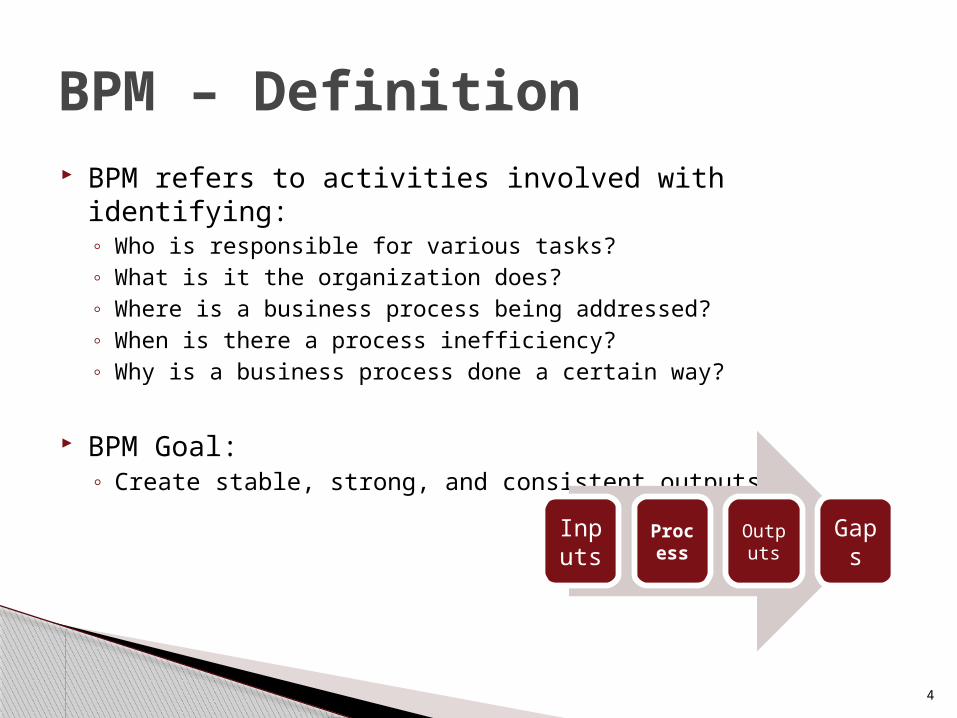
BPM – Definition BPM refers to activities involved with identifying:
◦ Who is responsible for various tasks?◦ What is it the organization does?◦ Where is a business process being addressed?◦ When is there a process inefficiency?◦ Why is a business process done a certain way?
BPM Goal:◦ Create stable, strong, and consistent outputs.
Inputs
Process
Outputs
Gaps
5
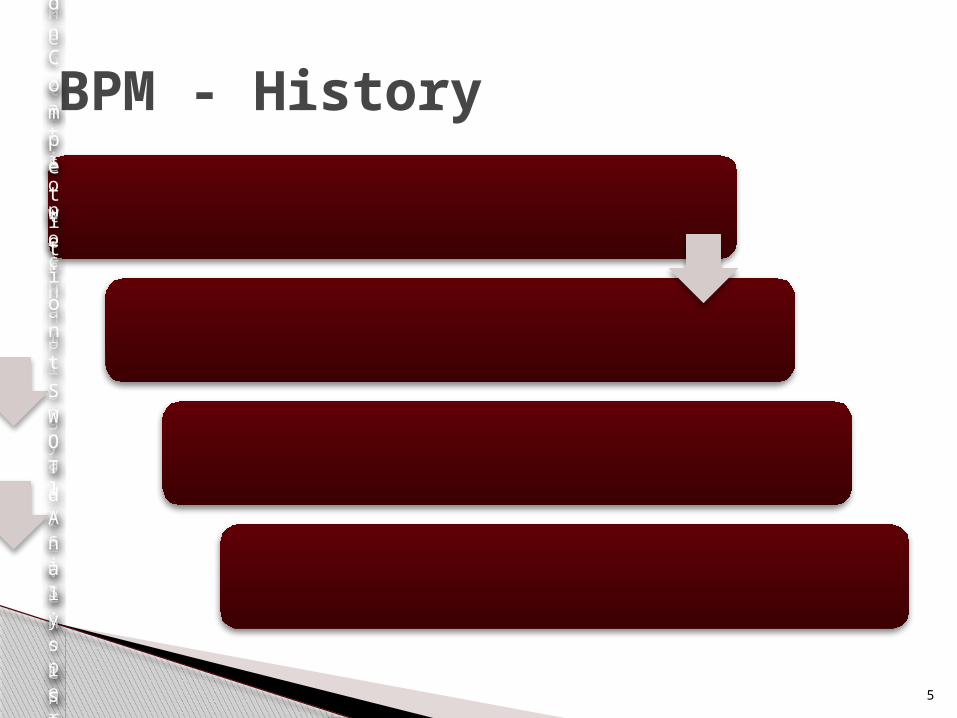
BPM - History
1980s - Total Quality Management
Continuous work process improvement; team facilitation
Early 1990s - Process Reengineering
One-time technology-driven change; project management
Late 1990s - Process Oriented
Organization chart analysis; performance management
2000s - Process Based Competition
SWOT Analysis; organization assessment
6
BPM - Overview Key tool for process management initiatives
◦ Importance of understanding the overall process before looking at the details of the process
◦ Identify gap to be addressed, and then chose the tool that best aligns with that goal
Three areas drive tool selection:◦ Audience◦ Intent◦ Gap
7
BPM - Tools Charts, graphs and diagrams visually display what the
process is and who is involved Various tools are available, some of these include:
1. Process Charting2. Top-Down Flow Chart3. Block Diagram4. Activity Chart5. Work-Flow Diagram6. Cross-Functional Flow Chart
8
Process Charting When to use it?
◦ When trying to gain a general, overview of activities in an organization
Shortcomings:◦ Provides very broad overview and does not show details; may
become confusing when multiple people are involved/multiple processes
Example:◦ Provider may use this approach when mapping out various
DSRIP Projects underway in an organization

9
Process Charting, Example
Texas LMHA
10
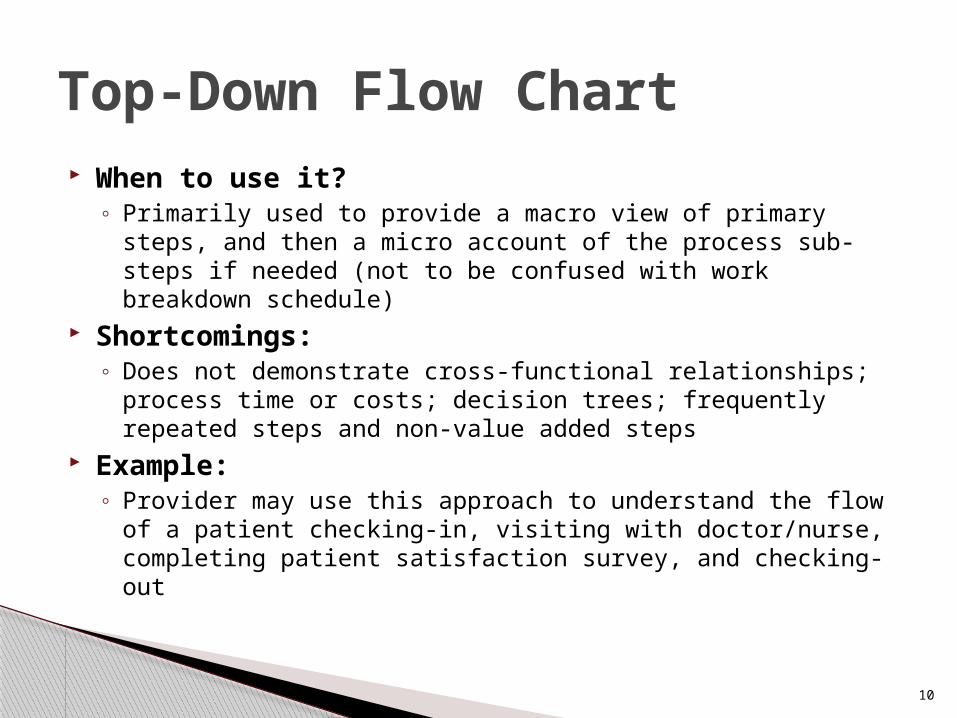
Top-Down Flow Chart When to use it?
◦ Primarily used to provide a macro view of primary steps, and then a micro account of the process sub-steps if needed (not to be confused with work breakdown schedule)
Shortcomings:◦ Does not demonstrate cross-functional relationships; process
time or costs; decision trees; frequently repeated steps and non-value added steps
Example:◦ Provider may use this approach to understand the flow of a
patient checking-in, visiting with doctor/nurse, completing patient satisfaction survey, and checking-out
11
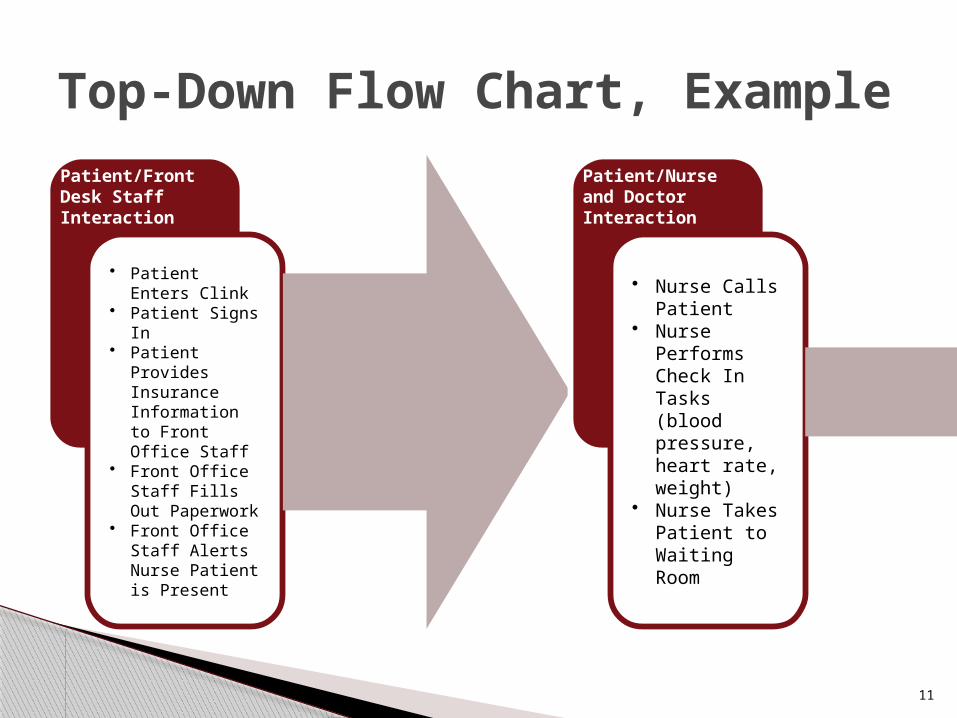
Top-Down Flow Chart, Example
Patient/Front Desk Staff Interaction
• Patient Enters Clink
• Patient Signs In
• Patient Provides Insurance Information to Front Office Staff
• Front Office Staff Fills Out Paperwork
• Front Office Staff Alerts Nurse Patient is Present
Patient/Nurse and Doctor Interaction
• Nurse Calls Patient
• Nurse Performs Check In Tasks (blood pressure, heart rate, weight)
• Nurse Takes Patient to Waiting Room
12
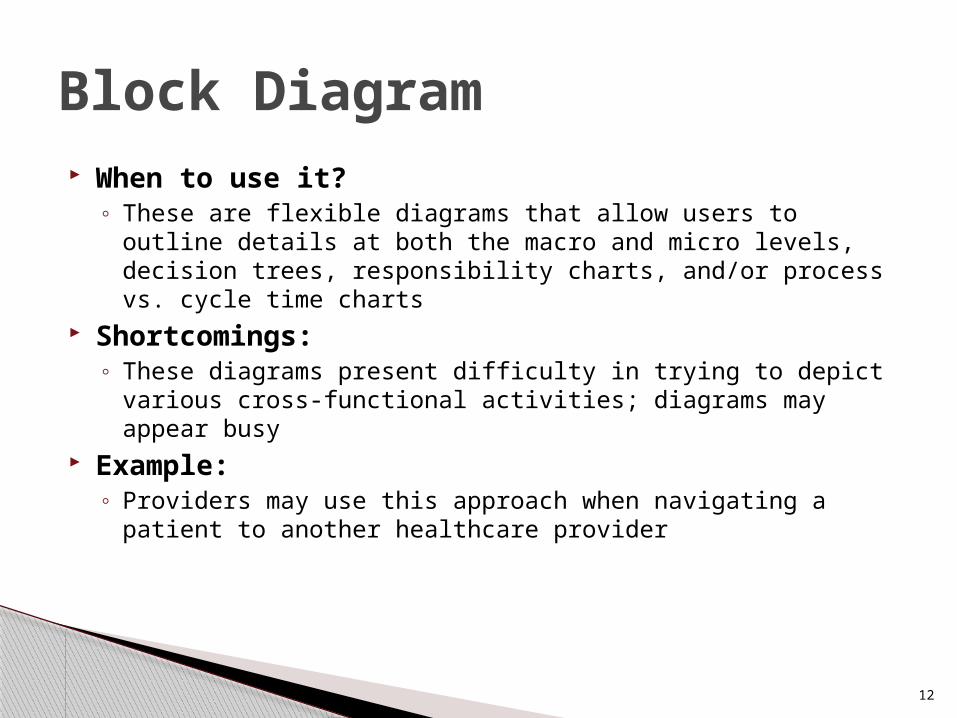
Block Diagram When to use it?
◦ These are flexible diagrams that allow users to outline details at both the macro and micro levels, decision trees, responsibility charts, and/or process vs. cycle time charts
Shortcomings:◦ These diagrams present difficulty in trying to depict various
cross-functional activities; diagrams may appear busy Example:
◦ Providers may use this approach when navigating a patient to another healthcare provider
13
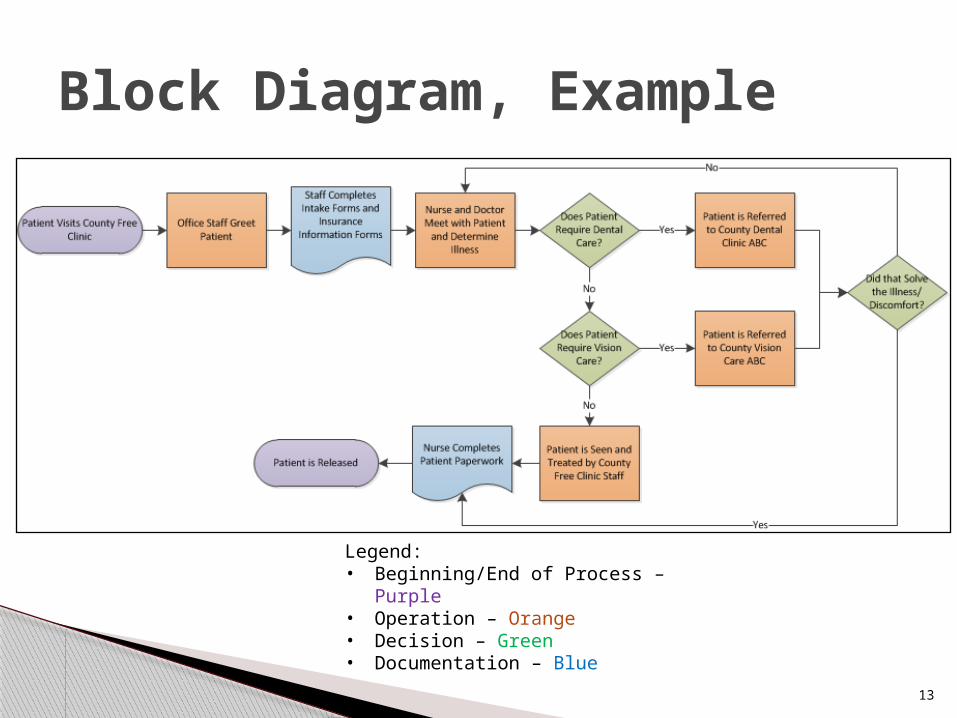
Block Diagram, Example
Legend:• Beginning/End of Process – Purple• Operation – Orange• Decision – Green• Documentation – Blue
14
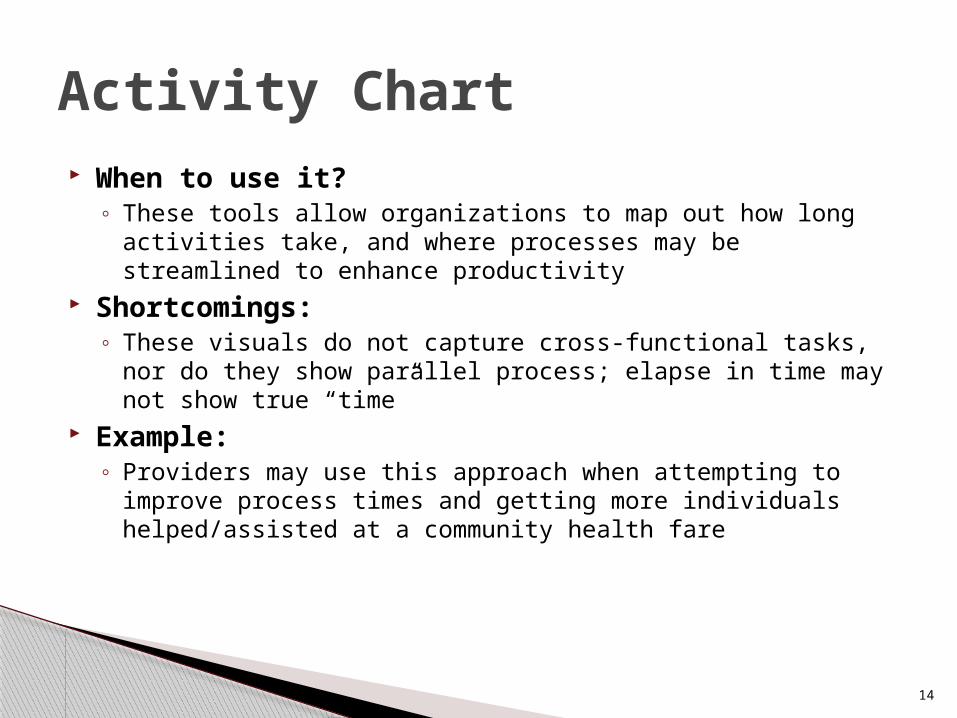
Activity Chart When to use it?
◦ These tools allow organizations to map out how long activities take, and where processes may be streamlined to enhance productivity
Shortcomings:◦ These visuals do not capture cross-functional tasks, nor do they
show parallel process; elapse in time may not show true “time” Example:
◦ Providers may use this approach when attempting to improve process times and getting more individuals helped/assisted at a community health fare

15
Activity Chart, Example - Outline
16
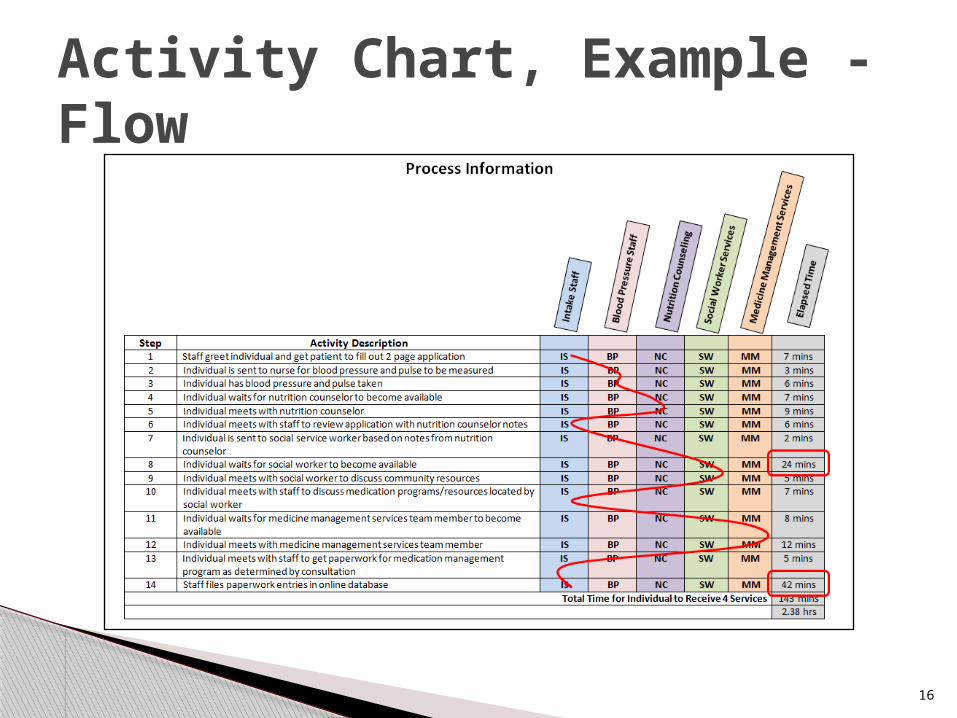
Activity Chart, Example - Flow
17
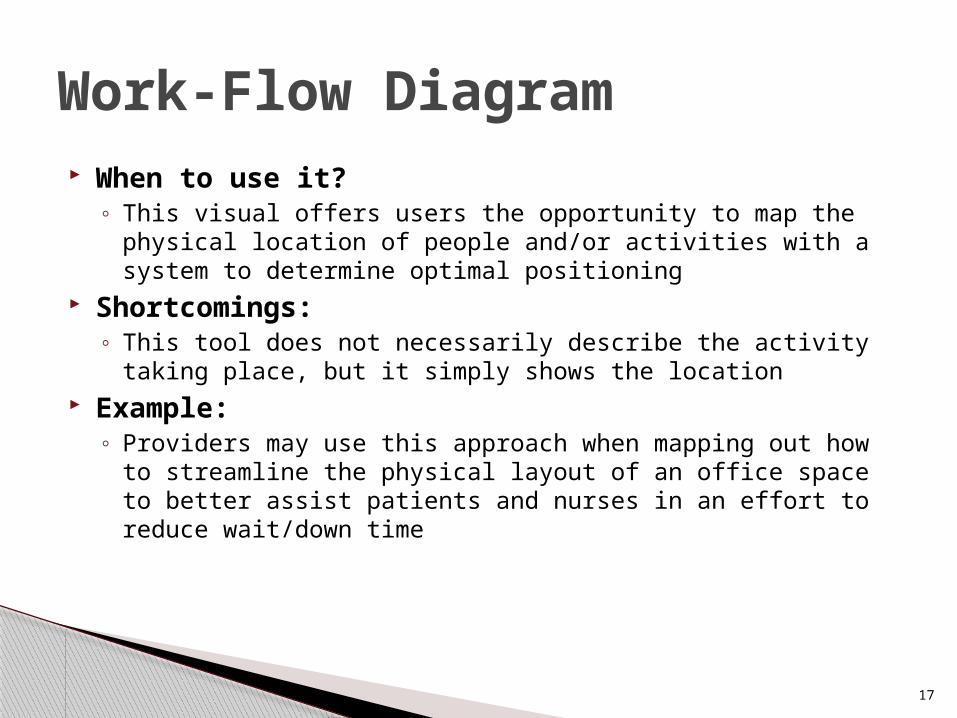
Work-Flow Diagram When to use it?
◦ This visual offers users the opportunity to map the physical location of people and/or activities with a system to determine optimal positioning
Shortcomings:◦ This tool does not necessarily describe the activity taking place,
but it simply shows the location Example:
◦ Providers may use this approach when mapping out how to streamline the physical layout of an office space to better assist patients and nurses in an effort to reduce wait/down time

18
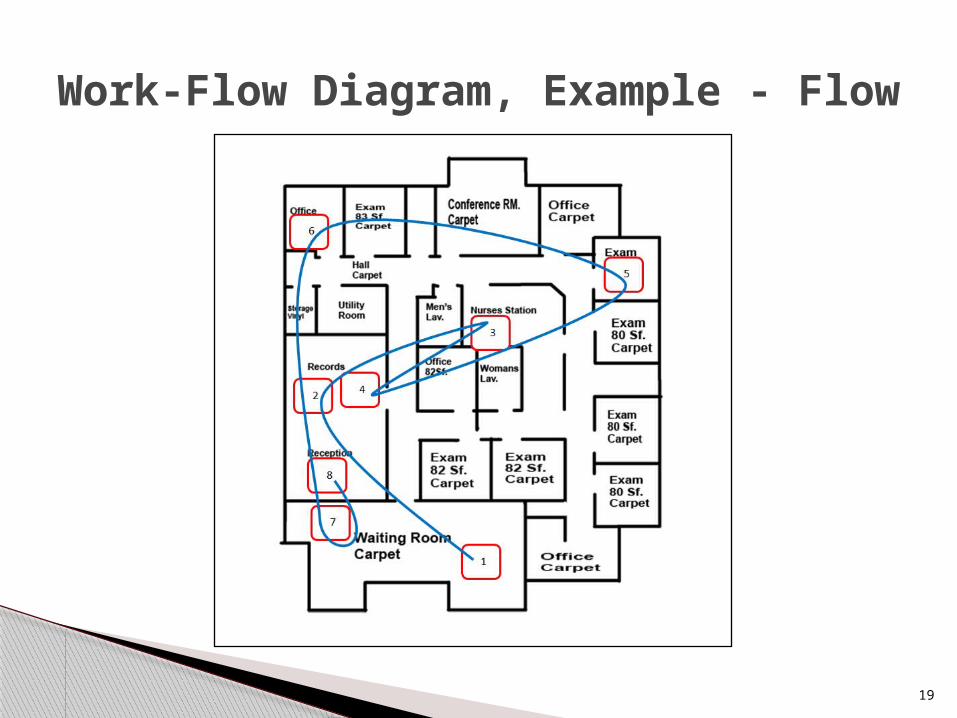
Work-Flow Diagram, Example - Outline
1) Patient enters clinic2) Nurse pulls patient record
from storage room3) Patient is taken to nurse
station4) Nurse files vitals in patient
records5) Patient is taken to exam
room6) Nurse consults with doctor
prior to appointment7) Nurse takes patient to
waiting room8) Nurse files paperwork in
record storage room
19
Work-Flow Diagram, Example - Flow
20
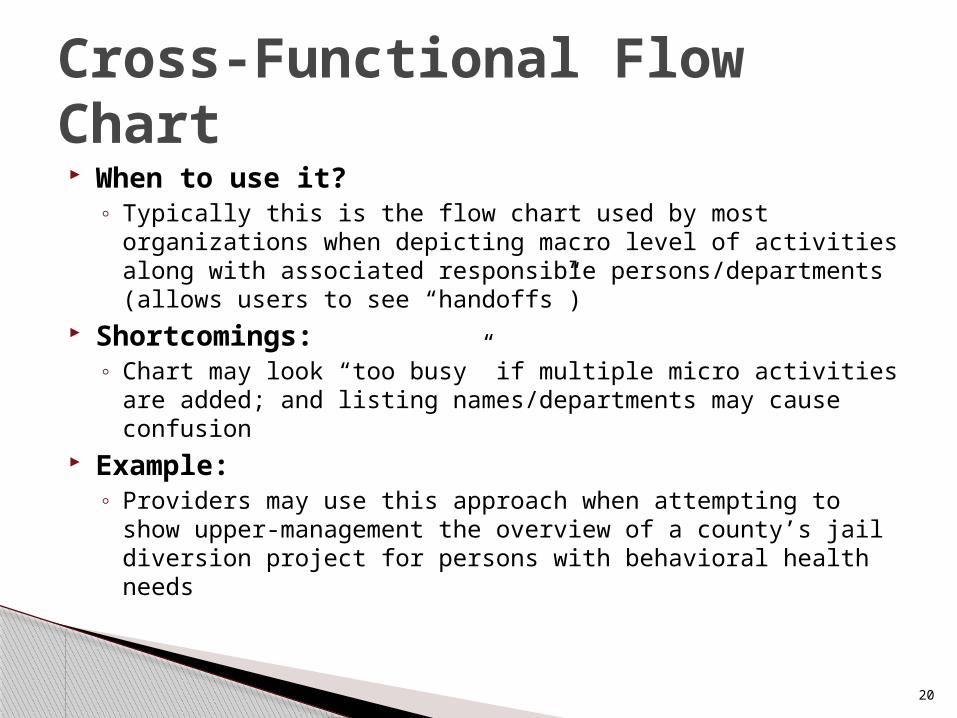
Cross-Functional Flow Chart When to use it?
◦ Typically this is the flow chart used by most organizations when depicting macro level of activities along with associated responsible persons/departments (allows users to see “handoffs”)
Shortcomings:◦ Chart may look “too busy” if multiple micro activities are added;
and listing names/departments may cause confusion Example:
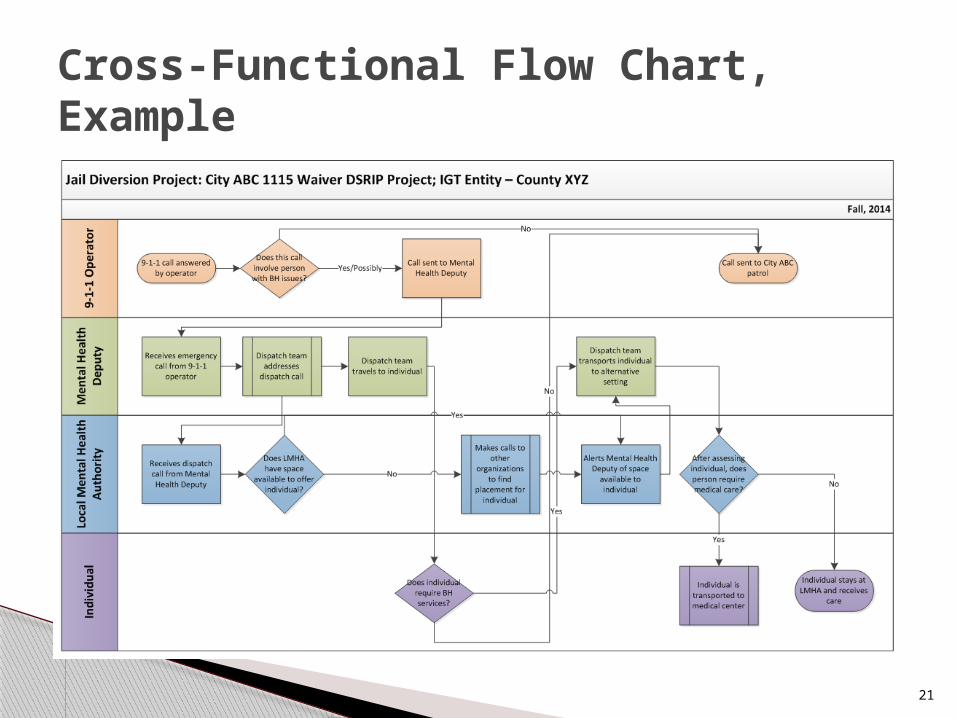
◦ Providers may use this approach when attempting to show upper-management the overview of a county’s jail diversion project for persons with behavioral health needs
21
Cross-Functional Flow Chart, Example
22
Process Mapping: How to Streamline and Reengineer Business Processes. .90216th ed. Vol. 9.05. Orion Developer Group, 2009. Print.
Microsoft Office Suite: Visio, Word, and PowerPoint
Contact Information:Jennifer LoGalboRHP 8 Program [email protected]
Resources and Contact Information

23
Q&A