pre-corneal tear film thickness in humans measured with a
TRANSCRIPT
Pre-corneal tear film thickness in humans measured with a noveltechnique
Kaveh Azartash,1 Justin Kwan,2 Jerry R. Paugh,2 Andrew Loc Nguyen,3 James V. Jester,4 Enrico Gratton1
1Biomedical Engineering, University of California Irvine, Irvine, CA; 2Southern California College of Optometry, Fullerton, CA;3California State University, Fullerton, CA; 4Gavin Herbert Eye Institute, University of California Irvine, Irvine, CA
Purpose: The purpose of this work was to gather preliminary data in normals and dry eye subjects, using a new, non-invasive imaging platform to measure the thickness of pre-corneal tear film.Methods: Human subjects were screened for dry eye and classified as dry or normal. Tear film thickness over the inferiorparacentral cornea was measured using laser illumination and a complementary metal–oxide–semiconductor (CMOS)camera. A previously developed mathematical model was used to calculate the thickness of the tear film by applying theprinciple of spatial auto-correlation function (ACF).Results: Mean tear film thickness values (±SD) were 3.05 μm (0.20) and 2.48 μm (0.32) on the initial visit for normals(n=18) and dry eye subjects (n=22), respectively, and were significantly different (p<0.001, 2-sample t-test). Repeatabilitywas good between visit 1 and 2 for normals (intraclass correlation coefficient [ICC]=0.935) and dry eye subjects(ICC=0.950). Tear film thickness increased above baseline for the dry eye subjects following viscous drop instillation andremained significantly elevated for up to approximately 32 min (n=20; p<0.05 until 32 min; general linear mixed modeland Dunnett’s tests).Conclusions: This technique for imaging the ocular surface appears to provide tear thickness values in agreement withother non-invasive methods. Moreover, the technique can differentiate between normal and dry eye patient types.
Study of the precorneal tear film has enjoyed renewedinterest due to evidence that dry eye syndrome (DES) is acommon ophthalmic condition, potentially affecting 5% tomore than 30% of the adult population in the United States[1], and one that adversely impacts the quality of life of thosewho suffer from it [2]. One important trend in research hasbeen the development of non-invasive methods tocharacterize the tear film. These include non-invasive stabilitymeasures [3,4], approaches to quantify lipid layer thickness[5] and behavior [6], and measurement of total tear filmthickness [7]. Tear film thickness in particular offers aquantitative approach to characterize DES, wherein thethickness is presumably less than under normal conditions dueto tear compositional or physiologic deficiencies leading toinstability and excessive evaporation. Moreover, tear filmthickness measurement offers an objective approach tomonitor the effect of dry eye treatment. An abnormally thintear film is of significance because it may possibly reflect astate of hyperosmolarity of the ocular surface, which isthought to cause damage and result in many of the dry eyesymptoms [8].
King-Smith et al. [9] used interferometry and byevaluating the reflectance spectra from the ocular surface,
Correspondence to: Enrico Gratton, Ph.D., University of CaliforniaIrvine, Biomedical Engineering Department, 3120 Natural SciencesII, Irvine, CA, 92697-2715; Phone: (949) 824-7085; FAX: (949)824-1727; email: [email protected]
were able to noninvasively quantify human tear filmthickness. They obtained measurements of approximately3.0 µm for the normal human tear film [9]. While scientificallysound, the reflectance spectra method is at present availablein very few laboratories, is technically complex and requiresrelatively expensive equipment.
Another non-invasive method that has been applied totear film thickness measurement is optical coherencetomography (OCT) [10]. OCT is an optical signal acquisitionand processing method that can be considered aninterferometric technique. OCT was first used to asses tearfilm by Wang et al. [11,12] reporting values of approximately3 µm, similar to those of King-Smith et al. [7,9,13,14] Whilenon-invasive, a concern relative to OCT is that the thicknessdetermination is indirect rather than direct measurement[12].
In the current work a novel technique was applied toquantify the thickness of the pre-corneal tear film in humans;termed: Fluctuation Analysis by Spatial Image Correlation(FASIC). Thus far, the method has demonstrated efficacy inmeasurement of tear film thickness in animal models [15]providing thickness values in agreement with priormeasurements. The system is robust, portable, low-cost (therelative cost of this technique in its current configuration isunder $1,000.00.), and easy to operate. This techniqueinvolves the quantitative assessment of periodic interferencepatterns in a series of images, from which the ocular tear film
Molecular Vision 2011; 17:756-767 <http://www.molvis.org/molvis/v17/a86>Received 15 December 2010 | Accepted 14 March 2011 | Published 22 March 2011
© 2011 Molecular Vision
756
thickness can be calculated using a mathematical model thattranslates the spatial fluctuations into thickness information.
The aim of the investigation presented in this article wasto measure the thickness of the human tear film using FASIC.This was a study to generate preliminary tear film thicknessdata from normal (i.e., non dry eye) and dry eye subjects in aclinic-based population. In addition, we examined the short-term (i.e., one week) repeatability of the method in a singlesetting and the temporal effect of a viscous lubricating eyedrop on tear film thickness.
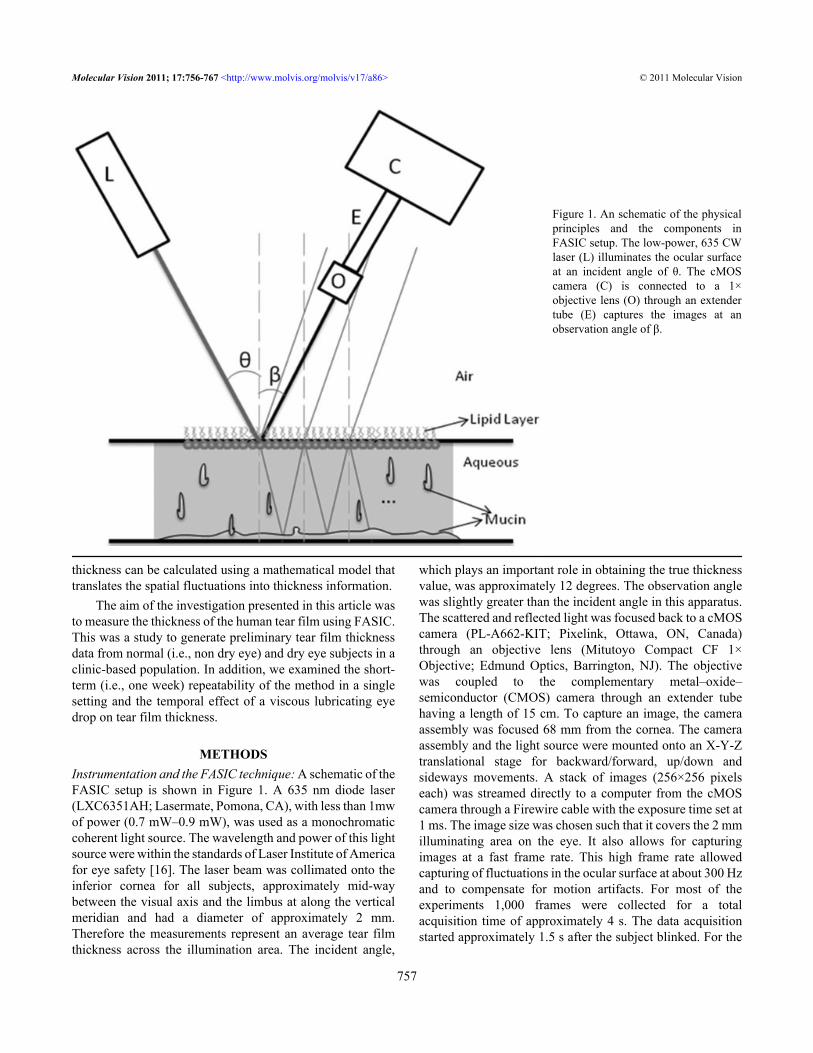
METHODSInstrumentation and the FASIC technique: A schematic of theFASIC setup is shown in Figure 1. A 635 nm diode laser(LXC6351AH; Lasermate, Pomona, CA), with less than 1mwof power (0.7 mW–0.9 mW), was used as a monochromaticcoherent light source. The wavelength and power of this lightsource were within the standards of Laser Institute of Americafor eye safety [16]. The laser beam was collimated onto theinferior cornea for all subjects, approximately mid-waybetween the visual axis and the limbus at along the verticalmeridian and had a diameter of approximately 2 mm.Therefore the measurements represent an average tear filmthickness across the illumination area. The incident angle,
which plays an important role in obtaining the true thicknessvalue, was approximately 12 degrees. The observation anglewas slightly greater than the incident angle in this apparatus.The scattered and reflected light was focused back to a cMOScamera (PL-A662-KIT; Pixelink, Ottawa, ON, Canada)through an objective lens (Mitutoyo Compact CF 1×Objective; Edmund Optics, Barrington, NJ). The objectivewas coupled to the complementary metal–oxide–semiconductor (CMOS) camera through an extender tubehaving a length of 15 cm. To capture an image, the cameraassembly was focused 68 mm from the cornea. The cameraassembly and the light source were mounted onto an X-Y-Ztranslational stage for backward/forward, up/down andsideways movements. A stack of images (256×256 pixelseach) was streamed directly to a computer from the cMOScamera through a Firewire cable with the exposure time set at1 ms. The image size was chosen such that it covers the 2 mmilluminating area on the eye. It also allows for capturingimages at a fast frame rate. This high frame rate allowedcapturing of fluctuations in the ocular surface at about 300 Hzand to compensate for motion artifacts. For most of theexperiments 1,000 frames were collected for a totalacquisition time of approximately 4 s. The data acquisitionstarted approximately 1.5 s after the subject blinked. For the
Figure 1. An schematic of the physicalprinciples and the components inFASIC setup. The low-power, 635 CWlaser (L) illuminates the ocular surfaceat an incident angle of θ. The cMOScamera (C) is connected to a 1×objective lens (O) through an extendertube (E) captures the images at anobservation angle of β.
Molecular Vision 2011; 17:756-767 <http://www.molvis.org/molvis/v17/a86> © 2011 Molecular Vision
757
thickness analysis, the first 500 frames were analyzed. Thismeans that only the thickness data from 1 to 2 s following eyeopening were measured, and the data that were analyzedbelonged to 3 s following a blink; less than the average inter-blink interval. For subjects with approximately 3 s tear break-up time (TBUT), the data were analyzed such that the FASICmeasurement does not go over the TBUT.
Prior to the study, the system was calibrated usingparylene films fabricated on a silicon substrate. The thicknessobtained with the FASIC approach measured film thicknessaccurately compared against profilometer measurements.Using these films in the range of tear film thickness the FASICmethod demonstrated a coefficient of variation (COV) ofapproximately of 0.20 to 0.35% (4.92 and 2.90 μm thicknessstandards, respectively). In the human tear film, the COV wasmuch greater, ranging from about 6.7 to 13.1% for the non-dry eye and dry eye subjects, respectively (visit 1). However,this relatively small variability allowed meaningfuldifferences to be uncovered under the several test conditions.Spatial autocorrelation and physical principles: Spatialautocorrelation is a mathematical operation that measures andevaluates the degree of dependency of a set of data with itself.
Petersen et al. [17] pioneered the application of this statisticalanalysis to the imaging and microscopy community. Thespatial autocorrelation relationship is given by [17]:
Gs(ξ, ψ) =I (x, y)I (x + ξ, y + ψ) x ,y
I (x, y) x ,y2 − 1
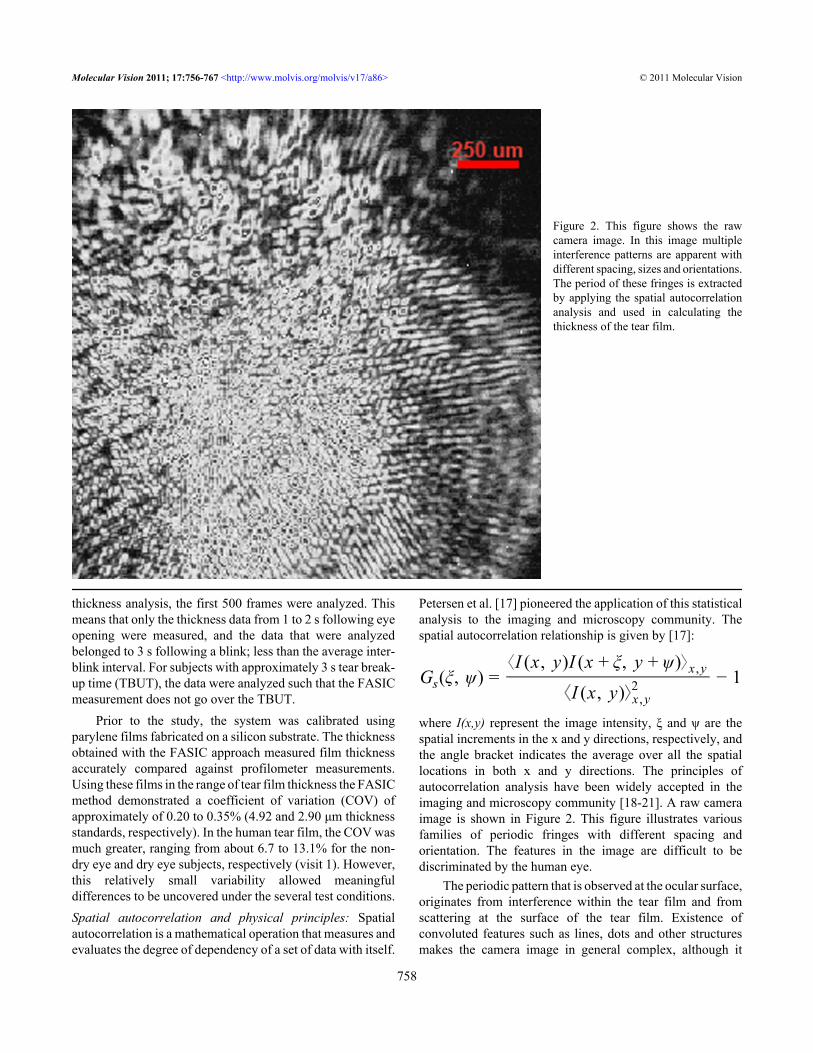
where I(x,y) represent the image intensity, ξ and ψ are thespatial increments in the x and y directions, respectively, andthe angle bracket indicates the average over all the spatiallocations in both x and y directions. The principles ofautocorrelation analysis have been widely accepted in theimaging and microscopy community [18-21]. A raw cameraimage is shown in Figure 2. This figure illustrates variousfamilies of periodic fringes with different spacing andorientation. The features in the image are difficult to bediscriminated by the human eye.
The periodic pattern that is observed at the ocular surface,originates from interference within the tear film and fromscattering at the surface of the tear film. Existence ofconvoluted features such as lines, dots and other structuresmakes the camera image in general complex, although it
Figure 2. This figure shows the rawcamera image. In this image multipleinterference patterns are apparent withdifferent spacing, sizes and orientations.The period of these fringes is extractedby applying the spatial autocorrelationanalysis and used in calculating thethickness of the tear film.
Molecular Vision 2011; 17:756-767 <http://www.molvis.org/molvis/v17/a86> © 2011 Molecular Vision
758
follows the basic dependency on tear film thickness. Thesecomplex features are not picked up by simple inspection ofthe images and therefore, the pattern is only analyzed in theautocorrelation function and after selecting the correctperiodic pattern. The factors affecting the periodic part of thespatial autocorrelation function have been experimentallydetermined and verified to depend on the inverse of thethickness of the film. In a previous work [15], it was shownthat the thickness then can be calculated by:
t = KnPsin (θ)
where n is the refractive index of the medium which isassumed to be 1.336 [22], and θ is the incident angle and K isa constant and was empirically obtained and includes thewavelength of the light as well. P is the period of the fringesavailable in the raw camera data which is calculated using theauto-correlation function (ACF).Human tear thickness studies:
Study population—Normal (non-dry eye) and dry eyesubjects were recruited by word of mouth and sourced fromthe existing dry eye database of the Southern CaliforniaCollege of Optometry (Fullerton, CA). Thus, this representeda clinic-based sample. Subjects were designated as not havingdry eye (normal) or having dry eye based on symptoms, tearstability, and corneal and/or conjunctival staining (see below).All subjects were 18 years of age or older. Major inclusioncriteria included the ability to return for the repeatability visitwithin 7±2 days and willingness to discontinue soft contactlens wear or the use of topical drops 2 days before eachmeasurement visit. Soft contact lens wearers were included,although it is not known whether lens wear affects tearthickness.
Major exclusion criteria included ocular surgery withinthe previous six months, evidence of active ocular infection,use of topical ocular medications other than artificial tears,rigid gas permeable contact lens wearers, and individuals withpunctual plugs. Normals, and dry eye subjects who were mild,moderate, or severe were enrolled. Severity was assignedbased on the worst sector corneal fluorescein staining gradeof any of the 10 sectors for either eye according to the Efronscale [23] during the eligibility visit.
All subjects enrolled in the study were advised not to usetopical eyedrops two days before each thicknessdetermination (initial and repeatability visit) and contact lenswearers were advised to discontinue lens wear for two daysbefore tear thickness determinations.
With the exception of the prohibition of pre-visit topicaleyedrops, the subjects were assessed concurrent with existingdry eye management, which could have included omega 3supplementation or use of the tetracycline drugs formeibomian gland dysfunction.Study procedures: Informed, written consent was obtainedbefore initiating any study procedures. This study adhered to
the tenets of the Declaration of Helsinki and was assignedclinical trial number NCT01014780.
Each subject had 3 visits to the clinic: an initial eligibilityand characterization visit, and two quantitative tear thicknessmeasurement visits with FASIC. The major experiments weretear thickness repeatability in normals and dry eye subjects,and a retention of effect study in the dry eye subjects using aviscous topical formulation (see below for details). Allsubjects were asked to return for a repeatability visit withinone week (7 days), ±2 days. Since there is diurnal variation inseveral tear parameters, including stability [24,25], we re-measured tear thickness within the same one-half day (i.e.,either morning or afternoon) as the initial assessment.
The subjects were classified as normal or having dry eyeat the eligibility visit using a battery of tests. A medical historywas taken, and dry eye symptoms were determined using theSchein questionnaire. Although there are several dry eyeinstruments available, we prefer the Schein survey since it israpid (taking about 1 min to answer and score), was validatedoriginally [26] and more recently in the modified form [27]against clinical diagnosis and has demonstrated repeatabilityin a treatment trial [28]. The original Schein questionnaire[26] was modified by adding a category of “never,” andassigning numerical values to each category (i.e., never=0;rarely=1, sometimes=2, often=3, all of the time=4). Thisallowed use of a semi-continuous numerical scale (0–24), forwhich a cut-point of 7 or greater for dry eye has beenestablished [27].
Fluorescein tear breakup time (TBUT) was undertakenusing liquid fluorescein (5.0 μl of 2.0% instilled using amicropipette) as part of the sequence used by Pflugfelder etal. [29] to assess TBUT, cornea staining and tear clearance.Although a historical breakpoint for fluorescein BUT has been<10 s [3,30] this criterion was reduced to <7 s by us for twomajor reasons.
First, the older studies used larger volumes of liquidfluorescein [31,32] and it has been demonstrated thatinstillation volume influences TBUT values [33]. Using5.0 μl of 2.0% dye, Pflugfelder et al. [29] and Abelson et al.[34] have found TBUT values for normals in the range of 7 s,and have used breakpoints for classifying subjects as “dry” of≤7 s. Moreover, Sullivan et al. [35] also using 5 μl of 2%sodium fluorescein, suggested a breakpoint of <7 s for a “dry”subject classification.
Another reason for the use of a TBUT breakpoint of ≤7.0s was that it represented a conservative value for inclusion ofdry subjects. Since this was a preliminary study, weendeavored to make certain that our dry breakpoint clearlydifferentiated normals from dry eye subjects, so that tearthickness differences, if present, would be observed.
We used a biomicroscope set at 16× and a yellow barrierfilter to enhance observation of the initial dark spot (definedas the first change following a normal blink). The subject was
Molecular Vision 2011; 17:756-767 <http://www.molvis.org/molvis/v17/a86> © 2011 Molecular Vision
759
instructed to blink normally three times, then to hold theeyelids open. Following the measurement, the eyelids wereclosed for 30 s, then the TBUT measured in the fellow eye.Each eye was measured three times in this alternating manner,and the mean value for each eye calculated.
Following TBUT determination, corneal staining wasassessed using the Efron scale [23],modified with a five-sectorcorneal overlay [30,36], the bio-microscope set at 16×magnification, and the use of a yellow barrier filter. Cornealstaining was graded using a 0–4 scale in 0.1 unit incrementsfor five zones for each cornea. The worst sector score and thetotal staining score (sum of 0–4 scores for each of five sectors)for each eye were recorded, similar to that advocated byAppendix 5 of the DEWS Diagnostic subcommittee report[37]. Rose bengal conjunctival staining was assessedaccording to the NEI/Industry Workshop report (6conjunctival zones), also using liquid dye [30] (3 μl of 1.0%non-preserved rose bengal instilled using a micropipette).
The criteria for determination of whether a subject haddry eye were as follows. At least 2 out of 3 criteria had to bemet. Schein symptom questionnaire; dry if scored >7 of 24maximum
• TBUT, average of three determinations; dry if ≤7 ssince several studies have found normal TBUTs of lessthan 10 s [4,34,38-40];
• Fluorescein corneal staining, five zones; dry if ≥4of 20 maximum (20%) OR rose bengal conjunctivalstaining, six zones (excludes cornea); dry is ≥4 of 24maximum (17%) [30]
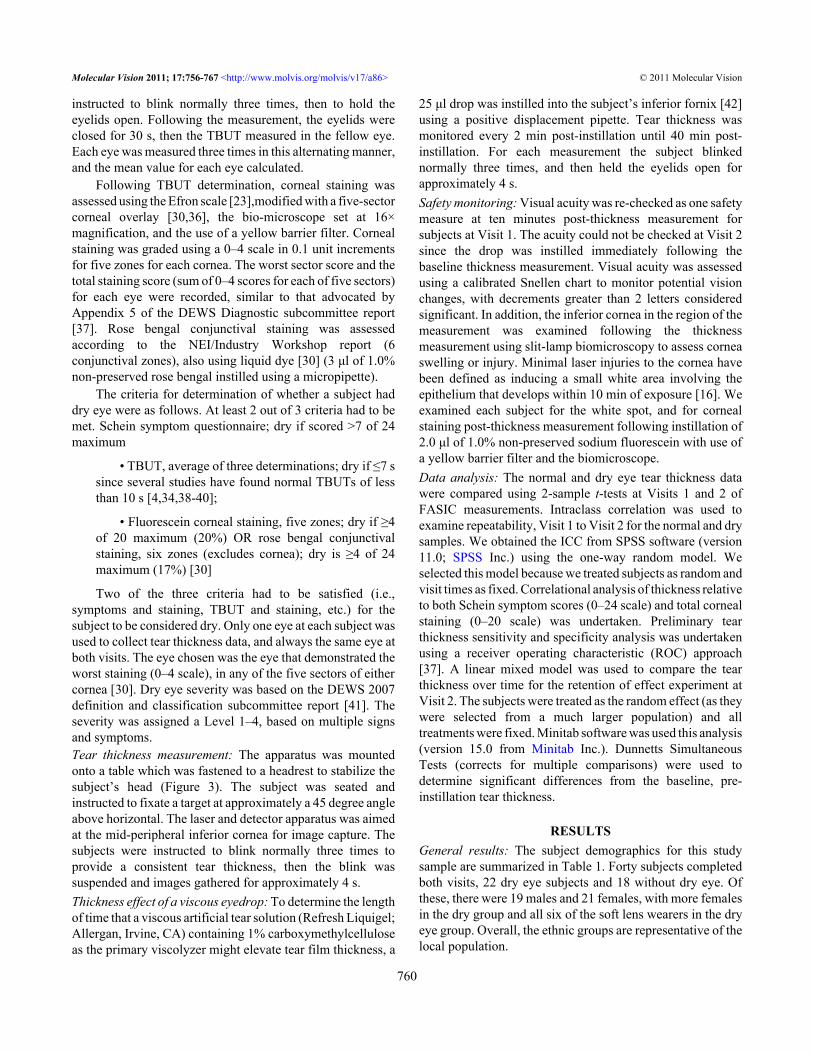
Two of the three criteria had to be satisfied (i.e.,symptoms and staining, TBUT and staining, etc.) for thesubject to be considered dry. Only one eye at each subject wasused to collect tear thickness data, and always the same eye atboth visits. The eye chosen was the eye that demonstrated theworst staining (0–4 scale), in any of the five sectors of eithercornea [30]. Dry eye severity was based on the DEWS 2007definition and classification subcommittee report [41]. Theseverity was assigned a Level 1–4, based on multiple signsand symptoms.Tear thickness measurement: The apparatus was mountedonto a table which was fastened to a headrest to stabilize thesubject’s head (Figure 3). The subject was seated andinstructed to fixate a target at approximately a 45 degree angleabove horizontal. The laser and detector apparatus was aimedat the mid-peripheral inferior cornea for image capture. Thesubjects were instructed to blink normally three times toprovide a consistent tear thickness, then the blink wassuspended and images gathered for approximately 4 s.Thickness effect of a viscous eyedrop: To determine the lengthof time that a viscous artificial tear solution (Refresh Liquigel;Allergan, Irvine, CA) containing 1% carboxymethylcelluloseas the primary viscolyzer might elevate tear film thickness, a
25 μl drop was instilled into the subject’s inferior fornix [42]using a positive displacement pipette. Tear thickness wasmonitored every 2 min post-instillation until 40 min post-instillation. For each measurement the subject blinkednormally three times, and then held the eyelids open forapproximately 4 s.Safety monitoring: Visual acuity was re-checked as one safetymeasure at ten minutes post-thickness measurement forsubjects at Visit 1. The acuity could not be checked at Visit 2since the drop was instilled immediately following thebaseline thickness measurement. Visual acuity was assessedusing a calibrated Snellen chart to monitor potential visionchanges, with decrements greater than 2 letters consideredsignificant. In addition, the inferior cornea in the region of themeasurement was examined following the thicknessmeasurement using slit-lamp biomicroscopy to assess corneaswelling or injury. Minimal laser injuries to the cornea havebeen defined as inducing a small white area involving theepithelium that develops within 10 min of exposure [16]. Weexamined each subject for the white spot, and for cornealstaining post-thickness measurement following instillation of2.0 μl of 1.0% non-preserved sodium fluorescein with use ofa yellow barrier filter and the biomicroscope.Data analysis: The normal and dry eye tear thickness datawere compared using 2-sample t-tests at Visits 1 and 2 ofFASIC measurements. Intraclass correlation was used toexamine repeatability, Visit 1 to Visit 2 for the normal and drysamples. We obtained the ICC from SPSS software (version11.0; SPSS Inc.) using the one-way random model. Weselected this model because we treated subjects as random andvisit times as fixed. Correlational analysis of thickness relativeto both Schein symptom scores (0–24 scale) and total cornealstaining (0–20 scale) was undertaken. Preliminary tearthickness sensitivity and specificity analysis was undertakenusing a receiver operating characteristic (ROC) approach[37]. A linear mixed model was used to compare the tearthickness over time for the retention of effect experiment atVisit 2. The subjects were treated as the random effect (as theywere selected from a much larger population) and alltreatments were fixed. Minitab software was used this analysis(version 15.0 from Minitab Inc.). Dunnetts SimultaneousTests (corrects for multiple comparisons) were used todetermine significant differences from the baseline, pre-instillation tear thickness.
RESULTSGeneral results: The subject demographics for this studysample are summarized in Table 1. Forty subjects completedboth visits, 22 dry eye subjects and 18 without dry eye. Ofthese, there were 19 males and 21 females, with more femalesin the dry group and all six of the soft lens wearers in the dryeye group. Overall, the ethnic groups are representative of thelocal population.
Molecular Vision 2011; 17:756-767 <http://www.molvis.org/molvis/v17/a86> © 2011 Molecular Vision
760
Summary tear film data are also included in Table 1.Relative to dry eye severity, based on worst sector fluoresceinstaining, the 22 dry eye subjects fell into groups of 3 at trace,14 who were mild, 5 moderate, and none in the severecategory.
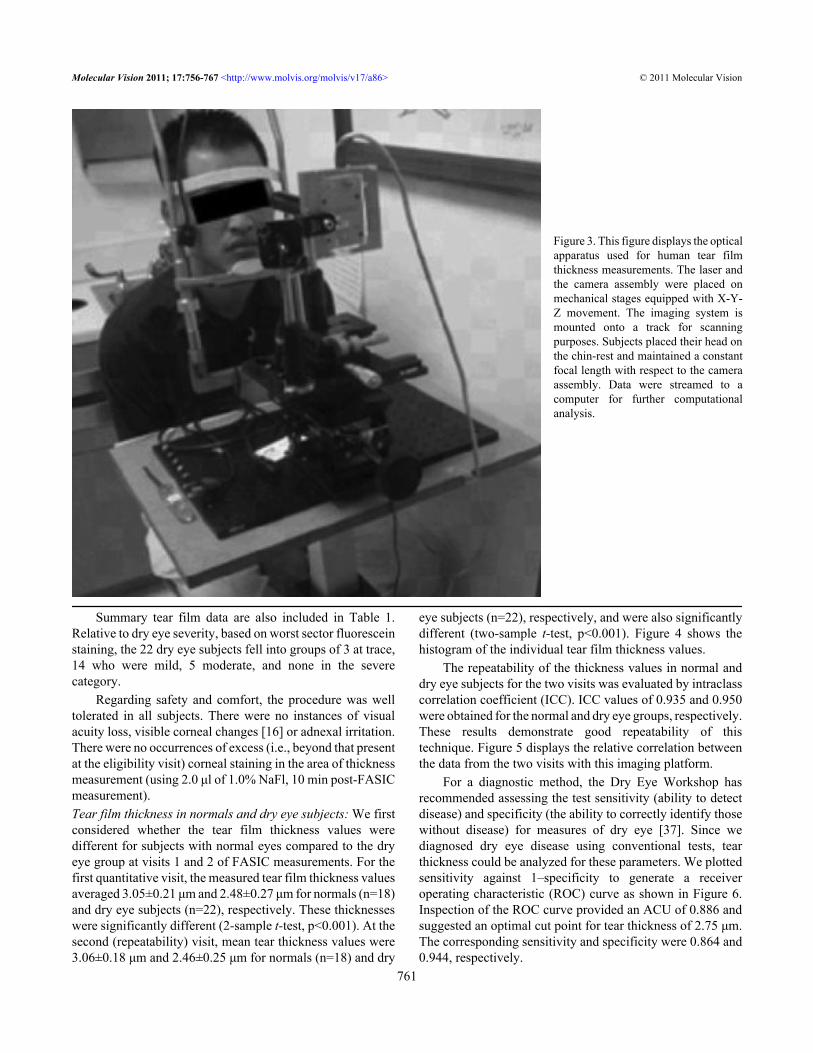
Regarding safety and comfort, the procedure was welltolerated in all subjects. There were no instances of visualacuity loss, visible corneal changes [16] or adnexal irritation.There were no occurrences of excess (i.e., beyond that presentat the eligibility visit) corneal staining in the area of thicknessmeasurement (using 2.0 μl of 1.0% NaFl, 10 min post-FASICmeasurement).Tear film thickness in normals and dry eye subjects: We firstconsidered whether the tear film thickness values weredifferent for subjects with normal eyes compared to the dryeye group at visits 1 and 2 of FASIC measurements. For thefirst quantitative visit, the measured tear film thickness valuesaveraged 3.05±0.21 μm and 2.48±0.27 μm for normals (n=18)and dry eye subjects (n=22), respectively. These thicknesseswere significantly different (2-sample t-test, p<0.001). At thesecond (repeatability) visit, mean tear thickness values were3.06±0.18 μm and 2.46±0.25 μm for normals (n=18) and dry
eye subjects (n=22), respectively, and were also significantlydifferent (two-sample t-test, p<0.001). Figure 4 shows thehistogram of the individual tear film thickness values.
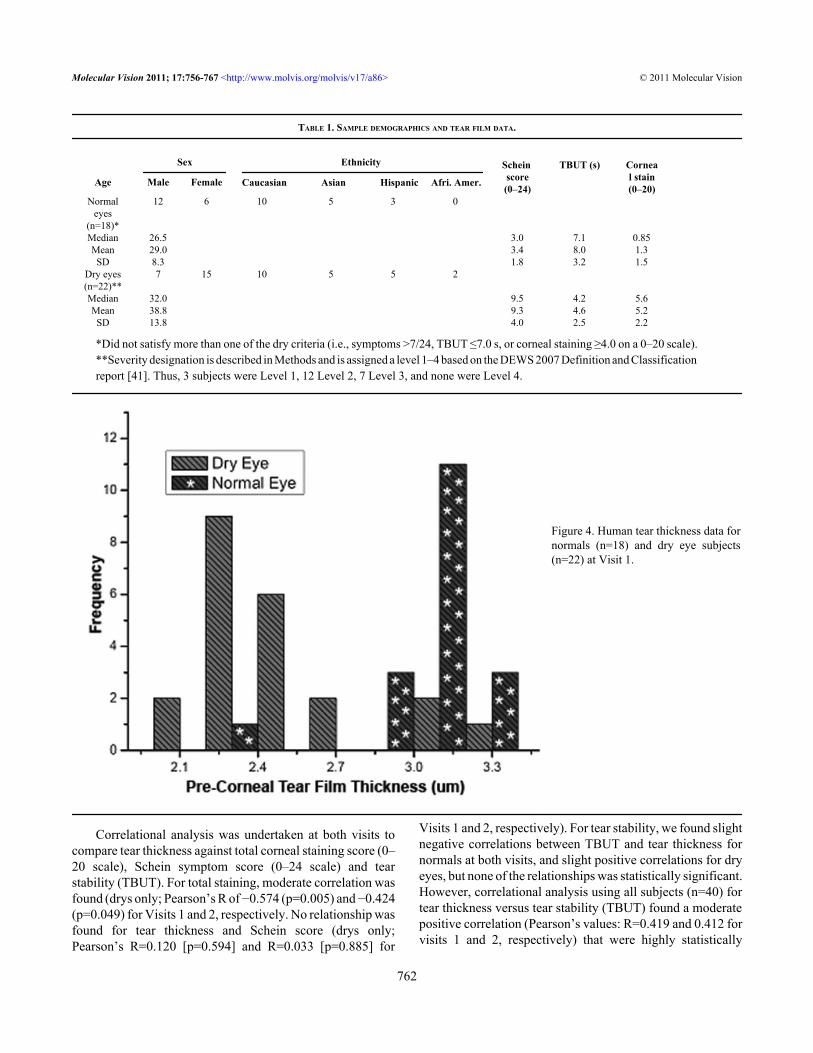
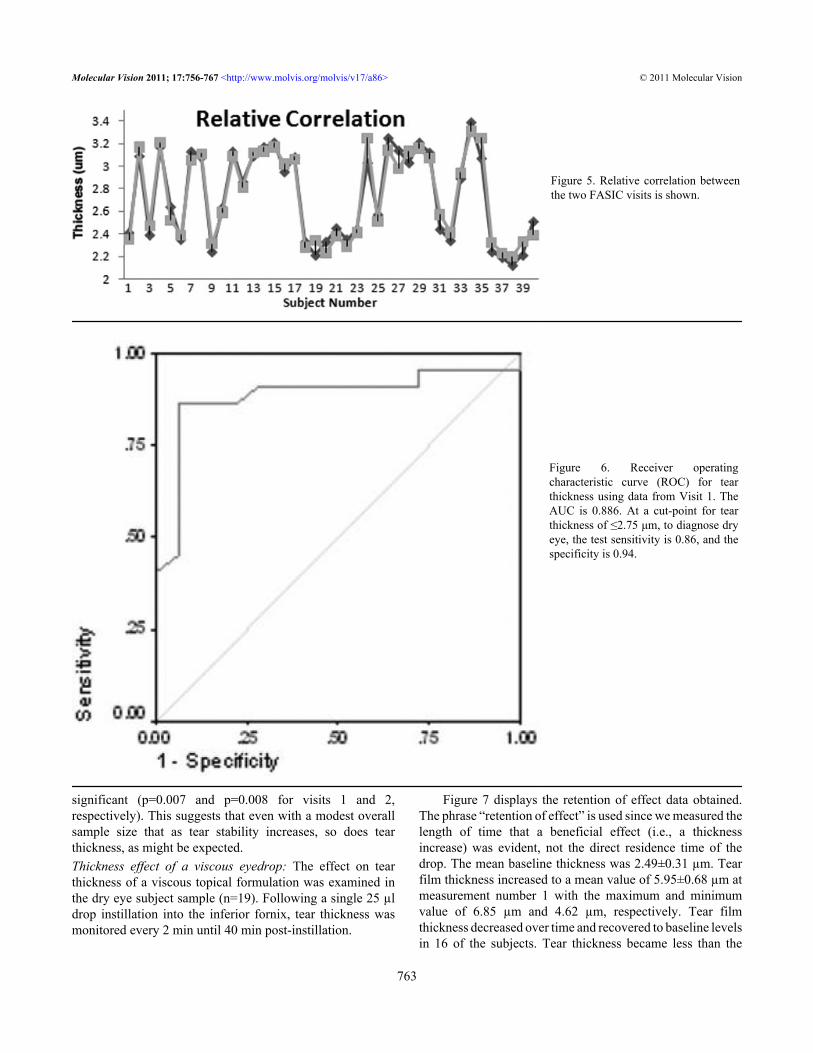
The repeatability of the thickness values in normal anddry eye subjects for the two visits was evaluated by intraclasscorrelation coefficient (ICC). ICC values of 0.935 and 0.950were obtained for the normal and dry eye groups, respectively.These results demonstrate good repeatability of thistechnique. Figure 5 displays the relative correlation betweenthe data from the two visits with this imaging platform.
For a diagnostic method, the Dry Eye Workshop hasrecommended assessing the test sensitivity (ability to detectdisease) and specificity (the ability to correctly identify thosewithout disease) for measures of dry eye [37]. Since wediagnosed dry eye disease using conventional tests, tearthickness could be analyzed for these parameters. We plottedsensitivity against 1–specificity to generate a receiveroperating characteristic (ROC) curve as shown in Figure 6.Inspection of the ROC curve provided an ACU of 0.886 andsuggested an optimal cut point for tear thickness of 2.75 μm.The corresponding sensitivity and specificity were 0.864 and0.944, respectively.
Figure 3. This figure displays the opticalapparatus used for human tear filmthickness measurements. The laser andthe camera assembly were placed onmechanical stages equipped with X-Y-Z movement. The imaging system ismounted onto a track for scanningpurposes. Subjects placed their head onthe chin-rest and maintained a constantfocal length with respect to the cameraassembly. Data were streamed to acomputer for further computationalanalysis.
Molecular Vision 2011; 17:756-767 <http://www.molvis.org/molvis/v17/a86> © 2011 Molecular Vision
761
Correlational analysis was undertaken at both visits tocompare tear thickness against total corneal staining score (0–20 scale), Schein symptom score (0–24 scale) and tearstability (TBUT). For total staining, moderate correlation wasfound (drys only; Pearson’s R of −0.574 (p=0.005) and −0.424(p=0.049) for Visits 1 and 2, respectively. No relationship wasfound for tear thickness and Schein score (drys only;Pearson’s R=0.120 [p=0.594] and R=0.033 [p=0.885] for
Visits 1 and 2, respectively). For tear stability, we found slightnegative correlations between TBUT and tear thickness fornormals at both visits, and slight positive correlations for dryeyes, but none of the relationships was statistically significant.However, correlational analysis using all subjects (n=40) fortear thickness versus tear stability (TBUT) found a moderatepositive correlation (Pearson’s values: R=0.419 and 0.412 forvisits 1 and 2, respectively) that were highly statistically
TABLE 1. SAMPLE DEMOGRAPHICS AND TEAR FILM DATA.
Sex Ethnicity
Age Male Female
Scheinscore(0–24)
TBUT (s) Corneal stain(0–20)
Normaleyes
(n=18)*
12 6 10 5 3 0
Median 26.5 3.0 7.1 0.85Mean 29.0 3.4 8.0 1.3SD 8.3 1.8 3.2 1.5
Dry eyes(n=22)**
7 15 10 5 5 2
Median 32.0 9.5 4.2 5.6Mean 38.8 9.3 4.6 5.2SD 13.8 4.0 2.5 2.2
*Did not satisfy more than one of the dry criteria (i.e., symptoms >7/24, TBUT ≤7.0 s, or corneal staining ≥4.0 on a 0–20 scale). **Severity designation is described in Methods and is assigned a level 1–4 based on the DEWS 2007 Definition and Classification report [41]. Thus, 3 subjects were Level 1, 12 Level 2, 7 Level 3, and none were Level 4.
Figure 4. Human tear thickness data fornormals (n=18) and dry eye subjects(n=22) at Visit 1.
Molecular Vision 2011; 17:756-767 <http://www.molvis.org/molvis/v17/a86> © 2011 Molecular Vision
762
Caucasian Asian Hispanic Afri. Amer.
significant (p=0.007 and p=0.008 for visits 1 and 2,respectively). This suggests that even with a modest overallsample size that as tear stability increases, so does tearthickness, as might be expected.Thickness effect of a viscous eyedrop: The effect on tearthickness of a viscous topical formulation was examined inthe dry eye subject sample (n=19). Following a single 25 µldrop instillation into the inferior fornix, tear thickness wasmonitored every 2 min until 40 min post-instillation.
Figure 7 displays the retention of effect data obtained.The phrase “retention of effect” is used since we measured thelength of time that a beneficial effect (i.e., a thicknessincrease) was evident, not the direct residence time of thedrop. The mean baseline thickness was 2.49±0.31 µm. Tearfilm thickness increased to a mean value of 5.95±0.68 µm atmeasurement number 1 with the maximum and minimumvalue of 6.85 µm and 4.62 µm, respectively. Tear filmthickness decreased over time and recovered to baseline levelsin 16 of the subjects. Tear thickness became less than the
Figure 5. Relative correlation betweenthe two FASIC visits is shown.
Figure 6. Receiver operatingcharacteristic curve (ROC) for tearthickness using data from Visit 1. TheAUC is 0.886. At a cut-point for tearthickness of ≤2.75 μm, to diagnose dryeye, the test sensitivity is 0.86, and thespecificity is 0.94.
Molecular Vision 2011; 17:756-767 <http://www.molvis.org/molvis/v17/a86> © 2011 Molecular Vision
763
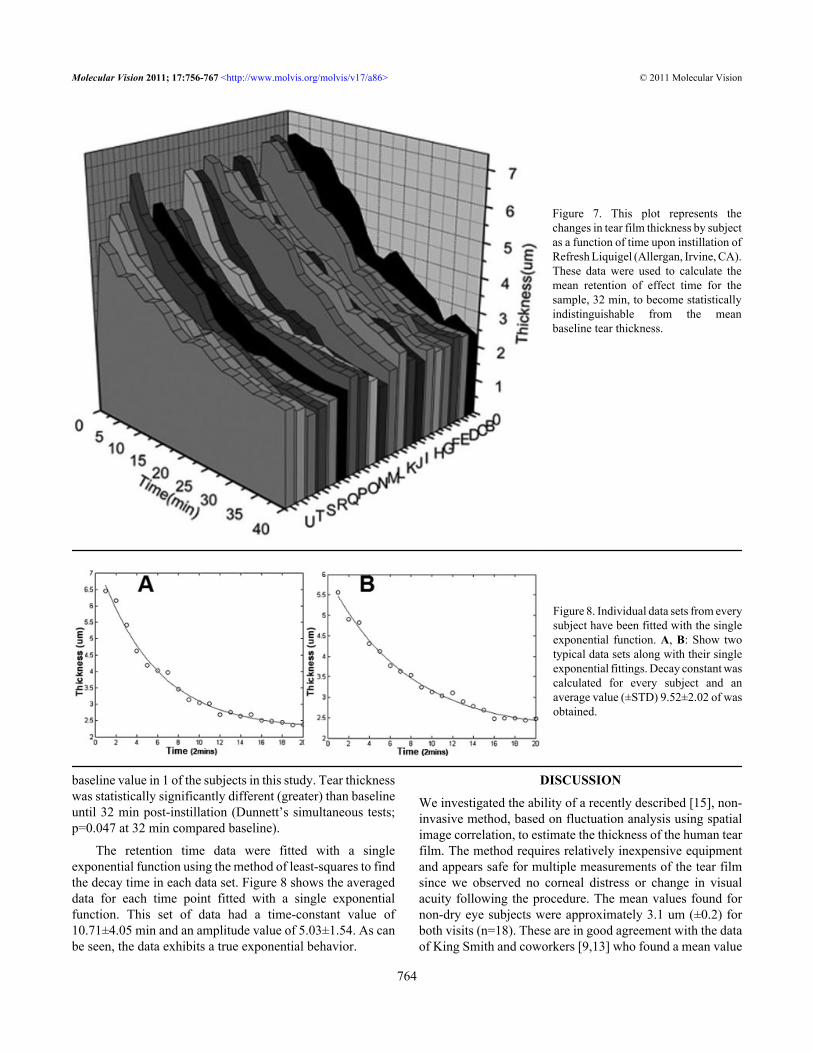
baseline value in 1 of the subjects in this study. Tear thicknesswas statistically significantly different (greater) than baselineuntil 32 min post-instillation (Dunnett’s simultaneous tests;p=0.047 at 32 min compared baseline).
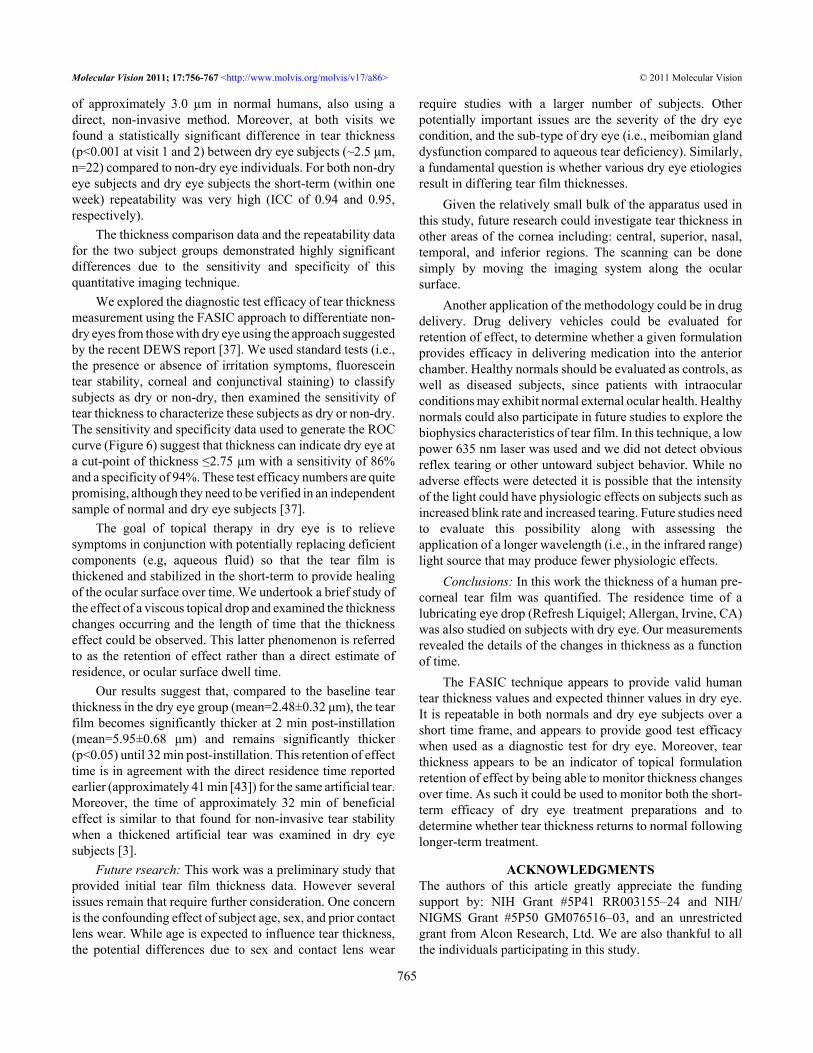
The retention time data were fitted with a singleexponential function using the method of least-squares to findthe decay time in each data set. Figure 8 shows the averageddata for each time point fitted with a single exponentialfunction. This set of data had a time-constant value of10.71±4.05 min and an amplitude value of 5.03±1.54. As canbe seen, the data exhibits a true exponential behavior.
DISCUSSION
We investigated the ability of a recently described [15], non-invasive method, based on fluctuation analysis using spatialimage correlation, to estimate the thickness of the human tearfilm. The method requires relatively inexpensive equipmentand appears safe for multiple measurements of the tear filmsince we observed no corneal distress or change in visualacuity following the procedure. The mean values found fornon-dry eye subjects were approximately 3.1 um (±0.2) forboth visits (n=18). These are in good agreement with the dataof King Smith and coworkers [9,13] who found a mean value
Figure 7. This plot represents thechanges in tear film thickness by subjectas a function of time upon instillation ofRefresh Liquigel (Allergan, Irvine, CA).These data were used to calculate themean retention of effect time for thesample, 32 min, to become statisticallyindistinguishable from the meanbaseline tear thickness.
Figure 8. Individual data sets from everysubject have been fitted with the singleexponential function. A, B: Show twotypical data sets along with their singleexponential fittings. Decay constant wascalculated for every subject and anaverage value (±STD) 9.52±2.02 of wasobtained.
Molecular Vision 2011; 17:756-767 <http://www.molvis.org/molvis/v17/a86> © 2011 Molecular Vision
764
of approximately 3.0 µm in normal humans, also using adirect, non-invasive method. Moreover, at both visits wefound a statistically significant difference in tear thickness(p<0.001 at visit 1 and 2) between dry eye subjects (~2.5 µm,n=22) compared to non-dry eye individuals. For both non-dryeye subjects and dry eye subjects the short-term (within oneweek) repeatability was very high (ICC of 0.94 and 0.95,respectively).
The thickness comparison data and the repeatability datafor the two subject groups demonstrated highly significantdifferences due to the sensitivity and specificity of thisquantitative imaging technique.
We explored the diagnostic test efficacy of tear thicknessmeasurement using the FASIC approach to differentiate non-dry eyes from those with dry eye using the approach suggestedby the recent DEWS report [37]. We used standard tests (i.e.,the presence or absence of irritation symptoms, fluoresceintear stability, corneal and conjunctival staining) to classifysubjects as dry or non-dry, then examined the sensitivity oftear thickness to characterize these subjects as dry or non-dry.The sensitivity and specificity data used to generate the ROCcurve (Figure 6) suggest that thickness can indicate dry eye ata cut-point of thickness ≤2.75 µm with a sensitivity of 86%and a specificity of 94%. These test efficacy numbers are quitepromising, although they need to be verified in an independentsample of normal and dry eye subjects [37].
The goal of topical therapy in dry eye is to relievesymptoms in conjunction with potentially replacing deficientcomponents (e.g, aqueous fluid) so that the tear film isthickened and stabilized in the short-term to provide healingof the ocular surface over time. We undertook a brief study ofthe effect of a viscous topical drop and examined the thicknesschanges occurring and the length of time that the thicknesseffect could be observed. This latter phenomenon is referredto as the retention of effect rather than a direct estimate ofresidence, or ocular surface dwell time.
Our results suggest that, compared to the baseline tearthickness in the dry eye group (mean=2.48±0.32 μm), the tearfilm becomes significantly thicker at 2 min post-instillation(mean=5.95±0.68 μm) and remains significantly thicker(p<0.05) until 32 min post-instillation. This retention of effecttime is in agreement with the direct residence time reportedearlier (approximately 41 min [43]) for the same artificial tear.Moreover, the time of approximately 32 min of beneficialeffect is similar to that found for non-invasive tear stabilitywhen a thickened artificial tear was examined in dry eyesubjects [3].
Future rsearch: This work was a preliminary study thatprovided initial tear film thickness data. However severalissues remain that require further consideration. One concernis the confounding effect of subject age, sex, and prior contactlens wear. While age is expected to influence tear thickness,the potential differences due to sex and contact lens wear
require studies with a larger number of subjects. Otherpotentially important issues are the severity of the dry eyecondition, and the sub-type of dry eye (i.e., meibomian glanddysfunction compared to aqueous tear deficiency). Similarly,a fundamental question is whether various dry eye etiologiesresult in differing tear film thicknesses.
Given the relatively small bulk of the apparatus used inthis study, future research could investigate tear thickness inother areas of the cornea including: central, superior, nasal,temporal, and inferior regions. The scanning can be donesimply by moving the imaging system along the ocularsurface.
Another application of the methodology could be in drugdelivery. Drug delivery vehicles could be evaluated forretention of effect, to determine whether a given formulationprovides efficacy in delivering medication into the anteriorchamber. Healthy normals should be evaluated as controls, aswell as diseased subjects, since patients with intraocularconditions may exhibit normal external ocular health. Healthynormals could also participate in future studies to explore thebiophysics characteristics of tear film. In this technique, a lowpower 635 nm laser was used and we did not detect obviousreflex tearing or other untoward subject behavior. While noadverse effects were detected it is possible that the intensityof the light could have physiologic effects on subjects such asincreased blink rate and increased tearing. Future studies needto evaluate this possibility along with assessing theapplication of a longer wavelength (i.e., in the infrared range)light source that may produce fewer physiologic effects.
Conclusions: In this work the thickness of a human pre-corneal tear film was quantified. The residence time of alubricating eye drop (Refresh Liquigel; Allergan, Irvine, CA)was also studied on subjects with dry eye. Our measurementsrevealed the details of the changes in thickness as a functionof time.
The FASIC technique appears to provide valid humantear thickness values and expected thinner values in dry eye.It is repeatable in both normals and dry eye subjects over ashort time frame, and appears to provide good test efficacywhen used as a diagnostic test for dry eye. Moreover, tearthickness appears to be an indicator of topical formulationretention of effect by being able to monitor thickness changesover time. As such it could be used to monitor both the short-term efficacy of dry eye treatment preparations and todetermine whether tear thickness returns to normal followinglonger-term treatment.
ACKNOWLEDGMENTSThe authors of this article greatly appreciate the fundingsupport by: NIH Grant #5P41 RR003155–24 and NIH/NIGMS Grant #5P50 GM076516–03, and an unrestrictedgrant from Alcon Research, Ltd. We are also thankful to allthe individuals participating in this study.
Molecular Vision 2011; 17:756-767 <http://www.molvis.org/molvis/v17/a86> © 2011 Molecular Vision
765
REFERENCES1. Lemp MA. Advances in Understanding and Managing Dry Eye
Disease. Am J Ophthalmol 2008; 146:350-6. [PMID:18599017]
2. The epidemiology of dry eye disease: report of theEpidemiology Subcommittee of the International Dry EyeWorkShop (2007). Ocul Surf 2007; 5:93-107. [PMID:17508117]
3. Mengher LS, Pandher KS, Bron AJ. Non-invasive tear filmbreakup time: sensitivity and specificity. Acta Ophthalmol(Copenh) 1986; 64:441-4. [PMID: 3776509]
4. de Paiva CS, Lindsey JL, Pflugfelder SC. Assessing the severityof keratitis sicca with videokeratoscopic indices.Ophthalmology 2003; 110:1102-9. [PMID: 12799233]
5. Korb DR, Baron DF, Herman JP, Finnemore VM, Exford JM,Hermosa JL, Leahy CD, Glonek T, Greiner JV. Tear film lipidlayer thickness as a function of blinking. Cornea 1994;13:354-9. [PMID: 7924337]
6. Goto E, Tseng SC. Differentiation of lipid tear deficiency dryeye by kinetic analysis of tear interference images. ArchOphthalmol 2003; 121:173-80. [PMID: 12583782]
7. King-Smith PE, Fink BA, Fogt N. Three interferometricmethods for measuring the thickness of layers of the tear film.Optom Vis Sci 1999; 76:19-32. [PMID: 10030612]
8. Cohen AJ, Mercandetti M, Brazzo B. The Lacrimal System;Diagnosis, Management, and Surgery. New York: Springer;2006.
9. King-Smith PE, Fink AB, Fogt N, Nichols KK, Hill RM, WilsonGS. The thickness of the human precorneal tear film: evidencefrom reflection spectra. Invest Ophthalmol Vis Sci 2000;41:3348-59. [PMID: 11006224]
10. Huang D, Swanson EA, Lin CP, Schuman JS, Stinson WG,Chang W, Hee MR, Flotte T, Gregory K, Puliafito KA.Optical coherence tomography. Science 1991; 254:1178-81.[PMID: 1957169]
11. Wang J, Aquavella J, Palakuru J, Chung S, Feng C.Relationships between central tear film thickness and tearmenisci of the upper and lower eyelids. Invest OphthalmolVis Sci 2006; 47:4349-55. [PMID: 17003425]
12. Wang J, Fonn D, Simpson TL, Jones L. Precorneal and Pre- andPostlens Tear Film Thickness Measured Indirectly withOptical Coherence Tomography. Invest Ophthalmol Vis Sci2003; 44:2524-8. [PMID: 12766052]
13. King-Smith PE, Fink BA, Hill RM, Koelling KW, Tiffany JM.The thickness of the tear film. Curr Eye Res 2004;29:357-68. [PMID: 15590483]
14. King-Smith PE, Fink BA, Nichols JJ, Nichols KK, Hill RM.Interferometric imaging of the full thickness of the precornealtear film. J Opt Soc Am A Opt Image Sci Vis 2006;23:2097-104. [PMID: 16912736]
15. Azartash K, Nein Shy C, Flynn K, Jester JV, Gratton E. Non-invasive in vivo measurement of the tear film using spatialautocorrelation in a live mammal model. Biomed Opt Express2010; 1:1127-37. [PMID: 21258535]
16. ANSI. ANSI Z136.1–2007, A.N.S.f.S.U.o. Lasers, Editor.2007, Laser Institute of America. p. 235.
17. Peterson NO. Scanning fluorescence correlation spectroscopy.Biophys J 1986; 49:809-15. [PMID: 3719067]
18. Digman MA, Gratton E. Analysis of diffusion and binding incells using the RICS approach. Microsc Res Tech 2009;72:323-32. [PMID: 19067357]
19. Digman MA, Brown CM, Sengupta P, Wiseman PW, HorwitzAR, Gratton E. Measuring Fast Dynamics in Solutions andCells with a Laser Scanning Microscope. Biophys J 2005;89:1317-27. [PMID: 15908582]
20. Digman MA, Gratton E. Imaging barriers to diffusion by paircorrelation functions. Biophys J 2009; 97:665-73. [PMID:19619481]
21. Wiseman PW. P.N., Image correlation spectroscopy. II.Optimization for ultransensitive detection or preexistingplatelet-derived growth factor-beta receptor oligomers onintact cells. Biophys J 1999; 76:963-77. [PMID: 9916027]
22. Dursun D, Monroy D, Knighton R, Tervo T, Vesaluoma M,Carraway K, Feuer W, Pflugfelder SC. The effects ofexperimental tear film removal on corneal surface regularityand barrier function. Ophthalmology 2000; 107:1754-60.[PMID: 10964840]
23. Efron N, Morgan PB, Katsara SS. Validation of grading scalesfor contact lens complications. Ophthalmic Physiol Opt 2001;21:17-29. [PMID: 11220037]
24. Patel S, Bevan R, Farrell J. Diurnal variation in tear filmstability. Am J Optom Physiol Opt 1988; 65:151-4. [PMID:3364523]
25. Webber WR, Jones D, Wright P. Fluorophotometricmeasurements of tear turnover rate in normal healthy persons-evidence for a circadian rhythm. Eye 1987; 1:615-20. [PMID:3446543]
26. Schein OD, Tielsch JM, Munoz MS, Bandeen-Roche K, WestS. Relation between signs and symptoms of dry eye in theelderly. Ophthalmology 1997; 104:1395-401. [PMID:9307632]
27. Paugh JR, Nguyen AL. Validation of the modified Schein dryeye questionnaire. ARVO Annual Meeting; 2006 April 30-May 4; Fort Lauderdale (FL).
28. Paugh JR, Shimabukuro K, Yu C, Nguyen AL. A preliminarystudy of the efficacy of the modified Schein dry eye symptomquestionnaire in a dry eye treatment trial. ARVO AnnualMeeting; 2007 May 6-10; Fort Lauderdale (FL).
29. Macri A, Rolando M, Pflugfelder S. A standardized visual scalefor evaluation of tear fluorescein clearance. Ophthalmology2000; 107:1338-43. [PMID: 10889108]
30. Lemp MA. Report of the National Eye Institute/Industryworkshop on Clinical Trials in Dry Eyes. CLAO J 1995;21:221-32. [PMID: 8565190]
31. Paschides CA, Kitsios G, Karakostas KX, Psillas C,Moutsopoulos HM. Evaluation of tear breakup time,Schirmer's-I test and rose bengal staining as confirmatorytests for keratoconjunctivitis sicca. Clin Exp Rheumatol 1989;7:155-7. [PMID: 2736828]
32. Vitale C, Moutsopoulos HM, Bombardieri S. The EuropeanCommunity Study Group on Diagnostic Criteria for Sjogren'sSyndrome. Sensitivity and specificity of tests for ocular andoral involvement in Sjogren's syndrome. Ann Rheum Dis1994; 53:637-47. [PMID: 7979575]
33. Johnson ME, Murphy P. The effect of instilled fluoresceinsolution volume on the values and repeatability of TBUTmeasurements. Cornea 2005; 24:811-7. [PMID: 16160497]
Molecular Vision 2011; 17:756-767 <http://www.molvis.org/molvis/v17/a86> © 2011 Molecular Vision
766
34. Abelson MB, Ousler GW, Nally LA, Welch D, Krenzer K.Alternative Reference Values for Tear Film Break-Up Timein Normal and Dry Eye Populations. In, Sullivan DA, editor.Advances in Experimental Medicine and Biology - LacrimalGland, Tear Film, and Dry Eye Syndromes 3: Basic Scienceand Clinical Relevance Part B. New York; 2002. p. 1121–1125.
35. Sullivan BD, Whitmer D, Nichols KK, Tomlinson A, FoulksGN, Geerling G, Pepose JS, Kosheleff V, Porreco A, LempMA. An objective approach to dry eye disease severity. InvestOphthalmol Vis Sci 2010; 51:6125-30. [PMID: 20631232]
36. Paugh JR, Marsden HJ, Edrington TB, DeLand PN, SimmonsPA, Vehige JG. A pre-application drop containingcarboxymethylcellulose can reduce multipurpose solution-induced corneal staining. Optom Vis Sci 2007; 84:65-71.[PMID: 17220780]
37. Methodologies to Diagnose and Monitor Dry Eye Disease:Report of the Diagnostic Methodology Subcommittee of theInternational Dry Eye WorkShop (2007). Ocul Surf 2007;5:108-52. [PMID: 17508118]
38. Cho P, Brown B. Review of the tear break-up time and a closerlook at the tear break-up time of Hong Kong Chinese. OptomVis Sci 1993; 70:30-8. [PMID: 8430006]
39. De Paiva CS, Chen Z, Koch DD, Hamill MB, Manuel FK,Hassan SS, Wilhelmus KR, Pflugfelder SC. The incidenceand risk factors for developing dry eye after myopic LASIK.Am J Ophthalmol 2006; 141:438-45. [PMID: 16490488]
40. Lam H, Bleiden L, de Paiva CS, Farley W, Stern ME,Pflugfelder SC. Tear cytokine profiles in dysfunctional tearsyndrome. Am J Ophthalmol 2009; 147:198-205. [PMID:18992869]
41. The definition and classification of dry eye disease: report ofthe definition and classification subcommittee of theinternational dry eye workshop. Ocul Surf 2007; 5:75-92.[PMID: 17508116]
42. Fraunfelder FT. Extraocular fluid dynamics: how best to applytopical ocular medication. Trans Am Ophthalmol Soc 1976;74:457-87. [PMID: 867636]
43. Paugh JR, Nguyen AL, Ketelson HA, Christensen MT,Meadows DL. Precorneal residence time of artificial tearsmeasured in dry eye subjects. Optom Vis Sci 2008;85:725-31. [PMID: 18677236]
Molecular Vision 2011; 17:756-767 <http://www.molvis.org/molvis/v17/a86> © 2011 Molecular Vision
Articles are provided courtesy of Emory University and the Zhongshan Ophthalmic Center, Sun Yat-sen University, P.R. China.The print version of this article was created on 17 March 2011. This reflects all typographical corrections and errata to the articlethrough that date. Details of any changes may be found in the online version of the article.
767