post gfc swot: melbourne’s north€¦ · institute of economic and industry research and provides...
TRANSCRIPT

© 2011 Melbourne’s Northern Economic Wedge Inc
POST GFC SWOT: MELBOURNE’S NORTH

2
Post GFC SWOT: Melbourne’s NorthA study commissioned by NORTH Link with support from the Northern Melbourne Regional Development Australia Committee. This report was prepared by National Institute of Economic and Industry Research and provides a detailed analysis of the impact of the GFC and each of the seven LGA’s. The report includes recommendations and benchmarks that will support growth and quality employment outcomes for the region into the future as it undergoes the transition into a knowledge economy.
ConsultantsNational Institute of Economic and Industry Research (NIEIR)
Carmine Consulting
Cover and LayoutI.D.Yours
Copyright © 2011Melbourne’s Northern Economic Wedge Inc, trading as NORTH Link.
This work may not be reproduced in whole or in part or sold without written permission of NORTH Link.
Requests should be forwarded to NORTH Link, PO Box 103, Coburg 3058 [email protected]
DisclaimerEvery effort has been made to ensure that this report is free from error or omission. The information contained in this report has been derived in good faith from sources believed to be reliable and accurate. However, neither NORTH Link nor NIEIR nor any persons involved in the preparation of this report accept any liability whatsoever for any actions taken based on its contents or information.
EnquiriesMr Mick ButeraExecutive Director, NORTH Linkc/- Institute for Advanced StudyLa Trobe UniversityMain Drive, BUNDOORA 3086Telephone: 03 9479 3337Facsimile: 03 9467 8310Email: [email protected]

3
Post GFC SWOT: Melbourne’s North
EXECUTIVE SUMMARY 5
1. MELBOURNE’S NORTH ECONOMIC UPDATE POST GFC 6 1.1 Introduction 6 1.2 Victoria after the GFC 6 1.3 Initial impact of the GFC on the Victorian labour market 6 1.4 About Melbourne’s North 6
2. STRATEGIC ISSUES 8 2.1 Manufacturing and employment 8 2.2 Automotive manufacturing industry – opportunities example 10 2.3 Automotive and associated manufacturing industry 10 2.4 Jobs and skills where future opportunities exist 10 2.5 Significance of Melbourne Airport 10 2.6 Relocation of the Wholesale Market 10 2.7 Cost of carbon and redefining Melbourne’s North 11 2.8 High speed internet 11 2.9 Housing affordability, greenfield developments and the importance of public transport 11 2.10 Education and knowledge economy 12 2.11 Percentage of households with bachelor or higher qualification, 2012 (as highest qualification) 13 2.12 Benefiting from internationalisation 13 2.13 Amenity and environment 14 2.14 Energy use considerations 14 2.15 Transport system considerations 14 2.16 Industry considerations 14
3. MELBOURNE’S NORTH: REGIONAL SWOT 15 3.1 Strengths 15 3.2 Weaknesses 15 3.3 Opportunities 15 3.4 Export opportunities 16 3.5 Threats 16
CONTENTS
PAGE NO.

4
4. THE REGION DESCRIBED 17 4.1 The region compared 17 4.2 Overall employment growth 22 4.3 Resident employment 24 4.4 Unemployment 25 4.5 NIEIR unemployment rate 25
5. COMMENTARY BY LGA 26 5.1 LGA growth areas post GFC 26 5.2 Banyule since the GFC 26 5.3 Darebin since the GFC 27 5.4 Hume since the GFC 27 5.5 Moreland since the GFC 28 5.6 Nillumbik since the GFC 28 5.7 Whittlesea since the GFC 29 5.8 Yarra since the GFC 29 5.9 Employment growth 30 5.10 Pre GFC place of work and resident employment growth 37 5.11 Post GFC place of work and resident employment growth 37
APPENDIX A: GROSS PRODUCT DEFINITION AND DATA SOURCES 39
APPENDIX B:REGIONAL SUMMARY TABLES MELBOURNE’S NORTH 40
APPENDIX C: MELBOURNE’S NORTH LGA TABLES 47
PAGE NO.
CONTENTS CONTINUED

5
Post GFC SWOT: Melbourne’s North
Future policies that build on the opportunities for regional growth in the post GFC environment include:
redefining Melbourne’s North as a carbon efficient economy and society through improved energy efficiency of buildings, communities and distance and transport to employment
ongoing development of the knowledge economy, including maximising the benefit of the NBN to the region
planning for the future skills of residents – a region of education and skills development with policies to assist lower skilled workers in employment towards a carbon efficient economy
positioning Melbourne’s North as a gateway to Melbourne with major assets including tertiary institutions, health developments, businesses, the rapidly developing Melbourne Airport, transport infrastructure and the newly locating Wholesale Markets and taking advantage of the opportunities in which these things can be better connected to create significant future growth
policies to continually improve amenity while maintaining some degree of housing affordability.
Summaries on trends in each of the LGAs since the GFC are included in section 5 of this document.
The global financial crisis (GFC) had a profound effect on economies at local, state, federal and global levels. As a result, economies are permanently altered and new attitudes are required to ensure that growth in the future occurs and is sustainable.
The GFC had specific implications for Melbourne’s North, which comprises the local government areas (LGAs) of Banyule, Darebin, Hume, Moreland, Nillumbik, Whittlesea and Yarra. Employment, particularly in manufacturing (notably the automotive sector) has been adversely affected.
However, the region is experiencing increasing dynamism through residential growth, improving skills of residents, business development, diversity and amenity. There has been employment growth at Melbourne Airport and the relocation of the Melbourne Wholesale Fruit and Vegetable Market and other major developments will provide additional opportunities.
Threats to the economic development of the region in the current environment have been identified as:
offshoring employment, particularly in manufacturing
continued hollowing out of manufacturing supply chains
low skill levels of some residents and increasing skill demands of local industry
carbon pricing adversely affecting regional competitiveness, particularly exports
impact of economic development of India and China, particularly on manufacturing
strength of the Australian dollar.
EXECUTIVE SUMMARY

6
1.1 IntroductionThis report describes the current economic circumstances of each of northern Melbourne’s LGAs and their economic progress since the GFC.
The GFC has permanently altered the economic dynamics of the world and Victorian economies and it is highly unlikely once the stimulus effects have faded that things will go back to the way they were. Unless the crisis is understood, it will not be possible to plan for a more sustainable (if more subdued) future prosperity.
Countries that have unsustainably relied on increased credit over the last two decades to drive growth will have to return to the fundamentals to drive growth, namely industry development, knowledge creation and the accumulation of physical and human capital. This is a slower, longer-term process with paybacks extending over decades rather than months. In addition economies like the US and Australia, which have combined high growth with high current account deficits and high foreign borrowings, will find that they will have to curtail growth to levels consistent with the reduced availability of global finance.
Overall world growth will be slower, generally in the range of 3 to 4 per cent, rather than in excess of 5 per cent as was the case from 2003 to 2008.
1.2 Victoria after the GFCFactors limiting Victoria’s economic growth are likely to be:
household debt deleveraging
high interest rates (relative to the rest of the world)
decline in local content of major resource projects and high Victorian excess capacity
future carbon price shock.
1.3 Initial impact of the GFC on the Victorian labour marketBetween June quarter 2008 and June quarter 2009, the following occurred in Victoria:
Victorian full time employment fell by 32,400, or 1.7 per cent
Victorian part time employment increased by 17,100, or 2.1 per cent
total weekly hours worked fell by 2.3 million, or 2.5 per cent
most of the loss of full time positions was in the 15 to 24 age segment
households become disadvantaged by increased numbers of dependents and reduced total real incomes
the NIEIR unemployment level increased by 40,000 (see 4.1 for an explanation of the NIEIR unemployment rate).
1.4 About Melbourne’s North Melbourne’s North is a highly diverse and dynamic region that covers the LGAs of Banyule, Darebin, Hume, Moreland, Nillumbik, Whittlesea and Yarra. Its inner areas are rapidly transitioning to knowledge economy and creative industry type development as manufacturing, logistics and warehousing activities grow in the outer areas.
Melbourne’s North is evolving from a manufacturing region towards a knowledge economy region in which high tech manufacturing has been retained and significant research hubs are being developed. The region’s diverse and increasingly skilled residents provide an opportunity for the growth and relocation of businesses.
Inner areas such as Yarra, Northcote and Brunswick are strongholds of arts and entertainment and there are a number of quality residential precincts, with significant developments planned. With increasing infrastructure and major assets such as Melbourne Airport, freight hubs, transport networks and the relocating wholesale markets, the growth potential for Melbourne’s North is high. Yet the region still retains large areas of its natural environment combined with strong lifestyle attributes.
MELBOURNE’S NORTH ECONOMIC UPDATE POST GFC1

Post GFC SWOT: Melbourne’s North
7
The continuing development of Activity Centres and Central Activities Districts (such as Broadmeadows in Hume) are reshaping the way in which Melbourne conducts its business and social activities. These initiatives are broadening the emphasis of future development, from growth driven by core city-centric activities to a locally integrated model of commercial, industrial and residential development, strengthening existing centres in the region as well as developing new centres for growth.
The economic development task will be to build on current resources, infrastructure, businesses and skills to create new regional opportunities.
Different areas, different images – the following map describes the diversity and strengths of Melbourne’s North.

8
2.1 Manufacturing and employmentThe GFC created challenges for regions around the globe. For Melbourne’s North and particularly the rapidly developing LGA of Hume, there has been a decline in manufacturing employment in industries such as automotive. Many job losses have occurred as part of a realignment of global strategies forced on large international companies by the GFC. It has been difficult for local policy makers to influence this trend, which is driven by the cheaper prices available in China and elsewhere in Asia. Car sales improved after the GFC but high petrol costs and changing lifestyles are having an impact on large car sales, the traditional manufacturing niche for Australian-based automotive manufacturers. Ford has announced more job cuts that will further affect manufacturing employment numbers in Melbourne’s North.
Retraining is now a regional issue, along with networks for retrenched workers to find equivalently skilled and paid work. The capacity to compete for new employment may also be an issue for some Hume residents because of the low level of skills in at least part of the population.
If there are major automotive manufacturing closures or downsizing of operations in the region while new jobs are being created in other parts of the manufacturing sector (food processing for example), stranding of the lowest skilled workers in casual work or long term structural unemployment remains an issue for both Hume and Whittlesea.
Table 2.1 gives the performance of the manufacturing sector in Melbourne’s North, Melbourne Statistical Division (SD) and Victoria between 1999 and 2010. For Melbourne’s North, the figures show a slight bounce-back in 2010 with the sector adding 1749 jobs in the year. This was not the case for the Melbourne SD, where job numbers declined overall.
Manufacturing sales, value add and exports also increased in Melbourne’s North in 2010. The reasons for this need further investigation but some of the improvement could be due to an increase in automotive manufacturing in the period after the GFC. Investment in the sector in Melbourne’s North has also held up reasonably well during and after the GFC period.
This section includes commentary on strategic issues that are likely to shape the future development of Melbourne’s North.
Table 2.1 Manufacturing
Region Sub Region Item Industry 1999 2000 2001 2002 2003 2004 2005 2006 2007 2008 2009 2010
Melbourne MN Value added at factor cost ($m cmv) C 5810 5980 5771 5703 5585 5702 5554 5392 5160 5115 4866 5073
Melbourne MN Sales ($m cmv) C 18090 18743 18224 18153 17915 18425 18095 17718 17120 17078 16318 17033
Melbourne MN Investment ($m cmv) C 47 74 101 98 99 115 135 149 141 199 203 185
Melbourne MN Export ($m cmv) C 10391 11596 11811 11869 11794 11467 10917 10641 10557 10964 10503 10914
Melbourne MN Employment C 67219 67316 67260 65636 63636 60707 59164 58193 57963 58089 56477 58226
Melbourne All Value added at factor cost ($m cmv) C 22730 23449 22626 22730 22661 23961 24057 24013 23695 24082 23015 22521
Melbourne All Sales ($m cmv) C 72655 75394 73257 74091 74070 78625 79244 79409 78823 80657 77461 75872
Melbourne All Investment ($m cmv) C 240 381 524 516 523 614 728 815 776 1098 1123 1014
Melbourne All Export ($m cmv) C 43765 47564 48468 49969 49778 50036 48966 48220 48230 51883 51285 49635
Melbourne All Employment C 261709 262557 262162 259979 256485 253285 254306 256912 262248 269294 266409 258512
VIC All Value added at factor cost ($m cmv) C 28072 28806 27847 28049 28403 30211 30421 30405 29985 29591 28077 28508
VIC All Sales ($m cmv) C 91788 94670 92094 93295 94719 101006 101980 102200 101235 100367 95620 97466
VIC All Investment ($m cmv) C 310 490 672 666 680 802 951 1062 1009 1422 1451 1311
VIC All Export ($m cmv) C 59716 62630 63081 65032 66033 66292 64645 63072 62432 64392 63210 65043
VIC All Employment C 324553 323916 324080 322340 323109 320653 322873 326899 331870 331950 326123 329099
STRATEGIC ISSUES
2
9
Post GFC SWOT: Melbourne’s North
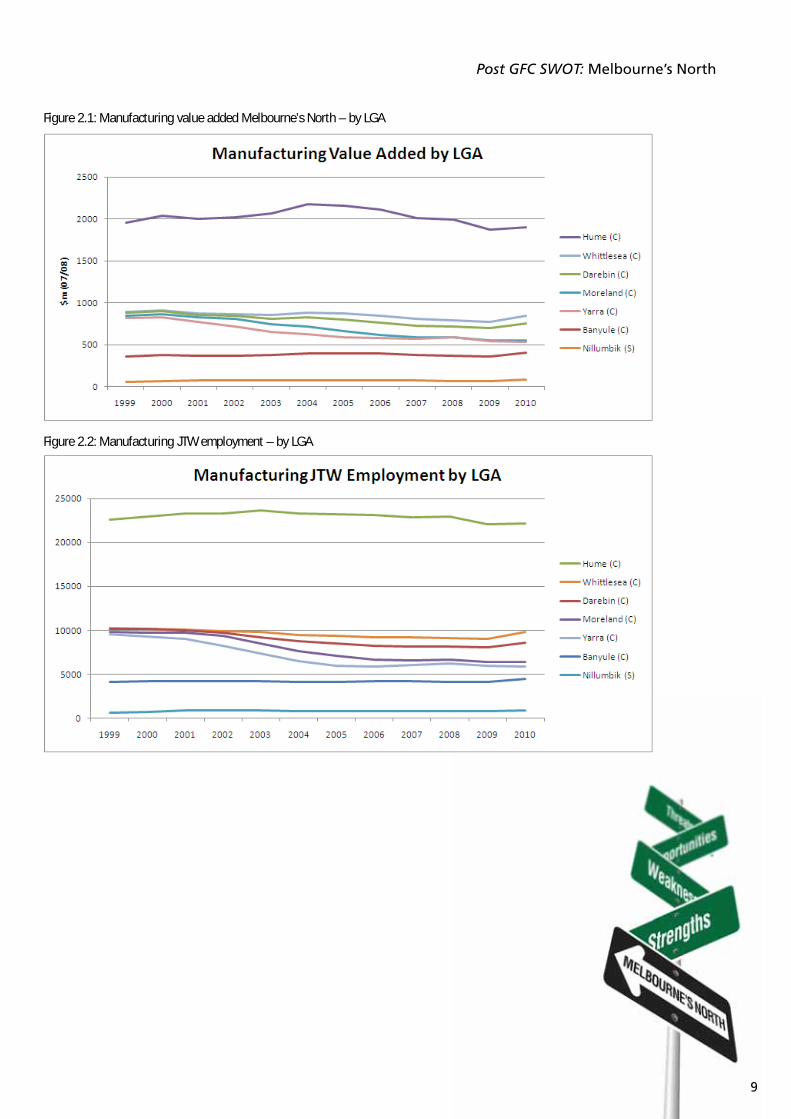
Figure 2.1: Manufacturing value added Melbourne’s North – by LGA
Figure 2.2: Manufacturing JTW employment – by LGA

10
2.2 Automotive manufacturing industry – opportunities example
Export of cars.
Export of components.
Growth of after-market firms (but not in manufacturing, growth would come from providing other kinds of services and sales of imported products).
Find niches in which Victorian industry can compete and create international markets.
Develop more intellectual property that is currently subject to international ownership; this is also an issue in terms of where the benefits flow.
Produce components and engines as part of a global supply chain. Ford focus is to develop what we have, making it more efficient and of a higher quality.
Value adding Australia’s primary production; aluminium is a good example of this.
Information technology development for transport and warehouse management.
Tier one suppliers as well as highly specialised lower tier suppliers to become global suppliers.
Government to increase the standards required in terms of the environment; use legislation to keep out components with poor environmental outcomes, such as the import of cheap exhaust systems for the after-market.
After-market firms have the capacity to innovate with new products for the local and export markets but not a lot of innovation, research and development is going on.
The development of alternative fuels technologies. Italy and South Korea are the leaders in LPG technology, ironic given that they do not have their own supplies of LPG. Engineering for different kinds of fuels is an opportunity in Australia.
2.3 Automotive and associated manufacturing industryGroups at risk of long term unemployment were identified as:
process workers
older workers
workers with poor literacy and numeracy, particularly English language skills.
2.4 Jobs and skills where future opportunities exist
Highly technical skills with problem solving capabilities.
Robotics skills – more technology and automation so more can go wrong.
Engineers across a range of automotive industry disciplines.
Designers.
CAD staff.
Product management and marketing.
Supervisors with a broad set of specialised skills.
Team leaders.
Hand welders.
Higher level production workers.
2.5 Signifi cance of Melbourne Airport Melbourne Airport employment continues to grow and provides major opportunity for further development in the region, particularly surrounding the airport. Many of the jobs created will be knowledge intensive and there are opportunities for innovation, research and education within the greater complex.
More than $1 billion in investment planned in next two years.
Employment for 12,500 people.
This equates to 11,000 full time equivalent positions.
Main employment areas are:
retail
aviation
air traffic control
air and road transport
airport management
security
hospitality.
Melbourne Airport experienced 22 per cent employment growth in the five years to 2008.
2.6 Relocation of the Wholesale MarketThe relocation of the Melbourne Wholesale Fruit and Vegetable Market, which should be considered as a major infrastructure project in its own right with more than $1 billion of planned investment in the redevelopment cycle over the next ten years, will provide a major benefit and ongoing opportunities for Melbourne’s North. The Wholesale Market currently has an annual turnover of more than $1.6 billion.
2 STRATEGIC ISSUES CONTINUED

11
Post GFC SWOT: Melbourne’s North
The rationale for the relocation of the Wholesale Market is to create a modern facility with improved access and a contemporary and integrated trading environment, greater opportunity for future development, and growth in a related cluster of developments within the new food precinct. These developments could include businesses that are concerned with logistics and distribution of fresh produce, associated processing and packaging, various trading and export related activities, and education and training.
2.7 Cost of carbon and redefi ning Melbourne’s NorthA long term issue for Melbourne’s North has been one of perception. Old and outmoded perceptions are hard to shift.
Is the image of the Melbourne’s North one that will attract high tech, globally connected and high value adding firms? How can the North’s image be redefined within a contemporary and forward looking economic context? Policies that help to redefine the region as a carbon efficient economy will enhance its future competitiveness and will be attractive to both new business and skilled residents.
Redefining the region’s image means:
efficient buildings (housing, commercial and industrial developments) that require less energy in daily use
efficient local communities where residents are close to employment or close to efficient modes of transport
appropriately skilled residents who can build and work in this environment
companies that can develop intellectual property to meet the needs of contemporary low carbon economies
industry that uses new technologies to reduce energy consumptions and carbon emissions
continually improving amenity and cultural and recreational opportunities for residents
solid links between the region’s businesses and tertiary and research centres
water efficient communities and internet enabled communities.
2.8 High speed internetOver the coming decades, high speed internet will result in significant structural change in the demand for occupations. More importantly, it will mean more flexibility in the location of jobs that service the requirements of the region. These changes will create an opportunity to strengthen the regional skills base in terms of a growing online economy.
Given the region’s educational and research infrastructure, the change will offer first mover advantage and an opportunity to define Melbourne’s North as a growing information economy.
2.9 Housing affordability, greenfi eld developments and the importance of public transportThe consequences of low dwelling construction rates are that the housing shortage is likely to increase, with consequences for all regions including Melbourne’s North.
High dwelling prices and rents in regions with good employment access (chiefly the inner and middle suburbs of the metropolitan cities) will reserve these regions for high-income earners and those with the luck to have inherited a house in the region.
These high-employment regions will also be characterised by increasing average household size, particularly when measured in numbers of adults per household. The increase will be due to adult children who have not left their parents’ home and the formation of group households of varying degrees of functionality. The only way in which low-income tenants not provided with social housing will be able to afford the rents will be by overcrowding and, given the economic incentives, this will be difficult to prevent.
At the other extreme, the population of regions with poor employment access will continue to increase as people are attracted to low-cost housing, particularly social security recipients who have given up hope of working.
The population living in marginal housing such as backyard caravans will also increase.
Higher levels of investment in transport, social and industry infrastructure and on community services will play a critical role in improving the level of accessible and affordable housing in Melbourne’s North.
In Melbourne there has been an overall reduction in the rate of dwelling construction, though not to the depressed Sydney levels. Strong growth in Melbourne’s outer south east had characterised the boom but faltered, and growth switched to Melbourne’s west. Further growth demand is forecast for Melbourne’s North.
There has been a premise that Melbourne’s North has pockets of housing affordability. As the region develops further, the likelihood of a continued decline in housing affordability is high, so it is important to consider housing affordability as a long term strategic issue.

12
The 2010 State of the Regions Report (NIEIR and ALGA) investigated housing affordability issues in Australia, and some aspects of this report are worth summarising. When greenfield sites are developed, a certain amount of local service employment can be guaranteed. But if residential value is to be created by local job generation, these service jobs must be complemented by employment that exports out of the local area.
In the post-war period that employment was most frequently provided by manufacturing. This was because manufacturing does not require the range of interpersonal contact that is the essence of the knowledge economy, and strongly appreciates the virtues of large, low-cost greenfield sites. Provided a labour supply was available within driving distance, manufacturers were attracted to these sites and decentralised to the urban fringes and provincial centres. An unintended consequence of the Australian Government decision (circa 1985) to cease supporting manufacturing industry was an increase in the difficulty of attracting new employment to metropolitan fringe and country locations. It is not that the knowledge economy necessarily favours city centres, but successful decentralisation of the knowledge economy requires investment in advanced telecommunications, transport and lifestyle support.
If the jobs will not come to the greenfields, the alternative is to link the fields to the jobs. Suitable greenfields are necessarily on the fringes of already-developed urban areas. Fields that are nowhere near existing employment nodes are too far from job locations for better transport to make a difference, while fields that already have high accessibility to jobs will be built up.
The strategy of creating residential value by transport investments is an old one. A century ago, the growth of commuter suburbs for Australia’s metropolitan areas was supported by state government investment in railways and tramways. In the second half of the twentieth century the states, though hampered by limited finance, attempted to do the same with radial roads. It took some time to realise the deficiencies of the radial-road policy – it takes large amounts of road space to carry significant flows of commuters and similarly large amounts of car-park space to house their vehicles once they get to the workplace. If the necessary road and parking space is not provided the result is congestion, which can only be relieved by widening the road at generally prohibitive cost in land purchases. (The recent Henry tax review says that congestion can be managed by appropriate tolls, but this is chiefly a means of rationing road space, not amplifying it to increase the flow of commuters. Large commuter flows can only efficiently be handled by rail.)
From the 1980s on, as the knowledge economy developed and the finance sector expanded, employment growth accelerated in the inner cities and decelerated on the metropolitan fringes. The insistence on roads as the preferred transport investment combined with high land costs and restricted budgets to seriously limit the expansion of transport capacity between fringe metropolitan greenfields and the regions where employment was growing.
It is only recently that attention has returned to rail investments, which have the capacity to handle large commuter flows without the multi-lane land requirements of roads. Perth was the first Australian metropolitan area to modernise operating practices on its suburban railways and add new lines, and now Melbourne shows signs of following suit. This is essential for the successful development of Melbourne’s North.
2.10 Education and knowledge economyThe Melbourne’s North: the new knowledge economy report discussed the importance of the knowledge economy and industry and research links to the region’s future development prospects. Issues and opportunities include:
equity in school education funding
accommodating students in the region
patents
incubators
building on the NBN – new media, digital economy, social media, film, audio, publishing
design and engineering exports
business services
medicine and social services
arts and culture.
2 STRATEGIC ISSUES CONTINUED

13
Post GFC SWOT: Melbourne’s North
2.11 Percentage of households with bachelor or higher qualifi cation, 2012 (as highest qualifi cation)The level of resident skills and qualifications are a strategic issue for some parts of the region.
2.12 Benefi ting from internationalisationThe 2006 census showed that the number of residents in Melbourne’s North who consider they are not proficient in spoken English had declined from 58,700 in 1996 to 55,000 in 2006.
However the proportion that speaks a language other than English increased, indicating that either individual migrants had improved their English skills between 1996 and 2006 or the newer arrivals have better English skills. It is likely to be a combination of both trends.

14
2.13 Amenity and environmentContinual improvement of amenities and environmental standards will assist Melbourne’s North in making the region the place to be for families and businesses, including:
design and architectural standards
housing for the future – building in regional competitiveness
high quality office accommodation
places to stay
industrial and commercial buildings – design, efficiency and co-generation
water supply and systems.
2.14 Energy use considerations Gas/electricity/oil.
Creating communities with local jobs.
Effective transport systems.
Alternative sources of energy.
Construction of energy efficient housing, commercial and industrial buildings
2.15 Transport system considerations
Rail.
Light rail.
Congestion in the inner parts of Melbourne’s North.
Airport and connectivity.
2.16 Industry considerations Wholesale markets.
Manufacturing – what is happening in Melbourne’s North?
Airport precinct.
Knowledge based exports, particularly education.
2 STRATEGIC ISSUES CONTINUED

Post GFC SWOT: Melbourne’s North
15
3.1 Strengths The region’s existing asset base can be leveraged to further
improve economic performance. Assets include Melbourne Airport, medical precincts, and colleges and universities. New assets such as the wholesale markets, freight hubs and master plan developments will add to existing opportunities.
A diverse economic base, development of which has managed to offset the decline of the manufacturing industry in the region.
A growing tertiary sector with developing research capacity.
The knowledge economy strengths of the inner areas combined with the industrial strengths of parts of the outer areas of the region.
The opportunity, because of redevelopment options in the inner areas and the available greenfield sites in the outer areas, to develop well planned and sustainable communities.
Melbourne’s North is a gateway to Melbourne with major transport links to the north and with Melbourne Airport providing access to interstate and international markets.
3.2 Weaknesses Inefficient and ineffective transport links reducing household
capacity for mobility in some parts of the region, including sparse road, rail, tram and bus links within a given employment catchment and especially to major employment nodes.
Historical perception – it is important to remind policy makers that the region has changed in terms of its amenity and capacity to provide local employment in a developing and diverse set of industries.
Level of household skills and the imbalance between skills demand of local industry when compared to resident skills. This is a critical policy issue and will drive the local economic outcomes and resident wellbeing for the former manufacturing zones within the region. Issues of skills imbalance also go beyond local industry. The region’s household skills mix will need to include residents with the capacity to access CBD
knowledge type employment, as this will assist the rapidly expanding cities of Hume and Whittlesea to provide improved business services to local industries as highly qualified individuals switch from CBD type employment to local employment when improved opportunities arise.
Relatively poor linkages between local enterprises and catchment enterprises and catchment industries making relatively poor use of catchment skills. This is a knowledge and information based issue requiring improved business and employment networks with improved communications and links.
Strategic drivers of regional productivity form supply chains oriented outside the catchment or are highly capital intensive with low value added ratios accruing to catchment residents. This requires more activity at a local level that generates local investment in research and innovation to create greater value adding opportunities and the capacity to retain profits in the region, rather than exporting them.
3.3 Opportunities In greenfield sites in outer parts of the region and
redevelopment areas in the inner parts of the region, to build in competitive advantage by creating sustainable housing and sustainable communities. That is, to create energy and water efficient buildings and local skilled employment opportunities.
Leverage regional assets to reduce regional inefficiencies.
To improve transport systems and in doing so lift regional productivity and amenity.
To improve supply chain efficiency and industry links, both internal and external to the region, by attracting export oriented enterprises to establish in the region and increasing knowledge intensity of local production to improve value adding ratios.
To build on the opportunities to diversify some of the region’s employment opportunities into emerging knowledge economy sectors.
MELBOURNE’S NORTH: REGIONAL SWOT3

16
Focus employment growth strategies and training efforts on growth sectors including some aspects of the manufacturing industry and regional assets including Melbourne Airport (aviation, transport and logistics), medical precincts and universities (research and commercialisation of intellectual property), wholesale markets (food processing and manufacturing, food logistics and exports) and niche education developments such as the aviation college.
3.4 Export opportunities Export of skills, such as design and engineering skills, business
services skills.
Export of intellectual property rights in bioscience, manufacturing, media, aerospace systems and technology, green technologies.
Export of specialist food items and manufactures.
Export of education and skills development.
Licensing of locally developed intellectual property such as inventions relating to climate change adaptation technologies or renewable energy.
3.5 Threats Offshoring of employment, particularly in the manufacturing
industry and particularly in the automotive manufacturing industry.
Continued hollowing out of manufacturing industry supply chains, creating future declines in this sector.
The low skill levels of residents in some parts of Melbourne’s North and increasing skills demands of local industry leading to long term structural unemployment and stranding of residents away from suitable employment nodes.
A carbon price shock damaging competitiveness of the region, particularly exports.
Lack of opportunity for local enterprises to access new business generated by the mining/energy export boom, particularly steel fabrication and engineering.
The impact of the economic development of India and China on the region and particularly manufacturing.
The strength of the Australian dollar and its impact on the region’s economic structure longer term.
3 MELBOURNE’S NORTH: REGIONAL SWOT CONTINUED

Post GFC SWOT: Melbourne’s North
17
4.1 The region comparedPopulationThe figure compares the annual population increase of Melbourne’s North, the Melbourne SD and Victoria. The figures show that, increasingly, Melbourne’s North is taking a greater share of Melbourne’s population growth.
Figure 4.1: Population growth
0
1,000,000
2,000,000
3,000,000
4,000,000
5,000,000
6,000,000
1999 2000 2001 2002 2003 2004 2005 2006 2007 2008 2009 2010
Melbourne's North
Melbourne SD
Victoria
Figure 4.2: Population share of growth increase
0.0%
0.5%
1.0%
1.5%
2.0%
2.5%
3.0%
2000 2001 2002 2003 2004 2005 2006 2007 2008 2009 2010
Melbourne's North
Melbourne SD
Victoria
THE REGION DESCRIBED
4

18
Growth in the number of householdsThe changing social composition of Melbourne’s North is reflected in the share of growth in the number of households.
Figure 4.3: Number of households – growth
0
500,000
1,000,000
1,500,000
2,000,000
1999 2000 2001 2002 2003 2004 2005 2006 2007 2008 2009 2010
Melbourne's North
Melbourne SD
Victoria
Figure 4.4: Number of households – share of growth increase
0.0%
0.5%
1.0%
1.5%
2.0%
2000 2001 2002 2003 2004 2005 2006 2007 2008 2009 2010
Melbourne's North
Melbourne SD
Victoria
Growth in resident employmentMelbourne’s North grew employment relatively strongly in 2010 when compared to Victoria and the Melbourne SD. The North’s employment bounced back more rapidly than in other Melbourne regions. In 2010, 22 per cent of Melbourne’s employed workforce lived in Melbourne’s North.
Figure 4.5: Growth in employment
0
500,000
1,000,000
1,500,000
2,000,000
2,500,000
3,000,000
1999 2000 2001 2002 2003 2004 2005 2006 2007 2008 2009 2010
Melbourne's North
Melbourne SD
Victoria
4 THE REGION DESCRIBED CONTINUED

Post GFC SWOT: Melbourne’s North
19
NIEIR unemployment rateFigure 4.6 shows the decline in resident unemployment in Melbourne’s North when compared to the Melbourne SD and Victoria. This is despite the region’s exposure to manufacturing employment and the corresponding manufacturing skills base of its traditional residents. The NIEIR unemployment rate includes a proportion of residents shifted to benefits other than the unemployment benefit.
Figure 4.6: Decline in NIEIR unemployment
0.0%
2.0%
4.0%
6.0%
8.0%
10.0%
12.0%
1999 2000 2001 2002 2003 2004 2005 2006 2007 2008 2009 2010
Melbourne's North
Melbourne SD
Victoria
For Melbourne’s North residents the figures show a significant decline in resident unemployment just prior to the GFC, and a slightly lower level of growth in unemployment post GFC when compared to the Melbourne SD and Victoria, restating the region’s relative resilience so far.
NIEIR structural resident unemployment rateStructural unemployment is the NIEIR estimate of unemployment including all those that could be and may wish to be workforce participants but are excluded because of barriers to employment such as low skills, language barriers and other forms of disadvantage that create long term disengagement from the workforce. Although the level of structural unemployment in Melbourne’s North has reduced, the level is still higher than the Melbourne SD and Victoria. This highlights the need for continuing education and reskilling of the most disadvantaged in the community.
Figure 4.7: Structural unemployment rate
0.0%2.0%4.0%6.0%8.0%
10.0%12.0%14.0%
1999 2000 2001 2002 2003 2004 2005 2006 2007 2008 2009 2010
Melbourne's North
Melbourne SD
Victoria

20
Headline unemployment rateThe headline unemployment rate confirms the decline in overall unemployment in Melbourne’s North.
Figure 4.8: Headline unemployment rate
0.0%
2.0%
4.0%
6.0%
8.0%
10.0%
1999 2000 2001 2002 2003 2004 2005 2006 2007 2008 2009 2010
Melbourne's North
Melbourne SD
Victoria
Resident employment growth by sector Figure 4.9 shows the growth in employment by sector for residents from Melbourne’s North, including the period after the GFC. Longer term growth occurred in construction, electricity gas and water, accommodation, information media and telecoms, rent hire and real estate services, professional scientific and technical services, education and training, manufacturing, health and social services, and art and recreation services. There is a decline in manufacturing employment for people living in Melbourne’s North. Post GFC there were noticeable declines in the financial services sector and wholesale. Accommodation and other services performed particularly well post GFC.
A Agriculture
B Mining
C Manufacturing
D Electricity, gas and water
E Construction
F Wholesale
G Retail
H Accommodation
I Transport, postal and warehousing
J Information media and telecommunications
K Financial and insurance services
L Rent, hire and real estate services
M Professional, scientific and technical services
N Administration and support services
O Public administration
P Education and training
Q Health and social
R Arts and recreation services
S Other services
Figure 4.9: Melbourne’s North annual growth – residential employment
4 THE REGION DESCRIBED CONTINUED
Post GFC SWOT: Melbourne’s North
21
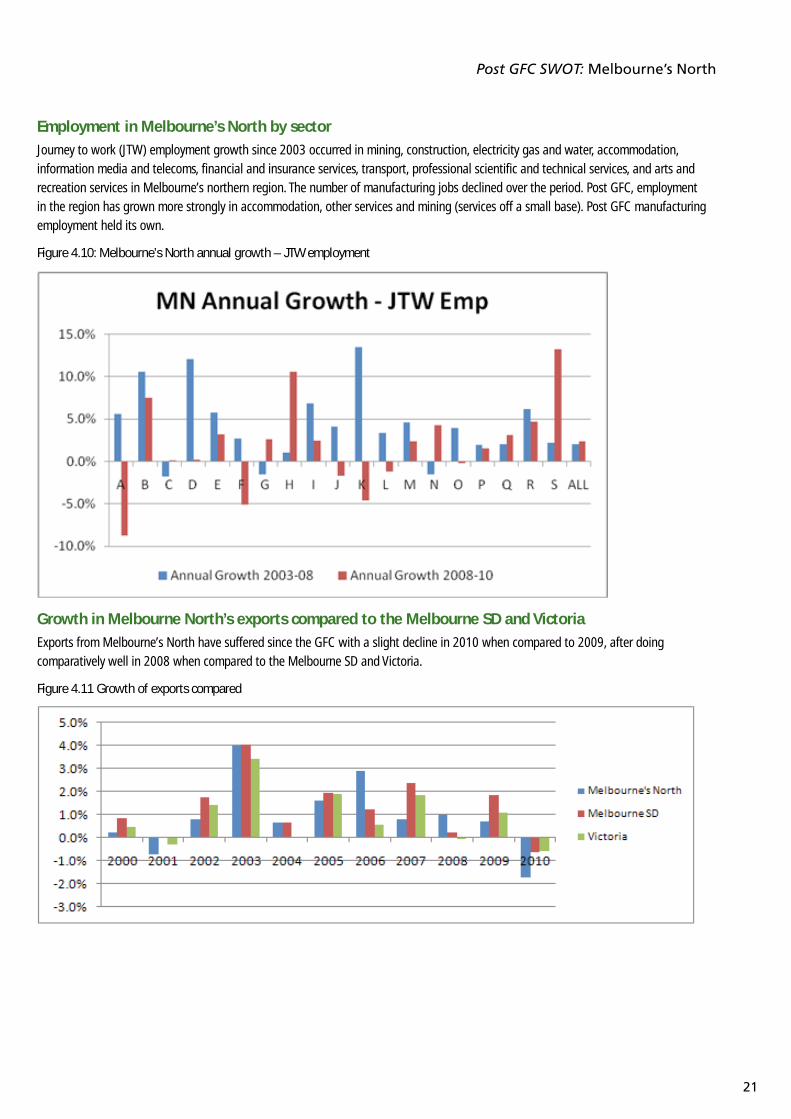
Employment in Melbourne’s North by sector Journey to work (JTW) employment growth since 2003 occurred in mining, construction, electricity gas and water, accommodation, information media and telecoms, financial and insurance services, transport, professional scientific and technical services, and arts and recreation services in Melbourne’s northern region. The number of manufacturing jobs declined over the period. Post GFC, employment in the region has grown more strongly in accommodation, other services and mining (services off a small base). Post GFC manufacturing employment held its own.
Figure 4.10: Melbourne’s North annual growth – JTW employment
Growth in Melbourne North’s exports compared to the Melbourne SD and VictoriaExports from Melbourne’s North have suffered since the GFC with a slight decline in 2010 when compared to 2009, after doing comparatively well in 2008 when compared to the Melbourne SD and Victoria.
Figure 4.11 Growth of exports compared
22
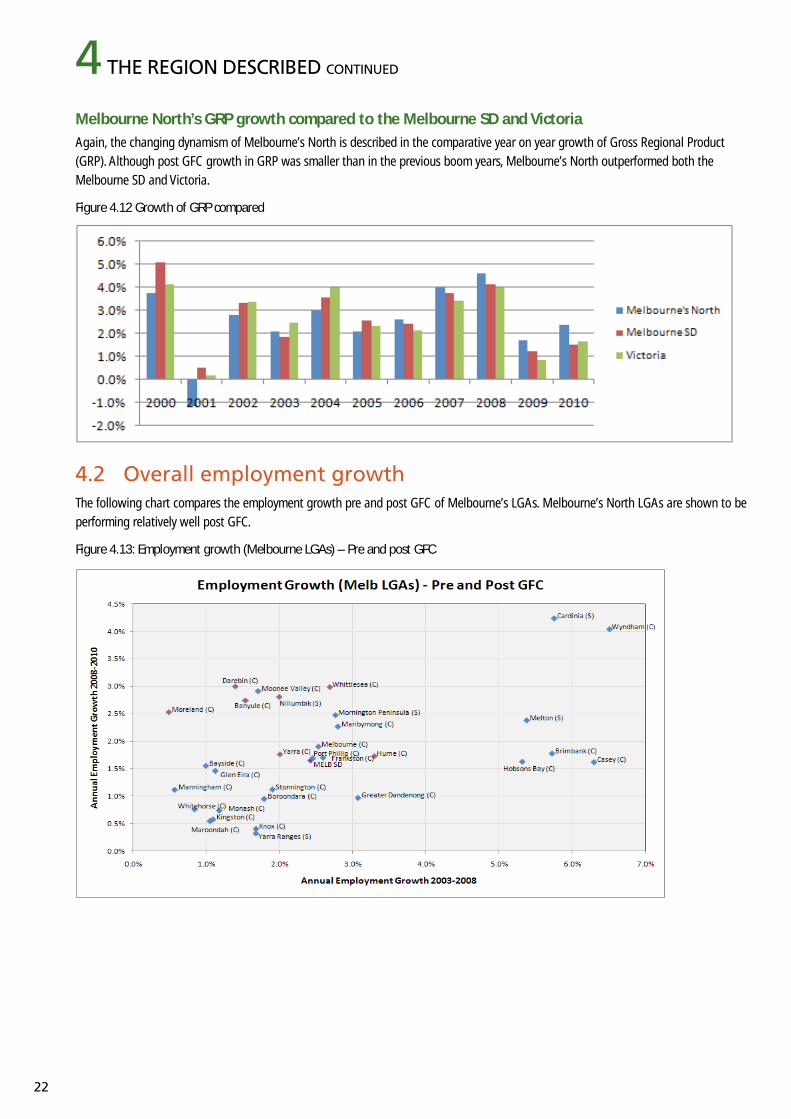
Melbourne North’s GRP growth compared to the Melbourne SD and VictoriaAgain, the changing dynamism of Melbourne’s North is described in the comparative year on year growth of Gross Regional Product (GRP). Although post GFC growth in GRP was smaller than in the previous boom years, Melbourne’s North outperformed both the Melbourne SD and Victoria.
Figure 4.12 Growth of GRP compared
4.2 Overall employment growthThe following chart compares the employment growth pre and post GFC of Melbourne’s LGAs. Melbourne’s North LGAs are shown to be performing relatively well post GFC.
Figure 4.13: Employment growth (Melbourne LGAs) – Pre and post GFC
4 THE REGION DESCRIBED CONTINUED

23
Post GFC SWOT: Melbourne’s North
A recent comparison of Melbourne’s RDA regions showed the following information.
Population Western Melbourne is the fastest growing region, averaging
3.6 per cent per annum.
Southern Melbourne has 33 per cent of Melbourne’s population.
Melbourne East has 25 per cent of Melbourne’s population.
Northern Melbourne has 22 per cent of Melbourne’s population.
Western Melbourne has 20 per cent of Melbourne’s population.
Age profi le The proportion of the population aged 0 to 19 years is
declining in all regions.
There has been a rise in the actual numbers in the 0 to 19 years group in all regions except Melbourne East.
Similarly, the growth in the 20 to 29 year age group has not been as fast as population growth in Northern Melbourne, Southern Melbourne and Melbourne East.
The 20 to 54 year age group grew as a proportion of total population in all regions except Melbourne East.
All regions have an increasing proportion and increasing actual numbers of people in the 55 years and over age group.
Workforce Western Melbourne has the fastest growing workforce,
averaging 3.6 per cent per annum over the last 5 years.
Southern Melbourne has the largest workforce, currently 735,000 or 33 per cent of Melbourne Metro.
The smallest workforce is in Western Melbourne, with 439,000 or 20 per cent of Melbourne Metro.
Employment Western Melbourne has the fastest growing employment and
Melbourne East the slowest growing.
33 per cent of Melbourne’s employed live in Southern Melbourne, 26 per cent in Melbourne East, 22 per cent in Northern Melbourne and 19 per cent in Western Melbourne.
670,000 residents of Southern Melbourne are employed and 398,000 residents of Western Melbourne are employed.
Wages and salaries Wages are highest in Melbourne East and Southern
Melbourne, with average wage and salary incomes per capita of $25,618 and $24,249 per annum.
Average wages and salaries have declined since the GFC, due in part to less paid hours being worked.
Benefi ts The regions with the highest proportion of income coming
from Government Benefits are Western Melbourne at 14.3 per cent and Northern Melbourne at 13.8 per cent.
The regions with the lowest proportion are Melbourne East at 10.4 per cent and Southern Melbourne at 11.6 per cent.
Northern Melbourne has a higher than average proportion of people on Disability Support Pensions (age 25+), and Long Term Unemployed, but lower than average on Parenting Payment Single and Non-Student Youth Allowance.
Melbourne East and Southern Melbourne have lower than average proportions of the population on all Allowances with the exception of the Student Youth Allowance.
Western Melbourne has a higher than average proportion of the population receiving Disability Support (15-20year olds), Parenting Payment Single (age 21+), Long Term and Short Term Unemployed and Youth Allowance Student.
Disposable income The regions with the highest disposable income per capita are
Melbourne East $33,300 per annum and Southern Melbourne $32,900 per annum.
The regions with the lowest disposable income per capita are Western Melbourne $29,800 per annum and Northern Melbourne $30,900 per annum.
Patent applications Patent applications per 100,000 capita are a measure of the
relative levels of innovation in a community.
Melbourne East, Southern Melbourne and Western Melbourne all have average patents per capita higher than the Australian average.
NIEIR unemployment This measure of unemployment includes an adjustment for
any excess recipients of disability payments, i.e. where the number of people on disability payments increases at a rate faster than expected by population growth.
Before 2008, all regions except Southern Melbourne were experiencing a decline in NIEIR unemployment.
After 2008, all regions except Melbourne’s North are experiencing an increase in NIEIR unemployment reflecting the slowdown due to the GFC.

24
Unemployment rates Trends in the NIEIR unemployment rate indicate that unemployment is the highest in Western Melbourne and lowest in Melbourne’s
North and Melbourne East.
Headline unemployment is highest in Western Melbourne and lowest in Northern Melbourne.
Structural unemployment (which is an indicator of those least able to find work, such as the long term unemployed and those on disability allowance) is highest in Western and Northern Melbourne and lowest in Melbourne East.
JTW employment by LGAEmployment provided in each LGA in Melbourne’s North has increased over the period 1996 to 2010. Hume and Yarra have grown employment the most at around 3 per cent per annum, while Moreland has grown employment the least at .34 per cent per annum.
Figure 4.14: Total JTW employment by LGA
0
10000
20000
30000
40000
50000
60000
70000
80000
90000
100000
Total JTW Employment by LGA
le (C)
in (C)
(C)
and (C)
bik (S)
( )
4.3 Resident employmentResident employment (employment of those living in an LGA) has risen in all of the region’s LGAs, the highest growth occurring in Yarra at 3 per cent per annum and Hume at 2.8 per cent per annum.
Figure 4.15: Total resident employment by LGA
0
10000
20000
30000
40000
50000
60000
70000
80000
90000
Total Resident Employment by LGA
le (C)
in (C)
(C)
and (C)
bik (S)
( )
4 THE REGION DESCRIBED CONTINUED

25
Post GFC SWOT: Melbourne’s North
4.4 UnemploymentHume has the highest number of unemployed. This number continues to grow and indicates some degree of stranding of low skilled workers. Darebin has reduced its unemployed residents the most.
Figure 4.16: NIEIR unemployment rate by LGA
0
2000
4000
6000
8000
10000
12000
1998 1999 2000 2001 2002 2003 2004 2005 2006 2007 2008 2009 2010
NIEIR Unemployment by LGA
Banyule (C)
Darebin (C)
Hume (C)
Moreland (C)
Nillumbik (S)
Whittlesea (C)
Yarra (C)
4.5 NIEIR unemployment rateFigure 4.17: NIEIR unemployment rate by LGA
0%
2%
4%
6%
8%
10%
12%
14%
16%
1996 1997 1998 1999 2000 2001 2002 2003 2004 2005 2006 2007 2008 2009 2010
NIEIR Unemployment Rate by LGA
Banyule (C)
Darebin (C)
Hume (C)
Moreland (C)
Nillumbik (S)
Whittlesea (C)
Yarra (C)

26
5.1 LGA growth areas post GFCBanyule
Other services
Accommodation and food services
Retail
Construction
Manufacturing
Administrative and support services
Darebin Other services
Accommodation and food services
Administrative and support services
Retail
Construction
Manufacturing
Hume Accommodation and food services
Other services
Professional, scientific and technical services
Yarra Transport, postal and warehousing
Health care and social assistance
Moreland Accommodation and food services
Other services
Transport, postal and warehousing
Professional, scientific and technical services
Information media and telecoms
Nillumbik Other services
Accommodation and food services
Retail
Manufacturing
Administrative and support services
Whittlesea Other services
Accommodation and food services
Retail
Construction
Manufacturing
Administrative and support services
5.2 Banyule since the GFC Unemployment rate has increased slightly from a low of 3.1
per cent (NIEIR 5 per cent) in 2007 to 3.4 per cent (NIEIR 5.3 in 2010). Banyule residents have been successful in maintaining employment.
The workforce has continued to grow.
Wages and salaries are actually slightly up on the 2007 number, so local spending power has been sustained. Disposable income is slightly higher in 2010 than it was in 2007.
Benefits paid in 2010 were lower than in 2007.
Business income is higher in 2010 than it was in 2007.
All categories of social security income were below the Australian average in 2010.
Banyule’s population is growing fastest in terms of overall numbers in the 30-54 age group; the 0-19 year old population is declining the fastest and the rate of decline appears to be increasing.
Banyule’s households have continued to grow richer and household debt to gross income has continued to increase between 2007 and 2010.
Residential building construction value was lower in 2010 than it was in 2007. This may relate to housing affordability issues.
Non-residential construction value was higher in 2010 than it was in 2007.
The following section provides LGA level data and a commentary on the economic circumstances of each of the region’s LGAs.
COMMENTARY BY LGA
5

27
Post GFC SWOT: Melbourne’s North
Resident consumption continues to grow overall.
Resident hours worked has continued to grow and was higher in 2010 than it was in 2007; total resident income was also higher.
The numbers of hours worked in Banyule also increased.
Between 2006 and 2010, resident employment rose from 64,000 to 68,000.
Jobs in the region rose from 37,000 to 48,000.
Comparing 2006 to 2010, there was an increase in both place of residence and place of work jobs in the following sectors: manufacturing, construction, retail, accommodation and food services, professional scientific and technical services, admin and support services, public admin and safety, education and training, and other services.
Sectors that performed poorly in terms of jobs, again both place of residence and place of work were: financial and insurance services, information media and telecoms, transport postal and warehousing, wholesale, and electricity gas and water.
Arts jobs declined.
5.3 Darebin since the GFC Unemployment rate has decreased from 6.6 per cent (NIEIR
7.7 per cent) in 2007 to 6.1 per cent (NIEIR 6.5 in 2010).
The workforce has continued to grow, as employment has increased.
Wages and salaries are up on the 2007 number, so local spending power has increased. Disposable income is higher in 2010 than it was in 2007.
Benefits paid in 2010 were higher than in 2007.
Business income is higher in 2010 than it was in 2007.
Darebin has higher than average recipients of Social Security Benefits for Disability Support 25+, Unemployment and Student Allowance.
Darebin’s population has declined in the under 20 and over 55 age groups; the middle ranges have increased.
Darebin’s households have continued to grow richer and household debt to gross income has continued to increase between 2007 and 2010.
Residential building construction value was higher in 2010 than it was in 2007.
Non-residential construction value was higher in 2010 than it was in 2007.
Resident consumption continues to grow overall.
Resident hours worked has continued to grow and was higher in 2010 than it was in 2007; total resident income was also higher.
The numbers of hours worked in Darebin also increased.
Between 2006 and 2010, resident employment rose from 64,000 to 72,000.
Jobs in the region rose from 51,000 to 56,000.
Comparing 2006 to 2010, there was an increase in both place of residence and place of work jobs in the following sectors: other services, manufacturing, construction, accommodation and food services, education and training, retail, professional scientific and technical services, public administration and safety, health care and social assistance, and administration and support services.
Sectors that performed poorly in terms of jobs, again both place of residence and place of work were: transport postal and warehousing, wholesale, information media and telecoms, and financial and insurance services.
5.4 Hume since the GFC Unemployment rate has increased from a low of 6.8 per cent
(NIEIR 9.6 per cent) in 2007 to 8.6 per cent (NIEIR 11.3 in 2010).
The workforce has continued to grow, as both employment and unemployment have increased.
Wages and salaries are only slightly up on the 2007 number, so local spending power has remained steady. Disposable income is slightly higher in 2010 than it was in 2007.
Benefits paid in 2010 were higher than in 2007.
Business income is higher in 2010 than it was in 2007.
Hume has higher than average recipients of Social Security Benefits for Disability Support, Parenting Payment Single 25+, Unemployment and Youth Allowance.
Hume’s population is growing across all age groups, although the proportion under 20 has declined and the older age group proportions have increased.
Hume’s households have continued to grow richer and household debt to gross income has continued to increase between 2007 and 2010.
Residential building construction value was higher in 2010 than it was in 2007.
Non-residential construction value was higher in 2010 than it was in 2007.
Resident consumption continues to grow overall.
Resident hours worked has continued to grow and was higher in 2010 than it was in 2007; total resident income was also higher.
The numbers of hours worked in Hume also increased.
28
Between 2006 and 2010, resident employment rose from 72,000 to 77,000.
Jobs in the region rose from 31,000 to 32,000.
Comparing 2006 to 2010, there was an increase in both place of residence and place of work jobs in the following sectors: transport postal and warehousing, accommodation and food services, other services, health care and social assistance, wholesale, information media and telecoms, arts and recreation, and professional scientific and technical services.
Sectors that performed poorly in terms of jobs, again both place of residence and place of work, were: retail, manufacturing, public administration and safety, education and training, financial and insurance services, administration and support services, electricity gas and water, and rental, hiring and real estate services.
5.5 Moreland since the GFC Unemployment rate has increased from 5.2 per cent (NIEIR 6
per cent) in 2007 to 5.3 per cent (NIEIR 5.4 per cent in 2010).
The workforce has continued to grow, as employment has increased.
Wages and salaries are up on the 2007 number, so local spending power has increased. Disposable income is higher in 2010 than it was in 2007.
Benefits paid in 2010 were the same as in 2007.
Business income is higher in 2010 than it was in 2007.
Moreland has higher than average recipients of Social Security Benefits for Disability Support 25+, Unemployment and Student Allowance.
Moreland’s population has declined in the under 20 and over 55 age groups; the middle ranges have increased.
Moreland’s households have continued to grow richer and household debt to gross income has continued to increase between 2007 and 2010.
Residential building construction value was higher in 2010 than it was in 2007.
Non-residential construction value was lower in 2010 than it was in 2007.
Resident consumption continues to grow overall.
Resident hours worked has continued to grow and was higher in 2010 than it was in 2007; total resident income was also higher.
The numbers of hours worked in Moreland also increased.
Between 2006 and 2010, resident employment rose from 68,000 to 77,000.
Jobs in the region rose from 38,000 to 52,000.
Comparing 2006 to 2010, there was an increase in both place of residence and place of work jobs in the following sectors: accommodation and food services, transport postal
and warehousing, health care and social assistance, other services, information media and telecoms, arts and recreation, wholesale, and professional scientific and technical services.
Sectors that performed poorly in terms of jobs, again both place of residence and place of work were: retail, public administration and safety, financial and insurance services, education and training, administration and support, manufacturing, and electricity gas and water.
5.6 Nillumbik since the GFC Unemployment rate has increased from 1.6 per cent (NIEIR 2.9
per cent) in 2007 to 1.9 per cent (NIEIR 3.2 per cent in 2010).
The workforce has continued to grow, as employment and unemployment have increased.
Wages and salaries are up on the 2007 number, so local spending power has increased. Disposable income is slightly higher in 2010 than it was in 2007.
Benefits paid in 2010 were higher than in 2007.
Business income is higher in 2010 than it was in 2007.
Nillumbik has lower than average recipients in all categories of Social Security benefits.
Nillumbik’s population has declined in the under 20 age group; the older ranges have all increased.
Nillumbik’s households have continued to grow richer and household debt to gross income has decreased between 2007 and 2010.
Residential building construction value was higher in 2010 than it was in 2007.
Non-residential construction value was higher in 2010 than it was in 2007.
Resident hours worked declined slightly between 2007 and 2010; total resident income increased over the same period.
The numbers of hours worked in Nillumbik has increased.
Between 2006 and 2010, resident employment rose from 37,000 to 39,000.
Jobs in the region rose from 15,000 to 16,000.
Comparing 2006 to 2010, there was an increase in both place of residence and place of work jobs in the following sectors: other services, construction, manufacturing, professional scientific and technical services, education and training, accommodation and food services, retail, and public administration and safety.
Sectors that performed poorly in terms of jobs, again both place of residence and place of work were: wholesale, transport postal and warehousing, information media and telecoms, financial and insurance services, health care and social assistance, electricity gas and water, arts and recreation, and administrative and support services.
5 COMMENTARY BY LGA CONTINUED

29
Post GFC SWOT: Melbourne’s North
5.7 Whittlesea since the GFC Unemployment rate has increased slightly from 5 per cent
(NIEIR 8.5 per cent) in 2007 to 5.7 per cent (NIEIR 8.8 in 2010).
The workforce has continued to grow. Both employment and unemployment have grown.
Wages and salaries are actually slightly up on the 2007 number, so local spending power has been sustained. Disposable income is slightly higher in 2010 than it was in 2007.
Benefits paid in 2010 were slightly lower than in 2007.
Business income is higher in 2010 than it was in 2007.
Disability Support 25+, Parenting Payment Single 25+ and the Student Allowance were the Social Security categories higher than the Australian average.
Whittlesea’s population is growing across all age groups, leaving the age structure similar to that in 2006.
Whittlesea’s households have continued to grow richer and household debt to gross income has continued to increase between 2007 and 2010.
Residential building construction value in 2010 was more than twice the 2007 value, indicating that the northern fringe is still one of Melbourne’s growth areas.
Non-residential construction value was lower in 2010 than it was in 2007, although 2008 and 2009 were both higher than 2007.
Resident consumption continues to grow overall.
Resident hours worked has continued to grow and was higher in 2010 than it was in 2007; total resident income was also higher.
The numbers of hours worked in Whittlesea also increased.
Between 2006 and 2010, resident employment rose from 64,000 to 72,000.
Jobs in the region rose from 42,000 to 46,000.
Comparing 2006 to 2010, there was significant increase in both place of residence and place of work jobs in the following sectors: manufacturing, construction, other services, retail, and accommodation and food services. Business services, government administration, education and training, and health care and social assistance also had employment increases.
Sectors that performed poorly in terms of jobs, again both place of residence and place of work were: transport postal and warehousing, wholesale, information media and telecoms, electricity gas and water, and financial and insurance services.
5.8 Yarra since the GFC Unemployment rate has increased slightly from 5.4 per cent
(NIEIR 5.8 per cent) in 2007 to 6.6 per cent (NIEIR 6.8 in 2010).
The workforce has continued to grow.
Wages and salaries are actually slightly up on the 2007 number, so local spending power has been sustained. Disposable income is slightly higher in 2010 than it was in 2007.
Benefits paid in 2010 were higher than in 2007.
Business income is higher in 2010 than it was in 2007.
Most categories of social security income were below the Australian average in 2010; the exceptions were the Student Allowance, Unemployment and Disability Allowance 25+, reflecting the proximity to tertiary institutions and amenities.
Yarra’s population is growing fastest in terms of overall numbers in the 30-54 age group; the 0-19 year old population is declining.
Yarra’s households have continued to grow richer and household debt to gross income has decreased since 2007.
Residential building construction value was higher in 2010 than it was in 2007.
Non-residential construction value was higher in 2010 than it was in 2007.
Resident consumption continues to grow overall.
Resident hours worked has continued to grow and was higher in 2010 than it was in 2007; total resident income was also higher.
The numbers of hours worked in Yarra also increased.
Between 2007 and 2010, resident employment rose from 44,500 to 51,000.
Jobs in the region rose from 72,000 to 78,500.
Comparing 2006 to 2010, there was an increase in both place of residence and place of work jobs in most sectors. The following sectors had notable increases: transport postal and warehousing, education and training, and arts and recreation. There was a significant rise in health care and social assistance.
Sectors that performed poorly in terms of jobs, again both place of residence and place of work were: manufacturing and retail.
There was a decline in residents employed in construction, accommodation and food services and in professional services, although jobs in these industries rose in Yarra.

30
Manufacturing employment growth
Figure 5.1: Manufacturing employment growth (Melbourne LGAs) – pre and post GFC
Construction employment growth
Figure 5.2: Construction employment growth (Melbourne LGAs) – pre and post GFC
5.9 Employment growthThe following tables provide a comparison of employment growth pre and post GFC by industry sector.
5 COMMENTARY BY LGA CONTINUED

Post GFC SWOT: Melbourne’s North
31
Wholesale employment growth
Figure 5.3: Wholesale employment growth (Melbourne LGAs) – pre and post GFC
Retail employment growth
Figure 5.4: Retail employment growth (Melbourne LGAs) – pre and post GFC
32
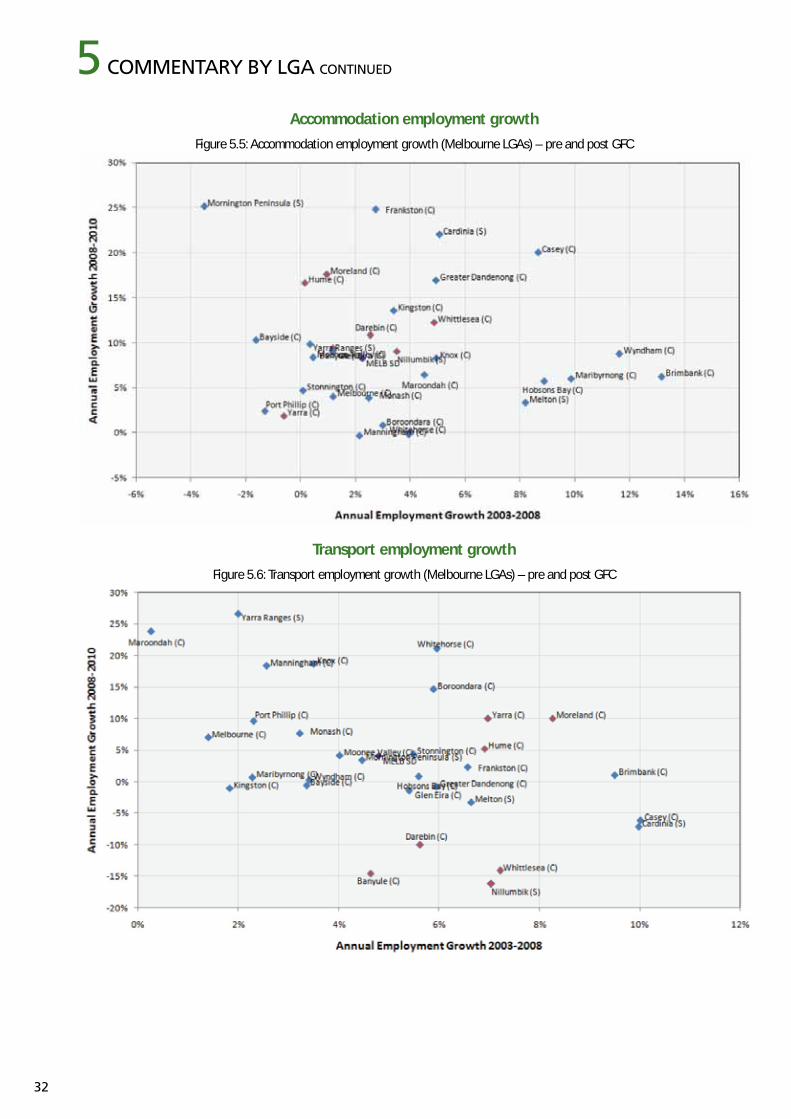
Accommodation employment growth
Figure 5.5: Accommodation employment growth (Melbourne LGAs) – pre and post GFC
Transport employment growth
Figure 5.6: Transport employment growth (Melbourne LGAs) – pre and post GFC
5 COMMENTARY BY LGA CONTINUED

Post GFC SWOT: Melbourne’s North
33
IT employment growth
Figure 5.7: IT employment growth (Melbourne LGAs) – pre and post GFC
Financial employment growth
Figure 5.8: Financial employment growth (Melbourne LGAs) – pre and post GFC

34
Professional employment growth
Resident consumption remained at similar levels from Figure 5.9: Professional employment growth (Melbourne LGAs) – pre and post GFC
Administration employment growth
Figure 5.10: Administration employment growth (Melbourne LGAs) – pre and post GFC
5 COMMENTARY BY LGA CONTINUED
Post GFC SWOT: Melbourne’s North
35
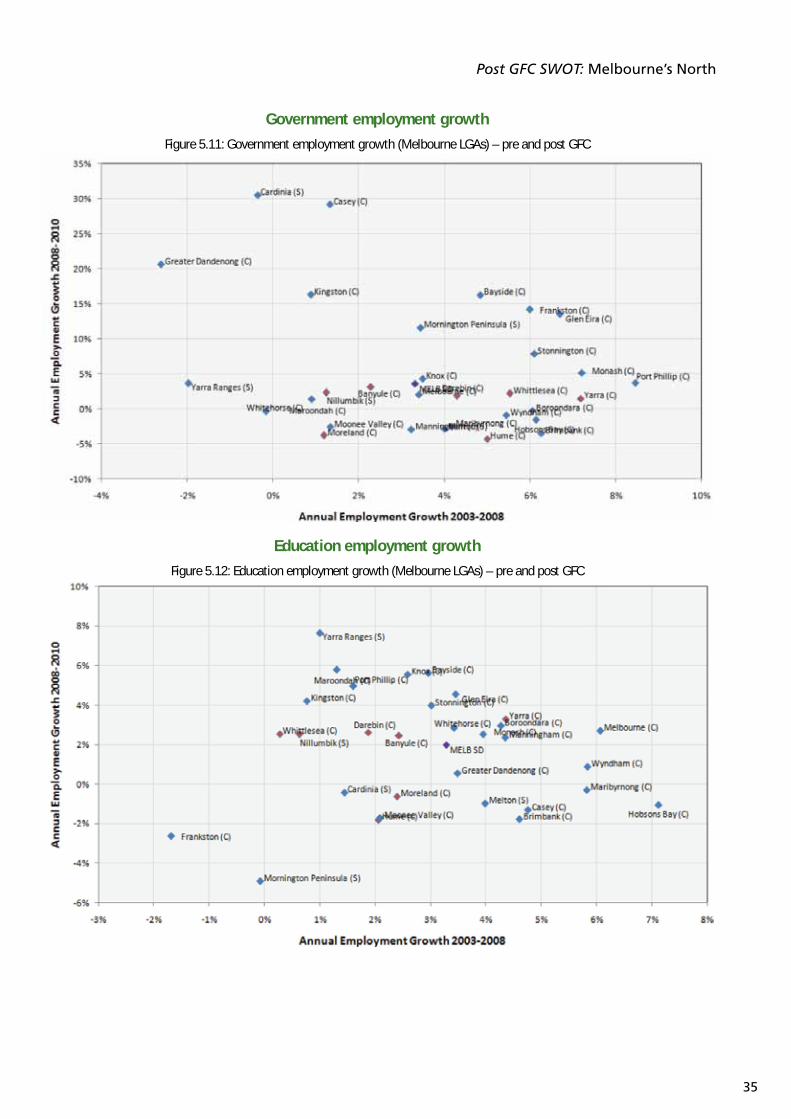
Government employment growth
Figure 5.11: Government employment growth (Melbourne LGAs) – pre and post GFC
Education employment growth
Figure 5.12: Education employment growth (Melbourne LGAs) – pre and post GFC

36
Health employment growth
Figure 5.13: Health employment growth (Melbourne LGAs) – pre and post GFC
Other services employment growth
Figure 5.14: Other services employment growth (Melbourne LGAs) – pre and post GFC
5 COMMENTARY BY LGA CONTINUED

Post GFC SWOT: Melbourne’s North
37
5.10 Pre GFC place of work and resident employment growthLGAs that appear above the line have resident employment growth that is faster than place of work employment growth.
Figure 5.15: Place of work and resident employment growth(Melbourne LGAs) – pre GFC
5.11 Post GFC place of work and resident employment growthLGAs that appear above the line have resident employment growth that is faster than place of work employment growth.
Figure 5.16: Place of work and resident employment growth(Melbourne LGAs) – post GFC

38
APPENDICES

Post GFC SWOT: Melbourne’s North
39
Gross Product is identical with Gross Value Added for any geographic area. It comprises the sale value of goods and services produced in the region in a time period, less the costs of raw materials and other inputs purchased from other businesses, less taxes. The basic concept is very similar to the tax base for GST. Ideally, Gross Local Product would have the same definition as Gross National Product or Gross State Product. However, it is not possible to allocate the Gross Operating Surplus of corporate businesses (including any surplus of government enterprises) to LGAs. (The Gross Operating Surplus comprises corporate Gross Value Added less wages and related payments.) Gross Local Product therefore comprises:
employee compensation paid in respect of production in the LGA; plus
gross value added by unincorporated enterprises in the LGA less employee compensation paid by those enterprises (equivalent to Gross Mixed Income generated in the LGA); plus
imputed Gross Value Added of owner-occupied houses in the LGA.
Corporate businesses are those incorporated with shareholders, who ultimately control the company and are entitled to dividends when paid. Various other forms of legal incorporation, which lack the shareholder-dividend component, are not treated as incorporated, save that the definition includes branches of overseas companies and is extended by the ABS on an ad-hoc basis to include businesses organised as co-operatives, credit unions and mutual societies where these businesses maintain full accounts and operate in a manner similar to shareholder companies. The extension includes trusts whose chief activity is the holding of financial assets. All other businesses and non-profit-making organisations are excluded from the definition – these exclusions include partnerships, trusts which operate businesses (especially in the agricultural sector), community and philanthropic non-profit institutions and any other non-shareholder organisations not specifically transferred to the corporate sector. In all cases Gross Mixed Income generated by the organisation is calculated after employee compensation is paid. It will be noted
that non-profit organisations are exempt from personal and corporation taxes so that the Gross Mixed Income they generate has to be estimated directly.
As regards organisations which generate taxable Mixed Income, the ABS definition is influenced by the definition used by the Tax Commissioner. This allows taxpayers to declare as business income any income in which compensation for the taxpayer’s labour is mixed with a capital return which is not legally separable from the labour return (as it is when incorporation requires the separation of employee compensation from dividends to shareholders). The Tax Commissioner allows the declaration of mixed income in respect of trusts operating in primary industry, but not otherwise. The ABS adjusts the net taxable income so declared back to Gross Mixed Income, adding back deductions declared by taxpayers, estimates for various non-taxable components and finally an estimate for understatement on tax returns. This is published by industry and postcode of taxpayer residence.
Control totals for Gross Local Product are available from the ABS State Accounts. NIEIR distributes the components as follows.
Employee compensation by local employment by industry (Census JTW adjusted and updated) and earnings (Census JTW, also tax statistics imputed by industry from area of residence back to area of work by JTW).
Gross taxable mixed income (including losses) generated by a similar process to employee compensation.
Gross non-taxable mixed income by local employment in such industries, from Census JTW.
Data sources Labour Force
Census
Journey to Work Matrix
Tax data
NIEIR modelling
APPENDIX A:GROSS PRODUCT DEFINITION
AND DATA SOURCESA

40
Tab
le B
.1 P
op
ula
tio
nSe
ries
Regi
on19
9920
0020
0120
0220
0320
0420
0520
0620
0720
0820
0920
10A
nnua
l gro
wth
Popu
latio
nM
elbo
urne
’s N
orth
751,
332
757,
416
766,
801
774,
845
783,
239
790,
982
802,
124
814,
947
830,
619
847,
856
867,
791
883,
069
1.5%
Popu
latio
nM
elbo
urne
SD
3,38
0,41
73,
423,
359
3,47
2,20
73,
524,
533
3,57
8,00
23,
626,
603
3,68
1,22
63,
743,
635
3,81
8,41
53,
902,
673
3,99
6,16
04,
060,
991
1.7%
Popu
latio
nVi
ctor
ia4,
685,
965
4,74
0,88
64,
804,
269
4,86
2,56
34,
922,
902
4,98
0,82
35,
047,
896
5,12
5,77
05,
220,
540
5,32
6,20
85,
442,
458
5,52
0,13
31.
5%
MN
% o
f SD
– po
pula
tion
Mel
bour
ne’s
Nor
th22
.2%
22.1
%22
.1%
22.0
%21
.9%
21.8
%21
.8%
21.8
%21
.8%
21.7
%21
.7%
21.7
%-0
.2%
MN
% o
f VIC
– p
opul
atio
nM
elbo
urne
SD
16.0
%16
.0%
16.0
%15
.9%
15.9
%15
.9%
15.9
%15
.9%
15.9
%15
.9%
15.9
%16
.0%
0.0%
SD %
of V
IC –
pop
ulat
ion
Vict
oria
72.1
%72
.2%
72.3
%72
.5%
72.7
%72
.8%
72.9
%73
.0%
73.1
%73
.3%
73.4
%73
.6%
0.2%
MN
– p
opul
atio
n in
crea
seM
elbo
urne
’s N
orth
–0.
8%1.
2%1.
0%1.
1%1.
0%1.
4%1.
6%1.
9%2.
1%2.
4%1.
8%
SD –
pop
ulat
ion
incr
ease
Mel
bour
ne S
D–
1.3%
1.4%
1.5%
1.5%
1.4%
1.5%
1.7%
2.0%
2.2%
2.4%
1.6%
VIC
– po
pula
tion
incr
ease
Vict
oria
–1.
2%1.
3%1.
2%1.
2%1.
2%1.
3%1.
5%1.
8%2.
0%2.
2%1.
4%
Tab
le B
.2 N
um
ber
of
ho
use
ho
lds
Seri
esRe
gion
1999
2000
2001
2002
2003
2004
2005
2006
2007
2008
2009
2010
Ann
ual g
row
th
Hous
ehol
dsM
elbo
urne
’s N
orth
251,
986
255,
250
258,
576
261,
196
264,
396
267,
691
270,
702
273,
401
275,
965
279,
194
282,
899
287,
255
1.2%
Hous
ehol
dsM
elbo
urne
SD
1,14
8,12
41,
165,
610
1,18
3,56
21,
199,
960
1,22
0,20
21,
240,
095
1,25
6,44
71,
271,
093
1,28
4,22
41,
299,
180
1,31
5,56
61,
332,
631
1.4%
Hous
ehol
dsVi
ctor
ia1,
591,
969
1,61
5,04
21,
638,
687
1,65
9,39
21,
685,
559
1,71
1,73
51,
734,
281
1,75
4,99
61,
773,
487
1,79
3,63
31,
814,
859
1,83
7,42
31.
3%
MN
% o
f SD
– ho
useh
olds
Mel
bour
ne’s
Nor
th21
.9%
21.9
%21
.8%
21.8
%21
.7%
21.6
%21
.5%
21.5
%21
.5%
21.5
%21
.5%
21.6
%-0
.2%
MN
% o
f VIC
– h
ouse
hold
sM
elbo
urne
SD
15.8
%15
.8%
15.8
%15
.7%
15.7
%15
.6%
15.6
%15
.6%
15.6
%15
.6%
15.6
%15
.6%
-0.1
%
SD %
of V
IC –
hou
seho
lds
Vict
oria
72.1
%72
.2%
72.2
%72
.3%
72.4
%72
.4%
72.4
%72
.4%
72.4
%72
.4%
72.5
%72
.5%
0.1%
MN
– h
ouse
hold
s in
crea
seM
elbo
urne
’s N
orth
–1.
3%1.
3%1.
0%1.
2%1.
2%1.
1%1.
0%0.
9%1.
2%1.
3%1.
5%
SD –
hou
seho
lds
incr
ease
Mel
bour
ne S
D–
1.5%
1.5%
1.4%
1.7%
1.6%
1.3%
1.2%
1.0%
1.2%
1.3%
1.3%
VIC
– ho
useh
olds
incr
ease
Vict
oria
–1.
4%1.
5%1.
3%1.
6%1.
6%1.
3%1.
2%1.
1%1.
1%1.
2%1.
2%
APP
END
IX B
:R
EGIO
NA
L SU
MM
ARY
TA
BLE
S M
ELB
OU
RN
E’S
NO
RTH
B

Post GFC SWOT: Melbourne’s North
41
Tab
le B
.3 N
IEIR
res
iden
t em
plo
ymen
tSe
ries
Regi
on19
9920
0020
0120
0220
0320
0420
0520
0620
0720
0820
0920
10A
nnua
l gro
wth
NIE
IR e
mpl
oym
ent
Mel
bour
ne’s
Nor
th35
9,50
436
5,66
237
6,59
337
8,42
638
1,07
138
3,52
739
4,54
640
3,71
341
7,07
343
2,09
843
2,85
645
4,02
92.
1%
NIE
IR e
mpl
oym
ent
Mel
bour
ne S
D1,
646,
985
1,68
5,22
31,
711,
641
1,72
1,34
31,
756,
123
1,78
3,56
51,
840,
661
1,88
4,52
51,
952,
152
2,01
7,73
32,
014,
545
2,07
3,77
72.
1%
NIE
IR e
mpl
oym
ent
Vict
oria
2,16
8,04
02,
196,
725
2,27
2,02
42,
293,
246
2,33
9,85
02,
375,
925
2,44
9,89
22,
505,
430
2,58
1,16
62,
651,
209
2,65
7,15
12,
731,
336
2.1%
MN
% o
f SD
– N
IEIR
em
ploy
men
tM
elbo
urne
’s N
orth
21.8
%21
.7%
22.0
%22
.0%
21.7
%21
.5%
21.4
%21
.4%
21.4
%21
.4%
21.5
%21
.9%
0.0%
MN
% o
f VIC
– N
IEIR
em
ploy
men
tM
elbo
urne
SD
16.6
%16
.6%
16.6
%16
.5%
16.3
%16
.1%
16.1
%16
.1%
16.2
%16
.3%
16.3
%16
.6%
0.0%
SD %
of V
IC –
NIE
IR e
mpl
oym
ent
Vict
oria
76.0
%76
.7%
75.3
%75
.1%
75.1
%75
.1%
75.1
%75
.2%
75.6
%76
.1%
75.8
%75
.9%
0.0%
MN
– N
IEIR
em
ploy
men
t inc
reas
eM
elbo
urne
’s N
orth
–1.
7%3.
0%0.
5%0.
7%0.
6%2.
9%2.
3%3.
3%3.
6%0.
2%4.
9%
SD –
NIE
IR e
mpl
oym
ent i
ncre
ase
Mel
bour
ne S
D–
2.3%
1.6%
0.6%
2.0%
1.6%
3.2%
2.4%
3.6%
3.4%
-0.2
%2.
9%
VIC
– N
IEIR
em
ploy
men
t inc
reas
eVi
ctor
ia–
1.3%
3.4%
0.9%
2.0%
1.5%
3.1%
2.3%
3.0%
2.7%
0.2%
2.8%
Tab
le B
.4 N
IEIR
res
iden
t u
nem
plo
ymen
tSe
ries
Regi
on19
9920
0020
0120
0220
0320
0420
0520
0620
0720
0820
0920
10A
nnua
l gro
wth
NIE
IR u
nem
ploy
men
t rat
eM
elbo
urne
’s N
orth
10.0
%9.
7%9.
1%9.
2%8.
8%8.
5%8.
4%8.
0%6.
8%6.
4%6.
4%7.
1%-3
.1%
NIE
IR u
nem
ploy
men
t rat
e M
elbo
urne
SD
8.8%
8.5%
8.1%
8.1%
7.6%
7.6%
7.2%
6.9%
6.4%
6.2%
6.5%
7.5%
-1.4
%
NIE
IR u
nem
ploy
men
t rat
e Vi
ctor
ia9.
3%9.
2%8.
6%8.
6%8.
1%8.
1%7.
9%7.
5%7.
1%6.
9%7.
1%8.
1%-1
.3%
Tab
le B
.5 N
IEIR
str
uct
ura
l un
emp
loym
ent
rate
Seri
esRe
gion
1999
2000
2001
2002
2003
2004
2005
2006
2007
2008
2009
2010
Ann
ual g
row
th
NIE
IR s
truct
ural
une
mpl
oym
ent r
ate
Mel
bour
ne’s
Nor
th12
.7%
12.9
%12
.8%
12.9
%13
.1%
12.7
%12
.0%
11.4
%11
.1%
10.6
%10
.6%
10.6
%-1
.7%
NIE
IR s
truct
ural
une
mpl
oym
ent r
ate
Mel
bour
ne S
D10
.1%
10.2
%10
.3%
10.3
%10
.5%
10.2
%9.
8%9.
3%9.
0%8.
7%8.
8%8.
8%-1
.3%
NIE
IR s
truct
ural
une
mpl
oym
ent r
ate
Vict
oria
11.2
%11
.5%
11.3
%11
.3%
11.5
%11
.2%
10.7
%10
.3%
10.1
%9.
9%9.
9%10
.0%
-1.0
%
Tab
le B
.6 H
ead
line
un
emp
loym
ent
rate
Seri
esRe
gion
1999
2000
2001
2002
2003
2004
2005
2006
2007
2008
2009
2010
Ann
ual g
row
th
Unem
ploy
men
t rat
eM
elbo
urne
’s N
orth
9.1%
9.1%
8.3%
7.6%
6.6%
6.3%
6.4%
6.0%
5.1%
4.7%
4.6%
5.6%
-4.3
%
Unem
ploy
men
t rat
e M
elbo
urne
SD
7.0%
6.9%
6.4%
6.3%
5.8%
5.6%
5.3%
5.1%
4.7%
4.5%
4.7%
6.0%
-1.4
%
Unem
ploy
men
t rat
e Vi
ctor
ia7.
3%7.
2%6.
7%6.
3%5.
8%5.
7%5.
7%5.
4%4.
9%4.
6%4.
8%6.
0%-1
.8%
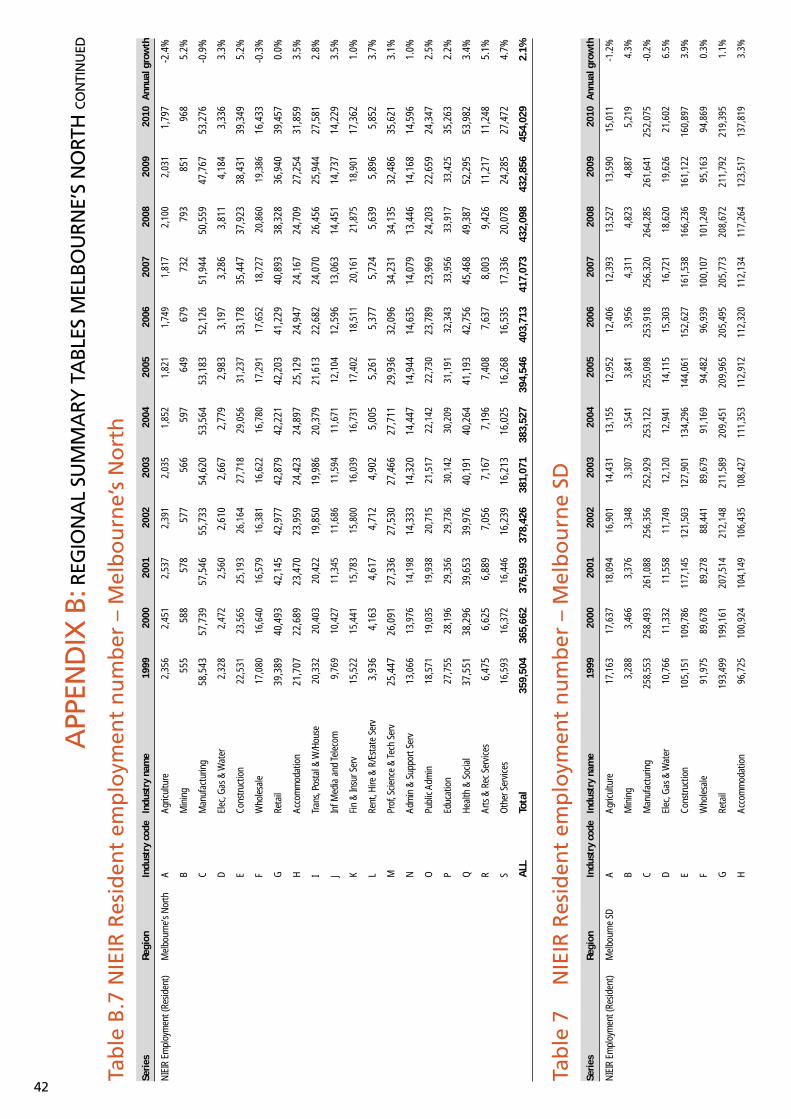
42
Tab
le B
.7 N
IEIR
Res
iden
t em
plo
ymen
t n
um
ber
– M
elb
ou
rne’
s N
ort
hSe
ries
Regi
onIn
dust
ry c
ode
Indu
stry
nam
e19
9920
0020
0120
0220
0320
0420
0520
0620
0720
0820
0920
10A
nnua
l gro
wth
NIE
IR E
mpl
oym
ent (
Resid
ent)
Mel
bour
ne’s
Nor
thA
Agric
ultu
re2,
356
2,45
12,
537
2,39
12,
035
1,85
21,
821
1,74
91,
817
2,10
02,
031
1,79
7-2
.4%
BM
inin
g55
558
857
857
756
659
764
967
973
279
385
196
85.
2%
CM
anuf
actu
ring
58,5
4357
,739
57,5
4655
,733
54,6
2053
,564
53,1
8352
,126
51,9
4450
,559
47,7
6753
,276
-0.9
%
DEl
ec, G
as &
Wat
er2,
328
2,47
22,
560
2,61
02,
667
2,77
92,
983
3,19
73,
286
3,81
14,
184
3,33
63.
3%
ECo
nstru
ctio
n22
,531
23,5
6525
,193
26,1
6427
,718
29,0
5631
,237
33,1
7835
,447
37,9
2338
,431
39,3
495.
2%
FW
hole
sale
17,0
8016
,640
16,5
7916
,381
16,6
2216
,780
17,2
9117
,652
18,7
2720
,860
19,3
8616
,433
-0.3
%
GRe
tail
39,3
8940
,493
42,1
4542
,977
42,8
7942
,221
42,2
0341
,229
40,8
9338
,328
36,9
4039
,457
0.0%
HAc
com
mod
atio
n21
,707
22,6
8923
,470
23,9
5924
,423
24,8
9725
,129
24,9
4724
,167
24,7
0927
,254
31,8
593.
5%
ITr
ans,
Post
al &
W/H
ouse
20,3
3220
,403
20,4
2219
,850
19,9
8620
,379
21,6
1322
,682
24,0
7026
,456
25,9
4427
,581
2.8%
JIn
f Med
ia a
nd Te
leco
m9,
769
10,4
2711
,345
11,6
8611
,594
11,6
7112
,104
12,5
9613
,063
14,4
5114
,737
14,2
293.
5%
KFi
n &
Insu
r Ser
v15
,522
15,4
4115
,783
15,8
0016
,039
16,7
3117
,402
18,5
1120
,161
21,8
7518
,901
17,3
621.
0%
LRe
nt, H
ire &
R/E
stat
e Se
rv3,
936
4,16
34,
617
4,71
24,
902
5,00
55,
261
5,37
75,
724
5,63
95,
896
5,85
23.
7%
MPr
of, S
cienc
e &
Tech
Ser
v25
,447
26,0
9127
,336
27,5
3027
,466
27,7
1129
,936
32,0
9634
,231
34,1
3532
,486
35,6
213.
1%
NAd
min
& S
uppo
rt Se
rv13
,066
13,9
7614
,198
14,3
3314
,320
14,4
4714
,944
14,6
3514
,079
13,4
4614
,168
14,5
961.
0%
OPu
blic
Adm
in18
,571
19,0
3519
,938
20,7
1521
,517
22,1
4222
,730
23,7
8923
,969
24,2
0322
,659
24,3
472.
5%
PEd
ucat
ion
27,7
5528
,196
29,3
5629
,736
30,1
4230
,209
31,1
9132
,343
33,9
5633
,917
33,4
2535
,263
2.2%
QHe
alth
& S
ocia
l37
,551
38,2
9639
,653
39,9
7640
,191
40,2
6441
,193
42,7
5645
,468
49,3
8752
,295
53,9
823.
4%
RAr
ts &
Rec
Ser
vice
s6,
475
6,62
56,
889
7,05
67,
167
7,19
67,
408
7,63
78,
003
9,42
611
,217
11,2
485.
1%
SO
ther
Ser
vice
s16
,593
16,3
7216
,446
16,2
3916
,213
16,0
2516
,268
16,5
3517
,336
20,0
7824
,285
27,4
724.
7%
ALL
Tota
l35
9,50
436
5,66
237
6,59
337
8,42
638
1,07
138
3,52
739
4,54
640
3,71
341
7,07
343
2,09
843
2,85
645
4,02
92.
1%
Tab
le 7
N
IEIR
Res
iden
t em
plo
ymen
t n
um
ber
– M
elb
ou
rne
SDSe
ries
Regi
onIn
dust
ry c
ode
Indu
stry
nam
e19
9920
0020
0120
0220
0320
0420
0520
0620
0720
0820
0920
10A
nnua
l gro
wth
NIE
IR E
mpl
oym
ent (
Resid
ent)
Mel
bour
ne S
DA
Agric
ultu
re17
,163
17,6
3718
,094
16,9
0114
,431
13,1
5512
,952
12,4
0612
,393
13,5
2713
,590
15,0
11-1
.2%
BM
inin
g3,
288
3,46
63,
376
3,34
83,
307
3,54
13,
841
3,95
64,
311
4,82
34,
887
5,21
94.
3%
CM
anuf
actu
ring
258,
553
258,
493
261,
088
256,
356
252,
929
253,
122
255,
098
253,
918
256,
320
264,
285
261,
641
252,
075
-0.2
%
DEl
ec, G
as &
Wat
er10
,766
11,3
3211
,558
11,7
4912
,120
12,9
4114
,115
15,3
0316
,721
18,6
2019
,626
21,6
026.
5%
ECo
nstru
ctio
n10
5,15
110
9,78
611
7,14
512
1,50
312
7,90
113
4,29
614
4,06
115
2,62
716
1,53
816
6,23
616
1,12
216
0,89
73.
9%
FW
hole
sale
91,9
7589
,678
89,2
7888
,441
89,6
7991
,169
94,4
8296
,939
100,
107
101,
249
95,1
6394
,869
0.3%
GRe
tail
193,
499
199,
161
207,
514
212,
148
211,
589
209,
451
209,
965
205,
495
205,
773
208,
672
211,
792
219,
395
1.1%
HAc
com
mod
atio
n96
,725
100,
924
104,
149
106,
435
108,
427
111,
353
112,
912
112,
320
112,
134
117,
264
123,
517
137,
819
3.3%
APP
END
IX B
: REG
ION
AL
SUM
MA
RY T
AB
LES
MEL
BO
UR
NE’
S N
ORT
H C
ON
TIN
UED

Post GFC SWOT: Melbourne’s North
43
ITr
ans,
Post
al &
W/H
ouse
81,6
4383
,150
83,9
7682
,133
82,4
4785
,148
90,7
3595
,173
98,7
7410
2,72
110
4,31
311
2,45
03.
0%
JIn
f Med
ia a
nd Te
leco
m45
,302
47,9
0851
,732
52,9
8452
,273
52,6
7254
,578
56,4
9756
,765
56,8
3455
,189
55,3
941.
8%
KFi
n &
Insu
r Ser
v75
,550
74,7
5476
,101
76,2
1877
,477
81,3
3785
,165
90,9
0594
,579
95,3
7794
,144
94,8
112.
1%
LRe
nt, H
ire &
R/E
stat
e Se
rv20
,800
21,9
9724
,307
24,8
7526
,171
27,1
5028
,759
29,6
3532
,004
33,2
3232
,913
32,5
204.
1%
MPr
of, S
cienc
e &
Tech
Ser
v13
2,09
013
4,88
914
0,63
914
1,09
914
0,19
014
1,21
815
2,27
416
2,32
217
4,30
718
1,67
218
2,83
318
5,95
43.
2%
NAd
min
& S
uppo
rt Se
rv61
,341
65,5
1466
,426
67,1
5167
,018
68,0
7770
,681
69,3
4268
,408
66,7
0667
,322
72,9
411.
6%
OPu
blic
Adm
in76
,421
77,6
0280
,378
82,7
4284
,784
87,0
9288
,743
92,0
0992
,457
94,4
1094
,759
101,
499
2.6%
PEd
ucat
ion
120,
328
122,
218
127,
413
129,
125
130,
019
129,
978
133,
380
137,
347
145,
204
151,
164
154,
056
157,
119
2.5%
QHe
alth
& S
ocia
l16
2,34
916
6,43
017
3,38
317
5,73
317
6,59
917
7,50
618
1,65
418
8,09
619
7,71
920
0,58
920
2,95
721
7,48
92.
7%
RAr
ts &
Rec
Ser
vice
s30
,066
30,5
2331
,495
32,1
2032
,495
32,7
8833
,751
34,7
3236
,549
38,9
9840
,382
41,1
752.
9%
SO
ther
Ser
vice
s74
,884
73,9
6874
,341
73,5
2873
,265
72,8
0874
,070
75,3
4479
,217
84,9
4187
,707
89,7
291.
7%
ALL
Tota
l1,
657,
890
1,68
9,43
01,
742,
392
1,75
4,59
01,
763,
124
1,78
4,80
21,
841,
218
1,88
4,36
61,
945,
280
2,00
1,32
12,
007,
914
2,06
7,96
82.
0%
Tab
le B
.7 N
IEIR
Res
iden
t em
plo
ymen
t n
um
ber
– V
icto
ria
Seri
esRe
gion
Indu
stry
cod
eIn
dust
ry n
ame
1999
2000
2001
2002
2003
2004
2005
2006
2007
2008
2009
2010
Ann
ual g
row
th
NIE
IR E
mpl
oym
ent (
Resid
ent)
Vict
oria
AAg
ricul
ture
83,4
5782
,187
85,3
5381
,882
80,7
1777
,256
77,2
3775
,827
75,8
3379
,962
81,4
3584
,961
0.2%
BM
inin
g5,
482
5,63
15,
557
5,78
25,
884
6,55
97,
361
8,05
99,
104
10,0
1110
,311
11,0
686.
6%
CM
anuf
actu
ring
321,
029
320,
384
325,
418
321,
524
322,
418
325,
446
329,
477
330,
028
331,
142
330,
755
324,
711
329,
268
0.2%
DEl
ec, G
as &
Wat
er18
,274
19,1
2219
,474
19,7
2520
,455
21,8
8123
,736
25,5
0427
,387
29,4
3229
,831
31,3
245.
0%
ECo
nstru
ctio
n13
7,28
114
2,59
415
2,59
415
8,97
317
1,07
318
1,48
719
5,92
320
8,68
721
9,91
922
7,46
922
4,60
722
9,88
64.
8%
FW
hole
sale
111,
524
108,
330
108,
164
107,
283
109,
484
110,
986
114,
425
116,
884
120,
977
124,
909
122,
627
124,
446
1.0%
GRe
tail
254,
763
260,
335
271,
421
278,
246
282,
785
282,
107
283,
556
277,
942
278,
544
281,
878
285,
471
292,
060
1.2%
HAc
com
mod
atio
n13
0,69
813
5,06
013
9,22
714
2,52
714
7,66
415
2,07
015
4,00
915
2,77
515
2,01
515
9,19
616
4,02
017
2,22
22.
5%
ITr
ans,
Post
al &
W/H
ouse
103,
087
104,
700
106,
311
104,
455
106,
480
109,
658
116,
202
121,
414
125,
704
130,
665
131,
561
138,
192
2.7%
JIn
f Med
ia a
nd Te
leco
m52
,622
55,4
4459
,829
61,2
2660
,713
61,1
8963
,447
65,7
5166
,704
67,0
7265
,117
65,4
782.
0%
KFi
n &
Insu
r Ser
v86
,418
85,0
3186
,414
86,4
5788
,253
92,6
1096
,824
103,
270
107,
196
108,
967
109,
313
110,
449
2.3%
LRe
nt, H
ire &
R/E
stat
e Se
rv25
,559
26,7
8329
,563
30,2
3732
,172
33,4
9935
,604
36,8
1740
,067
41,5
2040
,817
40,1
884.
2%
MPr
of, S
cienc
e &
Tech
Ser
v15
0,53
115
3,01
615
9,51
116
0,09
816
0,08
316
1,58
517
4,29
318
5,76
519
8,61
020
5,02
120
5,03
820
8,10
43.
0%
NAd
min
& S
uppo
rt Se
rv74
,876
79,9
4781
,456
82,6
2783
,271
84,6
4887
,784
86,0
4985
,562
85,7
1787
,541
91,7
451.
9%
OPu
blic
Adm
in10
1,63
510
2,64
710
6,61
111
0,21
211
5,26
711
9,19
712
1,98
612
6,89
512
8,15
513
1,69
112
9,78
413
5,58
92.
7%
PEd
ucat
ion
160,
062
161,
167
168,
040
170,
637
174,
654
175,
153
179,
373
184,
335
194,
183
201,
016
203,
360
210,
081
2.5%
QHe
alth
& S
ocia
l21
7,94
522
2,69
223
3,31
423
7,49
524
2,52
124
4,41
424
9,65
925
7,65
427
1,68
827
8,53
027
8,87
028
7,40
12.
5%
RAr
ts &
Rec
Ser
vice
s36
,565
37,1
5138
,626
39,5
1540
,298
40,6
4941
,786
42,9
7345
,376
48,0
4649
,475
50,9
883.
1%
SO
ther
Ser
vice
s96
,443
94,7
0595
,364
94,5
7695
,890
95,7
7197
,453
99,0
6210
3,26
710
9,62
711
3,53
711
6,12
41.
7%
ALL
Tota
l2,
168,
250
2,19
6,92
32,
272,
248
2,29
3,47
62,
340,
084
2,37
6,16
62,
450,
135
2,50
5,69
22,
581,
432
2,65
1,48
32,
657,
425
2,72
9,57
32.
1%
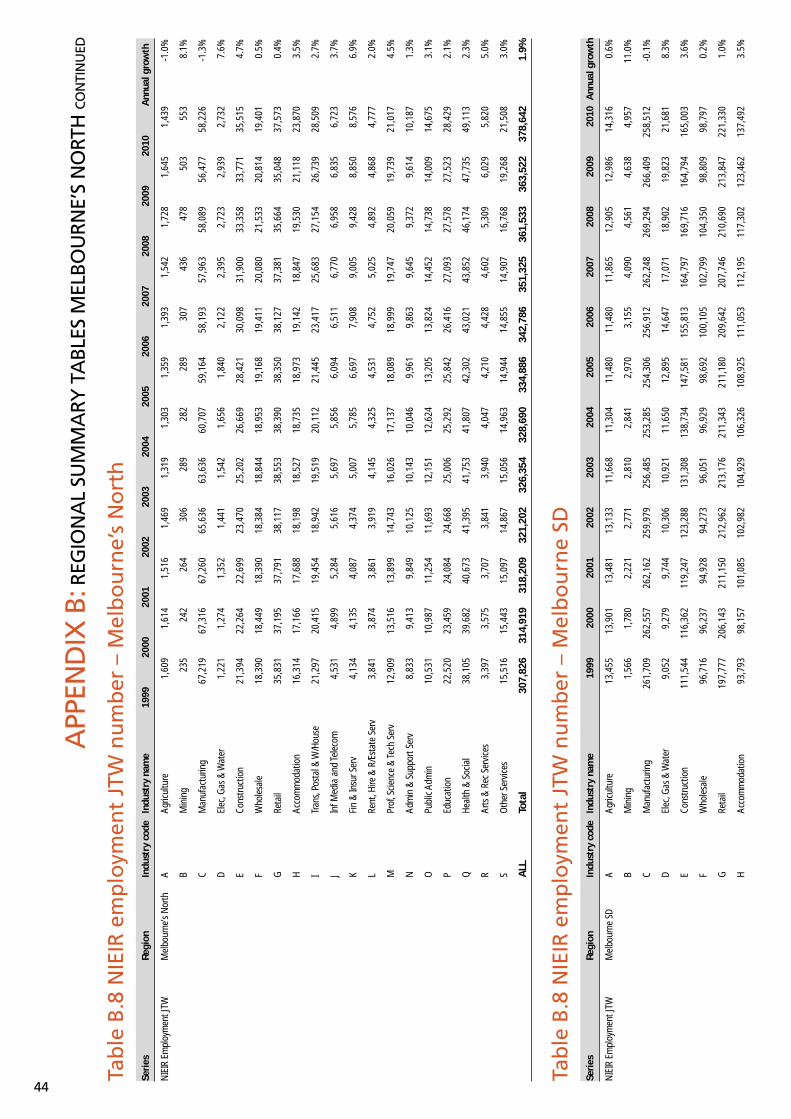
44
Tab
le B
.8 N
IEIR
em
plo
ymen
t JT
W n
um
ber
– M
elb
ou
rne’
s N
ort
hSe
ries
Regi
onIn
dust
ry c
ode
Indu
stry
nam
e19
9920
0020
0120
0220
0320
0420
0520
0620
0720
0820
0920
10A
nnua
l gro
wth
NIE
IR E
mpl
oym
ent J
TWM
elbo
urne
’s N
orth
AAg
ricul
ture
1,60
91,
614
1,51
61,
469
1,31
91,
303
1,35
91,
393
1,54
21,
728
1,64
51,
439
-1.0
%
BM
inin
g23
524
226
430
628
928
228
930
743
647
850
355
38.
1%
CM
anuf
actu
ring
67,2
1967
,316
67,2
6065
,636
63,6
3660
,707
59,1
6458
,193
57,9
6358
,089
56,4
7758
,226
-1.3
%
DEl
ec, G
as &
Wat
er1,
221
1,27
41,
352
1,44
11,
542
1,65
61,
840
2,12
22,
395
2,72
32,
939
2,73
27.
6%
ECo
nstru
ctio
n21
,394
22,2
6422
,699
23,4
7025
,202
26,6
6928
,421
30,0
9831
,900
33,3
5833
,771
35,5
154.
7%
FW
hole
sale
18,3
9018
,449
18,3
9018
,384
18,8
4418
,953
19,1
6819
,411
20,0
8021
,533
20,8
1419
,401
0.5%
GRe
tail
35,8
3137
,195
37,7
9138
,117
38,5
5338
,390
38,3
5038
,127
37,3
8135
,664
35,0
4837
,573
0.4%
HAc
com
mod
atio
n16
,314
17,1
6617
,688
18,1
9818
,527
18,7
3518
,973
19,1
4218
,847
19,5
3021
,118
23,8
703.
5%
ITr
ans,
Post
al &
W/H
ouse
21,2
9720
,415
19,4
5418
,942
19,5
1920
,112
21,4
4523
,417
25,6
8327
,154
26,7
3928
,509
2.7%
JIn
f Med
ia a
nd Te
leco
m4,
531
4,89
95,
284
5,61
65,
697
5,85
66,
094
6,51
16,
770
6,95
86,
835
6,72
33.
7%
KFi
n &
Insu
r Ser
v4,
134
4,13
54,
087
4,37
45,
007
5,78
56,
697
7,90
89,
005
9,42
88,
850
8,57
66.
9%
LRe
nt, H
ire &
R/E
stat
e Se
rv3,
841
3,87
43,
861
3,91
94,
145
4,32
54,
531
4,75
25,
025
4,89
24,
868
4,77
72.
0%
MPr
of, S
cienc
e &
Tech
Ser
v12
,909
13,5
1613
,899
14,7
4316
,026
17,1
3718
,089
18,9
9919
,747
20,0
5919
,739
21,0
174.
5%
NAd
min
& S
uppo
rt Se
rv8,
833
9,41
39,
849
10,1
2510
,143
10,0
469,
961
9,86
39,
645
9,37
29,
614
10,1
871.
3%
OPu
blic
Adm
in10
,531
10,9
8711
,254
11,6
9312
,151
12,6
2413
,205
13,8
2414
,452
14,7
3814
,009
14,6
753.
1%
PEd
ucat
ion
22,5
2023
,459
24,0
8424
,668
25,0
0625
,292
25,8
4226
,416
27,0
9327
,578
27,5
2328
,429
2.1%
QHe
alth
& S
ocia
l38
,105
39,6
8240
,673
41,3
9541
,753
41,8
0742
,302
43,0
2143
,852
46,1
7447
,735
49,1
132.
3%
RAr
ts &
Rec
Ser
vice
s3,
397
3,57
53,
707
3,84
13,
940
4,04
74,
210
4,42
84,
602
5,30
96,
029
5,82
05.
0%
SO
ther
Ser
vice
s15
,516
15,4
4315
,097
14,8
6715
,056
14,9
6314
,944
14,8
5514
,907
16,7
6819
,268
21,5
083.
0%
ALL
Tota
l30
7,82
631
4,91
931
8,20
932
1,20
232
6,35
432
8,69
033
4,88
634
2,78
635
1,32
536
1,53
336
3,52
237
8,64
21.
9%
Tab
le B
.8 N
IEIR
em
plo
ymen
t JT
W n
um
ber
– M
elb
ou
rne
SDSe
ries
Regi
onIn
dust
ry c
ode
Indu
stry
nam
e19
9920
0020
0120
0220
0320
0420
0520
0620
0720
0820
0920
10A
nnua
l gro
wth
NIE
IR E
mpl
oym
ent J
TWM
elbo
urne
SD
AAg
ricul
ture
13,4
5513
,901
13,4
8113
,133
11,6
6811
,304
11,4
8011
,480
11,8
6512
,905
12,9
8614
,316
0.6%
BM
inin
g1,
566
1,78
02,
221
2,77
12,
810
2,84
12,
970
3,15
54,
090
4,56
14,
638
4,95
711
.0%
CM
anuf
actu
ring
261,
709
262,
557
262,
162
259,
979
256,
485
253,
285
254,
306
256,
912
262,
248
269,
294
266,
409
258,
512
-0.1
%
DEl
ec, G
as &
Wat
er9,
052
9,27
99,
744
10,3
0610
,921
11,6
5012
,895
14,6
4717
,071
18,9
0219
,823
21,6
818.
3%
ECo
nstru
ctio
n11
1,54
411
6,36
211
9,24
712
3,28
813
1,30
813
8,73
414
7,58
115
5,81
316
4,79
716
9,71
616
4,79
416
5,00
33.
6%
FW
hole
sale
96,7
1696
,237
94,9
2894
,273
96,0
5196
,929
98,6
9210
0,10
510
2,79
910
4,35
098
,809
98,7
970.
2%
GRe
tail
197,
777
206,
143
211,
150
212,
962
213,
176
211,
343
211,
180
209,
642
207,
746
210,
690
213,
847
221,
330
1.0%
HAc
com
mod
atio
n93
,793
98,1
5710
1,08
510
2,98
210
4,92
910
6,32
610
8,92
511
1,05
311
2,19
511
7,30
212
3,46
213
7,49
23.
5%
APP
END
IX B
: REG
ION
AL
SUM
MA
RY T
AB
LES
MEL
BO
UR
NE’
S N
ORT
H C
ON
TIN
UED

Post GFC SWOT: Melbourne’s North
45
ITr
ans,
Post
al &
W/H
ouse
81,7
0282
,922
83,5
7984
,076
85,0
3486
,745
90,6
8496
,287
103,
234
107,
482
108,
903
116,
522
3.3%
JIn
f Med
ia a
nd Te
leco
m48
,341
50,3
1452
,299
53,2
3553
,724
53,8
8655
,152
57,0
5257
,766
57,9
0056
,239
56,5
401.
4%
KFi
n &
Insu
r Ser
v72
,376
74,0
1675
,096
76,6
9481
,529
85,0
6189
,405
93,5
6395
,780
96,6
7395
,627
96,4
272.
6%
LRe
nt, H
ire &
R/E
stat
e Se
rv20
,797
22,4
7024
,401
26,1
6827
,380
28,2
8129
,461
30,5
5932
,431
33,6
6133
,296
32,8
714.
2%
MPr
of, S
cienc
e &
Tech
Ser
v13
4,18
913
8,92
614
2,41
414
6,29
915
4,80
616
0,24
916
6,32
417
1,03
117
6,79
218
4,06
518
5,07
218
8,19
33.
1%
NAd
min
& S
uppo
rt Se
rv58
,262
62,5
6266
,533
68,9
4269
,715
69,5
3269
,928
69,9
7169
,584
68,0
7768
,797
74,2
022.
2%
OPu
blic
Adm
in77
,832
79,0
2879
,391
80,0
1082
,759
85,0
3888
,594
92,3
3995
,179
97,4
5997
,777
104,
524
2.7%
PEd
ucat
ion
121,
441
124,
848
126,
885
128,
397
130,
354
132,
204
136,
383
141,
288
147,
249
153,
220
156,
057
159,
361
2.5%
QHe
alth
& S
ocia
l16
5,40
017
1,43
817
5,30
217
8,16
418
1,80
518
4,62
919
0,03
419
5,52
019
9,83
420
2,85
020
4,97
921
8,92
62.
6%
RAr
ts &
Rec
Ser
vice
s29
,570
30,8
7232
,077
32,7
6533
,179
33,5
4234
,553
35,8
3937
,068
39,5
3440
,904
41,7
183.
2%
SO
ther
Ser
vice
s77
,293
77,7
2877
,052
76,5
8177
,678
78,0
3278
,997
79,5
2980
,574
86,3
0889
,133
91,2
321.
5%
ALL
Tota
l1,
672,
814
1,71
9,54
01,
749,
046
1,77
1,02
61,
805,
311
1,82
9,61
01,
877,
543
1,92
5,78
51,
978,
303
2,03
4,94
72,
041,
552
2,10
2,60
42.
1%
Tab
le B
.8 N
IEIR
em
plo
ymen
t JT
W n
um
ber
– V
icto
ria
Seri
esRe
gion
Indu
stry
cod
eIn
dust
ry n
ame
1999
2000
2001
2002
2003
2004
2005
2006
2007
2008
2009
2010
Ann
ual g
row
th
NIE
IR E
mpl
oym
ent J
TWVi
ctor
iaA
Agric
ultu
re88
,168
87,3
6686
,229
84,2
8782
,856
80,1
0378
,027
75,8
1275
,104
79,1
0280
,529
84,0
42-0
.4%
BM
inin
g3,
469
3,37
33,
841
4,52
94,
779
5,13
55,
720
6,57
58,
717
9,57
79,
900
10,6
3810
.7%
CM
anuf
actu
ring
324,
553
323,
916
324,
080
322,
340
323,
109
320,
653
322,
873
326,
899
331,
870
331,
950
326,
123
329,
099
0.1%
DEl
ec, G
as &
Wat
er16
,404
16,7
9317
,552
18,4
1319
,478
20,5
1722
,120
24,2
6027
,229
29,2
7629
,705
31,1
916.
0%
ECo
nstru
ctio
n14
3,66
814
9,33
215
3,78
515
9,84
817
3,49
118
4,52
919
6,93
220
8,58
421
9,37
522
6,88
522
4,14
722
9,06
44.
3%
FW
hole
sale
111,
879
110,
740
109,
283
108,
661
111,
911
113,
317
115,
529
117,
389
121,
196
125,
121
122,
589
124,
371
1.0%
GRe
tail
257,
782
267,
054
274,
006
277,
283
282,
348
281,
843
282,
368
280,
988
278,
954
282,
312
285,
617
291,
997
1.1%
HAc
com
mod
atio
n12
7,41
213
2,05
913
5,90
713
8,69
314
3,25
814
5,28
414
8,13
615
0,33
215
1,18
315
8,31
916
3,06
417
1,45
72.
7%
ITr
ans,
Post
al &
W/H
ouse
99,2
5899
,897
100,
699
101,
556
104,
479
106,
768
111,
294
117,
583
125,
533
130,
502
131,
511
138,
258
3.1%
JIn
f Med
ia a
nd Te
leco
m53
,639
55,6
8057
,824
59,1
2460
,211
60,9
1462
,733
65,1
6566
,738
67,1
3465
,224
65,6
351.
9%
KFi
n &
Insu
r Ser
v81
,862
82,7
6883
,416
85,1
8290
,950
95,2
2110
0,15
010
4,79
310
7,17
410
8,92
310
9,26
311
0,55
62.
8%
LRe
nt, H
ire &
R/E
stat
e Se
rv24
,928
26,6
9628
,778
30,7
8432
,699
34,1
1835
,804
37,3
8940
,041
41,5
0840
,836
40,2
544.
5%
MPr
of, S
cienc
e &
Tech
Ser
v14
7,41
215
1,57
615
4,68
715
9,09
716
9,84
417
7,30
118
5,32
519
1,92
219
8,69
920
5,19
620
5,10
420
8,02
73.
2%
NAd
min
& S
uppo
rt Se
rv70
,685
74,8
5278
,876
81,5
1883
,485
83,9
2984
,820
85,2
8985
,718
85,7
8887
,603
91,9
462.
4%
OPu
blic
Adm
in10
4,78
110
5,69
010
6,24
910
7,43
411
2,30
911
5,54
711
9,87
012
4,24
412
7,88
613
1,35
612
9,75
513
5,79
12.
4%
PEd
ucat
ion
161,
107
165,
679
169,
749
172,
510
177,
041
179,
144
183,
310
188,
079
194,
292
201,
110
203,
446
210,
302
2.5%
QHe
alth
& S
ocia
l22
2,13
423
0,65
123
8,24
624
3,69
725
1,44
325
5,11
426
0,80
326
6,10
727
1,53
627
8,28
227
8,35
528
6,70
32.
3%
RAr
ts &
Rec
Ser
vice
s35
,087
36,4
0937
,793
38,7
6939
,812
40,5
3941
,905
43,5
2045
,272
47,9
7749
,405
50,8
683.
4%
SO
ther
Ser
vice
s97
,036
97,1
3396
,537
96,2
8399
,197
100,
211
101,
658
102,
499
103,
170
109,
587
113,
508
116,
077
1.6%
ALL
Tota
l2,
171,
264
2,21
7,66
42,
257,
535
2,29
0,00
72,
362,
699
2,40
0,19
02,
459,
376
2,51
7,43
02,
579,
689
2,64
9,90
52,
655,
684
2,72
6,27
72.
1%

46
Tab
le B
.9 E
xpo
rts
Mel
bo
urn
e’s
No
rth
– $
mill
ion
Seri
esRe
gion
Indu
stry
cod
eIn
dust
ry n
ame
1999
2000
2001
2002
2003
2004
2005
2006
2007
2008
2009
2010
Ann
ual g
row
th
Expo
rtsM
elbo
urne
’s N
orth
AAg
ricul
ture
55
56
77
67
88
88
4.5%
BM
inin
g30
3233
2835
3431
3230
2832
340.
9%
CM
anuf
actu
ring
2414
2446
2425
2456
2591
2620
2724
2828
2860
2972
2936
2894
1.7%
DEl
ec, G
as &
Wat
er12
1212
1113
1316
2322
2326
298.
2%
ECo
nstru
ctio
n0
00
00
00
00
00
00
FW
hole
sale
364
374
349
365
380
369
359
379
393
372
397
390
0.6%
GRe
tail
158
156
157
155
158
164
163
171
167
162
172
160
0.1%
HAc
com
mod
atio
n88
8294
8595
106
9786
9294
9993
0.5%
ITr
ans,
Post
al &
W/H
ouse
861
829
841
812
823
802
782
774
749
725
724
709
-1.7
%
JIn
f Med
ia a
nd Te
leco
m11
711
511
911
812
812
712
812
813
113
213
913
51.
3%
KFi
n &
Insu
r Ser
v29
3029
3131
3132
3233
3333
320.
9%
LRe
nt, H
ire &
R/E
stat
e Se
rv45
4336
3839
3634
3434
2532
30-3
.8%
MPr
of, S
cienc
e &
Tech
Ser
v86
9187
9310
010
010
510
411
010
511
411
93.
0%
NAd
min
& S
uppo
rt Se
rv11
1214
1014
1414
1721
2020
216.
0%
OPu
blic
Adm
in47
4645
4545
4747
4747
4544
41-1
.3%
PEd
ucat
ion
111
110
106
109
103
105
107
112
106
106
102
98-1
.1%
QHe
alth
& S
ocia
l17
117
917
319
218
119
419
719
920
821
221
821
01.
9%
RAr
ts &
Rec
Ser
vice
s21
2123
2222
2423
2524
2424
262.
0%
SO
ther
Ser
vice
s21
1819
2823
2528
3736
3538
385.
4%
ALL
Tota
l4,
592
4,60
14,
568
4,60
44,
787
4,81
84,
894
5,03
55,
074
5,12
25,
158
5,06
70.
9%
APP
END
IX B
: REG
ION
AL
SUM
MA
RY T
AB
LES
MEL
BO
UR
NE’
S N
ORT
H C
ON
TIN
UED

Post GFC SWOT: Melbourne’s North
47
Banyule (C)
APPENDIX C: MELBOURNE’S NORTH LGA TABLESC

48
Banyule (C)
APPENDIX C: MELBOURNE’S NORTH LGA TABLES CONTINUED

Post GFC SWOT: Melbourne’s North
49
Banyule (C)

50
Banyule (C)
APPENDIX C: MELBOURNE’S NORTH LGA TABLES CONTINUED

Post GFC SWOT: Melbourne’s North
51
Darebin (C)
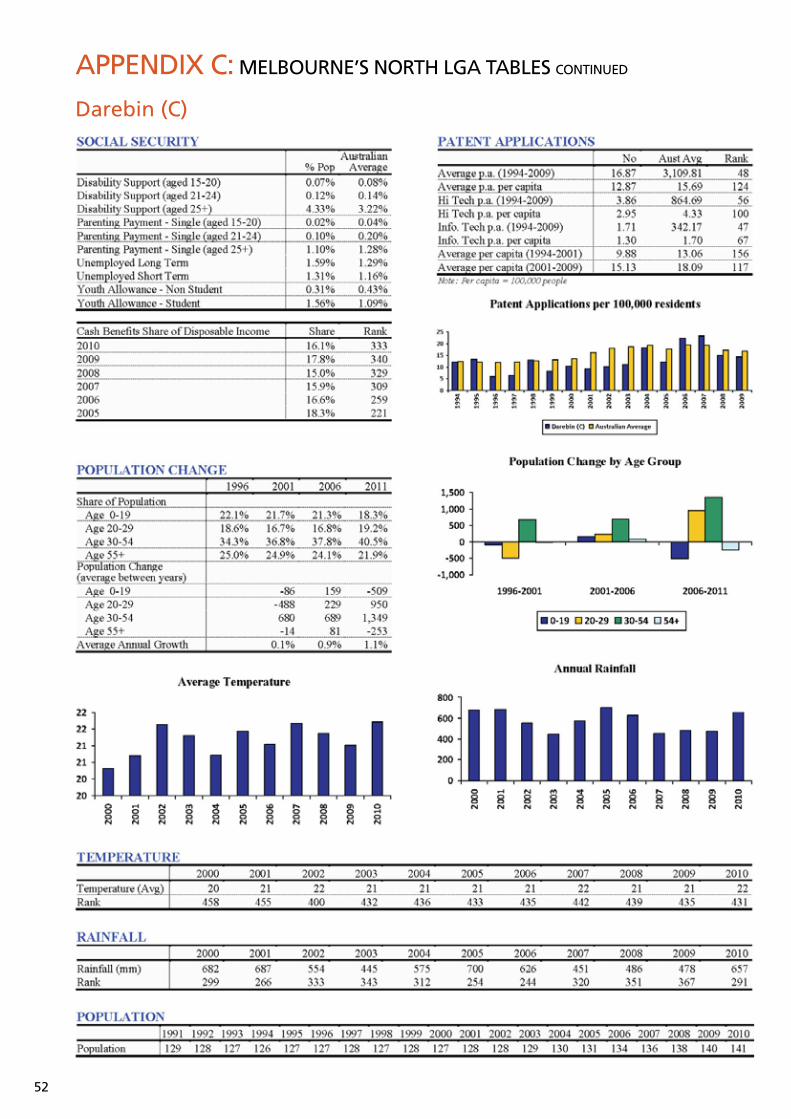
52
Darebin (C)
APPENDIX C: MELBOURNE’S NORTH LGA TABLES CONTINUED
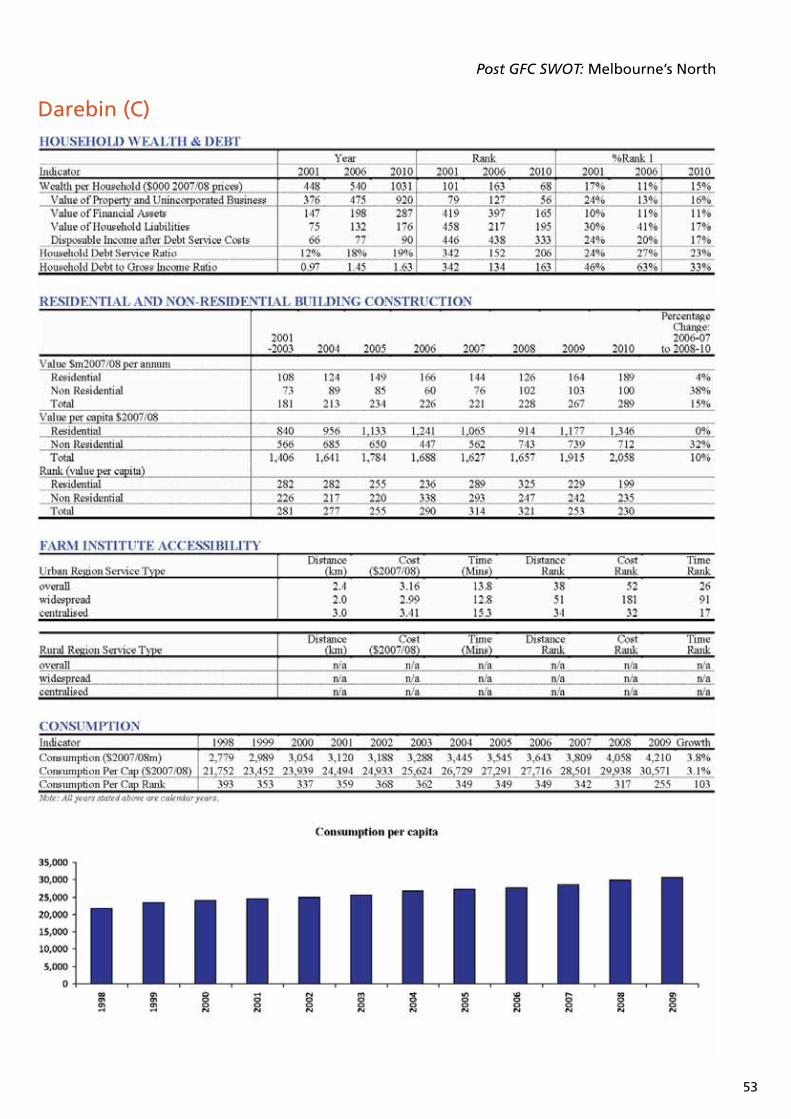
Post GFC SWOT: Melbourne’s North
53
Darebin (C)

54
Darebin (C)
APPENDIX C: MELBOURNE’S NORTH LGA TABLES CONTINUED

Post GFC SWOT: Melbourne’s North
55
Hume (C)

56
Hume (C)
APPENDIX C: MELBOURNE’S NORTH LGA TABLES CONTINUED

Post GFC SWOT: Melbourne’s North
57
Hume (C)

58
Hume (C)
APPENDIX C: MELBOURNE’S NORTH LGA TABLES CONTINUED

Post GFC SWOT: Melbourne’s North
59
Moreland (C)

60
Moreland (C)
APPENDIX C: MELBOURNE’S NORTH LGA TABLES CONTINUED

Post GFC SWOT: Melbourne’s North
61
Moreland (C)

62
Moreland (C)
APPENDIX C: MELBOURNE’S NORTH LGA TABLES CONTINUED

Post GFC SWOT: Melbourne’s North
63
Nillumbik (S)

64
Nillumbik (S)
APPENDIX C: MELBOURNE’S NORTH LGA TABLES CONTINUED

Post GFC SWOT: Melbourne’s North
65
Nillumbik (S)

66
Nillumbik (S)
APPENDIX C: MELBOURNE’S NORTH LGA TABLES CONTINUED

Post GFC SWOT: Melbourne’s North
67
Whittlesea (C)
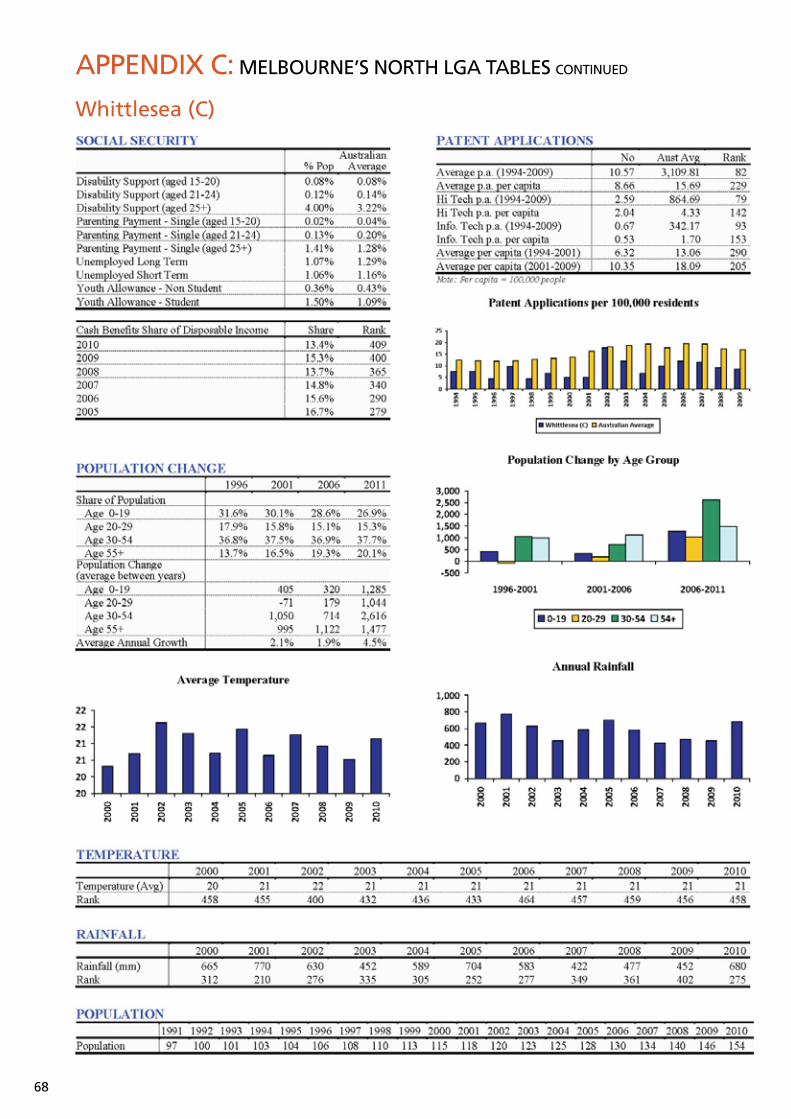
68
Whittlesea (C)
APPENDIX C: MELBOURNE’S NORTH LGA TABLES CONTINUED

Post GFC SWOT: Melbourne’s North
69
Whittlesea (C)

70
Whittlesea (C)
APPENDIX C: MELBOURNE’S NORTH LGA TABLES CONTINUED

Post GFC SWOT: Melbourne’s North
71
Yarra (C)

72
Yarra (C)
APPENDIX C: MELBOURNE’S NORTH LGA TABLES CONTINUED

Post GFC SWOT: Melbourne’s North
73
Yarra (C)
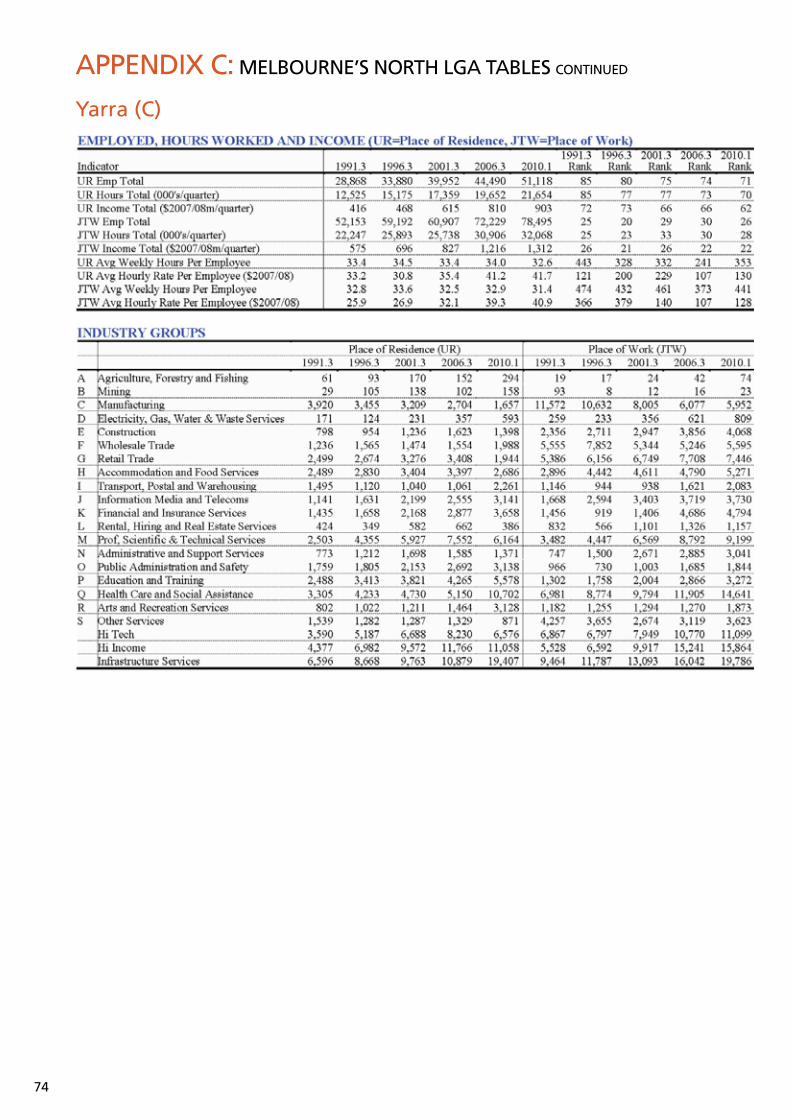
74
Yarra (C)
APPENDIX C: MELBOURNE’S NORTH LGA TABLES CONTINUED

Post GFC SWOT: Melbourne’s North
75
