october 2015 manhattan beach real estate market trends update
TRANSCRIPT

Table of
Contents
Key Statistics for October
Sales 2015 Residential Sales Stats Year-to-Year Total Sales by Map Area Median 2015 Median Sales Stats Year-to-Year Median Sales by Map Area Listings 2015 Active Listings by Map Area 2015 Total Active Listings vs. Total Sales Year-to-Year Active Listings by Map Area Inventory 2015 Months of Inventory by Map Area Year-to-Year Months of Inventory
Summary
About Hady Chahine Contact Information
Key Statistics for October
Back to Table of Contents
= trending positive = trending positive
= trending negative = trending negative
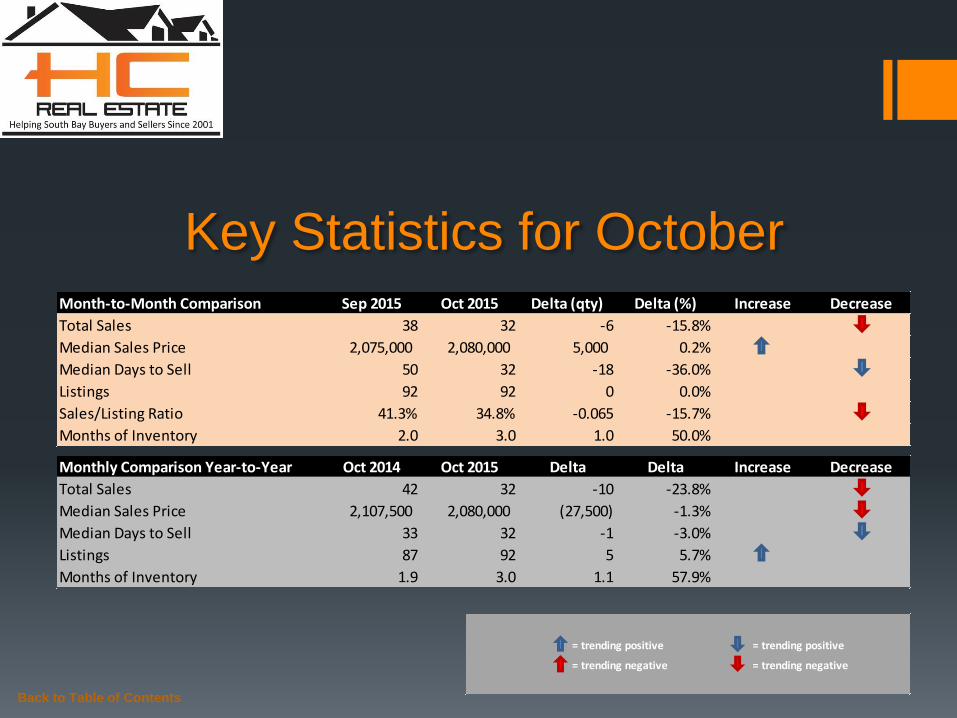
Month-to-Month Comparison Sep 2015 Oct 2015 Delta (qty) Delta (%) Increase Decrease
Total Sales 38 32 -6 -15.8%
Median Sales Price 2,075,000 2,080,000 5,000 0.2%
Median Days to Sell 50 32 -18 -36.0%
Listings 92 92 0 0.0%
Sales/Listing Ratio 41.3% 34.8% -0.065 -15.7%
Months of Inventory 2.0 3.0 1.0 50.0%
Monthly Comparison Year-to-Year Oct 2014 Oct 2015 Delta Delta Increase Decrease
Total Sales 42 32 -10 -23.8%
Median Sales Price 2,107,500 2,080,000 (27,500) -1.3%
Median Days to Sell 33 32 -1 -3.0%
Listings 87 92 5 5.7%
Months of Inventory 1.9 3.0 1.1 57.9%

Back to Table of Contents
Total Sales Month-to-Month by Map Area Aug Sep Oct
Manhattan Bch Sand 9 13 11
Manhattan Bch Tree 5 14 5
Manhattan Bch Hill 3 3 2
Manhattan Village 2 - 2
Manhattan Bch Heights/Lib Vlg 4 5 5
Manhattan Bch Mira Costa 7 3 7
Total Sales 30 38 32
-
5
10
15
20
25
30
35
40
Aug Sep Oct
2015 Total Sales Month-to-Month by Map Area
Manhattan Bch Sand
Manhattan Bch Tree
Manhattan Bch Hill
Manhattan Village
Manhattan Bch Heights/Lib Vlg
Manhattan Bch Mira Costa
Total Sales

Back to Table of Contents
Total Sales Year-to-Year by Map Area 2013 2014 2015
Manhattan Bch Sand 5 10 11
Manhattan Bch Tree 11 12 5
Manhattan Bch Hill 3 2 2
Manhattan Village 2 3 2
Manhattan Bch Heights/Lib Vlg 5 5 5
Manhattan Bch Mira Costa 3 10 7
Total Sales 29 42 32
-
5
10
15
20
25
30
35
40
45
2013 2014 2015
Total Sales Year-to-Year by Map Area: October
Manhattan Bch Sand
Manhattan Bch Tree
Manhattan Bch Hill
Manhattan Village
Manhattan Bch Heights/Lib Vlg
Manhattan Bch Mira Costa
Total Sales
Back to Table of Contents
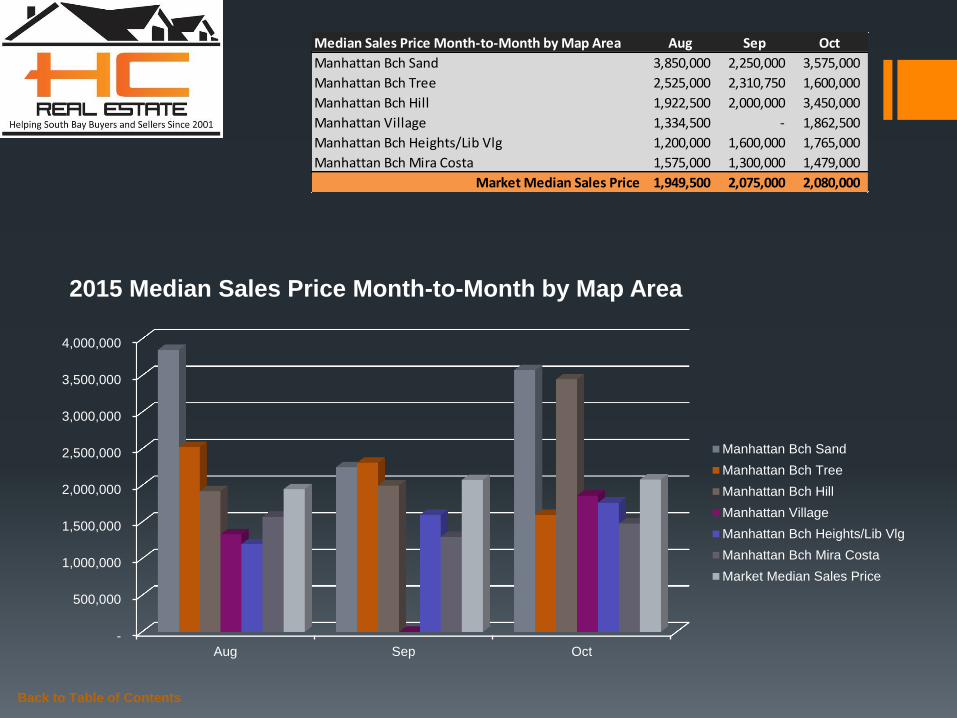
Median Sales Price Month-to-Month by Map Area Aug Sep Oct
Manhattan Bch Sand 3,850,000 2,250,000 3,575,000
Manhattan Bch Tree 2,525,000 2,310,750 1,600,000
Manhattan Bch Hill 1,922,500 2,000,000 3,450,000
Manhattan Village 1,334,500 - 1,862,500
Manhattan Bch Heights/Lib Vlg 1,200,000 1,600,000 1,765,000
Manhattan Bch Mira Costa 1,575,000 1,300,000 1,479,000
Market Median Sales Price 1,949,500 2,075,000 2,080,000
-
500,000
1,000,000
1,500,000
2,000,000
2,500,000
3,000,000
3,500,000
4,000,000
Aug Sep Oct
2015 Median Sales Price Month-to-Month by Map Area
Manhattan Bch Sand
Manhattan Bch Tree
Manhattan Bch Hill
Manhattan Village
Manhattan Bch Heights/Lib Vlg
Manhattan Bch Mira Costa
Market Median Sales Price

Back to Table of Contents
Median Sales Price Year-to-Year by Map Area 2013 2014 2015
Manhattan Bch Sand 1,760,000 2,500,000 3,575,000
Manhattan Bch Tree 1,520,000 2,226,000 1,600,000
Manhattan Bch Hill 1,750,000 2,699,500 3,450,000
Manhattan Village 1,017,500 1,150,000 1,862,500
Manhattan Bch Heights/Lib Vlg 1,335,000 1,510,000 1,765,000
Manhattan Bch Mira Costa 1,960,000 1,824,000 1,479,000
Market Median Sales Price 1,520,000 2,107,500 2,080,000
-
500,000
1,000,000
1,500,000
2,000,000
2,500,000
3,000,000
3,500,000
4,000,000
2013 2014 2015
Median Sales Price Year-to-Year by Map Area: October
Manhattan Bch Sand
Manhattan Bch Tree
Manhattan Bch Hill
Manhattan Village
Manhattan Bch Heights/Lib Vlg
Manhattan Bch Mira Costa
Market Median Sales Price
Back to Table of Contents
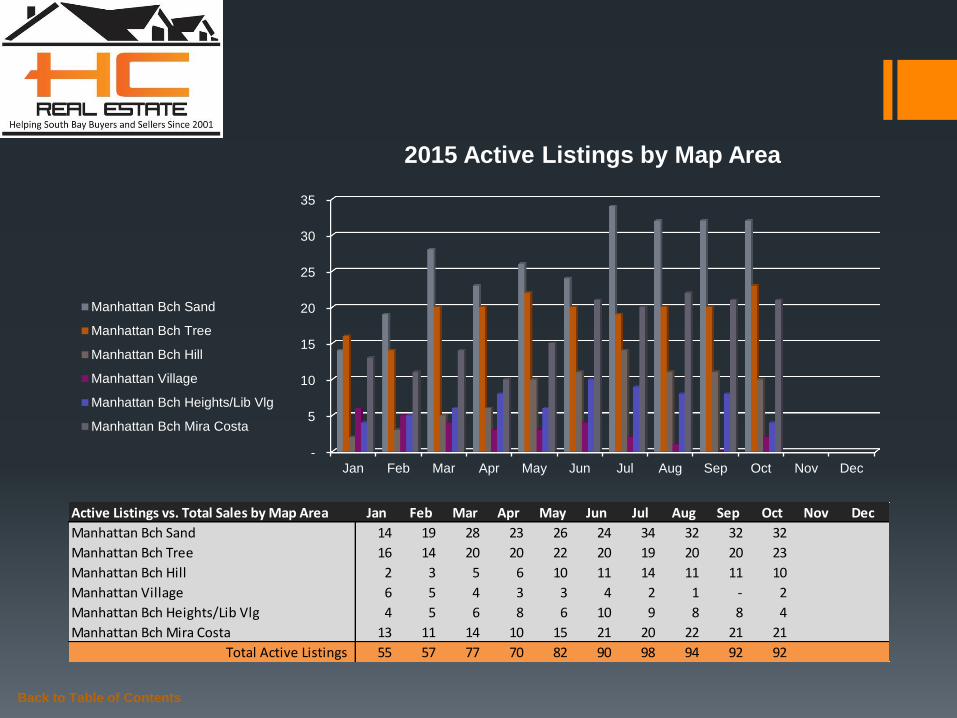
Active Listings vs. Total Sales by Map Area Jan Feb Mar Apr May Jun Jul Aug Sep Oct Nov Dec
Manhattan Bch Sand 14 19 28 23 26 24 34 32 32 32
Manhattan Bch Tree 16 14 20 20 22 20 19 20 20 23
Manhattan Bch Hill 2 3 5 6 10 11 14 11 11 10
Manhattan Village 6 5 4 3 3 4 2 1 - 2
Manhattan Bch Heights/Lib Vlg 4 5 6 8 6 10 9 8 8 4
Manhattan Bch Mira Costa 13 11 14 10 15 21 20 22 21 21
Total Active Listings 55 57 77 70 82 90 98 94 92 92
-
5
10
15
20
25
30
35
Jan Feb Mar Apr May Jun Jul Aug Sep Oct Nov Dec
2015 Active Listings by Map Area
Manhattan Bch Sand
Manhattan Bch Tree
Manhattan Bch Hill
Manhattan Village
Manhattan Bch Heights/Lib Vlg
Manhattan Bch Mira Costa

Back to Table of Contents
Active Listings vs. Total Sales by Map Area Jan Feb Mar Apr May Jun Jul Aug Sep Oct Nov Dec
Manhattan Bch Sand 14 19 28 23 26 24 34 32 32 32
Manhattan Bch Tree 16 14 20 20 22 20 19 20 20 23
Manhattan Bch Hill 2 3 5 6 10 11 14 11 11 10
Manhattan Village 6 5 4 3 3 4 2 1 - 2
Manhattan Bch Heights/Lib Vlg 4 5 6 8 6 10 9 8 8 4
Manhattan Bch Mira Costa 13 11 14 10 15 21 20 22 21 21
Total Active Listings 55 57 77 70 82 90 98 94 92 92
Total Sales 21 19 34 31 36 35 32 30 38 32
Sales/Listings Ratio 38.2% 33.3% 44.2% 44.3% 43.9% 38.9% 32.7% 31.9% 41.3% 34.8%
-
10
20
30
40
50
60
70
80
90
100
Jan Feb Mar Apr May Jun Jul Aug Sep Oct Nov Dec
2015 Total Active Listings vs. Total Sales
Total Active Listings
Total Sales
Back to Table of Contents
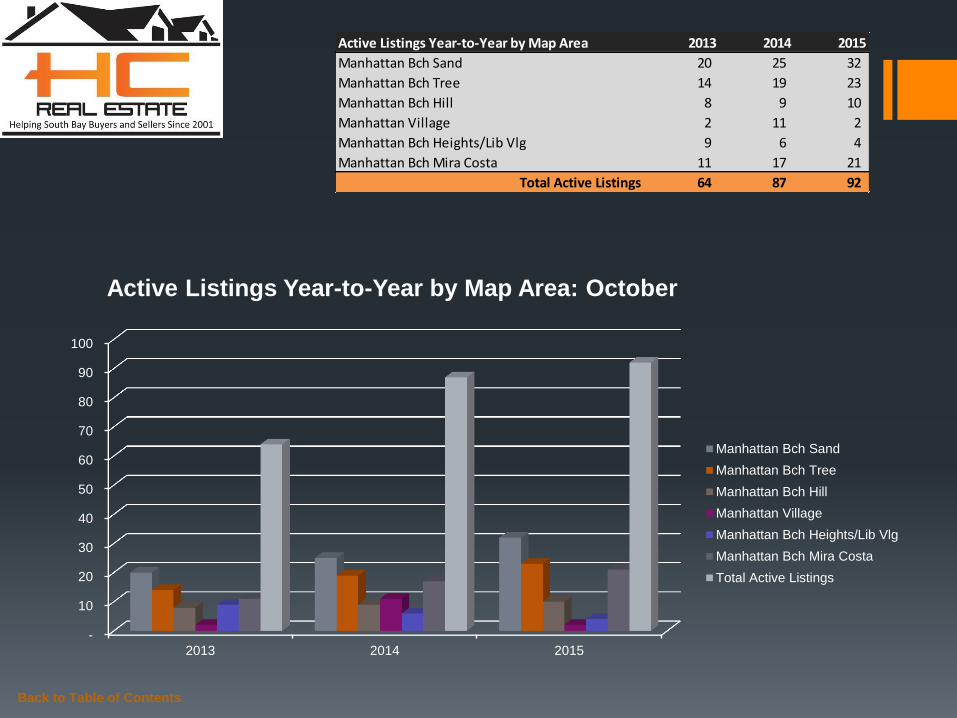
Active Listings Year-to-Year by Map Area 2013 2014 2015
Manhattan Bch Sand 20 25 32
Manhattan Bch Tree 14 19 23
Manhattan Bch Hill 8 9 10
Manhattan Village 2 11 2
Manhattan Bch Heights/Lib Vlg 9 6 4
Manhattan Bch Mira Costa 11 17 21
Total Active Listings 64 87 92
-
10
20
30
40
50
60
70
80
90
100
2013 2014 2015
Active Listings Year-to-Year by Map Area: October
Manhattan Bch Sand
Manhattan Bch Tree
Manhattan Bch Hill
Manhattan Village
Manhattan Bch Heights/Lib Vlg
Manhattan Bch Mira Costa
Total Active Listings
Back to Table of Contents
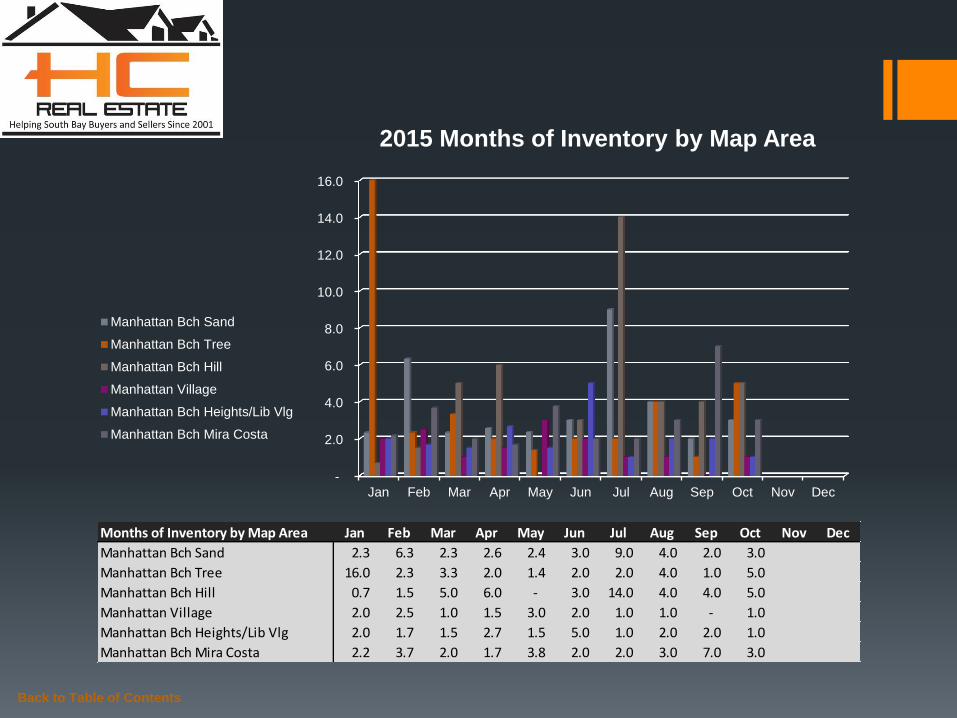
Months of Inventory by Map Area Jan Feb Mar Apr May Jun Jul Aug Sep Oct Nov Dec
Manhattan Bch Sand 2.3 6.3 2.3 2.6 2.4 3.0 9.0 4.0 2.0 3.0
Manhattan Bch Tree 16.0 2.3 3.3 2.0 1.4 2.0 2.0 4.0 1.0 5.0
Manhattan Bch Hill 0.7 1.5 5.0 6.0 - 3.0 14.0 4.0 4.0 5.0
Manhattan Village 2.0 2.5 1.0 1.5 3.0 2.0 1.0 1.0 - 1.0
Manhattan Bch Heights/Lib Vlg 2.0 1.7 1.5 2.7 1.5 5.0 1.0 2.0 2.0 1.0
Manhattan Bch Mira Costa 2.2 3.7 2.0 1.7 3.8 2.0 2.0 3.0 7.0 3.0
-
2.0
4.0
6.0
8.0
10.0
12.0
14.0
16.0
Jan Feb Mar Apr May Jun Jul Aug Sep Oct Nov Dec
2015 Months of Inventory by Map Area
Manhattan Bch Sand
Manhattan Bch Tree
Manhattan Bch Hill
Manhattan Village
Manhattan Bch Heights/Lib Vlg
Manhattan Bch Mira Costa
Back to Table of Contents
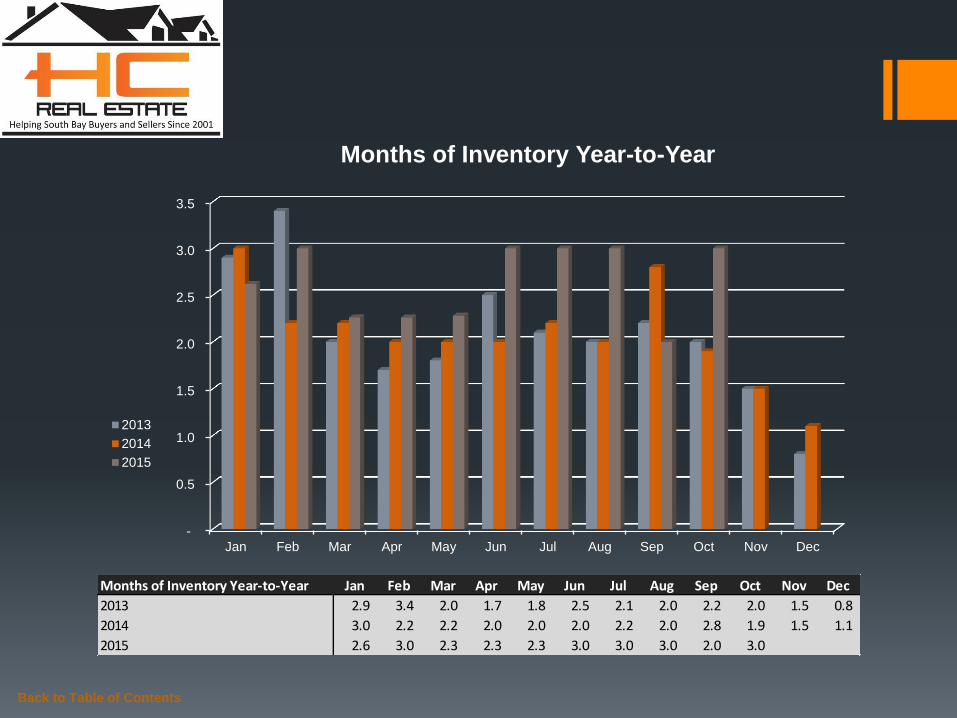
Months of Inventory Year-to-Year Jan Feb Mar Apr May Jun Jul Aug Sep Oct Nov Dec
2013 2.9 3.4 2.0 1.7 1.8 2.5 2.1 2.0 2.2 2.0 1.5 0.8
2014 3.0 2.2 2.2 2.0 2.0 2.0 2.2 2.0 2.8 1.9 1.5 1.1
2015 2.6 3.0 2.3 2.3 2.3 3.0 3.0 3.0 2.0 3.0
-
0.5
1.0
1.5
2.0
2.5
3.0
3.5
Jan Feb Mar Apr May Jun Jul Aug Sep Oct Nov Dec
Months of Inventory Year-to-Year
2013
2014
2015
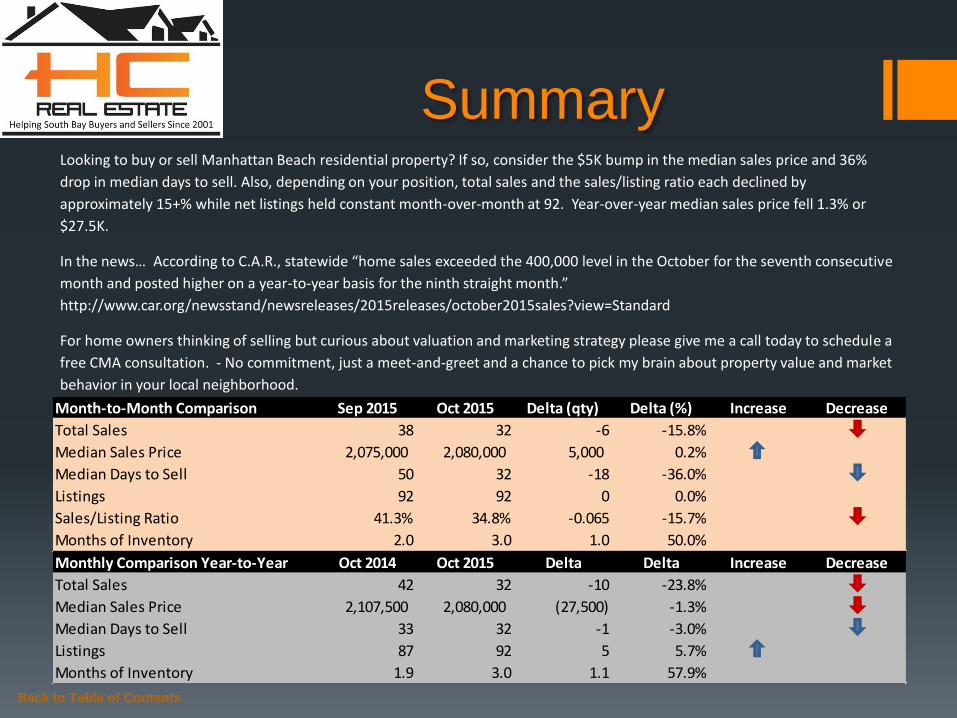
Summary Looking to buy or sell Manhattan Beach residential property? If so, consider the $5K bump in the median sales price and 36%
drop in median days to sell. Also, depending on your position, total sales and the sales/listing ratio each declined by
approximately 15+% while net listings held constant month-over-month at 92. Year-over-year median sales price fell 1.3% or
$27.5K.
In the news… According to C.A.R., statewide “home sales exceeded the 400,000 level in the October for the seventh consecutive
month and posted higher on a year-to-year basis for the ninth straight month.”
http://www.car.org/newsstand/newsreleases/2015releases/october2015sales?view=Standard
For home owners thinking of selling but curious about valuation and marketing strategy please give me a call today to schedule a
free CMA consultation. - No commitment, just a meet-and-greet and a chance to pick my brain about property value and market
behavior in your local neighborhood.
Back to Table of Contents
Month-to-Month Comparison Sep 2015 Oct 2015 Delta (qty) Delta (%) Increase Decrease
Total Sales 38 32 -6 -15.8%
Median Sales Price 2,075,000 2,080,000 5,000 0.2%
Median Days to Sell 50 32 -18 -36.0%
Listings 92 92 0 0.0%
Sales/Listing Ratio 41.3% 34.8% -0.065 -15.7%
Months of Inventory 2.0 3.0 1.0 50.0%
Monthly Comparison Year-to-Year Oct 2014 Oct 2015 Delta Delta Increase Decrease
Total Sales 42 32 -10 -23.8%
Median Sales Price 2,107,500 2,080,000 (27,500) -1.3%
Median Days to Sell 33 32 -1 -3.0%
Listings 87 92 5 5.7%
Months of Inventory 1.9 3.0 1.1 57.9%

Serving South Bay Home Buyers and Sellers Since 2001
RE/MAX Top 4 Team in California – 2012
RE/MAX 100% Club - 2011
Shorewood Realtors Top 5% in Overall Sales 2001-2006, 2008-2010
Back to Table of Contents
About
Hady Chahine…

The information being provided by CARETS (CLAW, CRISNet MLS, DAMLS, CRMLS, i-Tech MLS, and/or VCRDS) is for the visitor’s personal, non-commercial use and may not be used for
any purpose other than to identify prospective properties visitor may be interested in purchasing. Any information relating to a property referenced on this web site comes from the Internet
Data Exchange (IDX) program of CARETS. This web site may reference real estate listing(s) held by a brokerage firm other than the broker and/or agent who owns this web site. The accuracy
of all information, regardless of source, including but not limited to square footages and lot sizes, is deemed reliable but not guaranteed and should be personally verified through personal
inspection by and/or with the appropriate professionals.
Back to Table of Contents
Listings MLS BLOG Website
Hady Chahine
• 310-404-5361