june 2016 manhattan beach real estate market trends update
TRANSCRIPT

Table of
Contents
Key Statistics for June
Sales 2016 Residential Sales Stats Year-to-Year Total Sales by Map Area Median 2016 Median Sales Stats Year-to-Year Median Sales by Map Area Listings 2016 Active Listings by Map Area 2016 Total Active Listings vs. Total Sales Year-to-Year Active Listings by Map Area Inventory 2016 Months of Inventory by Map Area Year-to-Year Months of Inventory
Summary
About Hady Chahine Contact Information
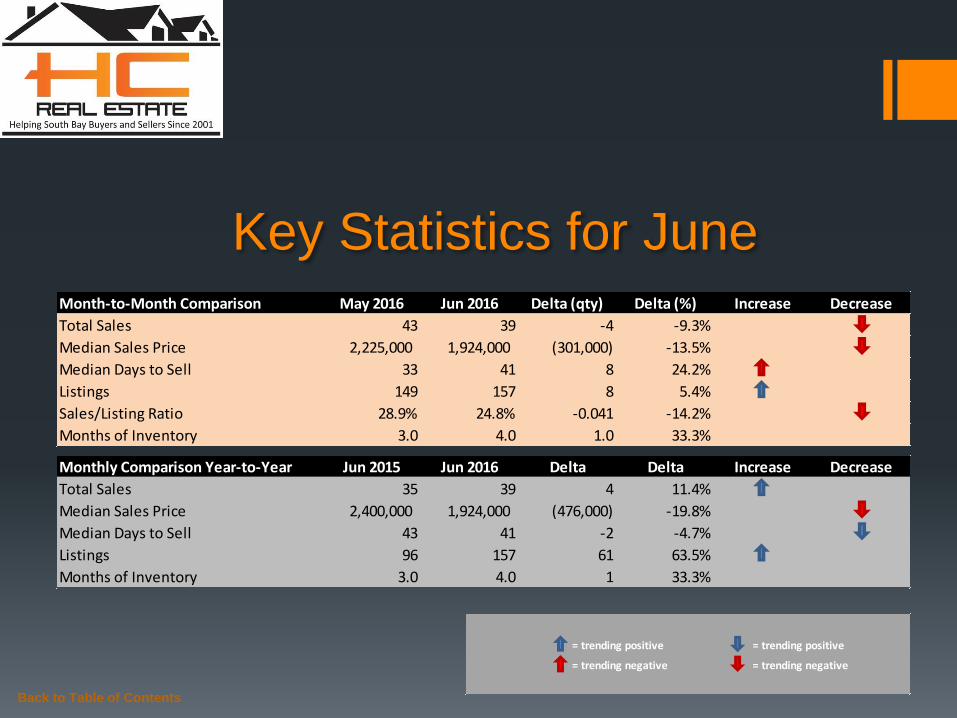
Key Statistics for June
Back to Table of Contents
= trending positive = trending positive
= trending negative = trending negative
Month-to-Month Comparison May 2016 Jun 2016 Delta (qty) Delta (%) Increase Decrease
Total Sales 43 39 -4 -9.3%
Median Sales Price 2,225,000 1,924,000 (301,000) -13.5%
Median Days to Sell 33 41 8 24.2%
Listings 149 157 8 5.4%
Sales/Listing Ratio 28.9% 24.8% -0.041 -14.2%
Months of Inventory 3.0 4.0 1.0 33.3%
Monthly Comparison Year-to-Year Jun 2015 Jun 2016 Delta Delta Increase Decrease
Total Sales 35 39 4 11.4%
Median Sales Price 2,400,000 1,924,000 (476,000) -19.8%
Median Days to Sell 43 41 -2 -4.7%
Listings 96 157 61 63.5%
Months of Inventory 3.0 4.0 1 33.3%
Back to Table of Contents
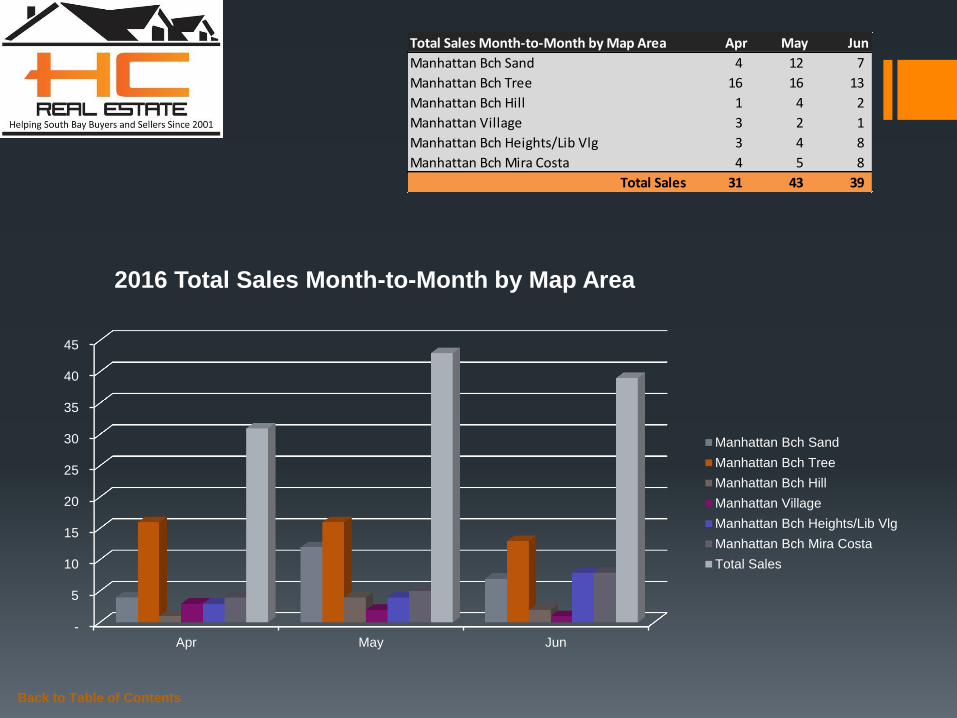
Total Sales Month-to-Month by Map Area Apr May Jun
Manhattan Bch Sand 4 12 7
Manhattan Bch Tree 16 16 13
Manhattan Bch Hill 1 4 2
Manhattan Village 3 2 1
Manhattan Bch Heights/Lib Vlg 3 4 8
Manhattan Bch Mira Costa 4 5 8
Total Sales 31 43 39
-
5
10
15
20
25
30
35
40
45
Apr May Jun
2016 Total Sales Month-to-Month by Map Area
Manhattan Bch Sand
Manhattan Bch Tree
Manhattan Bch Hill
Manhattan Village
Manhattan Bch Heights/Lib Vlg
Manhattan Bch Mira Costa
Total Sales
Back to Table of Contents
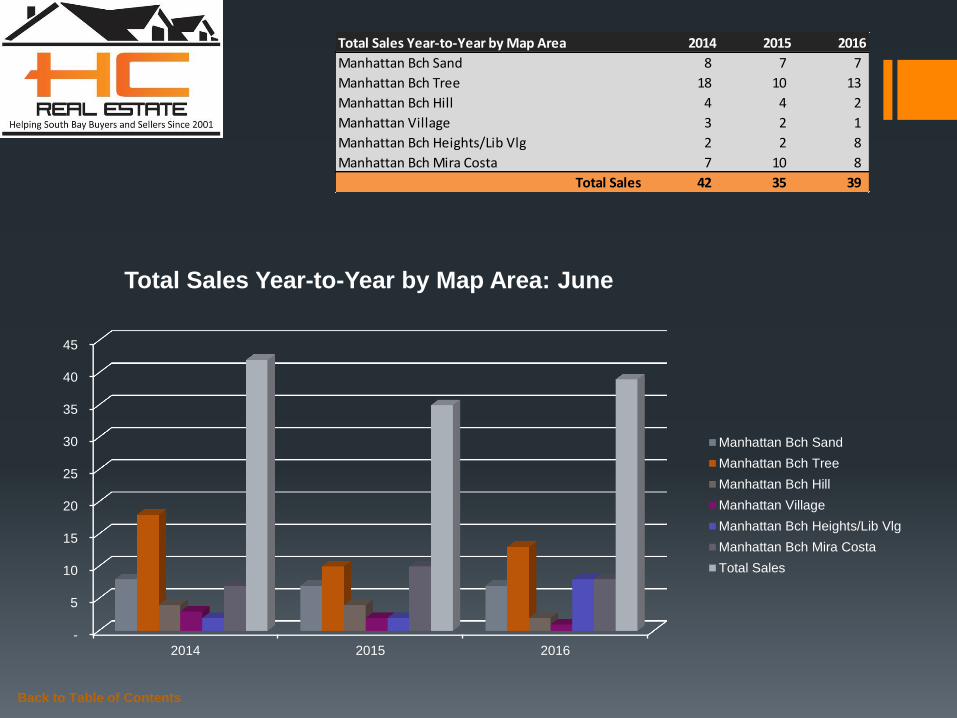
Total Sales Year-to-Year by Map Area 2014 2015 2016
Manhattan Bch Sand 8 7 7
Manhattan Bch Tree 18 10 13
Manhattan Bch Hill 4 4 2
Manhattan Village 3 2 1
Manhattan Bch Heights/Lib Vlg 2 2 8
Manhattan Bch Mira Costa 7 10 8
Total Sales 42 35 39
-
5
10
15
20
25
30
35
40
45
2014 2015 2016
Total Sales Year-to-Year by Map Area: June
Manhattan Bch Sand
Manhattan Bch Tree
Manhattan Bch Hill
Manhattan Village
Manhattan Bch Heights/Lib Vlg
Manhattan Bch Mira Costa
Total Sales
Back to Table of Contents
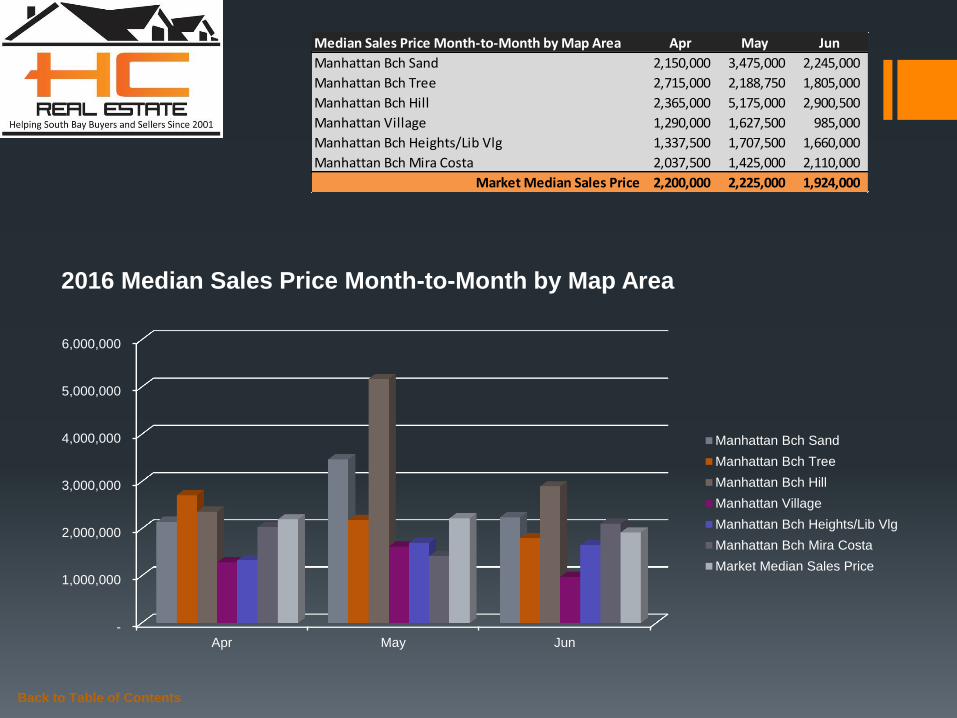
Median Sales Price Month-to-Month by Map Area Apr May Jun
Manhattan Bch Sand 2,150,000 3,475,000 2,245,000
Manhattan Bch Tree 2,715,000 2,188,750 1,805,000
Manhattan Bch Hill 2,365,000 5,175,000 2,900,500
Manhattan Village 1,290,000 1,627,500 985,000
Manhattan Bch Heights/Lib Vlg 1,337,500 1,707,500 1,660,000
Manhattan Bch Mira Costa 2,037,500 1,425,000 2,110,000
Market Median Sales Price 2,200,000 2,225,000 1,924,000
-
1,000,000
2,000,000
3,000,000
4,000,000
5,000,000
6,000,000
Apr May Jun
2016 Median Sales Price Month-to-Month by Map Area
Manhattan Bch Sand
Manhattan Bch Tree
Manhattan Bch Hill
Manhattan Village
Manhattan Bch Heights/Lib Vlg
Manhattan Bch Mira Costa
Market Median Sales Price
Back to Table of Contents
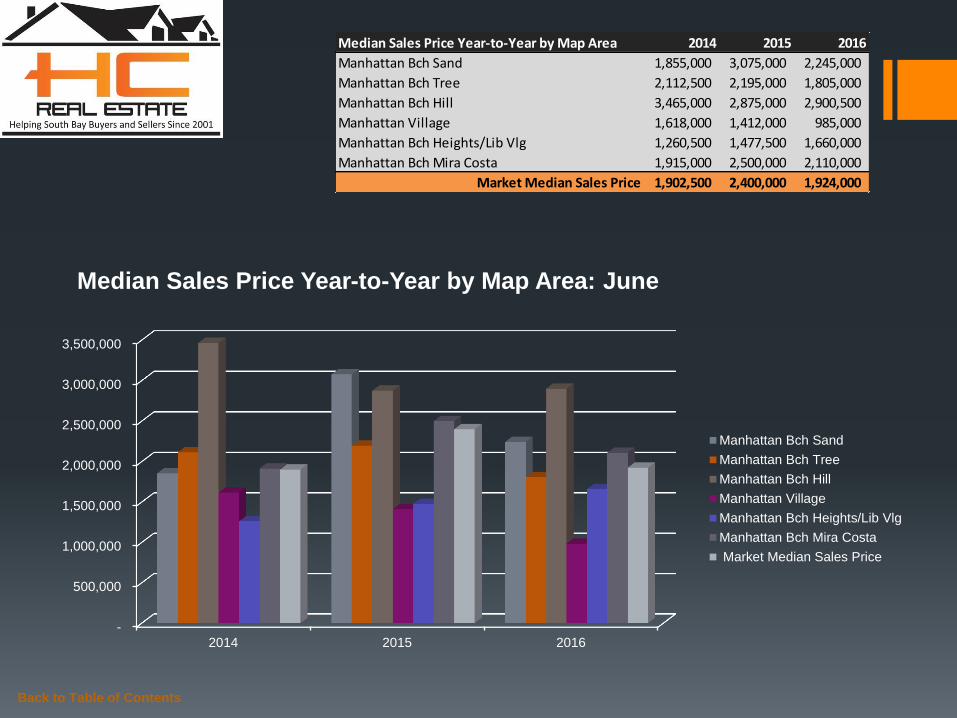
Median Sales Price Year-to-Year by Map Area 2014 2015 2016
Manhattan Bch Sand 1,855,000 3,075,000 2,245,000
Manhattan Bch Tree 2,112,500 2,195,000 1,805,000
Manhattan Bch Hill 3,465,000 2,875,000 2,900,500
Manhattan Village 1,618,000 1,412,000 985,000
Manhattan Bch Heights/Lib Vlg 1,260,500 1,477,500 1,660,000
Manhattan Bch Mira Costa 1,915,000 2,500,000 2,110,000
Market Median Sales Price 1,902,500 2,400,000 1,924,000
-
500,000
1,000,000
1,500,000
2,000,000
2,500,000
3,000,000
3,500,000
2014 2015 2016
Median Sales Price Year-to-Year by Map Area: June
Manhattan Bch Sand
Manhattan Bch Tree
Manhattan Bch Hill
Manhattan Village
Manhattan Bch Heights/Lib Vlg
Manhattan Bch Mira Costa
Market Median Sales Price
Back to Table of Contents
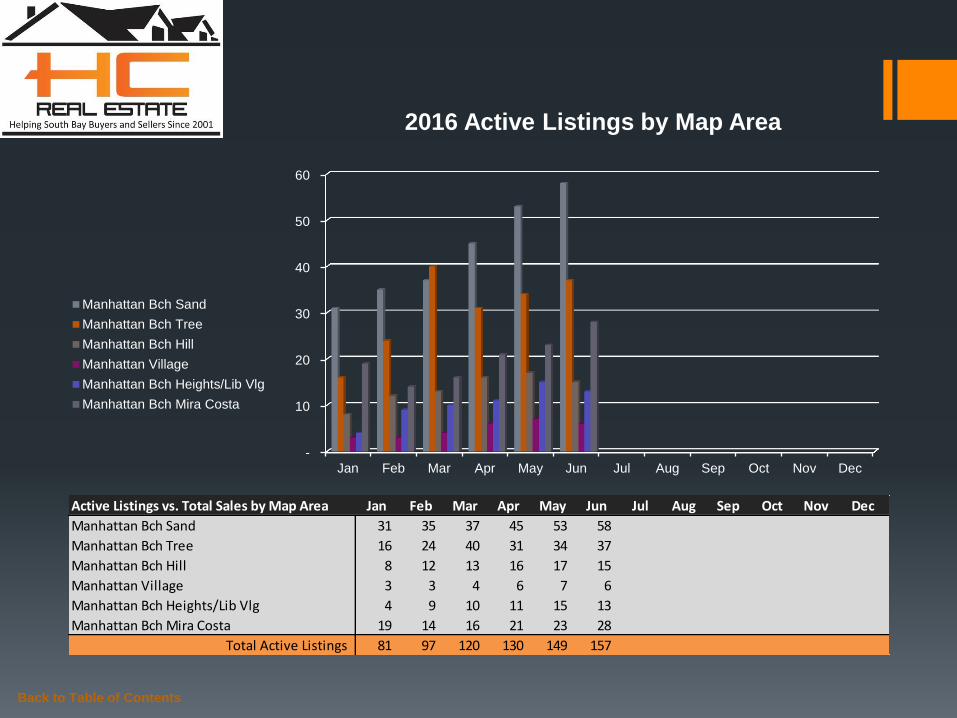
Active Listings vs. Total Sales by Map Area Jan Feb Mar Apr May Jun Jul Aug Sep Oct Nov Dec
Manhattan Bch Sand 31 35 37 45 53 58
Manhattan Bch Tree 16 24 40 31 34 37
Manhattan Bch Hill 8 12 13 16 17 15
Manhattan Village 3 3 4 6 7 6
Manhattan Bch Heights/Lib Vlg 4 9 10 11 15 13
Manhattan Bch Mira Costa 19 14 16 21 23 28
Total Active Listings 81 97 120 130 149 157
-
10
20
30
40
50
60
Jan Feb Mar Apr May Jun Jul Aug Sep Oct Nov Dec
2016 Active Listings by Map Area
Manhattan Bch Sand
Manhattan Bch Tree
Manhattan Bch Hill
Manhattan Village
Manhattan Bch Heights/Lib Vlg
Manhattan Bch Mira Costa

Back to Table of Contents
Active Listings vs. Total Sales by Map Area Jan Feb Mar Apr May Jun Jul Aug Sep Oct Nov Dec
Manhattan Bch Sand 31 35 37 45 53 58
Manhattan Bch Tree 16 24 40 31 34 37
Manhattan Bch Hill 8 12 13 16 17 15
Manhattan Village 3 3 4 6 7 6
Manhattan Bch Heights/Lib Vlg 4 9 10 11 15 13
Manhattan Bch Mira Costa 19 14 16 21 23 28
Total Active Listings 81 97 120 130 149 157
Total Sales 15 21 34 31 43 39
Sales/Listings Ratio 18.5% 21.6% 28.3% 23.8% 28.9% 24.8%
-
20
40
60
80
100
120
140
160
Jan Feb Mar Apr May Jun Jul Aug Sep Oct Nov Dec
2016 Total Active Listings vs. Total Sales
Total Active Listings Total Sales
Back to Table of Contents
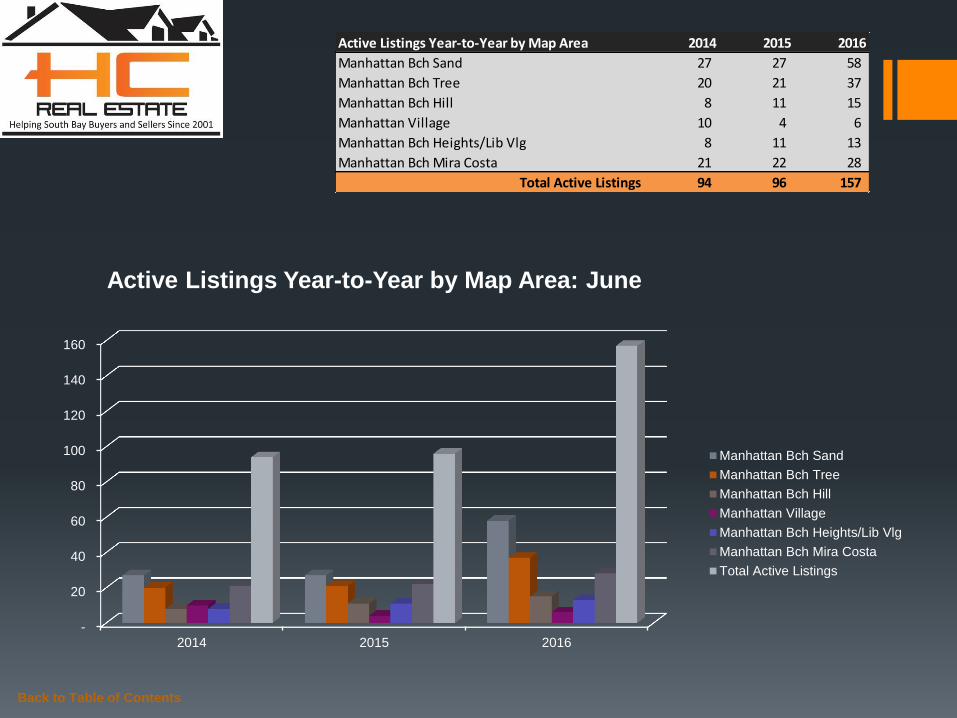
Active Listings Year-to-Year by Map Area 2014 2015 2016
Manhattan Bch Sand 27 27 58
Manhattan Bch Tree 20 21 37
Manhattan Bch Hill 8 11 15
Manhattan Village 10 4 6
Manhattan Bch Heights/Lib Vlg 8 11 13
Manhattan Bch Mira Costa 21 22 28
Total Active Listings 94 96 157
-
20
40
60
80
100
120
140
160
2014 2015 2016
Active Listings Year-to-Year by Map Area: June
Manhattan Bch Sand
Manhattan Bch Tree
Manhattan Bch Hill
Manhattan Village
Manhattan Bch Heights/Lib Vlg
Manhattan Bch Mira Costa
Total Active Listings
Back to Table of Contents
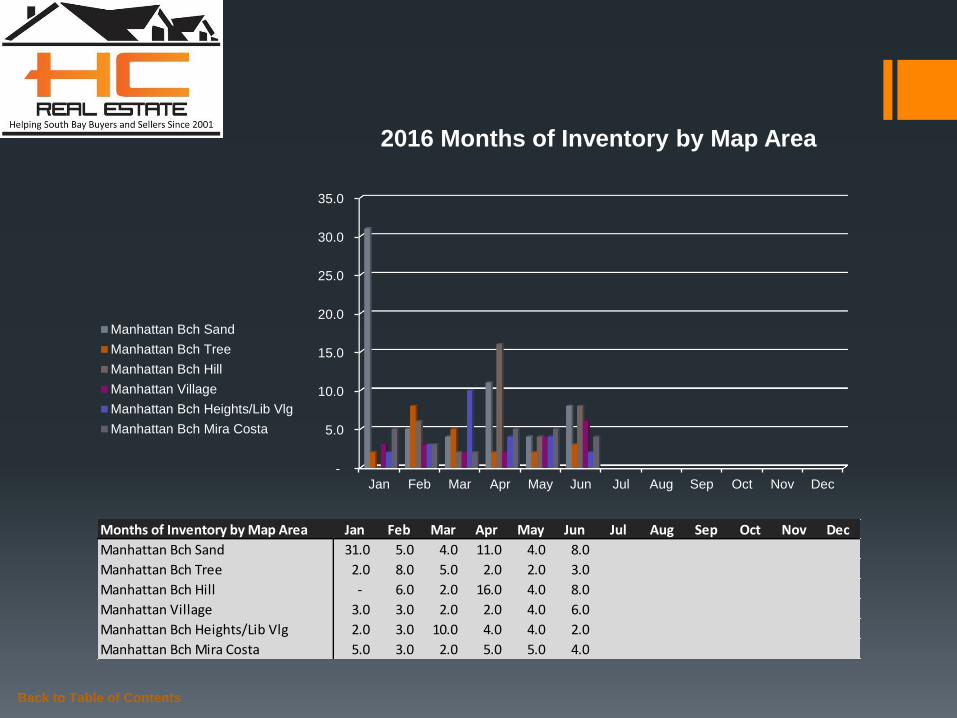
Months of Inventory by Map Area Jan Feb Mar Apr May Jun Jul Aug Sep Oct Nov Dec
Manhattan Bch Sand 31.0 5.0 4.0 11.0 4.0 8.0
Manhattan Bch Tree 2.0 8.0 5.0 2.0 2.0 3.0
Manhattan Bch Hill - 6.0 2.0 16.0 4.0 8.0
Manhattan Village 3.0 3.0 2.0 2.0 4.0 6.0
Manhattan Bch Heights/Lib Vlg 2.0 3.0 10.0 4.0 4.0 2.0
Manhattan Bch Mira Costa 5.0 3.0 2.0 5.0 5.0 4.0
-
5.0
10.0
15.0
20.0
25.0
30.0
35.0
Jan Feb Mar Apr May Jun Jul Aug Sep Oct Nov Dec
2016 Months of Inventory by Map Area
Manhattan Bch Sand
Manhattan Bch Tree
Manhattan Bch Hill
Manhattan Village
Manhattan Bch Heights/Lib Vlg
Manhattan Bch Mira Costa
Back to Table of Contents
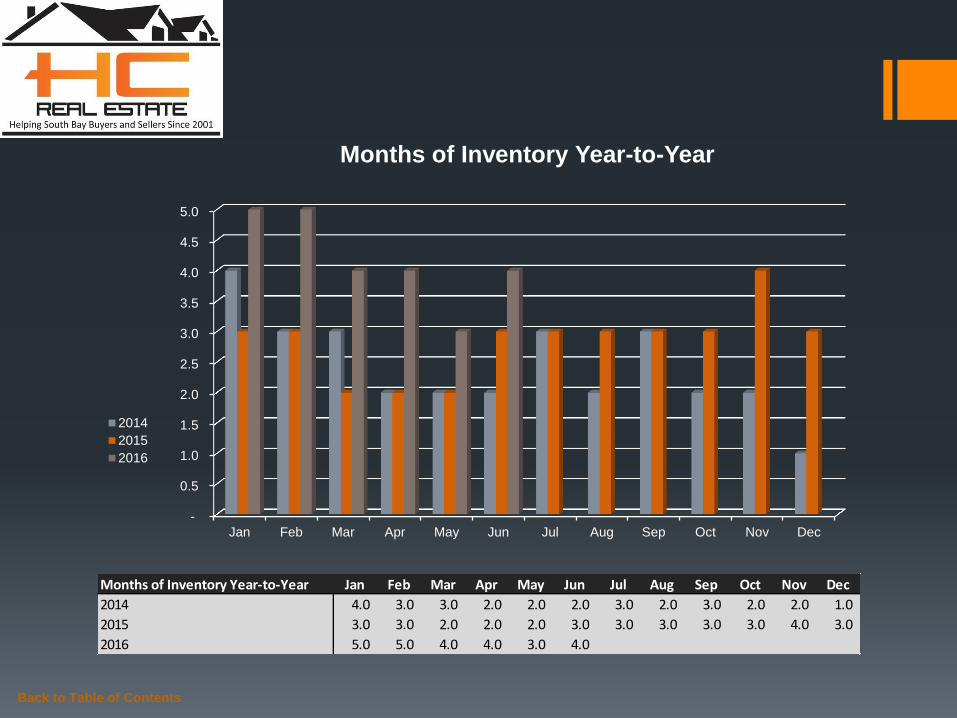
Months of Inventory Year-to-Year Jan Feb Mar Apr May Jun Jul Aug Sep Oct Nov Dec
2014 4.0 3.0 3.0 2.0 2.0 2.0 3.0 2.0 3.0 2.0 2.0 1.0
2015 3.0 3.0 2.0 2.0 2.0 3.0 3.0 3.0 3.0 3.0 4.0 3.0
2016 5.0 5.0 4.0 4.0 3.0 4.0
-
0.5
1.0
1.5
2.0
2.5
3.0
3.5
4.0
4.5
5.0
Jan Feb Mar Apr May Jun Jul Aug Sep Oct Nov Dec
Months of Inventory Year-to-Year
2014
2015
2016
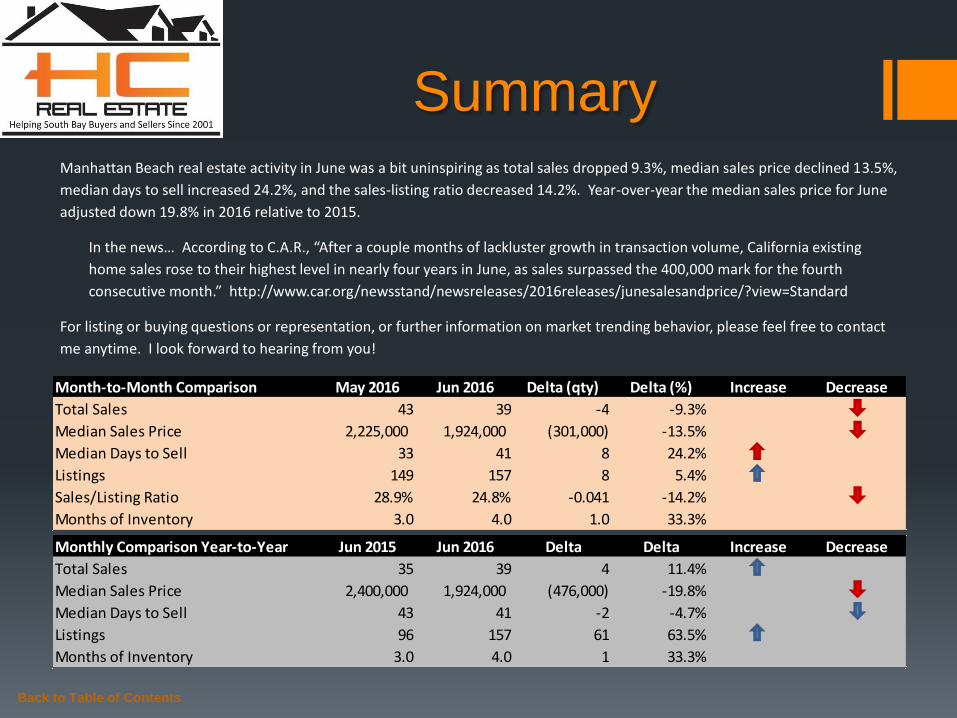
Summary Manhattan Beach real estate activity in June was a bit uninspiring as total sales dropped 9.3%, median sales price declined 13.5%,
median days to sell increased 24.2%, and the sales-listing ratio decreased 14.2%. Year-over-year the median sales price for June
adjusted down 19.8% in 2016 relative to 2015.
In the news… According to C.A.R., “After a couple months of lackluster growth in transaction volume, California existing
home sales rose to their highest level in nearly four years in June, as sales surpassed the 400,000 mark for the fourth
consecutive month.” http://www.car.org/newsstand/newsreleases/2016releases/junesalesandprice/?view=Standard
For listing or buying questions or representation, or further information on market trending behavior, please feel free to contact
me anytime. I look forward to hearing from you!
Back to Table of Contents
Month-to-Month Comparison May 2016 Jun 2016 Delta (qty) Delta (%) Increase Decrease
Total Sales 43 39 -4 -9.3%
Median Sales Price 2,225,000 1,924,000 (301,000) -13.5%
Median Days to Sell 33 41 8 24.2%
Listings 149 157 8 5.4%
Sales/Listing Ratio 28.9% 24.8% -0.041 -14.2%
Months of Inventory 3.0 4.0 1.0 33.3%
Monthly Comparison Year-to-Year Jun 2015 Jun 2016 Delta Delta Increase Decrease
Total Sales 35 39 4 11.4%
Median Sales Price 2,400,000 1,924,000 (476,000) -19.8%
Median Days to Sell 43 41 -2 -4.7%
Listings 96 157 61 63.5%
Months of Inventory 3.0 4.0 1 33.3%

Serving South Bay Home Buyers and Sellers Since 2001
RE/MAX Top 4 Team in California – 2012
RE/MAX 100% Club - 2011
Shorewood Realtors Top 5% in Overall Sales 2001-2006, 2008-2010
Back to Table of Contents
About
Hady Chahine…

The information being provided by CARETS (CLAW, CRISNet MLS, DAMLS, CRMLS, i-Tech MLS, and/or VCRDS) is for the visitor’s personal, non-commercial use and may not be used for
any purpose other than to identify prospective properties visitor may be interested in purchasing. Any information relating to a property referenced on this web site comes from the Internet
Data Exchange (IDX) program of CARETS. This web site may reference real estate listing(s) held by a brokerage firm other than the broker and/or agent who owns this web site. The accuracy
of all information, regardless of source, including but not limited to square footages and lot sizes, is deemed reliable but not guaranteed and should be personally verified through personal
inspection by and/or with the appropriate professionals.
Back to Table of Contents
Listings MLS BLOG Website
Hady Chahine
• 310-404-5361