nox reclaim working group meeting
TRANSCRIPT

NOx RECLAIM Working Group Meeting
March 18, 2014
1 4/4/2014 NOx RECLAIM

Agenda • Welcome & Introductions
• General BARCT Methodology
• Refinery Sector
– Gas Turbines
– Review of FCCUs (January 22, 2014 WGM)
• Non-Refinery Sector
– Gas Turbines
• Discussion
• Schedule/Next Meeting
2 4/4/2014 NOx RECLAIM

Status Category Control Equipment
Manufacturer Contacted Preliminary Cost Effectiveness
Analysis Completed
FCCU X X
Cement Kilns X X
Gas Turbines (Refinery and Non-Refinery)
X X
Coke Calciner X In progress
Glass Furnaces X In progress
Metal Melting Furnaces In progress In progress
SRU/Tail Gas In progress In progress
ICEs X X
Boilers/Heaters X In progress
3 4/4/2014 NOx RECLAIM

Overall BARCT Methodology
• Technical Feasibility
• Cost Effectiveness
–Incremental Cost Effectiveness Based on 2000/2005 BARCT
–Based on 2011 activity
4 4/4/2014 NOx RECLAIM

5
Refinery Sector Preliminary Analysis
Gas Turbines
4/4/2014 NOx RECLAIM

Overview of Emission Control Technologies
• Water or Steam Injection: 50 ppmv - 20 ppmv
• Dry Low NOx (DLN), Dry Low Emissions (DLE),
Cheng Low NOx (CLN): 25 ppmv - 9 ppmv
• Selective Catalytic Reduction: 9 ppmv - 2 ppmv
• Other Types of Control
– CO Oxidation Catalysts for CO Emissions
– Ammonia Slip Catalysts for NH3 Slip, CO, HC Emissions
4/4/2014 6 NOx RECLAIM

Proposed BARCT for Gas Turbines
• 2 ppmv NOx
• SCR with as applicable
– Dry Low NOx (DLN) / Dry Low Emissions (DLE)
– Cheng Low NOx (CLN)
• Implementation Schedule
– 2017 to 2020
– May Consider Synchronization with Refinery’s Turnaround Schedule
4/4/2014 7 NOx RECLAIM
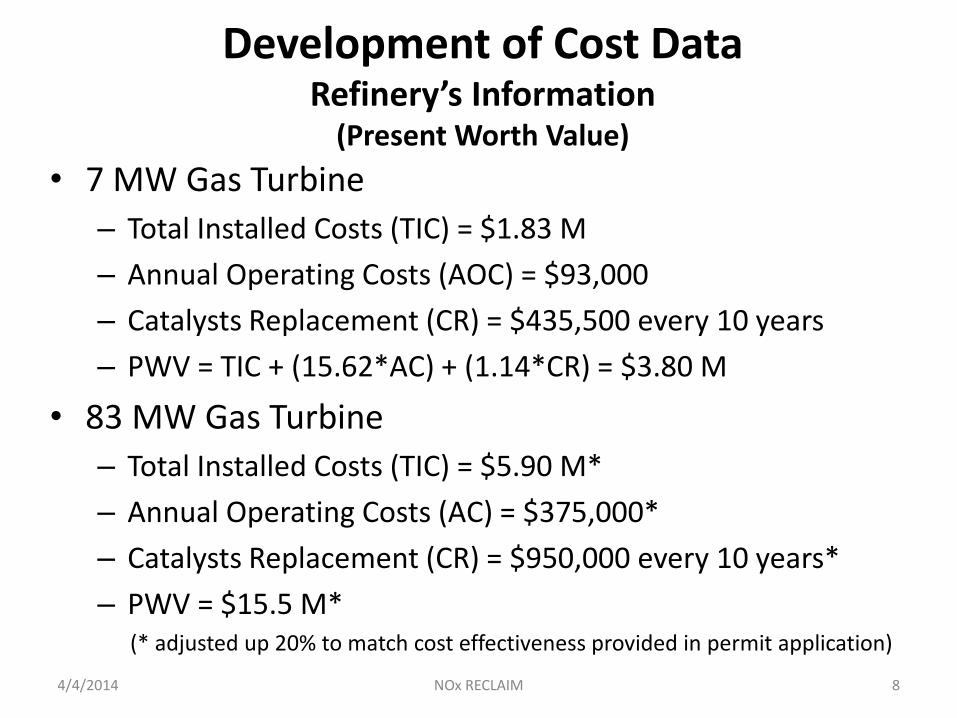
Development of Cost Data Refinery’s Information
(Present Worth Value)
• 7 MW Gas Turbine
– Total Installed Costs (TIC) = $1.83 M
– Annual Operating Costs (AOC) = $93,000
– Catalysts Replacement (CR) = $435,500 every 10 years
– PWV = TIC + (15.62*AC) + (1.14*CR) = $3.80 M
• 83 MW Gas Turbine
– Total Installed Costs (TIC) = $5.90 M*
– Annual Operating Costs (AC) = $375,000*
– Catalysts Replacement (CR) = $950,000 every 10 years*
– PWV = $15.5 M* (* adjusted up 20% to match cost effectiveness provided in permit application)
4/4/2014 8 NOx RECLAIM

• 7 MW and 83 MW Gas Turbines
• SCR and CO Catalysts
• SCR and Ammonia Slip Catalysts
– Dual Function. Equivalent or Better Control Efficiency for NOx, CO, HC Compared to Conventional SCR and CO Catalysts at Less Costs
– Extend SCR Life and Achieve Low Ammonia Slip
4/4/2014 9 NOx RECLAIM
Development of Cost Data Manufacturers’ Information
(Present Worth Value)

• “Alternative Control Techniques Document – NOx Emissions from Stationary Gas Turbines” EPA-453/R-93-007
• Equations to Estimate TIC, AOC, and CR
• 80% - 90% Reduction Equivalent to Reducing to 2 ppmv from 10 ppmv or 20 ppmv
4/4/2014 10 NOx RECLAIM
Development of Cost Data EPA’s Information
(Present Worth Value)

• “Cost Analysis of NOx Control Alternatives for Stationary Gas Turbines”, November 5, 1999
• TIC and AOC for 5 MW, 25 MW, and 150 MW Gas Turbines
• 80% - 90% Reduction Equivalent to Reducing to 2 ppmv from 10 ppmv or 20 ppmv
4/4/2014 11 NOx RECLAIM
Development of Cost Data DOE’s Information (Present Worth Value)

4/4/2014 NOx RECLAIM 12
y = 0.2372x + 1.7376 R² = 0.9461
0
5
10
15
20
25
30
35
40
45
0 20 40 60 80 100 120 140 160
PW
V (
$ m
illio
n)
Turbine Rating (MW)
PWV of SCR for Gas Turbines
Refinery, $16 M
Manufacturer, $19 M
EPA, $22 M
DOE, $41 M
DOE, $11 M
DOE, EPA, Refinery, $4 M
Manufacturer, $2 M

Proposed BARCT Cost Effectiveness @ 2 ppmv Incremental Cost Effectiveness with SCR
4/4/2014 13 NOx RECLAIM
Unit Rating Profile (MW)
2000/2005 BARCT Level (lbs/mmscft)
PWV ($M)
Emission Reduction from
2000/2005 BARCT (tpd)
CE for 2014 BARCT
($/ton)
(a) (b) (c) (e) (f)
59 62.27 15.7 0.210 8,210
46 62.27 12.6 0.310 4,472
30 62.27 8.9 0.200 4,851
23 62.27 7.2 0.140 5,631
83 62.27 4.8 (d) 0.600 870 No Turbines/Duct Burners = 21
No of Cogen Units = 12 Total PWV
= $97.68 M Total Reductions
= 4.14 tpd Average CE
= 2,692 $/ton (g) (a) All gas turbines and all SCRs at the refineries were installed ≥ 25 years ago (b) 2000/2005 BARCT Level from Table 1 of Rule 2002 (c) PWV = (0.2372 x MW) + 1.7376 (d) Costs for additional SCR catalysts to get from 10 ppmv to 2 ppmv (e) Emission Reduction = Emissions @ 2000/2005 BARCT Level – Emissions @ 2 ppmv where Emissions @ 2000-2005 BARCT Level = 2011 Fuel Gas Usage (mmscft/yr) x 62.27 (lb/mmscft) Emissions @ 2 ppmv = 2011 Emissions x (2 ppmv / 2011 NOx Level in ppmv) (f) CE = PWV/Emission reductions from 2000-2005 BARCT = (c)/(e x 365 x 25) (g) CE (DCF Method) = $2692 per ton. CE (LCF Method) = $4500 per ton for 25 years life and 4% interest rate

14
Refinery Sector Review for FCCUs
(Summary from January 22, 2014 WGM)
4/4/2014 NOx RECLAIM

Proposed BARCT for FCCUs (Summary from January 22, 2014 WGM)
• 2 ppmv NOx
• Control Technology
– SCR
– LoTOx
– NOx Reducing Additives in combination
with SCR or LoTOx
• Implementation Schedule
– 2017 to 2020
– May Consider Synchronization with Refinery’s Turnaround Schedule
4/4/2014 15 NOx RECLAIM

Proposed BARCT Cost Effectiveness @ 2 ppmv Incremental Cost Effectiveness with SCR or LoTOx
(Summary from January 22, 2014 WGM)
4/4/2014 16 NOx RECLAIM
Equipment
2005 BARCT Level
Incremental PWV ($M)
Incremental Emission Reduction from 2005 BARCT
Level (tpd)
CE for 2014 BARCT ($/ton)
(a) (b) (c) (d)
FCCUs with SCR 85% reduction 13 0.43 3,444
FCCUs with LoTOx 85% reduction - 14 0.43 - 3,521
(a) 2005 BARCT level from Table 3 of Rule 2002
(b) Incremental difference in costs of control equipment for 85% reduction and control equipment for 2 ppmv
(c) Incremental emission reductions = Emissions @ 2005 BARCT – Emissions @ 2ppmv
(d) CE = (b)/(c*365*25) for DCF method. For LCF, CE = $5,700 -$5,900 per ton

Non-Refinery Sector Preliminary Analysis
Gas Turbines
4/4/2014 17 NOx RECLAIM

Non Refinery Gas Turbines (From 38 Facilities)
0
20
40
60
80
100
120
140
160
180
ppm concentration @15% O2
Proposed emission level: 2 ppm
4/4/2014 18 NOx RECLAIM
P
P
M
2000/2005 BARCT
Level: 17 ppm
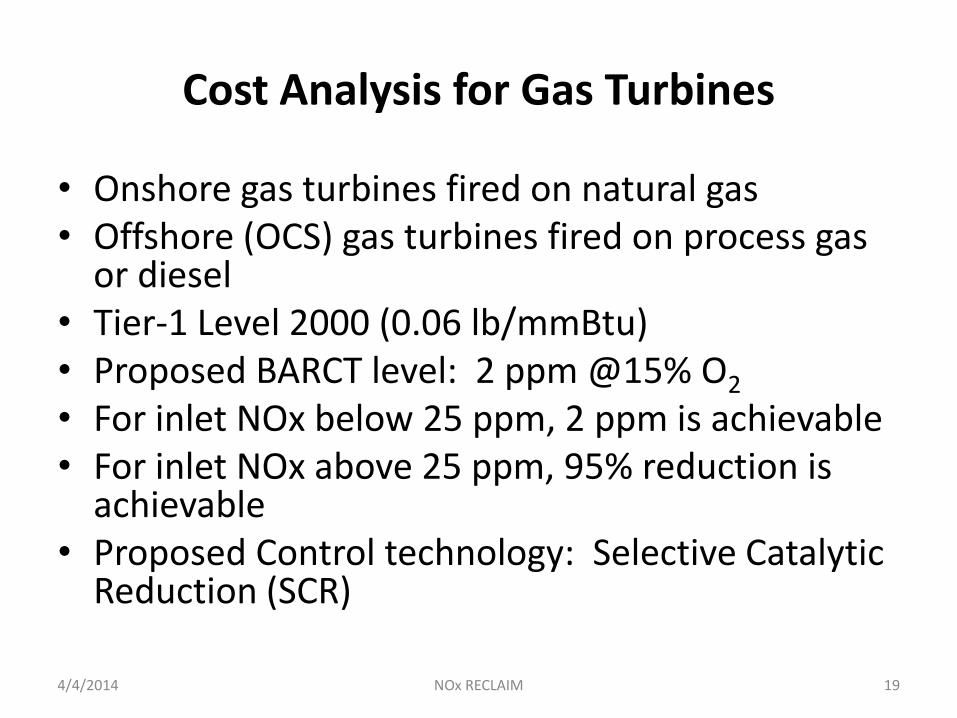
Cost Analysis for Gas Turbines
• Onshore gas turbines fired on natural gas • Offshore (OCS) gas turbines fired on process gas
or diesel • Tier-1 Level 2000 (0.06 lb/mmBtu) • Proposed BARCT level: 2 ppm @15% O2
• For inlet NOx below 25 ppm, 2 ppm is achievable • For inlet NOx above 25 ppm, 95% reduction is
achievable • Proposed Control technology: Selective Catalytic
Reduction (SCR)
4/4/2014 19 NOx RECLAIM

BARCT Emission Level
• Based on inlet concentration range for units emitting at or above 25 ppm (~50-160 ppm)
Inlet NOx @15%O2 BARCT Emission Level
< 25 ppm 2 ppm
At or above 25 ppm 95% Reduction*
* Further evaluation ongoing
• Implementation Schedule
• 2017-2020
4/4/2014 20 NOx RECLAIM

Cost Analysis for Gas Turbines
• SCR vendor equipment costs include: • Ductwork, NH3 injection hardware, catalyst, PLC
system, tempering air/mixing system, and CFD flow modeling
• Installation costs were calculated to be 200% of the equipment costs (400% for OCS)
• Total Installed Cost (TIC) includes equipment plus installation
• Vendor-supplied annual costs (AC) include NH3 usage, catalyst replacement, and power. • Catalyst replacement every 3 years
4/4/2014 21 NOx RECLAIM

Cost Analysis for Gas Turbines
• Present Worth Value (PWV) assumes a 4% interest rate and a 25-year equipment life
• PWV = TIC + (15.622 x AC)
• Emission Reductions (ER) for this category
– 1.71 tons per day
• Cost Effectiveness = PWV / (ER x 365 x 25)
• Cost Effectiveness Range
– DCF range: $3,100 - $26,000 / ton
– LCF range: $5,000 - $42,000 / ton
4/4/2014 22 NOx RECLAIM
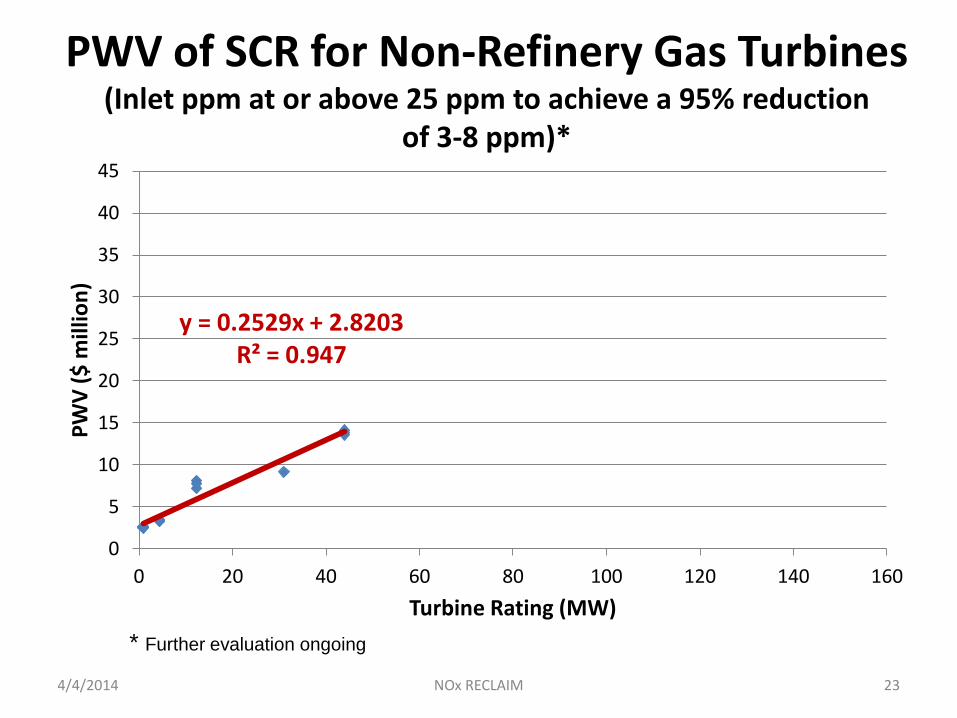
PWV of SCR for Non-Refinery Gas Turbines (Inlet ppm at or above 25 ppm to achieve a 95% reduction
of 3-8 ppm)*
y = 0.2529x + 2.8203 R² = 0.947
0
5
10
15
20
25
30
35
40
45
0 20 40 60 80 100 120 140 160
PW
V (
$ m
illio
n)
Turbine Rating (MW)
* Further evaluation ongoing
4/4/2014 23 NOx RECLAIM
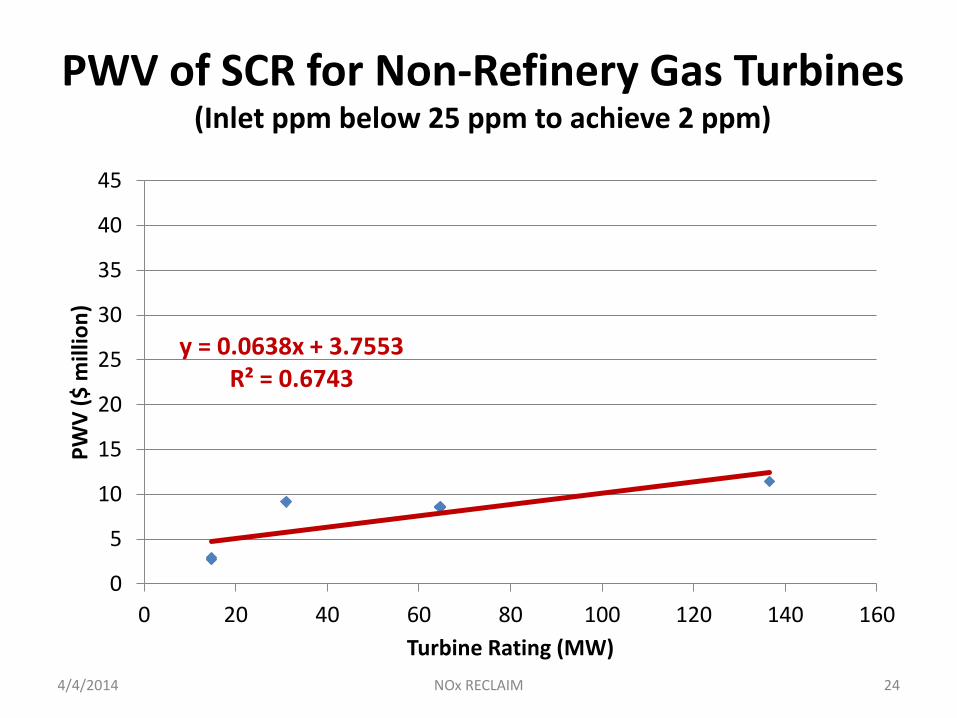
PWV of SCR for Non-Refinery Gas Turbines (Inlet ppm below 25 ppm to achieve 2 ppm)
y = 0.0638x + 3.7553 R² = 0.6743
0
5
10
15
20
25
30
35
40
45
0 20 40 60 80 100 120 140 160
PW
V (
$ m
illio
n)
Turbine Rating (MW)
4/4/2014 24 NOx RECLAIM

Proposed BARCT Cost Effectiveness
Unit Rating Profile Range
(MW)
2000/2005 BARCT Level
PWV Range ($M)
Emission Reductions from
2000/2005 BARCT (tpd)
C.E. Range for 2014 BARCT
($/ton)
1-140 0.06 lb/MMBTU
3-14 1.71 $3,000 - $26,000 Average: ($13,198/ton)
4/4/2014 25 NOx RECLAIM
* Cost Effectiveness LCF range: $5,000 - $42,000 / ton

Next Steps
• Complete BARCT Analysis
• Schedule next meeting April/May 2014
• Ongoing individual meetings to review BARCT
26 4/4/2014 NOx RECLAIM

27 4/4/2014 NOx RECLAIM
Refineries Minh Pham, P.E.
[email protected] (909) 396 - 2613
Non-Refineries Kevin Orellana
[email protected] (909) 396 - 3492
Contact