mycobacterium tuberculosis and comparison with human
TRANSCRIPT

High Quality Genome-Scale Metabolic Network Reconstruction of
Mycobacterium tuberculosis and Comparison with Human
Metabolic Network: Application for Drug Targets Identification
Saowalak Kalapanulak
Doctor of Philosophy
Centre for Intelligent Systems and their Applications
School of Informatics
The University of Edinburgh
2009

Abstract
Mycobacterium tuberculosis (Mtb), a pathogenic bacterium, is the causative agent in
the vast majority of human tuberculosis (TB) cases. Nearly one-third of the world’s
population has been affected by TB and annually two million deaths result from the
disease. Because of the high cost of medication for a long term treatment with
multiple drugs and the increase of multidrug-resistant Mtb strains, faster-acting drugs
and more effective vaccines are urgently demanded. Several metabolic pathways of
Mtb are attractive for identifying novel drug targets against TB. Hence, a high quality
genome-scale metabolic network of Mtb (HQMtb) was reconstructed to investigate
its whole metabolism and explore for new drug targets.
The HQMtb metabolic network was constructed using an unbiased approach by
extracting gene annotation information from various databases and consolidating the
data with information from literature. The HQMtb consists of 686 genes, 607
intracellular reactions, 734 metabolites and 471 E.C. numbers, 27 of which are
incomplete. The HQMtb was compared with two recently published Mtb metabolic
models, GSMN-TB by Beste et al. and iNJ661 model by Jamshidi and Palsson. Due
to the different reconstruction methods used, the three models have different
characteristics. The 68 new genes and 80 new E.C. numbers were found only in the
HQMtb and resulting in approximately 52 new metabolic reactions located in various
metabolic pathways, for example biosynthesis of steroid, fatty acid metabolism, and
TCA cycle. Through a comparison of HQMtb with a previously published human
metabolic network (EHMN) in terms of protein signatures, 42 Mtb metabolic genes
were proposed as new drug targets based on two criteria: (a) their protein functional
sites do not match with any human protein functional sites; (b) they are essential
genes. Interestingly, 13 of them are found in a list of current validated drug targets.
Among all proposed drug targets, Rv0189c, Rv3001c and Rv3607c are of interest to
be tested in the laboratory because they were also proposed as drug target candidates
from two research groups using different methods.
i

Declaration
This thesis has been composed by myself and contains original work of my own
execution. It has not been submitted in any form for any degree at this or other
university.
I would like to acknowledge Dr. Hongwu Ma, my second supervisor. He helped me
to formulate the visualization of metabolic maps by transferring my main metabolites
relationship of each metabolic pathway in the excel format to be the metabolite
graph.
This work is currently transformed to a manuscript for submitting to BMC
Bioinformatics in 2010 with the supplementary data about a complete list of included
reactions in the HQMtb, a complete list of metabolites, and a list of references of
particular reactions in the HQMtb as a text file.
Saowalak Kalapanulak
ii

Acknowledgements
The work reported in this thesis was carried out over three years, during which I have
received invaluable help and advice from many people. My principal thanks go to
Dr. Santi Kulprathipanja, who is a R&D fellow at UOP LLC Company, USA. From
a part of my experience doing MSc thesis at a leading international supplier and
licensor of petroleum and petrochemical technology under his supervision, it
encouraged me to continue studying PhD.
I would like to thank both of my supervisors at the University of Edinburgh, Prof.
Igor Goryanin and Dr. Hongwu Ma. They always give me complete support
throughout my study time not only valuable suggestion about research work, but also
useful advice about living abroad for the foreign people like me. They have listened
to my ideas and helped to shape them. Moreover, they have given me their complete
attention when we had meeting. I received a great experience for working in Systems
Biology filed, especially genome-scale metabolic network reconstruction with them.
Both of them are experts in this area, which is an investigation of the whole cell
metabolic network in the new era of studying biology.
I wish to thank the Royal Thai Government for my main sponsor agency supporting
me the tuition fee and the cost of living here. Moreover, I am grateful to Prof. Igor
Goryanin for supporting me partial stipend.
I should like to thank the staff of Computational Systems Biology research group at
the University of Edinburgh, especially Richard Adams. All of them are friendly and
always give me some help related to my work when I asked for.
Last but not least, I would like to thank my beloved parents, Paitoon Kalapanulak
and Aree Kalapanulak and friend, Treenut Saithong. They always encourage me to
complete my degree and give me confidence to overcome all problems during my
study.
iii

Table of Contents
Abstract i
Declaration ii
Acknowledgements iii
Table of Contents iv
List of Figures vii
List of Tables ix
1 Introduction 1
1.1 Motivation……………………………………………………………………. 1
1.1.1 Introduction to tuberculosis (TB)………………………………….........1
1.1.2 The availability of useful biological information providing
an opportunity to investigate the whole Mycobacterium tuberculosis
metabolism and apply for drug targets identification………………….. 6
1.2 Thesis Objectives …………………………………………………................. 9
1.3 Thesis Outline………………………………………………………………... 10
2 Background and Reviews 12
2.1 Systems Biology Research of M. tuberculosis................................................. 12
2.1.1 An overview of systems biology…………………………………..........12
2.1.2 Systems biology applied to Mycobacterium tuberculosis……………... 18
2.2 Databases Containing Biological Information on Mycobacterium
tuberculosis…………………………………………………………………... 21
2.2.1 Genome annotation databases of Mtb…………………………….......... 21
2.2.2 Protein signature database.……...……………………….……………... 25
2.3 TB Drug Target Identification …………………………................................. 26
iv

2.4 Conclusions………………………………………………............................... 29
3 High Quality Genome-Scale Metabolic Network Reconstruction of Mtb 31
3.1 Introduction………………………………………………............................... 31
3.2 Methodology…………………………………………………………………. 32
3.3 Reconstruction from Genome Databases.......................................................... 33
3.3.1 Retrieving Mtb genes possessing enzyme commission (E.C.) numbers
from five databases……………………………………………….......... 34
3.3.2 Updating E.C. numbers with IUBMB…………………………………. 36
3.3.3 Gene-E.C. pairs from all databases…………………….………………. 37
3.3.4 Linking gene-E.C. pairs to reactions via KEGG Ligand database…….. 38
3.4 Literature-Based Process…………………………………………………...... 39
3.5 Adding IDs to Compounds and Reactions…………………………………… 45
3.6 Characterizing the HQMtb in term of Numbers of Genes, Reactions,
Metabolites and E.C. Numbers………………………………………………. 47
3.7 Pathway Organization and Visualization Maps……………………………… 50
3.7.1 The first draft of pathway organization………………………………... 50
3.7.2 The final version of pathway organization and visualization maps…..... 56
3.8 Graph Analysis for the Reconstructed Network……………………………... 60
3.9 Discussion and conclusion…………………………………………………… 64
4 Comparison of the HQMtb with the Published Genome-Scale Metabolic
Models of Mtb 66
4.1 Introduction to the Three Models…………..................................................... 67
4.1.1 The GSMN-TB model…………………………………………………. 67
4.1.2 iNJ661 model…………………………………………………………... 69
4.1.3 HQMtb model………………………………………………………….. 70
4.2 Models Comparison………………………………………………………….. 70
4.2.1 Model characteristics comparison……………………………………… 71
4.2.2 Gene comparison………………………………………………………. 73
4.2.3 E.C. number comparison………………………………………………..86
4.3 Discussion and conclusion…………………………………………………… 87
v
5 Comparison of the Mycobacterium tuberculosis and Human Metabolic
Networks in terms of Protein Signatures: An Application for Drug Targets
Identification 89
5.1 Edinburgh Human Metabolic Network (EHMN)………................................. 91
5.2 Protein Databases……………………………………………………..……… 93
5.2.1 UniProt database……………………………………………………….. 93
5.2.2 InterPro database……………………………………………………….. 94
5.3 Genes Required for Mycobacterial Growth Defined by High Density
Mutagenesis………………………………………………………………….. 96
5.4 Methodology…………………………………………………………………. 98
5.5 Results………………………………………………………………………... 99
5.5.1 Linking Mtb and human genes to their protein signatures in term of
InterPro accession numbers……………………………………………. 99
5.5.2 Comparing protein signatures between Mtb and human via InterPro
accession numbers……………………………………………………..102
5.5.3 Mapping the list of preliminary drug targets to essential genes from
TraSH experiment……………………………………………………...102
5.5.4 Checking the protein complex and protein similarity to all human proteins
of all 42 proposed drug targets…………………………………………104
5.6 Discussion and conclusion..………………………………………………….107
6 General Conclusions and Future Work 114
Bibliography 117
Appendix A: A complete list of included reactions in the HQMtb 123
Appendix B: A complete list of metabolites 160
Appendix C: A list of references of particular reactions in the HQMtb 184
vi

List of Figures
1.1 Estimated numbers of new TB cases by country in 2007 [8]………………... 4
2.1 A framework for systems biology [23]……………………………………… 13
3.1 Methodology for high quality metabolic network reconstruction divided into
two main processes; genome database-based process and literature-based
process………………………………………………………………………...33
3.2 Gene function comparison by creating gene-E.C. pairs……………………... 37
3.3 Classification of 1366 genes, which have enzymatic reactions via the
relationship between E.C. numbers and enzymatic reactions from KEGG
Ligand database, by numbers of associated reactions……………………….. 40
3.4 Classification of 1464 genes in genome database-based metabolic network
before validating with literature and specific genome databases of Mtb…….. 41
3.5 The Workflow for manually validating all metabolic functions of 1464 Mtb
genes……......................................................................................................... 42
3.6 The workflow for identifying compound IDs to all compounds in the validated
metabolic reactions of the HQMtb and addressing new reaction IDs……….. 47
3.7 Numbers of reactions and genes in the HQMtb arranged by enzyme
categories…………………………………………………………………….. 49
3.8 The workflow for separating metabolic reactions in the HQMtb into pathway:
the first draft of pathway organization……………………………………….. 51
3.9 The workflow for organizing metabolic reactions in the HQMtb into pathway:
the final version of pathway organization……………………………………. 56
3.10 The visualization map of Nitrogen metabolism, showing the relationship
among main metabolites in the pathway……………………………………... 60
3.11 The visualization map of TCA cycle, showing the relationship among main
metabolites in the pathway………………………………..…………………..60
3.12 Metabolite graph of the whole HQMtb……………………………………... 62
4.1 The workflow for model characteristics comparison, consisting of three main
steps………………………………………………………………………….. 72
4.2 The flowchart for doing gene comparison among three Mtb models………... 74
vii

4.3 The Venn diagram presenting the gene comparison results among three Mtb
models regarding genes catalyzing intracellular reactions…………………... 74
4.4 The Venn diagram presenting the E.C. numbers comparison results between 54
E.C. numbers from 61 new genes in the HQMtb model and all E.C. numbers
from both of the previous Mtb models……………………………………….. 85
4.5 The Venn diagram showing the E.C. number comparison results among three
Mtb models regarding E.C. numbers of intracellular reactions……………… 86
5.1 Processes for reconstruction of the high-quality human metabolic network
(EHMN) [31]………………………………………………………………… 92
5.2 The protocol for identifying genes required for optimal growth [22]……….. 97
5.3 The methodology for drug targets identification…………………………….. 98
5.4 The example of UniProt-InterPro accession numbers relationship of human
retrieved from the web services of EBI……………………………………...101
viii

List of Tables
1.1 Functional classification of Mycobacterium tuberculosis genes [15]………... 7
2.1 The number of species from major taxonomic groups included in the PEDANT
genome database as of September 2008 [37]………………………… ……... 22
3.1 The numbers of genes and E.C. numbers retrieved from five databases…….. 34
3.2 Classification of gene-E.C. pairs by number of databases providing same
annotation…………………………………………………………………….. 38
3.3 The 761 excluded genes in the HQMtb and deleting reasons………………... 44
3.4 The 703 included genes in the HQMtb and sources of information…………. 44
3.5 Characteristics of the HQMtb………………………………………………... 48
3.6 Numbers of compounds in each pathway of all 61 pathways following the 61-
pathway organization of 341 reactions with KEGG reaction IDs…………… 53
3.7 Numbers of reactions and compounds per pathway in the first draft of pathway
organization…………………………………………………………………...55
3.8 Numbers of reactions per pathway in the final version of pathway
organization…………………………………………………………………...57
3.9 List of current metabolites* and cofactors*………………………………….. 59
3.10 The connection degree distribution of metabolite graph of the HQMtb........ 63
3.11 The top eight highest degree metabolites in the HQMtb............................... 63
4.1 Statistics of the GSMN-TB model…………………………………………… 68
4.2 Metabolic pathways in the GSMN-TB model that were reconstructed by
directly extracting information from original publication …………………... 68
4.3 Network properties of the iNJ661 model…………………………………….. 69
4.4 Characteristics of the intracellular reactions from three Mtb models………... 73
4.5 The list of 86 new genes should be included in the next version of the HQMtb
from either GSMN-TB or iNJ661models……………………………………. 81
4.6 Classification of 52 new reactions from the HQMtb into pathways…………. 85
5.1 Characteristics of the EHMN………………………………………………… 91
5.2 The coverage of major sequence databases, UniProtKB, UniParc and UniMES
by InterPro signatures [21]……………………………………………………96
ix

x
5.3 Characteristics of combined Gene-UniProt-InterPro accession number results
of HQMtb and EHMN models……………………………………………….102
5.4 List of 42 proposed drug targets and their functional pathways……………..103
5.5 List of 42 proposed drug targets with forming protein complex or having
isoenzyme results…………………………………………………………….105
5.6 List of 42 proposed drug targets with human protein similarity……………..107
5.7 The validated drug targets in Mycobacterium tuberculosis from Mdluli and
Spigelman in 2006 [47]………………………………………………………109
5.8 List of 42 drug targets stating as current validated drug targets or proposed
targets from iNJ661 model with human protein similarity and information
about forming protein complex or having isoenzyme……………………….112

CHAPTER 1
Introduction
1.1 Motivation 1.1.1 Introduction to tuberculosis (TB)
TB and its history
Tuberculosis (TB), an infectious disease, mainly affects the lungs, but it can also
affect other parts of the body such as the brain, bones, and glands. It has long been
known in the history of humanity. Investigators found Potts disease, a rare
tuberculous manifestation affecting the spine, in Egyptian and South American
mummies dating from 3000-5000 years BC [1]. In the 18-19th centuries, pulmonary
tuberculosis, the disease known as the White Plague, was the major cause of death in
western Europe because of overcrowded living conditions, poor sanitation and
malnutrition [2]. Moreover, European people traveling throughout the world during
this period brought TB with them and caused the spread of this disease. In the late
19th and early 20th centuries as living conditions improved in Western Europe,
tuberculosis declined. In contrast, the incidence of TB in many developing countries
increased as overcrowded living and poor sanitation continued to be the common
way of life for people in these countries [3]. A method to control the spread of this
disease occurred following the discovery of its causative agent. Dr. Robert Koch
identified an acid-fast bacterium, Mycobacterium tuberculosis, as the pathogen of TB
in 1882 [4]. Thirty-nine years later, Bacillus of Calmette and Guerin (BCG) vaccine
was introduced for human use and became more widely used following World War I.
Moreover, the modern era of TB treatment and control emerged from the discovery
of streptomycin in 1944 and isoniazid in 1952 [5].
1

The causative agent of TB
Mycobacterium tuberculosis (Mtb), causing the vast majority of TB in humans, is a
pathogenic bacterium in the genus of Mycobacterium, comprising of more than 70
species. Mycobacteria are gram-positive, rod-shaped bacteria of the Actinomycete
family; therefore, they are most closely related to the nocardia, corynebacteria, and
streptomyces [6]. Their unique feature is the complex cell envelope, containing a
high percentage of lipids, which include the large-branched mycolic acids. This
envelope makes the bacteria resistant to breakage and relatively impermeable to any
antibiotics. This unique feature has been used to identify the organism because it is
responsible for the acid-fast staining property. The genome sequences of
mycobacteria contain a high guanine plus cytosine (GC) content, ranging from 58-
69% [6, 7].
Other species of Mycobacterium also can cause human diseases. For example,
Mycobacterim leprae causes leprosy, a disease still afflicting large numbers of
people. Mycobacterium avium becomes more important species nowadays, since it
has been reported to be highly involved in HIV-infection.
Mycobacteria can be classified naturally and taxonomically into two main groups:
slow- and fast-growers. The slow-growers contain most of the major human and
animal pathogens, whereas the fast-growers contain non-pathogenic species, such as
Mycobacterium smegmatis, widely-used as a convenient model organism.
Owing to the characteristic features of mycobacteria, the basic molecular techniques
required to study their biological complexity are limited by the following problems
[6]. The first problem is their slow growth rate. The slow growers can take up to six
weeks to generate colonies on a plate and even the fast growers may take up to two
weeks. This can lead to contamination of cultures, especially with fungi. The second
problem is clumping when grown in liquid media and even grown with shaking.
Thanks to the nature of cell wall, mycobacterial cells tend to stick together. This
leads to problems since many standard techniques require dispersed cultures, e.g.
2

optical-density measurement or ideally single cells for plating, screening for mutants
and infection of tissue culture cells. Other problems include resistance to lysis and
spontaneous antibiotic resistance. However, these issues are eclipsed by the safety
aspects of doing experimental work. Any procedure that involves the generation of
aerosols is potentially dangerous and should be minimized. Thus, nonpathogenic
species are more widely used as model organisms.
Infection of TB
Mtb is transmitted from a tuberculosis patient to an uninfected person by inhaling
aerosolized bacilli. Once infected, both the innate and adaptive immune responses in
the body are activated. Normally, tuberculosis, the clinical disease of which the host
immune system is unable to contain the infection, occurs in a minority of patients (5-
10%) within the first two years after infection. Some people might clear the
infection. However, the majority of people (around 90%) develop latent infection, a
state in which the bacilli are contained and the host immune response is able to
control the infection. Therefore, people who get latent infection will not spread this
disease. Nevertheless, latently infected people can develop reactivation, the clinical
state in which the host is no longer able to contain the infection, at a rate of 10% per
lifetime [8]. Fortunately, the treatment with isoniazid, an antibiotic used to treat
mycobacterial infections, can decrease this risk. Moreover, the infection with HIV
increases the risk of reactivation to 10% per year [3, 9].
The virulence of TB
TB is one of the most common infectious diseases known to man and remains a
global health problem. Around 32% of the world’s population or 1.86 billion people
are affected with TB [10]. TB kills someone every 20 seconds, about 4400 people
every day or approximately 1.6 million people every year, estimated from the World
Health Organization (WHO) in 2005. Moreover, TB is second only to HIV as the
leading infectious disease killing adults worldwide. The World Health Organization
released its 13th report on tuberculosis control in March, 2009, which provided
3

information and statistics related to the numbers of TB cases in 196 countries [8].
There were approximately 9.27 million new cases of TB occurred in 2007 (Figure
1.1), compared with 9.24 million new cases in 2006.
Figure 1.1: Estimated numbers of new TB cases by country in 2007 [8]
Current TB treatment and control
In response to the global TB epidemic, the WHO has developed an effective control
strategy, called Directly Observed Treatment, Short-Course or DOTS. The essential
elements of DOTS are as follows: a) strong government commitment to TB control;
b) diagnosis by smear microscopy; c) standardized short-course chemotherapy with
directly observed treatment for at least the first two months; d) secure supply of safe
and high-quality drugs; e) individual reporting of treatment outcome and monitoring
of program performance. Although DOTS is highly effective, it is cumbersome,
particularly the requirement of multiple anti-TB drugs for at least six months during
treatment duration. The four drugs, a combination of isoniazid, rifampicin,
pyrazinamide and ethambutol, are given to the patients during the initial 2-month
“intensive phase” and then isoniazid and rifampicin are continued during the 4-
month “continuation phase” [10, 11].
4

As well as drug prescription, the BCG vaccine, which is the only available TB
vaccine, is also widely used for prevention in some countries. Even though BCG
vaccination does prevent the development of severe and fatal forms of TB in young
children, it has not been effective in reducing the greater numbers of infectious
pulmonary cases in adults [10]. In the U.S. the vaccine is not administered for several
reasons; however, the most important reason is that it may alter the body’s response
to the tuberculosis bacillus in such a way that it is contributing to the resistance of all
current anti-TB drugs [11].
Problems and overriding requirements for fighting TB
Despite the availability of antimicrobial agents, there is an increase in the number of
TB cases that are caused by organisms that are resistant to the two most important
drugs, isoniazid and rifampicin. A survey in 72 countries concluded that the
multidrug-resistant (MDR) TB problem is more widespread than previously thought
[10]. The MDR TB disease occurs with TB patients when they lapse from the DOTS
regimen because of the relatively long course of treatment. Even worse, the
emergence of extensively drug resistant TB (XDR-TB), defined as TB caused by
isolates resistant to any fluoroquinolone and at least one of three injectable second-
line drugs (capreomycin, kanamycin and amikacin), has been stated [8]. Besides
MDR-TB and XDR-TB, the long term of treatment and less effective vaccine play an
important role for urgent demand of new diagnostic, treatment and prevention tools,
including new TB drugs and vaccine. Therefore, any new highly effective drugs
should offer at least one of three improvements over the existing solutions: a) shorten
the total duration of effective treatment and reduce the total number of doses needed
to be taken; b) improve the treatment of MDR- and XDR-TB; c) provide a more
effective treatment of latent TB infection.
Barriers and challenges in TB drug development
The Global Alliance for TB Drug Development, a not-for-profit venture, was
established by a number of interested parties with initial support from the
5
Rockefeller Foundation. The aim of Global Alliance is to accelerate the discovery
and development of new effective drugs to fight TB. This organization reported
several gaps in the TB drug development pipeline beginning from basic research to
the technology transfer stage. For basic research such as target identification and
target validation, the targets and compounds identified through recent basic research
are not being fully exploited [10]. Moreover, a significant number of drugs fail
during clinical development due to the misidentification of drug targets at the early
preclinical stages of the drug discovery process [12]. Therefore, this is a big
challenge for scientists to innovate a more accurate approach to identify highly
effective drug targets against any initial failures in the drug development pipeline.
1.1.2 The availability of useful biological information providing an opportunity to investigate the whole Mycobacterium tuberculosis metabolism and apply for drug targets identification
Genomic data of Mycobacterium tuberculosis
The complete genome sequence of the laboratory stain M. tuberculosis H37Rv was
deciphered by Cole et al. in 1998 [13]. It motivated scientists to apply post-genomic
research technologies to study this virulent pathogen. There are 4,411,529 base pairs
in the Mtb genome and around 4000 genes have been identified, including 3924
protein-coding genes and 50 stable RNA-coding genes. Although 40% of protein-
coding genes were functionally annotated, based on sequence similarity analysis and
other analysis methods, 60% of them have been reported as unknown functions [14].
This situation was improved in 2002 by Camus et al., who re-annotated Mtb’s
genome [15]. They discovered 82 new genes and assigned functions to 2,058
proteins, 52% of all predicted proteins. This updated data can be accessed from the
TubercuList website [16]. The functional classification of Mtb genes between the
annotation in 1998 and the updated version by Camus et al. in 2002 is summarized in
Table 1.1.
6

Table 1.1: Functional classification of Mycobacterium tuberculosis genes [15]
Due to the high power of information technology, researchers around the world can
access and retrieve the genome annotation information without any difficulty via
internet. Genome annotation databases, e.g. Kyoto Encyclopedia of Genes and
Genomes (KEGG) [17], Pedant [18], BioCyc [19], Universal Protein Resource
(UniProt) databases [20] collect the gene functions of all annotated genes in any
living organisms such as biochemical reactions of enzymatic genes, transport
reactions of transporter genes. In addition to multi-species genome annotation
databases, specific genome annotation databases focusing on individual organism are
available such as TubercuList [16] for Mycobacterium tuberculosis, EcoCyc for
Escherichia coli. Generally, gene functions are annotated by sequence similarity
analysis; however, in some databases the authors further validate the gene functions
with experimental evidence, for example MtbRvCyc, one of the 160 genome-specific
databases within the BioCyc collection. The Mtb sequence determination and its
available genome annotation databases establish a fully-facilitated phase of Mtb
research, allowing extensive investigation into biology and physiology of the
pathogen. We can combine each metabolic reaction to build a genome-scale
metabolic network of Mtb. The reconstructed network provides an opportunity for
scientists to investigate the whole metabolism rather than study only a single gene or
one metabolic pathway per time.
7

Data revealing protein signatures of Mycobacterium tuberculosis
Not only is information about Mtb gene functions in term of catalyzing biochemical
reactions available, but the protein signatures of Mtb proteins have also been
investigated. Several databases produce predictive protein signatures in the feature of
protein domains, families and functional sites based on various methods. Moreover,
one of several criteria for identifying drug targets is that they should not have
homologues in the human host in order to avoid any side effects. The protein
signatures comparison between human host and Mtb will assist experimentalists to
screen for possible drug targets along the genome before doing experimental work.
InterPro database is an integrative protein signature database consisting of
information from 10 databases: Gene3D, PANTHER, Pfam, PIRSF, PRINTS,
ProDom, PROSITE, SMART, SUPERFAMILY and TIGRFAMs, each of which
individually produces predictive protein signatures, i.e. protein domains, families and
functional sites from their own methodologies [21]. Protein signatures in the 10
databases describing the same family or domain in term of sequence position and
protein coverage are integrated into single InterPro entries and then the InterPro
accession numbers are represented as a stable format for identifying InterPro entries.
Grouping equivalent signatures from different sources together in this way has
observable benefits, giving signatures consistent names and annotations. Therefore,
systematic analysis can be processed even at the large genome-scale level. To date,
the InterPro curators continue to integrate new signatures from member databases
into entries. The latest public release version 18.0 in 2009 covers 79.8% of
UniProtKB version 14.1 and comprises 16549 entries. Moreover, the InterPro data is
freely accessed either via web address (www.ebi.ac.uk/interpro/) or the InterProScan
search software (www.ebi.ac.uk/Tools/InterProScan/).
Genome-scale mutagenesis of Mycobacterium tuberculosis
In addition to computational analysis after publishing the complete genome sequence
of Mtb, for example sequence similarity analysis and prediction of protein signatures
8

according to sequence position, an experimental work investigating the whole
genome of Mtb that revealed the genes required by Mtb for optimal growth were
published by Sassetti and his colleagues in 2003 [22]. The authors used transposon
site hybridization (TraSH) to comprehensively identify the essential genes. Their
methodology was divided into two main processes: (a) construction of transposon
mutant libraries; (b) TraSH experiment for identifying genes required in vitro. TraSH
is a useful technique for analyzing large pools of mutants by using a DNA micro
array to detect genes that contain insertions and then inferring essential and non-
essential genes. They reported 614 genes as essential genes and 2,567 genes as non-
essential genes for optimal growth of Mtb on their defined media. This is an
important high-throughput experiment revealing the essential functions in the
mycobacterial cell. Moreover, it is very valuable information for assisting to improve
the identification of highly effective antimycobacterial targets.
1.2 Thesis Objectives
New highly-effective drugs are urgently demanded for alleviating three current
problems of TB: (1) an increase of multi-drug resistant strain of Mtb, (2) the long
duration of treatment with multiple drugs, and (3) latent TB infection. During the
drug development process, drug target identification is an initial and important step
to identify highly effective drugs. Moreover, several metabolic pathways of Mtb are
attractive for drug target identification. Therefore, the goal of this work is
reconstruction of a high quality genome-scale metabolic network that includes as
many metabolic processes as are known in Mtb. Additionally, this network will
subsequently be used for drug target identification via a novel method, namely
genome-scale protein signature comparison between Mtb and human.
Thanks to the availability of Mtb data (section 1.1.2), the whole metabolism of Mtb
can be investigated through the reconstruction of a high quality genome-scale
metabolic network of Mtb, unwinding its biological complexity. Furthermore, I will
apply the reconstructed network for drug target identification via a novel method,
namely comparing all protein signatures of Mtb proteins with human proteins
9

through InterPro accession numbers. The Mtb genes satisfing the following two
criteria will be proposed as drug targets: (a) their protein signatures do not match any
human protein signatures; (b) they are essential genes from the TraSH experiments.
1.3 Thesis Outline
This thesis is organized into 6 chapters. Chapter 1 has described the motivation for
doing this research work, biological resources that increase feasibility of the project,
and also the outcome of the thesis. In chapter 2, the background and literature
reviews are presented. The first part of this chapter is review of the systems biology
approach and its applications for reconstruction of genome-scale models of any
species, e.g. Saccharomyces cerevisiae and Escherichia coli. The next section
describes the available genome annotation databases (the sources of information for
reconstructing the whole genome metabolic network of Mtb) and protein databases
(the sources of information for doing protein signatures comparison between Mtb and
human). Moreover, the current validated drug targets of Mtb are reviewed.
Chapter 3-5 are the main body of this thesis. The high quality genome-scale
metabolic network reconstruction of Mtb, including the methodology, results and
discussion, is described in chapter 3. There are two main processes for Mtb metabolic
network reconstruction: a genome-database based process and a literature-based
process. Not only was the network reconstructed, but all compounds and reactions in
the reconstructed network were also identified with compound IDs and reaction IDs,
respectively for further systematic analysis. The reconstructed network is
characterized in term of numbers of genes, reactions, metabolites and enzyme
commission numbers (E.C. numbers). Moreover, the reconstructed network is
reorganized into biological pathways, each of which has individual visualization
maps demonstrating main metabolite relationships.
While I was reconstructing the high quality genome-scale metabolic network of Mtb,
the other two research groups published genome-scale metabolic networks of Mtb:
GSMN-TB model by Beste et al. and iNJ661 model by Jamshidi and Palsson in
10

11
2007. Therefore, I compare the HQMtb reconstructed network with the other two
Mtb networks in term of gene and E.C. number in chapter 4. I also discuss the
differences between the three networks in section 4.2 because each Mtb network is
reconstructed individually from different sources of information and methodologies.
I applied the high quality genome-scale metabolic network (HQMtb) for drug targets
identification by using the new proposed method as described in more detail in
chapter 5. All protein signatures of Mtb are compared with all human protein
signatures through InterPro accession numbers from InterPro database. The Mtb
genes whose protein signatures did not match any human protein signatures were
preliminary-proposed drug targets. Next, the final proposed drug targets are
suggested after combining the preliminary results with the list of essential genes
from TraSH experiment. The resulting list of 42 proposed drug targets with their
functional pathway and the possibility to form the protein complex or to have
isoenzyme is reported. Moreover, the protein sequence similarity between all
proposed drug targets and human proteins is investigated. In order to state the
confidence of the proposed methodology for identifying drug targets, I map the
results with the list of current validated drug targets, reported by Mdluli and
Spigelman, and the proposed drug targets by Jamshidi and Palsson. Furthermore, I
also highlight the top three drug targets for biologists to validate with the wet
experimental work.
In the last chapter, I discuss the contribution of this research work, clarify what I
have done and propose more improvements to the next version of the genome-scale
metabolic network of Mtb including further analytical approaches to explore Mtb
metabolism.

CHAPTER 2
Background and Reviews
2.1 Systems Biology Research of M. tuberculosis 2.1.1 An overview of systems biology
Definition of systems biology
Traditionally, biologists have studied how parts of the cell work, e.g. studying the
biochemistry of small and large molecules, and studying the structure of protein,
DNA and RNA. Fortunately, the highly-powerful computer and high-throughput
technologies push scientists toward a new view of biology - what we call the systems
approach.
Systems biology is a new approach for investigating biological systems by
systematically perturbing them (biologically, genetically or chemically); monitoring
the gene, protein, and informational pathway responses; integrating these data; and
ultimately, formulating mathematical models describing the structure of the system
and its response to individual perturbations [23].
Definitions of systems biology have been widely described throughout literature in
diverse aspects. Ideker et al. proposed a fundamental framework of systems biology
shown in Figure 2.1 [23]. Kitano said that “To understand biology at the system
level, we must examine the structure and dynamics of cellular and organism
function, rather than the characteristics of isolated parts of a cell or organism” [24].
In another view, MIT Computational & Systems Biology Initiative gave the
definition in term of the 4Ms, i.e. measurement, mining, modeling and manipulation
[25]. The National Institute of General Medical Sciences at National Institutes of
Health (NIH) of the US provided a slightly different perspective that “Systems
biology seeks to predict the quantitative behavior of an in vivo biological process
12

under realistic perturbation, where the quantitative treatment derives its power from
explicit inclusion of the process components, their interactions, and realistic values
for their concentrations, locations, and local states” [26].
Figure 2.1: A framework for systems biology [23]. It consists of four steps. First, prior biochemical and genetic knowledge are used to form an initial model. Second, specific perturbation such as gene deletion is employed in order to monitor the response of cells. Once observed, data are integrated to the current model of the system. Third, the current model is refined so that its prediction most closely agrees with experimental observations. Finally, new perturbation is designed and step 2-4 is repeated until the model predictions reflect biological reality.
The availability of complete genome sequences of thousands of organisms including
Mycobacterium tuberculosis, and the high-throughput experimental technologies for
system-level measurement make it possible to integrate vast amounts of data in order
to explore biological knowledge at the system level. These data is integrated to create
the networks such as gene regulatory network, protein-protein interaction network
and biochemical reaction network, and then mathematical models are formulated in
order to describe the network behaviors and predict the effect of perturbations. A
large number of recent and ongoing efforts are putting this systems biology
framework into practice. Several research groups have built the cell replica or in
silico cell for certain organisms in order to understand their biological features.
13

An example of systems biology: reconstruction of genome-scale metabolic networks
In order to gain insight into the metabolic capability of the cell through mathematical
modeling, a natural first step is to reconstruct the underlying metabolic network, as it
is responsible for the metabolic capacity of the cell, and it allows detailed analysis of
the interactions between the individual pathways in the cell [27]. There are several
successful genome-scale metabolic models of any species, i.e. Saccharomyces
cerevisiae, Escherichia coli K-12, Staphylococcus aureus N315, Methanosarcina
barkeri, and human Homo sapiens.
The metabolic models or metabolic networks mentioned in this thesis have the same
terminology as qualitative metabolic models. The model definition is a network
showing a relationship among biochemical reactions catalyzed by enzymatic genes in
the metabolic level of a cell.
The Saccharomyces cerevisiae model
Forster and his colleagues reconstructed the metabolic network of the yeast
Saccharomyces cerevisiae by integrating the available genomic, biochemical, and
physiological information in 2003 [27]. Yeast is used as a model organism for
studying eukaryotic cell function because of its vast available amount of biological
data. Yeast is the first eukaryotic genome that was fully sequenced, annotated and
made publicly available. Besides genomic data, the large-scale experimental data
about protein-protein interactions by using two-hybrid systems was included.
Moreover, detailed metabolic pathways in yeast are remarkably similar to those in
fly, worm and humans; therefore, it is feasible to use this simple model organism to
understand more complex biological systems, including multi-cellular organisms
such as human beings [23].
The reconstructed yeast network consists of 1175 metabolic reactions, 1035 of them
encoded from 708 open reading frames (ORFs) and the other 140 reactions included
14

on the basis of biochemical evidence, and 584 metabolites. All metabolic reactions
were compartmentalized between cytosol and the mitochondria, and transport steps
between the compartments and the environment were included. Interestingly, the
total number of genes included in the network corresponds to ~16% of all
characterized ORFs in the yeast genome. This is the first comprehensive genome-
scale in silico metabolic network for a eukaryotic organism, and it may be used as
the basis for in silico analysis of phenotypic functions.
The Escherichia coli K-12 model
In addition to yeast that is a model for eukaryotic organisms, Escherichia coli (E.
coli) has been studied as the model for prokaryotic organisms. It is perhaps the best
characterized bacterium and is of interest industrially, genetically and pathologically.
Reed and coworkers in Palsson research group reconstructed the genome-scale
metabolic model of E. coli (iJR904 GSM/GPR), which was expanded from the
previous comprehensive E. coli model, iJE660a GSM [28]. The model included 904
genes and 931 unique biochemical reactions, all of which were both elementally and
charge balanced. Furthermore, network gap analysis was investigated and led to
putative assignments for 55 ORFs. The authors also included gene to protein to
reaction association (GPR) into the model. They concluded that E. coli iJR904 has
improved capabilities over iJE660a. The reconstructed network is a more complete
and chemically accurate description of E. coli metabolism than iJE660a. Moreover, it
would help to outline the genotype-phenotype relationship for E. coli K-12, as it can
account for genomic, transcriptomic, proteomic and fluxomic data simultaneously.
Staphylococcus aureus N315 model
Like Mycobacterium tuberculosis, Staphylococcus aureus (S. aureus) is a pathogenic
gram-positive bacterium. It causes a variety of disease conditions, and currently
various strains of this organism have evolved resistance to some of the most
clinically useful antibiotics, including methicillin and vancomycin.
15

In order to explore knowledge regarding the basic and systemic biochemical function
of S. aureus, especially under carefully controlled environmental conditions in
chemically-define media, its in silico metabolic network was reconstructed by
Becker and Palsson in 2005 [29]. The authors presented the first manually curated
elementally and charge balanced genome-scale reconstruction of S. aureus’
metabolic network. The reconstructed model consists of 619 genes, 537 proteins, 640
reactions, and 571 metabolites. After the capabilities of the reconstructed network
were analyzed in the context of maximal growth, the hypotheses regarding growth
requirements, the efficiency of growth on the different carbon sources, and potential
drug targets were formed. These can be further tested experimentally and the results
will advance our understanding of a troublesome pathogen.
The Methanosarcina barkeri model
Besides the genome-scale metabolic network reconstruction of eukaryotic and
prokaryotic cells, the genome-scale metabolic network of an archaeal species,
Methanosarcina barkeri, was created by Feist et al. in 2006 [30]. The
Methanosarcina barkeri (M. barkeri) can degrade low carbon molecules in anaerobic
environments to generate methane. Because of this, M. barkeri can be used for the
processing of industrial, agricultural and toxic wastes rich in organic matter. This
organism plays an important role as a potential source of renewable energy giving
environmental benefit.
The model contains 692 metabolic genes, 619 reactions and 558 unique metabolites.
110 of the total reactions were included without any associated genes because they
had been reported in prior literature or they were required to fill gaps in the
reconstructed network. The authors combined the model with constraint-based
method and then simulated the metabolic fluxes under different environmental and
genetic conditions. This represents the first large-scale simulation of an archaeal
species. The output of this work demonstrated that a reconstructed metabolic
network can serve as an analysis platform to predict cellular phenotypes, characterize
16

methanogenic growth, improve the genome annotation and further reveal the
metabolic characteristics of methanogenesis.
Human Homo sapiens model
Not only have the whole metabolic networks of single-cellular organisms like yeast,
and bacteria been investigated, multi-cellular organisms like human beings have been
also studied because many human diseases are result in an abnormal metabolic state.
Human metabolic diseases are primarily caused by single gene alleles coding for
enzymes important in metabolic pathways. When enzymes are missing or defective,
their chemical substrates build up and are excreted out of the body, often by the
kidneys and so into the urine. The example of these diseases is alkaptonuria or
phenylketonuria referring to the excess waste chemical found in urine. In other cases,
the abnormal quantity of an intermediate in metabolism is not excreted out of the
body, but stays there, such as high glucose concentration in blood of diabetes
patients. In order to get a better and in-depth understanding of human metabolism, a
complete and high-quality human metabolic network is necessary.
In 2007, Duarte et al. manually reconstructed the global human metabolic network,
Homo sapiens Recon 1 [31]. It is a comprehensive literature-based genome-scale
metabolic network, accounting for the functions of 1,496 ORFs, 2,004 proteins,
2,766 metabolites, and 3,311 metabolic and transport reactions. They used bottom-up
approach for reconstruction by collecting biochemical reactions from Build 35 of the
genome annotation and a comprehensive evaluation of >50 years of legacy data (i.e.,
bibliomic data). Recon 1 facilitates the computational interrogation of the overall
properties of human metabolic network and provides framework for analysis of “-
omics” data set.
In the same year, Ma and colleagues reconstructed a high-quality human metabolic
network (EHMN) by integrating genome annotation information from different
databases and metabolic reaction information from literature [32]. The network
comprises more than 2000 metabolic genes and nearly 3000 metabolic reactions,
17

reorganized into 70 human-specific metabolic pathways based on their functional
relationships. The authors analyzed structure of the network by investigating
functional connectivity of all metabolites and found that the bow-tie structure is
performed. They also compared their reconstructed network (EHMN) with Recon 1
and found that EHMN contained more number of genes than Recon 1. Genes in
EHMN were collected from different databases, whereas genes in Recon 1 were
mainly from EntrezGene. Moreover, at enzyme level comparison in Recon 1 only
less than half of the genes were assigned E.C. numbers. In contrast to Recon 1, all
genes in EHMN had clear or unclear E.C. numbers.
2.1.2 Systems biology applied to Mycobacterium tuberculosis
In silico cell of Mycobacterium tuberculosis
Several groups of researchers have integrated omics data of Mtb with physical
principles and a mathematical framework to create a metabolic network and then
used mathematical models in order to get a better understanding of Mtb’ s
metabolism and facilitate drug and vaccine development.
Flux balance analysis of mycolic acid pathway in Mtb
Some unique and important metabolic pathways of Mtb, e.g. the mycolic acid
pathway (MAP) are attractive to gain insights into fundamental molecular
mechanism. Mycolic acid is the major constituent of the unique mycobacterial cell
wall which comprises arabinogalactan-mycolate covalently linked with
peptidoglycan and trehalose dimycolate, and protects the tubercle bacillus from
general antibiotics and from the host’s immune system. The synthesis of mycolic
acids has been shown to be critical for the survival of Mtb; therefore, the MAP has
been of great interest as indicated by the large amount of biochemical and genetic
studies in the literature. Moreover, InhA gene (E.C.: 1.3.1.9, enoyl-[acyl-carrier-
protein] reductase), a target of the front-line anti-tubercular drugs such as isoniazid
and ethionamide, is involved in mycolic acid synthesis.
18

Raman and coworkers applied a systems-based approach, Flux Balance Analysis
(FBA), to investigate the mycolic acid pathway of Mtb H37Rv for the identification
of anti-tubercular drug targets in 2005 [33]. The MAP model consists of four sub-
pathways: a) production of malonyl CoA, b) fatty acid synthase-I (FAS-I) pathway,
c) fatty acid synthase-II (FAS-II) pathway and d) condensation of FAS-I and FAS-II
products into alpha-, methoxy-, and keto-mycolic acids. The model containing 197
metabolites and 219 reactions, catalyzed by 28 proteins was built by collecting
biochemical reactions from available metabolic reaction databases, i.e. KEGG,
BioCyc and TubercuList databases and literature. After MAP reconstruction, FBA
was performed on the MAP model, providing insights into the metabolic capabilities
of the pathway. In silico systematic gene deletions and inhibition of InhA by
isoniazid were studied and presented clues about the 16 protein essential for the
pathway. Such these essential genes can be good targets for drug design, especially
when they do not have homologues in the human proteome. The essential predicted
genes followed by sequence analysis have resulted in seven proposed potential
targets for anti-tubercular drug development: Rv0904c, Rv2524c, Rv0533c,
Rv3800c, Rv0824c, Rv1094 and Rv3229c.
GSMN-TB: a genome scale network model of Mtb metabolism
Not only was a specific metabolic pathway reconstructed, but the whole genome
metabolic network of Mtb was also created. Two genome-scale metabolic networks
of Mtb have been recently reconstructed independently: GSMN-TB by Beste et al.
[34] and iNJ661 by Jamshidi and Palsson [35].
The GSMN-TB model consisting of 849 unique reactions, 739 metabolites and 726
genes was initially constructed by using the genome-scale model of Streptomyces
coelicolor as the template and filling additional Mtb specific reactions from KEGG
and BioCyc databases. The significant proportion of the model was also manually
generated from related publications describing experimental work. The GSMN-TB
model that employed flux balance analysis to calculate substrate consumption rates
was shown to correspond closely to experimentally-determined values. Furthermore,
19

the predictions of essential genes were also performed by FBA simulation. The
predicted results were compared with global mutagenesis data for in vitro-grown Mtb
and showed 78% accuracy.
In silico strain iNJ661: a genome scale network model of Mtb H37Rv
metabolism
The other genome-scale model of Mtb, iNJ661 containing 939 reactions, 828
metabolites and 661 genes, was built using a bottom-up reconstruction method. The
sequence based genome annotation of Mtb from The Institute for Genomic Research
(TIGR) was used as a framework of the model. The updated information has been
added in the model from TubercuList, KEGG and the SEED databases. Furthermore,
the gaps in the model have been filled by searching the literature. Their model was
applied to identify the drug targets by calculating the Hard Coupled Reaction (HCR)
sets, groups of reactions that are forced to operate in unison owing to mass
conservation and connectivity constraints, and considering in the context of known
drug targets. This study resulted in 35 alternative drug targets that relate to those
identified previously.
In silico comparative analysis of metabolic pathways between the host Homo sapiens and the pathogen Mtb
In addition to systems approach, applied to explore as yet unrevealed knowledge
about Mtb metabolism via constructing Mtb replica or in silico cell of Mtb, genome-
scale protein sequence similarity between Mtb and human has been investigated
systematically.
Anishetty et al. performed an in-silico comparative analysis of metabolic pathways
between the host Homo Sapians and Mtb in 2005 [36]. All enzymes from the
biochemical pathways of Mtb from the KEGG metabolic pathway database were
compared with the proteins from the host H. Sapians by performing a BLASTp
search. They found six pathways unique to Mtb: peptidoglycan biosynthesis,
20
mycobactin biosynthesis, C5-branched dibasic acid metabolism, D-alanine
metabolism, thiamine metabolism and polyketide sugar unit biosynthesis. Moreover,
the 185 proposed drug targets were presented in the context of Mtb enzymes which
do not show the similarity to host proteins and are vital for bacterial survival. Among
the total proposed drug targets, 67 of them were newly identified apart from the
potential drug targets mentioned by TB Structural Genomics Consortium.
2.2 Databases Containing Biological Information on Mycobacterium tuberculosis
2.2.1 Genome annotation databases of Mtb Kyoto Encyclopedia of Gene and Genomes (KEGG) database
After sequencing the genomes of hundreds and thousands organisms, new
experimental and informatics technologies in functional genomics are urgently
demanded for the systematic identification of gene functions. KEGG is an effort to
computerize the current knowledge of biochemical pathways, i.e. most of the known
metabolic pathways and some of known regulatory pathways, which can be used as
reference for systematic interpretation of sequence data [17]. For the other purposes,
KEGG attempts to standardize the functional annotation of genes and proteins, and
maintain gene catalogs for all complete genomes and some partial genomes, and is
continuously re-annotated. Moreover, KEGG maintains the LIGAND database that is
a catalog of chemical compound for metabolites in living cells.
The current statistics for information held in KEGG release 50.0+, April 2009 are
93980 pathways generated from 326 reference pathways in KEGG Pathway,
4379531 genes from 95 eukaryotes, 816 bacteria and 58 archaea in KEGG Genes,
and 15448 compounds, 10969 glycans and 7902 reactions in KEGG Ligand. Besides
the data collection efforts, KEGG develops and provides various computational
tools, such as for reconstructing biochemical pathways from the complete genome
sequence and for predicting gene regulatory network from the gene expression
21

profiles. Furthermore, the KEGG database is updated everyday and freely accessible
from the following URL, http://www.genome.ad.jp/kegg/.
The PEDANT genome database
The PEDANT genome database contains an annotation of nearly 3000 publicly
available eukaryotic, eubacterial, archaeal and viral genomes with more than 4.5
million proteins computed by a broad set of bioinformatics algorithms. This genome
database is produced by applying an automatic annotation pipeline to genome data
released in the public domain. The exact number of species contained in the
PEDANT genome database as of September 2008 is shown in Table 2.1. The current
version of software driving the PEDANT web site is PEDANT3. As with KEGG
database, the PEDANT is freely accessible to academic users at http://pedant.gsf.de.
Table 2.1: The number of species from major taxonomic groups included in the PEDANT genome database as of September 2008 [37]. NCBI Taxonomy ID Taxonomic group Number of genomes 131567 Cellular organisms 861 2157 Archaea 53 2 Bacteria 691 2759 Eukaryote 117 4751 Fungi 57 33208 Metazoa 42 33090 Viridiplantae 6 Other 12 10239 Viruses 2081 Total 2942 Other groups: Alveolata (2), Amoebozoa (1), Cryptophyta (1), Euglenozoa (5), Rhodophyta (1), Stramenopiles (2).
The BioCyc database
The BioCyc database is the collection of pathway/genome databases (PGDBs) for
most eukaryotic and prokaryotic species whose genome have been completely
sequenced to date [19]. It provides electronic reference sources on the pathways and
22
genomes of different organisms. The current version of BioCyc, 13.0 March, 2009,
contains 409 genome-specific databases.
All individual databases within the BioCyc collection are organized into three tiers
based on the amount of manual review and updating they have received. Two
databases: EcoCyc (Escherichia coli K-12) and MetaCyc (a reference source on
metabolic pathways from more than 1500 organisms), are in tier 1. These two
databases have been created through intensive manual efforts and undergone
continuous updating. For example, the EcoCyc has received at least one year of
literature-based curation by scientists. The tier 2 databases are generated by the
PathoLogic program that is used for computational prediction of metabolic pathways.
The resulting PGDBs are manually reviewed to remove the false-positive pathway
predictions. However, most Tier 2 PGDBs have undergone less than one year of
literature-based curation. There are 21 PGDBs in tier 2 such as Homo sapiens,
Mycobacterium tuberculosis H37Rv, Saccharomyces cerevisiae. The 386 PGDBs in
tier 3 are generated by PathoLogic program without manual curation.
Besides providing the PGDBs, the BioCyc also provides the tools for global and
comparative analysis of genomes and metabolic networks. Moreover, the Omics
viewer available through the BioCyc website allows users to visualize gene
expression, proteomics and metabolomics data on the metabolic maps of these
organisms.
TubercuList
The TubercuList is a specific database on Mycobacterium tuberculosis H37Rv
genetics [16]. It gives a complete dataset of DNA and protein sequences linked to the
relevant annotations and functional assignments. The TubercuList Web server’s aim
is to collate and integrate various aspects of the genomes of the tubercle bacilli,
especially Mycobacterium tuberculosis. The data contained in the TubercuList
originates mainly from the Mycobacterium tuberculosis H37Rv genome sequencing
project, and is supplemented with observations made at the Institut Pasteur’s Unit of
23
Bacterial Molecular Genetics. The users can browse the data and retrieve
information, using various criteria such as gene names, location as keywords.
Moreover, it is possible to perform Blast and fasta pattern searches on the web
(http://genolist.pasteur.fr/TubercuList).
The recent data release, R11 (October 1, 2008), represents the whole Mycobacterium
chromosome, 4411532 base pairs of DNA sequences. There are 4009 protein-coding
genes, 7 pseudogenes, 45 tRNA-coding genes, 3 rRNA-coding genes and 2 stable
RNA-coding genes. All Mtb gene functions are available and freely accessible
through http://genolist.pasteur.fr/TubercuList/.
The Universal Protein Resource (UniProt)
The mission of UniProt is to offer the scientific community with a comprehensive,
high-quality and freely accessible resource of protein sequence and functional
information [20]. It is the central resource for storing and interconnecting
information from large and diverse sources, and the most complete catalogue of
protein sequences and functional annotations. There are four major components, each
of which is optimized for different uses: the UniProt Archive (UniParc), the UniProt
Knowledgebase (UniProtKB), the UniProt Reference Clusters (UniRef), and the
UniProt Metagenomic and Environmental Sequence Database (UniMES).
UniProtKB consists of two sections, UniProtKB/SwissProt and
UniProtKB/TrEMBL. UniProtKB/SwissProt is manually annotated and reviewed
whereas UniProtKB/TrEMBL is computationally annotated. At the current version of
UniProtKB (release 15.0, 2009) the total number of species represented in the
UniProtKB/SwissProt is 11669 including Mycobacterium tuberculosis. There are
193405 species in UniProtKB/TrEMBL.
24

2.2.2 Protein signature database
After nucleic acid sequences from genome sequencing projects are submitted as raw
data, biologists try to elucidate the function of the predicted gene products by using
sequence similarity searches. Additionally, an alternative approach by using protein
signatures to classify proteins into families and domains is applied for gene function
annotation. The major protein signature databases are PROSITE, PRINTS and
ProDom. Fortunately, an integrated resource for protein signatures, InterPro database
which provides a classification of UniProtKB sequences, was founded ten years ago.
The InterPro database unifies the major protein signature databases into a single,
comprehensive resource that is a usable tool for scientists world wide to analyze
proteins individually, or as a large-scale system [21].
The InterPro database integrates predictive models or signatures representing protein
domains, families and functional sites from ten different source databases: Gene3D,
PANTHER, Pfam, PIRSF, PRINTS, ProDom, PROSITE, SMART, SUPERFAMILY
and TIGRFAMs. Each member database proposes the protein signatures belonging to
each analyzed protein using their own methodologies, but all of them are
complementary. The InterPro curators will group equivalent signatures from
different sources together and present as a single InterPro entry. For integrating
signatures together, their curators use a set of rules based on the sequence and protein
set overlap as a guidance (signatures should cover the same sequence within 50%
and match the same proteins within 75%), but ultimately, integration and the
formation of parent-child relationships is a curated, manual process in order to ensure
biological meaningfulness. There is no algorithm for automatic integration, as this is
a manual process that needs a biological curator to verify integration and all the
relationships that link entries together.
Grouping comparable protein signatures has obvious benefits by providing the
signatures with consistent names and annotation. It will be useful for scientists to do
the systematic analysis of all proteins in the context of protein signatures in any
genomes. To date, the InterPro curators continue to integrate new signatures from
25

member databases into entries. The latest public release (V18.0) covers 79.8% of
UniProtKB (V14.1) and contains 16549 entries.
The protein signature data in the InterPro database is not only applied for predicting
the gene functions, but also can be applied for potential drug target identification.
The comprehensive and consistent information of protein signatures in InterPro
database provides an opportunity to do the whole protein signatures analysis and
comparison. A comparison between protein signatures of pathogen and the host
organism may shed light on pathogenic genes as drug targets against the pathogen-
caused diseases. It may assist researchers to identify the potential drug targets whose
protein signatures are different from the host organism.
2.3 TB Drug Target Identification
The TB drug development pipeline consists of five main stages [10]. Firstly, basic
research is begun to identify targets and compounds. Secondly, “discovery stage” the
main activity in this stage is to pursue assay development: screening to optimize new
compounds with TB activity (lead compounds). The further stages are preclinical
studies, clinical trials and finally, technology transfer of successful TB drugs in the
market is performed.
The past record of drug discovery suggests that 30%-40% of experimental drugs fail
because an inappropriate biological target was chosen in the early stages of the drug
discovery process [12]. The key issue is therefore how to identify those genes, gene
products, and biological pathways as drug targets that are involved in the
susceptibility (the ability to get infected) of human diseases, and how to select
appropriate intervention points amenable to pharmaceutical development. This key
point has been considered in TB drug discovery process as well.
Traditionally, TB drug targets have been identified by using genetic tools for
manipulating Mycobacterium tuberculosis [38]. Many interesting genes, often
without homolog in human, have been isolated and their products expressed and
26
purified. Mtb strains in which particular genes have been disrupted by gene
mutations or insertions are being investigated to identify essential genes or to
determine the consequences of the loss of function on the disease process. If they are
vital for survival of Mtb, they have been proposed as potential drug targets.
Many experimentalists have proposed the targets for the development of anti-
tuberculosis agents, most of which are essential for pathogen viability but without
homolog in humans in order to avoid side effects. These targets are Mtb genes in the
following pathways, i.e. histidine biosynthesis, menaquinone biosynthesis,
tryptophan biosynthesis, arginine biosynthesis and shikimate pathway [39-46].
However, these proposed drug targets result from conventional molecular techniques
such as gene knockout or other mutation methods which are cost and labor intensive.
Mdluli and Spigelman gathered several novel targets for TB drug discovery proposed
from various experimentalists and assessed the level to which they have been
validated in order to demonstrate their potential role in improving chemotherapy
against TB in 2006 [47]. The researchers applied the genomic information and
biological knowledge of Mtb to identify the potential targets for anti-tuberculosis
drugs based on their essential functions in the organism and lack of homologues in
the mammalian system. All reported gene products, which have been proposed as
drug targets, function in several biological processes including cell wall biosynthesis,
amino acid biosynthesis, cofactor biosynthesis, mycothiol biosynthesis, terpenoid
biosynthesis, DNA synthesis, the glyoxylate shunt, regulatory system, menaquinone
biosynthesis, stringent response and ATP synthesis.
Not only did the authors report a number of novel targets, but they also described a
state at which such a drug target has been validated, for example demonstration of
the biochemical activity of the enzymes, demonstration of their crystal structure in
complex with an inhibitor or a substrate, confirmation of essentiality and the
identification of potent growth inhibitors either in vitro or in an infection model. As
more targets are validated, a pattern will hopefully emerge that correlates the
27
inhibited pathway with the shortening of therapy and make new drugs more
effective.
Besides the review by Mdluli and Spigelman about the current novel drug targets
from experimentalists, the TB structural genomics consortium (TBSGC) identifies
400 potential drug targets and aims to determine their protein structures for structure-
based drug design in TB drug development. All potential drug targets were proposed
from four main sources. Firstly, several computational methods, which can predict
the biological roles of proteins by analyzing functional relationships among proteins
rather than sequence similarities such as phylogenetic profile, domain fusion, and
gene clustering methods, were used to identify the potential targets. From these
methods, potential drug targets were proposed as protein functionally linked to
known targets of anti-TB drug and to proteins known to be essential for bacterial
survival. Secondly, the extra cellular proteins that are involved in virulence and
persistence determinants are chosen because the Mtb cell envelope is impermeable to
many antibacterial agents. Mtb secretes many proteins and some of them have been
characterized as antigens. Thirdly, the potential therapeutic targets also include
proteins involved in iron acquisition, which is a critical process for Mtb survival such
as iron-regulatory proteins, enzymes involved in the production of secreted proteins.
Finally, the group of unique proteins that is found only in a pathogen but not in a
host is considered. For instance, FabH protein encoded by Rv0533c, which is a
member of mycobacteria genome and it is not found in human genome, is subjected
to be identified as a potential drug target. After obtaining preliminary drug targets
from four sources, the TBSGC imposed several additional criteria to reduce the
difficulty of structural determination. For example, the proteins must contain no
predicted transmembrane helices and be smaller than 50000 Daltons. Moreover, all
hypothetical proteins must have homologs in three different organisms and not have
essential mammalian homologs.
The TBSGC, comprising of laboratories from 31 universities and institutes in 13
countries, was established in the fall of 2000 with the aim of encouraging,
coordinating, and facilitating the determination of structures of proteins from
28

Mycobacterium tuberculosis [48, 49]. Structural genomics, a large-scale
determination and analysis of protein structures, has been applied to TB drug
development because one very promising application of structural genomics is to
provide a framework for drug discovery on a genomic scale.
The three-dimensional structures of 400 TB proteins have continuously been
determined via standard techniques such as high-throughput cloning and expression
testing, and crystallization; and currently about 200 of which are completed. As
demonstrated in protein data bank, 209 over 604 TB protein structures reported are
submitted from members of the consortium.
2.4 Conclusions
Thanks to the success of applying the systems biology approach to reconstruct cell
replicas to reveal the secret of life and available information about gene annotations
and protein characterization of Mtb mentioned above, I can apply the systems
biology framework to reconstruct the high quality genome-scale metabolic network
of Mtb by integrating information from various genome annotation databases. Gene
functions from different databases will be combined (without choosing only one data
source as the framework) in order to obtain all possible gene functions in various
databases. Moreover, information in the literature will be explored to assure the gene
functions preliminary acquired from genome annotation databases, resulting in more
accurate reconstructed network (a high quality reconstruction through literature
validation).
Because drug target identification is an important step in the early stage on the TB
drug development process for receiving high effective anti-TB drugs mentioned
above, I propose a novel method for identifying the potential drug targets. It is a
genome comparison approach which is less time consuming in comparison with
traditional molecular approaches. It may be useful for experimentalists to apply this
method for screening a huge numbers of interesting drug targets before doing the
wet-lab experiments. Protein signature comparison between Mtb and human will be
29

investigated and the Mtb genes of which the protein signatures are different from
human will be proposed as preliminary drug targets. The preliminary results will be
combined with the list of essential genes from TraSH experiment and proposed as
drug targets.
Moreover, in order to validate the confidence of the new proposed method I will
compare the predicted drug targets with the current validated drug targets reported by
Mdluli and Spigelman. The contribution of this work is to apply the novel drug
targets identification method to other pathogenic organisms (e.g., Staphylococcus
aureus, Streptomyces coelicolor) for combating other pathogen-caused diseases.
30

CHAPTER 3
High Quality Genome-Scale Metabolic Network Reconstruction of Mtb
3.1 Introduction
In order to investigate the whole metabolism of Mtb and not to omit any attractive
pathways for drug targets identification, the genome-scale metabolic network of Mtb
was reconstructed through systems biology approach. Genome annotation
information of Mtb in various databases such as KEGG, TubercuList, Pedant,
BioCyc and UniProt was combined to construct the Mtb metabolic network. This is a
way to investigate Mtb’s metabolism in the genome level rather than study only one
pathway or one gene each time.
Because genome-scale metabolic network reconstruction has a big impact on
investigating Mtb’s metabolism as a whole, it has to be consolidated with literature to
make sure of its high quality. Even though currently there are automated tools for
generating a genome-scale metabolic network from genome annotation databases
[50], the inconsistency of the gene function information in different databases is a
problem in automatic reconstruction. Consequently, a lot of manual work is still
required in order to overcome the problem and achieve a high quality metabolic
network of a specific organism.
In addition to the information from genome annotation databases, the biochemical
reactions of Mtb genes from the publications have also been included. During the
reconstruction process, we have to deal with many decisions. Does a protein function
as metabolic enzyme? Is the catalyzed reaction reversible or irreversible and its
direction? Which cofactors can be used in the reaction? What is the specific substrate
31

of one generic reaction? As a result, it is a time consuming process to obtain a
satisfactory biochemical reaction list specific to one organism.
After the reconstruction of the genome-scale metabolic networks, mathematical
methods can be applied to analyze the networks, for example, structural analysis can
be used to investigate the connectivity of the reconstructed network and simulation
method can be used to predict cellular behaviors under different physiological
conditions [32, 34, 35]. The results may be useful in many aspects such as finding a
perfect condition for culturing Mtb in medical research or proposing new effective
drug targets for drug development against Mtb.
In this chapter, I demonstrate how I reconstructed a high quality genome-scale
metabolic network of Mtb. Firstly; I show the overall reconstruction workflow in
section 3.2. It consists of two main processes; genome database-based process and
literature-based process. The detail in each step of the high quality network
reconstruction process in terms of methods and results will be given later. After
combining metabolic reactions of Mtb genes from various databases and validating
them with literature, I also assigned compound IDs and reaction IDs to all reactions
in the reconstructed network as described in more detail in section 3.5. The
characteristics of the reconstructed network are demonstrated in section 3.6. Besides
collecting validated metabolic reactions, pathway organization of all enzymatic
reactions is also important. I reorganized all reactions into metabolic pathways as
will be explained in section 3.7. Moreover, the visualization map of each organized
pathway is also displayed in this section. Graph analysis of the HQMtb was
performed in section 3.8. Finally, discussion and conclusion is presented in section
3.9.
3.2 Methodology
In this work, I reconstructed a high quality genome-scale metabolic network of Mtb
by combining genome annotation information of Mtb from five databases: KEGG,
TubercuList, Pedant, BioCyc and UniProt. The reconstruction process was divided
32

into two main processes: genome database-based process and literature-based
process, as shown in Figure 3.1.
Genome annotation databases:KEGG, TubercuList, Pedant, BioCyc and UniProt
List of genes with EC numbers
List of genes with updated EC numbers
List of gene-EC pairs with number of references
List of genes with updated EC numbers and all possible reactions
Updating EC numbers from IUBMB
Comparing gene function from five databases bycreating gene-EC pairs from all possible EC numbers in five databases
Adding reactions from KEGG Ligand database via EC numbers
Extracting Mtb genes having EC numbers
Classifying genes by number of associated reactions
Manual validating the existing reactions of each gene with literatureand specific genome annotation databases of Mtb
High quality genome-scale metabolic network of Mtb (HQMtb)
Genome database-based process
Literature-based process
Figure 3.1: Methodology for high quality metabolic network reconstruction divided into two main processes; genome database-based process and literature-based process.
3.3 Reconstruction from Genome Databases
In the genome database-based process, Mtb genes and their enzymatic functions in
term of enzyme commission (E.C.) numbers were firstly extracted from five genome
annotation databases; KEGG, TubercuList, Pedant, BioCyc and UniProt. After
obtaining the list of genes and E.C. numbers, the E.C. numbers were updated with
information from IUBMB database in order to standardize all E.C. number
information before doing the comparison among five resources and adding the
enzymatic reactions from the relation between E.C. numbers and catalytic reactions
from KEGG Ligand database. The consistency of the retrieved data from the
different databases was explored by creating the gene-E.C. pairs from all possible
E.C. numbers in five databases. All of gene-E.C. pairs with number of databases as
references were included in the reconstructed network without choosing only gene-
33
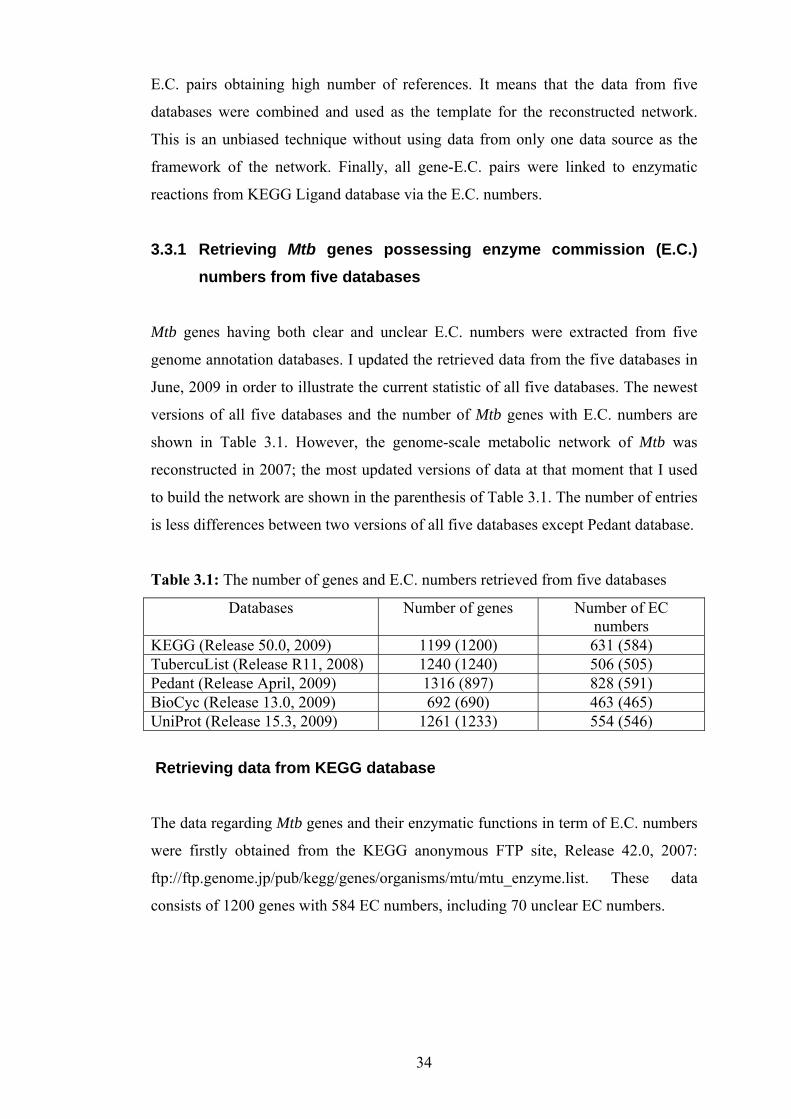
E.C. pairs obtaining high number of references. It means that the data from five
databases were combined and used as the template for the reconstructed network.
This is an unbiased technique without using data from only one data source as the
framework of the network. Finally, all gene-E.C. pairs were linked to enzymatic
reactions from KEGG Ligand database via the E.C. numbers.
3.3.1 Retrieving Mtb genes possessing enzyme commission (E.C.) numbers from five databases
Mtb genes having both clear and unclear E.C. numbers were extracted from five
genome annotation databases. I updated the retrieved data from the five databases in
June, 2009 in order to illustrate the current statistic of all five databases. The newest
versions of all five databases and the number of Mtb genes with E.C. numbers are
shown in Table 3.1. However, the genome-scale metabolic network of Mtb was
reconstructed in 2007; the most updated versions of data at that moment that I used
to build the network are shown in the parenthesis of Table 3.1. The number of entries
is less differences between two versions of all five databases except Pedant database.
Table 3.1: The number of genes and E.C. numbers retrieved from five databases
Databases Number of genes Number of EC numbers
KEGG (Release 50.0, 2009) 1199 (1200) 631 (584) TubercuList (Release R11, 2008) 1240 (1240) 506 (505) Pedant (Release April, 2009) 1316 (897) 828 (591) BioCyc (Release 13.0, 2009) 692 (690) 463 (465) UniProt (Release 15.3, 2009) 1261 (1233) 554 (546)
Retrieving data from KEGG database
The data regarding Mtb genes and their enzymatic functions in term of E.C. numbers
were firstly obtained from the KEGG anonymous FTP site, Release 42.0, 2007:
ftp://ftp.genome.jp/pub/kegg/genes/organisms/mtu/mtu_enzyme.list. These data
consists of 1200 genes with 584 EC numbers, including 70 unclear EC numbers.
34
Retrieving data from TubercuList database
Mtb genes with their E.C. numbers were extracted from TubercuList database
Release R7 (March 17, 2007). I found that 1240 of the 4055 genes obtained were
related to 505 E.C. numbers, including 79 unclear E.C. numbers. These genes are
used for reconstructing the metabolic network of Mtb.
Retrieving data from Pedant database
The data were obtained from Pedant Release 2, 2001. Unfortunately, the whole
information in Pedant database could not be downloaded automatically. Only
information of an individual gene could be retrieved per time via search option.
Therefore, I contacted Mathias Walter, who is one of the authors of Pedant database,
to ask for the whole information directly. The data received consists of gene
accession numbers, E.C. numbers and enzyme names. The 897 genes from Pedant
database were related to 591 clear E.C. numbers.
Retrieving data from BioCyc database
The data from BioCyc version 11.1, 2007 in the part of MtbRvCyc consisting of
3916 genes were downloaded. However, to extract the data about Mtb genes and
their E.C. numbers four data files were retrieved, i.e. Reactions.dat, Enzrxn.dat,
Proteins.dat, and ProtCplxs.col. There is not one data file collecting information
about Mtb genes and their EC numbers. Reactions.dat file obtains enzymatic-reaction
ID and E.C. number, whereas Enzrxn.dat file stores information about unique ID,
which is the same ID as enzymatic-reaction ID in Reactions.dat file, and enzyme for
example, Rv0917-monomer, CPLX1G1G-4117, which is protein complex ID.
Enzymes in Enzrxn.dat file can link to their coding genes from Proteins.dat when the
enzyme is monomer and from ProtCplxs.col when the enzyme is protein complex.
Therefore, Enzrxn.dat file is the link for obtaining E.C. numbers from Reactions.dat
file; and gene names from both Proteins.dat and ProtCplxs.dat files. There are 777
enzymes in the Enzrxn.dat file; however, only 735 of them have E.C. numbers from
35
Reactions.dat file. In these 735 enzymes, 698 of them are monomers and the others
are protein complex. I created gene-E.C. pairs by separating genes encoding for
protein complex to be one gene per EC numbers. For example, Rv1612 and Rv1613
form a protein complex and catalyze the reaction with E.C.: 4.2.1.20, thus two gene-
E.C. pairs were created. Finally, 734 gene-E.C. pairs between 690 genes and 465
E.C. numbers including 16 unclear E.C. numbers were formed.
Retrieving data from UniProt database
UniProt accession numbers with protein description and E.C. numbers were
downloaded from the Universal Protein Resource Knowledgebase (UniProtKB), via
EBI website (http://srs.ebi.ac.uk). There are 1300 entries regarding Mycobacterium
tuberculosis. After that, all UniProt accession numbers were linked to gene accession
numbers via KEGG database. Finally 1233 genes with 546 E.C. numbers including
81 unclear E.C. numbers were obtained.
3.3.2 Updating E.C. numbers with IUBMB
In total, there were 1464 gene with 850 retrieved E.C. numbers from five databases.
Before doing a gene function comparison among five databases, all retrieved E.C.
numbers were updated with new information about enzyme nomenclature from
IUBMB database [51], where some previous enzyme nomenclatures have been
deleted, merged, split or transferred to another E.C. number. For instance, E.C.:
1.14.99.25 has been deleted and transferred to E.C.: 1.14.19.3, linoleoyl-CoA
desaturase. Besides updating information of enzyme classification, one more
important reason is to standardize all E.C. numbers before doing the comparison.
Consequently, 32 of them were updated. The 29 E.C. numbers have been transferred
to be the new E.C. numbers and 2 of them have been split to new E.C. number.
Moreover, one E.C. number has been merged to another E.C. number. The
information regarding updated E.C. numbers were downloaded from IUBMB
website, www.chem.qmul.ac.uk/iubmb/enzyme.
36

3.3.3 Gene-E.C. pairs from all databases
In order to do the comparison of gene function among five resources, all genes and
their E.C. numbers from each database were combined and compared by creating the
relation between one gene and one E.C. number (gene-E.C. pair) as shown in Figure
3.2. One gene will link to all possible E.C. numbers from five databases, resulting in
one gene to multiple E.C. number correlations. On this occasion, a single gene-E.C.
pair was not arbitrarily selected yet obtained from a database with high numbers of
gene annotation. Instead, all gene-E.C. pairs found were employed in network
reconstruction. A total of 2287 gene-E.C. pairs, 1464 genes and 837 E.C. numbers,
were obtained and classified by the number of resource databases as shown in Table
3.2.
Example of retrieved data
4.1.3.276.3.5.82.4.2.18, 4.1.3.27
4.1.3.276.3.5.8Rv0013
UniProtBioCycPedantTubercuListKEGGGene
All information have been kept.
KB6.3.5.8Rv0013TPU4.1.3.27Rv0013
P2.4.2.18Rv0013
DatabaseEC numberGene
Creating gene-EC pairs
Figure 3.2: Gene function comparison by creating gene-E.C. pairs. All possible gene functions from different databases have been kept without deleting the gene functions with low number of references such as E.C.: 2.4.2.18 of Rv0013 from Pedant database.
37

Table 3.2: Classification of gene-E.C. pairs by number of databases providing same annotation
Number of databases Number of Gene-EC pairs 5 412 4 171 3 462 2 338 1 904 Σ 2287
The inconsistency of gene functions among five databases demonstrates that each
database provides different information. However, the existing functions of each Mtb
gene will be identified by validating all possible functions retrieved from five
databases with information from literature and specific genome annotation databases
of Mtb in the literature-based process to achieve a high quality genome-scale
metabolic network of Mtb.
3.3.4 Linking gene-E.C. pairs to reactions via KEGG Ligand database
All 2287 gene-E.C. pairs were linked to enzymatic reactions via the relation between
E.C. number and all possible reactions from the KEGG Ligand database (version
49.0, 2009). The retrieved data for each reaction, consisting of reaction ID,
biochemical details - compound name and compound ID, and description of catalytic
enzymes - E.C. numbers and enzyme name, were obtained from KEGG FTP site
(ftp//ftp.genome.jp/pub/kegg/ligand/reaction/reaction).
For the data extracted from the KEGG Ligand database, there are only 6519
reactions from the total of 7820 reactions containing E.C. numbers. Not all of the 837
E.C. numbers can link to reactions; therefore the genome database-based metabolic
network consists of 1366 genes, 763 E.C. numbers and 2180 reactions. 74 E.C.
numbers from 153 genes cannot link to reactions. However, there are only 98 among
the 153 genes of which all E.C. numbers cannot link to reactions.
Although 98 of the identified genes cannot obtain enzymatic reactions via the
relationship between E.C. numbers and reactions from KEGG Ligand database, I
38

included them in the list of Mtb genes that would be explored regarding their
functions with the literature and other specific genome annotation databases of Mtb
for obtaining their existing enzymatic reactions. However, the reactions extracted
from KEGG Ligand database were used as the guide line for validating the existing
gene functions in the literature-based process.
3.4 Literature-Based Process
In the literature-based process, the list of genes with E.C. numbers and their
enzymatic reactions from the genome database-based process were manually
validated with literature and specific genome annotation databases of Mtb in order to
refine the results from the first part of the reconstruction process and complete the
high quality genome-scale metabolic network of Mtb. Despite a time-consuming
step, literature validation is still required to confirm the existence of enzymatic
reactions incorporated into such a reconstructed network in the real Mtb. The results
from the first part are only the guide-line or template of the network. However,
before validating the genome database-based network, I classified genes based on
number of associated reactions. The genes involving in more enzymatic reactions
were validated their functions with the related publications first, because it is rarely
for one gene to catalyze more number of reactions, for example more than 20
reactions.
Two groups of genes from the genome database-based metabolic network were used
as a framework for constructing a high quality metabolic network of Mtb (HQMtb):
(a) 1366 genes catalyzing 2180 enzymatic reactions, and (b) 98 genes without related
reactions (due to lacking linkage between their E.C. numbers and reactions in KEGG
Ligand database).
Metabolic functions of all 1464 genes were validated with literature and specific
genome annotation databases of Mtb, i.e. TubercuList, WebTB [52], BioCyc and
UniProt in order to confirm the existing metabolic reactions in the organism. The
1366 genes having E.C. numbers and reactions were separated into two groups based
39
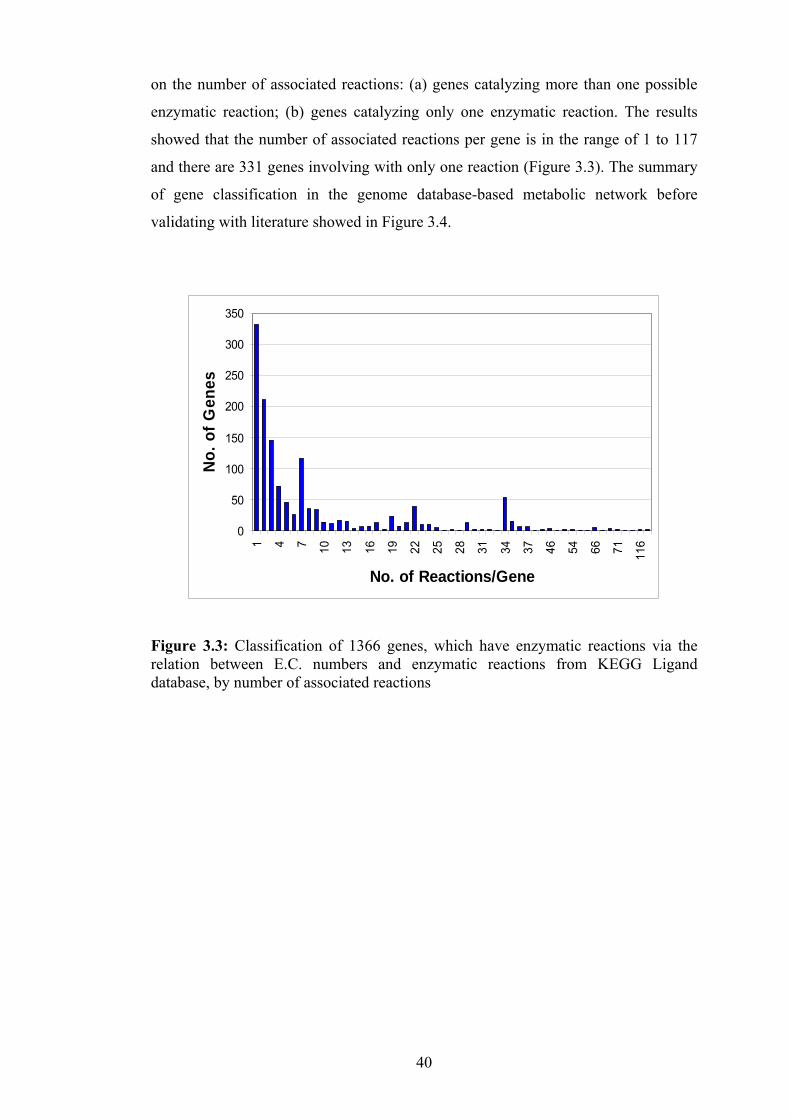
on the number of associated reactions: (a) genes catalyzing more than one possible
enzymatic reaction; (b) genes catalyzing only one enzymatic reaction. The results
showed that the number of associated reactions per gene is in the range of 1 to 117
and there are 331 genes involving with only one reaction (Figure 3.3). The summary
of gene classification in the genome database-based metabolic network before
validating with literature showed in Figure 3.4.
0
50
100
150
200
250
300
350
1 4 7 10 13 16 19 22 25 28 31 34 37 46 54 66 71 116
No. of Reactions/Gene
No.
of G
enes
Figure 3.3: Classification of 1366 genes, which have enzymatic reactions via the relation between E.C. numbers and enzymatic reactions from KEGG Ligand database, by number of associated reactions
40
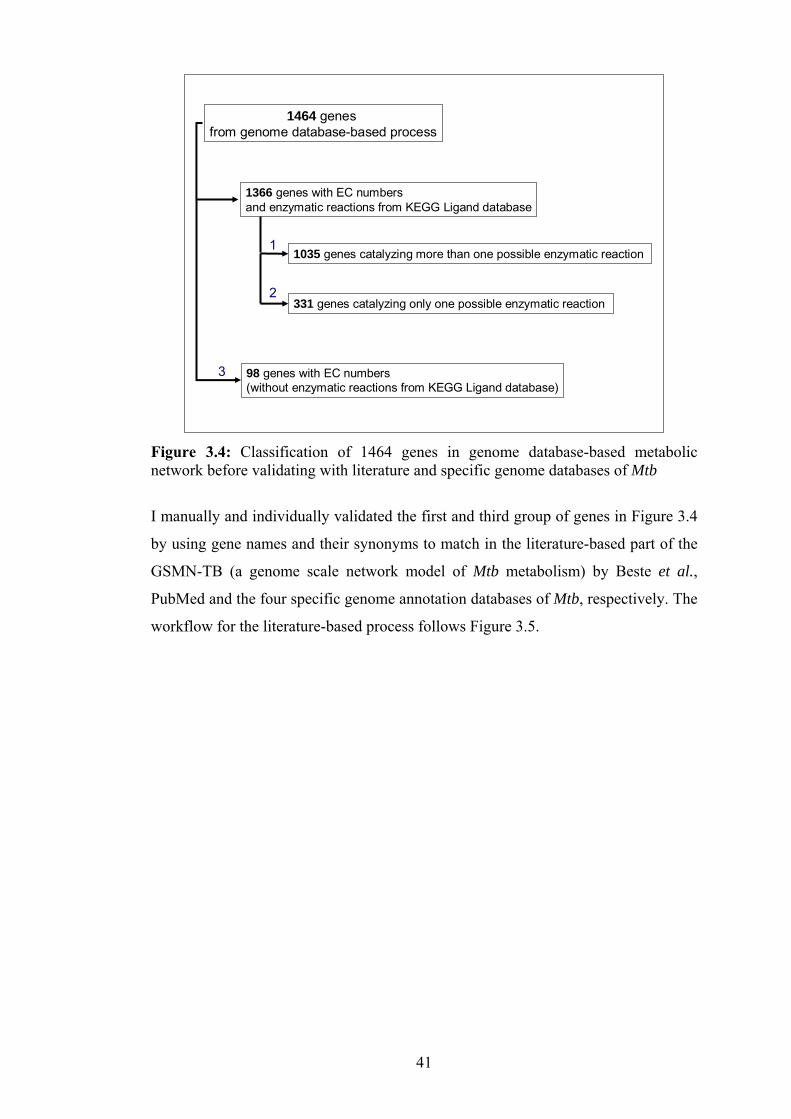
1464 genes from genome database-based process
1366 genes with EC numbers and enzymatic reactions from KEGG Ligand database
98 genes with EC numbers (without enzymatic reactions from KEGG Ligand database)
1035 genes catalyzing more than one possible enzymatic reaction
331 genes catalyzing only one possible enzymatic reaction
1
3
2
Figure 3.4: Classification of 1464 genes in genome database-based metabolic network before validating with literature and specific genome databases of Mtb
I manually and individually validated the first and third group of genes in Figure 3.4
by using gene names and their synonyms to match in the literature-based part of the
GSMN-TB (a genome scale network model of Mtb metabolism) by Beste et al.,
PubMed and the four specific genome annotation databases of Mtb, respectively. The
workflow for the literature-based process follows Figure 3.5.
41

1377 Gene names & Synonyms
Literature-based part of the GSMN-TB model
The metabolic reactions from itwere included in the HQMtbinstead of KEGG reactions.
The metabolic reactions wereextracted from publications,compared with KEGG reactionsand included in the HQMtb.
The metabolic reactions wereextracted from DBs,compared with KEGG reactionsand included in the HQMtb.
Searching in publicationsvia PubMed
These genes were excluded in the HQMtb.
Searching in the four specificgenome annotation DBs of Mtb:TubercuList, WebTB, BioCyc, and UniProt
237 genes 1140 genes
15 genes1125 genes
364 genes 761 genes
Figure 3.5: The workflow for manually validating all metabolic functions of 1464 Mtb genes. The 87 of them catalyzing only one possible enzymatic reaction in genome database-based metabolic network have the same metabolic annotation with complete E.C. numbers from more than three databases. Consequently, these 87 genes were included in the HQMtb without manual validations.
If the genes were found in the literature-based part of the GSMN-TB model, their
enzymatic reactions from it were included in the HQMtb instead of KEGG reactions.
Therefore, the format of enzymatic reactions regarding compound name and
direction is transferred from the GSMN-TB model. If the genes were not found in the
literature-based part of the GSMN-TB model, I further validate their functions by
directly finding information in related publications. The metabolic reactions from the
publications were compared with the existing reactions from KEGG. If they are
similar, the KEGG reactions still appear in the HQMtb. If not, the reaction from the
publication in terms of compound name and direction will replace the KEGG
reaction. Furthermore, if I could not find the literature to confirm the gene function
by using two previous resources, this group of genes were searched in the four
specific genome databases of Mtb for exploring their enzymatic reactions. The
enzymatic reactions from the four databases were compared with KEGG reactions by
using compound names and their synonyms. If they are different, the enzymatic
reactions from the four databases are retrieved and included in the HQMtb instead of
42

KEGG reactions. If not, the KEGG reactions still appear in the HQMtb. In this step,
some genes were deleted from the network because of the following reasons. Firstly,
they are unknown genes or catalyze only general reactions in the four databases. For
example, the catalytic activity of Rv2740 gene is an epoxide + H2O ↔ a glycol from
TubercuList database and it is an unknown gene or hypothetical protein in WebTB,
UniProt and BioCyc databases. Secondly, they function in macromolecule
metabolism involving in DNA and RNA process. Thirdly, they involve in signaling
transduction pathway or regulatory system.
For the second group of genes in Figure 3.4, there are 331 genes catalyzing only one
enzymatic reaction per gene. The 87 of them getting the same annotation from more
than three databases, providing the complete E.C. numbers, and not involved in
macromolecule metabolism and regulatory system, were included into the HQMtb
model according to their functions demonstrated in KEGG without literature
validation. Nevertheless, I manually validated gene functions of the rest of the genes
in this group by using the same method as for the first and the third group of genes in
Figure 3.4.
In conclusion, 761 genes were deleted from the network based on the reasons given
in Table 3.3, while 703 genes were included to the HQMtb after validating their
functions with literature, as summarized in Table 3.4.
43

Table 3.3: The 761 excluded genes in the HQMtb and deleting reasons
Deleting reasons Number of genes Unknown genes or catalyzing only general reactions
580
Functioning in macromolecule metabolism - DNA process - Transcription mechanism - Translation process
92
Functioning in signaling transduction pathway or regulatory system
33
Cytochrome genes 25 Transporter genes 31 Σ 761
Table 3.4: The 703 included genes in the HQMtb and sources of information
Sources of information Number of genes Literature by directly searching via PubMed
15
Literature-based part of GSMN-TB model
237
The four specific genome annotation databases of Mtb
364
Without literature validation 87 Σ 703
Finally, from the literature-based process there are 703 genes included in the HQMtb
from the total of 1464 Mtb genes retrieved from the five genome annotation
databases. Among these 703 genes, the three genes; Rv1622c, Rv1623c and Rv3330,
from the third group of genes in Figure 3.4 were included in the HQMtb since their
enzymatic reactions exist in the specific genome annotation databases of Mtb. Even
though the 98 genes from the third group of genes in Figure 3.4 did not obtain KEGG
reactions via the relation between E.C. numbers and enzymatic reactions from
KEGG Ligand database, we could not neglect this group of genes for further
validating their functions in literature-based process. This shows that only one
database, e.g. KEGG cannot provide complete information in this case we can
retrieve their gene functions from other databases besides KEGG.
44

After validating the possible gene functions retrieved from five databases with
literature, I have found wrong gene function annotations in the databases. This may
be a result from: (a) the incomplete information in each database; (b) the mistakes in
databases. For example, gene Rv1079 is annotated as E.C.: 2.5.1.48 in KEGG,
BioCyc, Pedant, TubercuList and UniProt databases and E.C.: 4.4.1.1 in only BioCyc
database. Both of the gene functions of Rv1079 have been validated with three
publications by Chang and Vining in 2002 [53], Kern and Inamine in 1981 [54], and
Nagasawa et al. in 1987 [55]. Therefore, retrieving gene functions from one data
source will lose some information. An example for case b is gene Rv3389c. It is
annotated as E.C.: 1.1.1.35, 1.1.1.62 and 4.2.1.17 in Pedant and E.C.: 1.-.-.- in
KEGG, TubercuList and UniProt databases. However, Sacco et al. reported that
Rv3389c is a member of the (R)-specific hydratase/dehydratase family (4.2.1.17) by
using molecular techniques in 2007. They purified recombinant Rv3389c protein
and did the enzyme assay. The Rv3389c protein efficiently catalyzed the hydration
of (C8-C16) enoyl-CoA substrates and further catalyzed the dehydration of a 3-
hydroxyacyl-CoA [56]. Therefore, the other three E.C. numbers are wrong.
3.5 Adding IDs to Compounds and Reactions
A large number of the metabolic reactions retrieved from the specific genome
annotation databases of Mtb, related publications and the literature-based part of the
GSMN-TB model do not have reaction and compound ID as those from KEGG.
Therefore, new reaction IDs and compound IDs were assigned
In assigning IDs, all metabolite names in the non-KEGG reactions were
automatically mapped to a list of compound names retrieved from KEGG database
comprising 14237 compounds. However, the completed automatic mapping is
hindered by non-universal symbol in compound names that misleads the search and
mapping process. Only 274 from 461 compounds can automatically match with
KEGG compound list via programming. The other 187 compounds require manually
search in KEGG database to find KEGG compound IDs by using synonyms,
structure, formula, and corresponding E.C. numbers of each compound based on
45
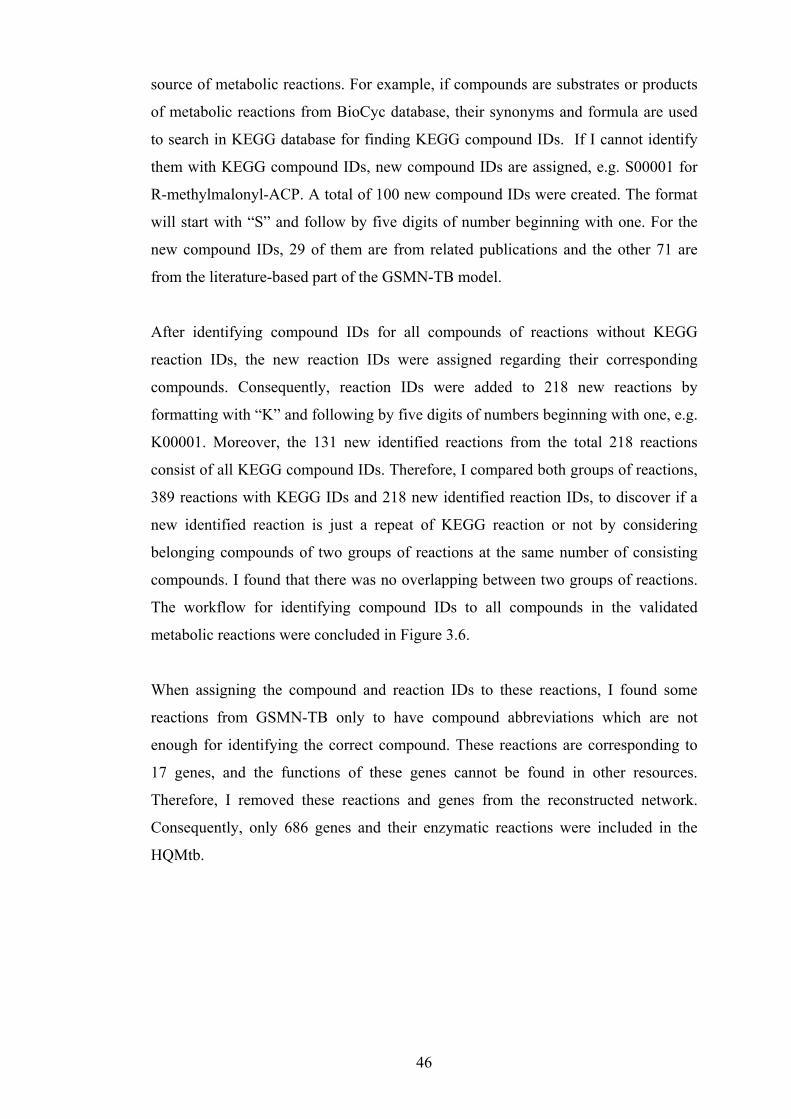
source of metabolic reactions. For example, if compounds are substrates or products
of metabolic reactions from BioCyc database, their synonyms and formula are used
to search in KEGG database for finding KEGG compound IDs. If I cannot identify
them with KEGG compound IDs, new compound IDs are assigned, e.g. S00001 for
R-methylmalonyl-ACP. A total of 100 new compound IDs were created. The format
will start with “S” and follow by five digits of number beginning with one. For the
new compound IDs, 29 of them are from related publications and the other 71 are
from the literature-based part of the GSMN-TB model.
After identifying compound IDs for all compounds of reactions without KEGG
reaction IDs, the new reaction IDs were assigned regarding their corresponding
compounds. Consequently, reaction IDs were added to 218 new reactions by
formatting with “K” and following by five digits of numbers beginning with one, e.g.
K00001. Moreover, the 131 new identified reactions from the total 218 reactions
consist of all KEGG compound IDs. Therefore, I compared both groups of reactions,
389 reactions with KEGG IDs and 218 new identified reaction IDs, to discover if a
new identified reaction is just a repeat of KEGG reaction or not by considering
belonging compounds of two groups of reactions at the same number of consisting
compounds. I found that there was no overlapping between two groups of reactions.
The workflow for identifying compound IDs to all compounds in the validated
metabolic reactions were concluded in Figure 3.6.
When assigning the compound and reaction IDs to these reactions, I found some
reactions from GSMN-TB only to have compound abbreviations which are not
enough for identifying the correct compound. These reactions are corresponding to
17 genes, and the functions of these genes cannot be found in other resources.
Therefore, I removed these reactions and genes from the reconstructed network.
Consequently, only 686 genes and their enzymatic reactions were included in the
HQMtb.
46
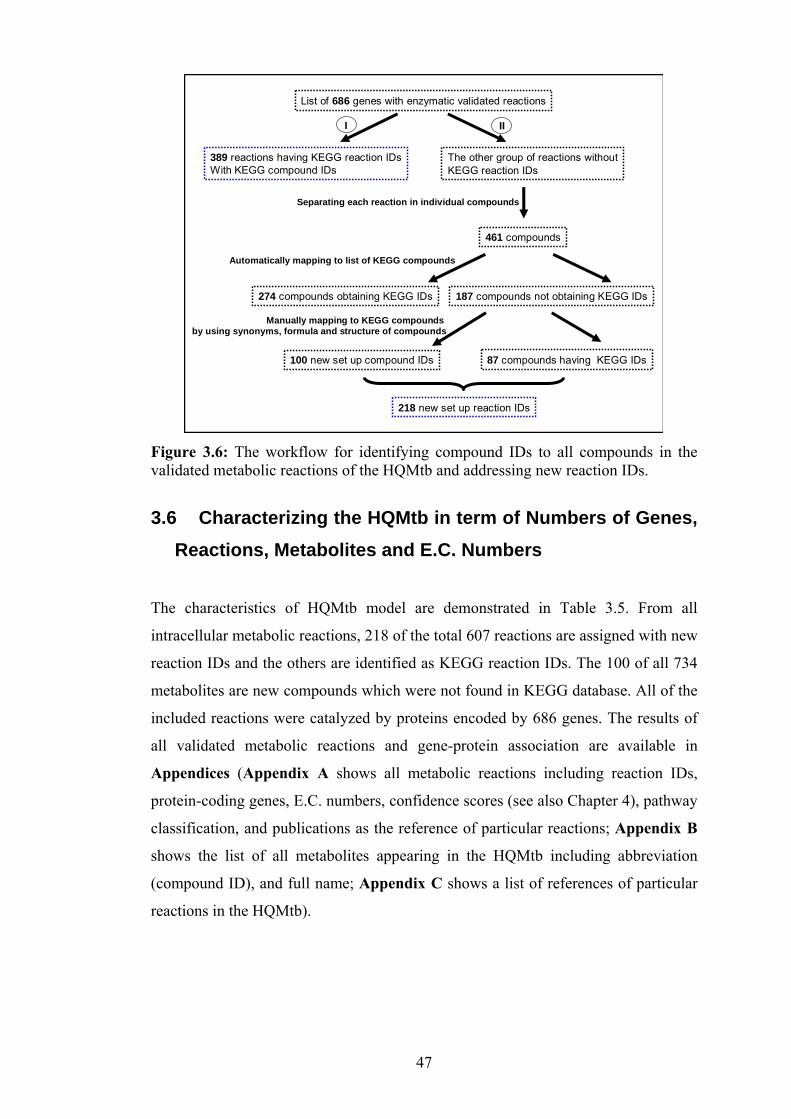
List of 686 genes with enzymatic validated reactions
389 reactions having KEGG reaction IDsWith KEGG compound IDs
461 compounds
274 compounds obtaining KEGG IDs
Separating each reaction in individual compounds
Automatically mapping to list of KEGG compounds
Manually mapping to KEGG compounds by using synonyms, formula and structure of compounds
The other group of reactions withoutKEGG reaction IDs
187 compounds not obtaining KEGG IDs
100 new set up compound IDs 87 compounds having KEGG IDs
218 new set up reaction IDs
I II
Figure 3.6: The workflow for identifying compound IDs to all compounds in the validated metabolic reactions of the HQMtb and addressing new reaction IDs.
3.6 Characterizing the HQMtb in term of Numbers of Genes, Reactions, Metabolites and E.C. Numbers
The characteristics of HQMtb model are demonstrated in Table 3.5. From all
intracellular metabolic reactions, 218 of the total 607 reactions are assigned with new
reaction IDs and the others are identified as KEGG reaction IDs. The 100 of all 734
metabolites are new compounds which were not found in KEGG database. All of the
included reactions were catalyzed by proteins encoded by 686 genes. The results of
all validated metabolic reactions and gene-protein association are available in
Appendices (Appendix A shows all metabolic reactions including reaction IDs,
protein-coding genes, E.C. numbers, confidence scores (see also Chapter 4), pathway
classification, and publications as the reference of particular reactions; Appendix B
shows the list of all metabolites appearing in the HQMtb including abbreviation
(compound ID), and full name; Appendix C shows a list of references of particular
reactions in the HQMtb).
47

Table 3.5: Characteristics of the HQMtb
Genes: 686 Intracellular reactions: 607 Metabolites: 734 EC numbers: 471 (27 incomplete ECs) Average confidence level: 2.76
During the reconstruction process of the HQMtb, I assigned a score to all 607
reactions in the HQMtb using the same basis as Jamshidi and Palsson [35] in order to
demonstrate the confidence level of the reconstructed network resulting in Table 3.5.
Each metabolic reaction in the reconstructed network was identified with a
confidence score according to source of data as follows: 2 refers to sequence based
annotation, 4 refers to experimental biochemical evidence supporting the inclusion of
reaction. There are 231 reactions from the total of 607 reactions are suggested by
experimental biochemical evidence support.
I claim that the reconstructed network is a high quality metabolic network because all
of their metabolic functions have been validated with literature further than retrieved
from various databases. I tried to define a quantitative factor to determine the quality
of the network. Eventually, the confidence score, proposed by Jamshidi and Palsson,
was used to evaluate the quality of the reconstructed network based on source of
information retrieved to reconstruct the network. The confidence score assigned to
each metabolic reaction was sum up and then the average confidence level of the
network was calculated. This factor impacting on the quality of the network was
further used to compare the quality between reconstructed networks, i.e. HQMtb,
GSMN-TB and iNJ661 as shown in Table 4.4 of Chapter 4.
In the HQMtb, 661 genes have been assigned to 471 E.C. numbers, corresponding to
574 reactions. The E.C. numbers from 25 genes were removed in the literature-based
process; however, their metabolic reactions also appear in the HQMtb. Not all
metabolic reactions in the HQMtb were identified with E.C. numbers because some
E.C. numbers were deleted during validating Mtb gene functions with literature.
Even though I could retrieve metabolic reactions of Mtb genes from publications,
48

some of them did not contain E.C. numbers. I attempt to add E.C. numbers to them
by comparing them with reactions having E.C. numbers retrieved from KEGG
database. If they are different, these reactions, retrieved directly from literature,
were also included in the HQMtb without identified E.C. numbers. For example,
Rv0126 gene was validated its functions by De Smet et al. in 2000 [57]. The authors
investigated this gene function via functional assays using mycobacterial extracts and
recombinant enzymes. However, the author stated only the enzymatic reaction
without giving an E.C. number.
I classified these 574 reactions based on enzyme categories. The results are shown in
Figure 3.7. The most abundant enzyme class is transferases (E.C. 2) followed by
oxidoreductases, lyases, hydrolases, ligases, and isomerases. A similar tendency was
found for a reconstructed metabolic network of E. coli by Edwards and Palsson in
2000 [58]. The comparison of the number of genes with the number of reactions in
each enzyme category proposes that in Mtb transferases are less substrate specific
(the highest ratio of number of reactions to number of genes) than any other enzyme
classes, while in E. coli hydrolases are the least substrate-specific enzyme classes.
0.0
0.2
0.4
0.6
0.8
1.0
1.2
EC 1 EC 2 EC 3 EC 4 EC 5 EC 6
No.
of R
eact
ions
/Gen
e
147/
176 21
3/21
9
62/7
1
79/1
06 37/4
5
48/7
2
Figure 3.7: Numbers of reactions and genes in the HQMtb arranged by enzyme categories; EC1: Oxidoreductases, EC2: Transferase, EC3: Hydrolases, EC4: Lyases, EC5: Isomerase and EC6: Ligases.
49

3.7 Pathway Organization and Visualization Maps
The pathway organization of metabolic reactions is an important step in the
metabolic network reconstruction. It affects the overall structure of a network: shape
of a whole metabolic network and divided pathways, the linkages between individual
pathways, and connectivity within a pathway. Metabolic reactions in the HQMtb
were from several resources as shown in Table 3.4; therefore, following an
organization of one resource such as KEGG database is not feasible. In the KEGG
database, all reactions from different organisms are organized into around a hundred
metabolic pathways. This is a general organization that is not specific to
Mycobacterium. Moreover, the big problem of the KEGG organization is that there
is a high overlap between pathways. To address these problems, the new
organization of Mtb metabolic pathway was defined. The aim is to present the
HQMtb without overlapping of reactions between pathways; therefore, each reaction
will appear in only one metabolic pathway.
All 607 metabolic reactions in the HQMtb were organized into pathways.
Subsequently, visualization maps were used to present each metabolic pathway in
order to make a clear understanding of the whole metabolism of Mtb assembling
from small individual metabolic pathways. The validated metabolic reactions were
initially computationally separated along KEGG pathway organization through these
linkages: KEGG reaction IDs, KEGG compound IDs and gene name in each KEGG
metabolic pathway, as a guide line. Nevertheless, each reaction will occur in only
one pathway after the completion of the pathway organization process. The process
was divided into two main sub processes in order to obtain the first draft and final
version of pathway organization.
3.7.1 The first draft of pathway organization
All 607 metabolic reactions were classified in two groups, 389 reactions obtaining
KEGG reaction IDs and 218 new identified reactions IDs. The workflow for
constructing the first draft of pathway organization is shown in Figure 3.8.
50

607 reactions in the HQMtb
389 reactions with KEGG reaction IDs
Mapping to KEGG organizationvia KEGG reaction IDs
218 reactions with new set up reaction IDs
16 reactions in 13 pathways +9 Isolated reactions
550 reactions in 63 pathways + 57 Isolated reactions
I II
Mapping to 61pathwaysvia compound IDs
341 reactions in 61 pathways +48 Isolated reactions
193 reactions with 41 identified pathways
25 reactions without identified pathways
Mapping to KEGG organizationvia gene name
550 reactions + 39 reactions in 63 pathways + 18 Isolated reactions
Mapping 57 Isolated reactions to 63 pathwaysvia compound IDs
Figure 3.8: The workflow for separating metabolic reactions in the HQMtb into pathway: the first draft of pathway organization.
Firstly, the 389 reactions were classified into metabolic pathways following the
organization in KEGG because all of these reactions were identified with KEGG
reaction IDs. However, only one pathway has been assigned to each metabolic
reaction. All 389 KEGG reaction IDs were mapped with the information about the
metabolic pathways and their belonging reaction IDs in each pathway from KEGG
database. 341 of all 389 reactions were assigned to 61 pathways; however, 48
reactions were undefined with pathway. Therefore, I refer to these reactions as
isolated reactions.
Secondly, the other group of reactions, consisting of 218 new identified reactions
IDs, was separated into the same 61 pathways. The relation between compound IDs
of all 341 reactions and their stored pathways was created from the 61-pathway
organization. The number of compounds in each pathway is shown in Table 3.6.
Only the compounds having KEGG compound IDs of 218 reactions were linked to
all possible pathways from the relation between pathways and their compounds in
the 61-pathway organization. 193 reactions can link to 41 pathways, whereas the
other 25 reactions were further mapped with KEGG organization via genes
51

catalyzing them. Finally, only nine reactions in the 218 reactions cannot be identified
with pathways because of no linkage in terms of compounds with previous classified
reactions; therefore, they are referred to as isolated reactions.
52
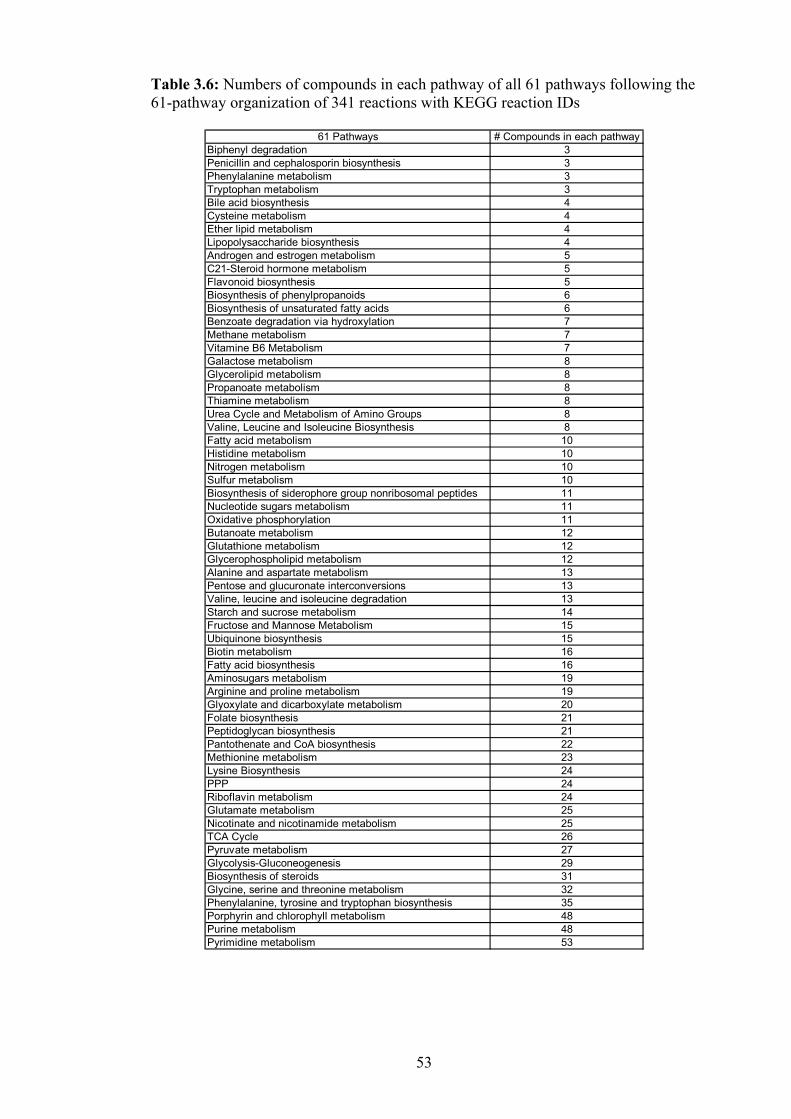
Table 3.6: Numbers of compounds in each pathway of all 61 pathways following the 61-pathway organization of 341 reactions with KEGG reaction IDs
61 Pathways # Compounds in each pathwayBiphenyl degradation 3Penicillin and cephalosporin biosynthesis 3Phenylalanine metabolism 3Tryptophan metabolism 3Bile acid biosynthesis 4Cysteine metabolism 4Ether lipid metabolism 4Lipopolysaccharide biosynthesis 4Androgen and estrogen metabolism 5C21-Steroid hormone metabolism 5Flavonoid biosynthesis 5Biosynthesis of phenylpropanoids 6Biosynthesis of unsaturated fatty acids 6Benzoate degradation via hydroxylation 7Methane metabolism 7Vitamine B6 Metabolism 7Galactose metabolism 8Glycerolipid metabolism 8Propanoate metabolism 8Thiamine metabolism 8Urea Cycle and Metabolism of Amino Groups 8Valine, Leucine and Isoleucine Biosynthesis 8Fatty acid metabolism 10Histidine metabolism 10Nitrogen metabolism 10Sulfur metabolism 10Biosynthesis of siderophore group nonribosomal peptides 11Nucleotide sugars metabolism 11Oxidative phosphorylation 11Butanoate metabolism 12Glutathione metabolism 12Glycerophospholipid metabolism 12Alanine and aspartate metabolism 13Pentose and glucuronate interconversions 13Valine, leucine and isoleucine degradation 13Starch and sucrose metabolism 14Fructose and Mannose Metabolism 15Ubiquinone biosynthesis 15Biotin metabolism 16Fatty acid biosynthesis 16Aminosugars metabolism 19Arginine and proline metabolism 19Glyoxylate and dicarboxylate metabolism 20Folate biosynthesis 21Peptidoglycan biosynthesis 21Pantothenate and CoA biosynthesis 22Methionine metabolism 23Lysine Biosynthesis 24PPP 24Riboflavin metabolism 24Glutamate metabolism 25Nicotinate and nicotinamide metabolism 25TCA Cycle 26Pyruvate metabolism 27Glycolysis-Gluconeogenesis 29Biosynthesis of steroids 31Glycine, serine and threonine metabolism 32Phenylalanine, tyrosine and tryptophan biosynthesis 35Porphyrin and chlorophyll metabolism 48Purine metabolism 48Pyrimidine metabolism 53
53

Combining both groups of reactions, 550 reactions from the total of 607 reactions
were classified into 63 pathways, 61 of which are identical to the pathways classified
previously. The other two pathways are from the step where I tried to classify 25
reactions, which were not identified with pathways after mapping to 61 pathways,
along KEGG organization via gene name. However, the other 57 isolated reactions
were mapped again with the 63-pathway organization via compound IDs. The
mapping process was performed at one isolated reaction at a time, and repeated until
no further compound link was found between the isolated reactions and the reactions
in the identified pathways. The first draft of pathway organization comprised 63
pathways of 589 reactions and 18 isolated reactions. The numbers of reactions and
compounds in each pathway is summarized in Table 3.7.
54

Table 3.7: Numbers of reactions and compounds per pathway in the first draft of pathway organization
63 Pathways + Isolated # reactions in each pathway # compounds in each pathwayAndrogen and estrogen metabolism 1 5Bile acid biosynthesis 1 4Biosynthesis of phenylpropanoids 1 6Biosynthesis of unsaturated fatty acids 1 6Biphenyl degradation 1 3C21-Steroid hormone metabolism 1 5Ether lipid metabolism 1 4Flavonoid biosynthesis 1 5gamma-Hexachlorocyclohexane degradation 1 4Penicillin and cephalosporin biosynthesis 1 3Phenylalanine metabolism 1 3Tryptophan metabolism 1 3Benzoate degradation via hydroxylation 2 7Biosynthesis of siderophore group nonribosomal peptides 2 11Lipopolysaccharide biosynthesis 2 7Vitamine B6 Metabolism 2 7Galactose metabolism 3 8Glutathione metabolism 3 15Tyrosine metabolism 3 4Methane metabolism 4 10Pentose and glucuronate interconversions 4 15Thiamine metabolism 4 11Biotin metabolism 5 20Butanoate metabolism 5 15Nucleotide sugars metabolism 5 14Oxidative phosphorylation 5 13Alanine and aspartate metabolism 6 16Starch and sucrose metabolism 6 15Urea Cycle and Metabolism of Amino Groups 6 19Valine, Leucine and Isoleucine Biosynthesis 6 14Aminosugars metabolism 7 21Cysteine metabolism 7 17Glycerophospholipid metabolism 7 18Glyoxylate and dicarboxylate metabolism 7 20Histidine metabolism 7 17Propanoate metabolism 7 14Folate biosynthesis 8 22Arginine and proline metabolism 9 30Glycerolipid metabolism 9 35Nitrogen metabolism 9 22Valine, leucine and isoleucine degradation 9 22Lysine Biosynthesis 10 25Sulfur metabolism 10 28Riboflavin metabolism 11 30Fatty acid metabolism 12 26Fructose and Mannose Metabolism 12 24Pantothenate and CoA biosynthesis 12 28Pyruvate metabolism 12 32Ubiquinone biosynthesis 12 32TCA Cycle 13 31Nicotinate and nicotinamide metabolism 15 31PPP 15 30Biosynthesis of steroids 18 37Methionine metabolism 19 46Glycine, serine and threonine metabolism 20 41Peptidoglycan biosynthesis 20 40Phenylalanine, tyrosine and tryptophan biosynthesis 21 44Glutamate metabolism 25 48Glycolysis-Gluconeogenesis 26 47Porphyrin and chlorophyll metabolism 27 60Pyrimidine metabolism 35 64Purine metabolism 36 66Fatty acid biosynthesis 37 72Isolated 18 51
55

3.7.2 The final version of pathway organization and visualization maps
As many pathways have only a few numbers of reactions, I tried to combine these
small pathways with the big pathways. The 135 reactions in 37 small pathways
comprising less than nine reactions per pathway were reorganized. Because the aim
of pathway organization and visualization maps is to show how individual pathway
link to each other and to understand the relation between metabolites in each
pathway, very small pathways do not give a better understanding of these
relationships than one enzymatic reaction. The workflow for constructing the final
version of Mtb pathway organization followed Figure 3.9.
Small pathways (< 9 reactions per pathway)135 reactions in 37 pathways
Mapping to big pathwaysvia compound IDs
572 reactions in 26 pathways + 35 Isolated reactions
I II
550 reactions + 39 reactions in 63 pathways + 18 Isolated reactions
Big pathways (≥ 9 reactions per pathway)472 reactions in 26 pathways
Mapping all isolated reactionswith previous identified pathways
Figure 3.9: The workflow for organizing metabolic reactions in the HQMtb into pathway: the final version of pathway organization.
Firstly, 135 reactions were connected to the 26 big pathways via compound linkages
and the isolated reactions were also mapped to the previous pathway organization
through compound IDs until no additional compound link was found between
isolated reactions and reactions in the identified pathways. Finally, all 607 reactions
in the HQMtb were reorganized into 26 pathways; however, 35 of them were isolated
56

reactions. The numbers of reactions in each pathway of the final version of pathway
organization are in the range of 9 to 38 and the results are shown in Table 3.8.
Table 3.8: Numbers of reactions per pathway in the final version of pathway organization
26 Pathways + Isolated # reaction in each pathwayArginine and proline metabolism 9Glycerolipid metabolism 9Nitrogen metabolism 9Valine, leucine and isoleucine degradation 9Riboflavin metabolism 13Fatty acid metabolism 14Fructose and Mannose Metabolism 14Sulfur metabolism 15Pantothenate and CoA biosynthesis 18Ubiquinone biosynthesis 18Nicotinate and nicotinamide metabolism 19PPP 20Glycine, serine and threonine metabolism 21Pyruvate metabolism 22TCA Cycle 23Biosynthesis of steroids 24Methionine metabolism 25Lysine Biosynthesis 26Phenylalanine, tyrosine and tryptophan biosynthesis 28Porphyrin and chlorophyll metabolism 29Peptidoglycan biosynthesis 30Glutamate metabolism 32Glycolysis-Gluconeogenesis 35Purine metabolism 36Pyrimidine metabolism 36Fatty acid biosynthesis 38Isolated 35Σ 607
After organizing all 607 reactions in 26 pathways and one group of isolated reactions
that cannot be identified with pathways, only the main metabolites of all 607
reactions were presented in main metabolite graph in order to show the relation
between compounds in each pathway. The main metabolite is the biochemical
compounds presented in the metabolic pathway which are not defined as current
metabolites or cofactors (see Table 3.9). The current or currency metabolites are
normally used as carriers for transferring electrons and certain functional groups
(phosphate group, amino group, one carbon unit, methyl group etc.) such as ATP,
ADP, NADH, NAD+, H2O and Pi [59]. Moreover, the small molecules such as
57

NH3, O2, and CO2 are also considered as current metabolites [59]. The current
metabolite is the same as the external metabolite participating in many reactions and
is not in pseudo steady state in a sub-network [60].
The main metabolite graphs were created by removing the connections through 33
current metabolites and cofactors shown in Table 3.9 in order to make the metabolite
graph correct in terms of biochemical meaning. Consequently, all 26 main metabolite
graphs were shown in the following link,
http://www.ehmn.bioinformatics.ed.ac.uk/tbpathway. The two examples of
visualization maps, Nitrogen metabolism and TCA cycle, are shown in Figure 3.10
and 3.11, respectively.
58

Table 3.9: List of current metabolites* and cofactors* KEGG compound ID Compound name
C00001 H2OC00002 ATPC00003 NAD+C00004 NADHC00005 NADPHC00006 NADP+C00007 OxygenC00008 ADPC00009 OrthophosphateC00010 CoAC00011 CO2C00013 PyrophosphateC00014 NH3C00016 FADC00020 AMPC00080 H+C00206 dADPC00229 Acyl-carrier proteinC00239 dCMPC00286 dGTPC00361 dGDPC00363 dTDPC00364 dTMPC00365 dUMPC00458 dCTPC00459 dTTPC00460 dUTPC00705 dCDPC01346 dUDPC01352 FADH2C03939 Acetyl-[acyl-carrier protein]C04253 Electron-transferring flavoproteinC04570 Reduced electron-transferring flavoprotein
* The current metabolite is biochemical compound normally used as carriers for transferring electrons and certain functional groups (phosphate group, amino group, one carbon unit, methyl group etc.), while the cofactor is a group of non-protein chemical compounds that is required to bind a protein and assist the protein’s biological activity such as FAD, NAD+ and CoA. The studied network contains 33 current metabolites and cofactors that are excluded from metabolite graphs.
59
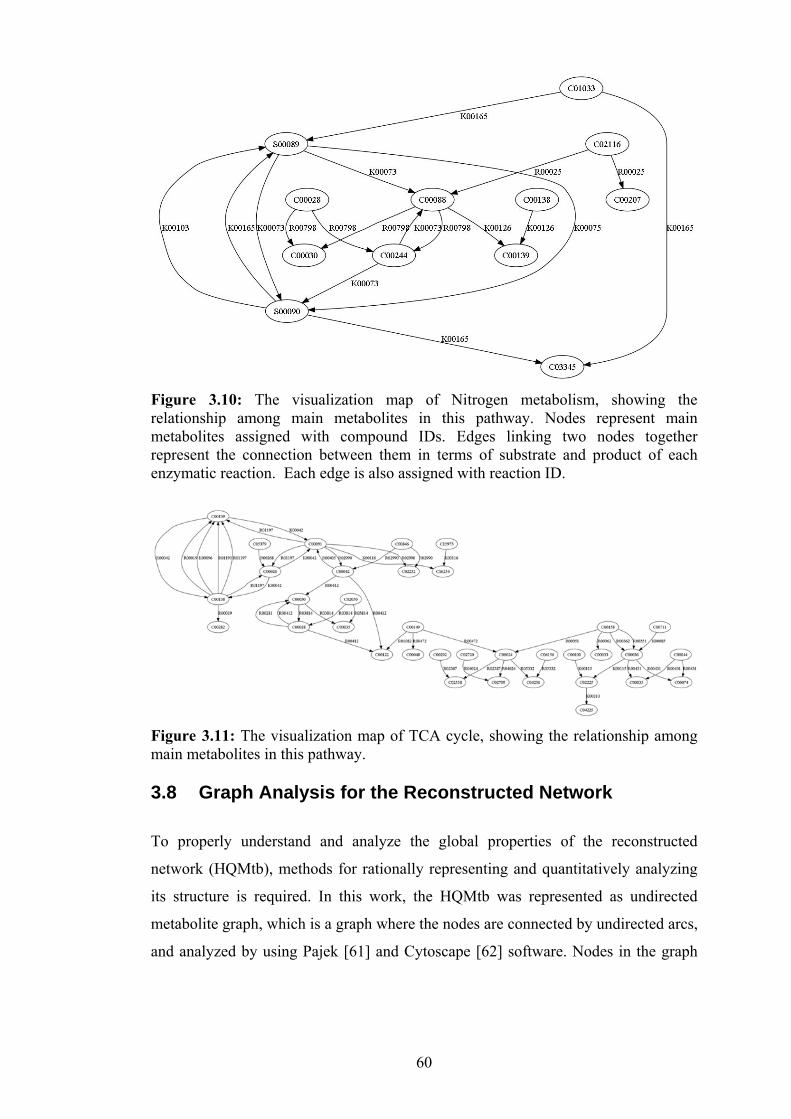
Figure 3.10: The visualization map of Nitrogen metabolism, showing the relationship among main metabolites in this pathway. Nodes represent main metabolites assigned with compound IDs. Edges linking two nodes together represent the connection between them in terms of substrate and product of each enzymatic reaction. Each edge is also assigned with reaction ID.
Figure 3.11: The visualization map of TCA cycle, showing the relationship among main metabolites in this pathway. 3.8 Graph Analysis for the Reconstructed Network To properly understand and analyze the global properties of the reconstructed
network (HQMtb), methods for rationally representing and quantitatively analyzing
its structure is required. In this work, the HQMtb was represented as undirected
metabolite graph, which is a graph where the nodes are connected by undirected arcs,
and analyzed by using Pajek [61] and Cytoscape [62] software. Nodes in the graph
60

represent main metabolites in the HQMtb and edges represent enzymatic reaction
corresponding to connection between the nodes as substrate-product relationship.
Pajek, a program for analysis and visualization of large network, aims to support
abstraction by decomposition of a large network into several small networks, to
provide the user with some powerful visualization tools, and to implement a section
of efficient algorithms for analysis of large network [61]. With Pajek, users can find
clusters in network, extract nodes that belong to the same cluster, and show relations
among clusters. Cytoscape is software that is able to integrate both molecular
interaction and state measurements together in a common frame work [62]. The
general purpose is to facilitate modeling environment by integrating biomolecule
interaction networks and states together. The central organization of Cytoscape is a
network graph with molecular species as nodes and intermolecular interactions as
links or edges. Its core software component provides four functions: a) a basic
functionality for integrating arbitrary data on graph, b) a visual representation of
graph and integrated data, c) selection and filtering tools, and d) an interface to
external methods implemented as plug-ins.
From all 607 intracellular reactions in the HQMtb, the main metabolite pairs showing
the relationship between substrate and product of each intracellular reaction were
manually created. Removal of connections through current metabolites and cofactors
such as ATP, ADP, NADH, NAD+, H2O, Pi, NH3, O2, and CO2 was performed in
order to make the metabolite graph correct in terms of biological meaning [60]. First,
in each reaction all possible main metabolite pairs were created and then the relation
between metabolites were verified with KEGG database in order to confirm that the
substrate can be catalyzed to be the product by one step of enzymatic reaction.
Therefore, only main metabolite pairs with one step of enzymatic conversion
between substrate and product were included for network structure analysis. For
instance, R06974 reaction: Formate + ATP + 5'-Phosphoribosylglycinamide <=>
ADP + Orthophosphate + 5'-Phosphoribosyl-N-formylglycinamide is catalyzed by
glycinamide ribonucleotide transformylase in Purine metabolism. There are only
two possible main metabolite pairs from this reaction, i.e. Formate and 5'-
61

Phosphoribosyl-N-formylglycinamide, 5'-Phosphoribosylglycinamide and 5'-
Phosphoribosyl-N-formylglycinamide; however, only the later has been catalyzed by
10-Formyltetrahydrofolate:5'-phosphoribosylglycinamide formyltransferase with one
step of enzymatic conversion. Consequently, only one main metabolite pair was
created from R06974 reaction. Not all intracellular reactions in the HQMtb have
been decomposed to be metabolite pairs because of two reasons: a) all compounds in
the reaction are current metabolites or cofactors, b) there is no one step enzymatic
conversion in all main metabolite pairs of that reaction. The number of metabolite
pairs per enzymatic reaction is in the range of 0 to 5.
Finally, the HQMtb was represented in the metabolite graph as shown in Figure 3.12.
It consists of 641 nodes, corresponding to main metabolites in the HQMtb network,
and 588 edges, corresponding to the connections between the nodes via substrate-
product relationship in enzymatic reactions.
Figure 3.12: Metabolite graph of the whole HQMtb. The nodes correspond to main metabolites, whereas the lines between two nodes correspond to metabolic reactions connecting two metabolites together. The picture was drawn using Pajek program.
62
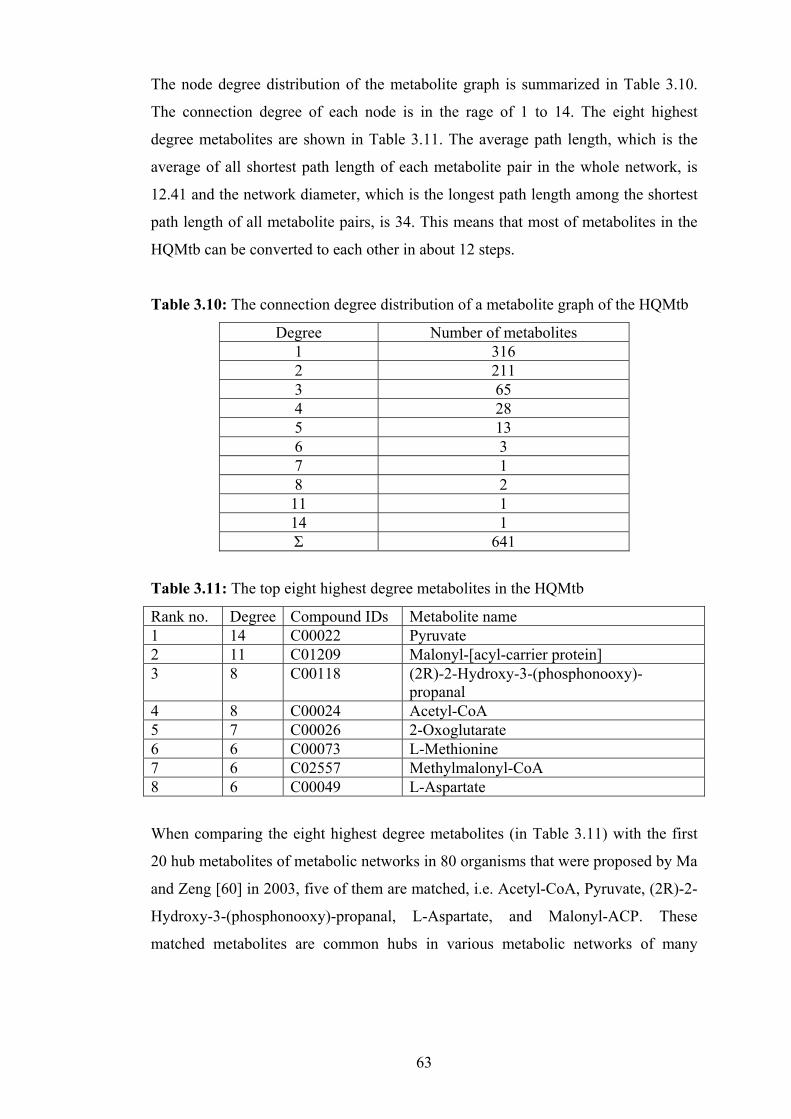
The node degree distribution of the metabolite graph is summarized in Table 3.10.
The connection degree of each node is in the rage of 1 to 14. The eight highest
degree metabolites are shown in Table 3.11. The average path length, which is the
average of all shortest path length of each metabolite pair in the whole network, is
12.41 and the network diameter, which is the longest path length among the shortest
path length of all metabolite pairs, is 34. This means that most of metabolites in the
HQMtb can be converted to each other in about 12 steps.
Table 3.10: The connection degree distribution of a metabolite graph of the HQMtb
Degree Number of metabolites 1 316 2 211 3 65 4 28 5 13 6 3 7 1 8 2 11 1 14 1 Σ 641
Table 3.11: The top eight highest degree metabolites in the HQMtb
Rank no. Degree Compound IDs Metabolite name 1 14 C00022 Pyruvate 2 11 C01209 Malonyl-[acyl-carrier protein] 3 8 C00118 (2R)-2-Hydroxy-3-(phosphonooxy)-
propanal 4 8 C00024 Acetyl-CoA 5 7 C00026 2-Oxoglutarate 6 6 C00073 L-Methionine 7 6 C02557 Methylmalonyl-CoA 8 6 C00049 L-Aspartate
When comparing the eight highest degree metabolites (in Table 3.11) with the first
20 hub metabolites of metabolic networks in 80 organisms that were proposed by Ma
and Zeng [60] in 2003, five of them are matched, i.e. Acetyl-CoA, Pyruvate, (2R)-2-
Hydroxy-3-(phosphonooxy)-propanal, L-Aspartate, and Malonyl-ACP. These
matched metabolites are common hubs in various metabolic networks of many
63

organisms, whereas the other three metabolites, 2-Oxoglutarate, L-Methionine and
Methylmalonyl-CoA, are unique hub metabolites of HQMtb. The enzymes,
catalyzing the reactions involved in these unique hub metabolites, may be interesting
as drug targets against TB.
For average path length and network diameter comparison, the HQMtb was
compared with metabolic network of E. coli because both of them are in the kingdom
of bacteria. Ma and Zeng reported that the average path length and network diameter
for the whole metabolic network of E. coli were 8.20 and 23, respectively in 2003
[60]. Both of the quantitative values of HQMtb are higher than E. coli metabolic
network. It may indicate that the genome-scale metabolic network of Mtb is more
complicated than E. coli. E. coli uses only around eight steps of enzymatic reactions
for converting one substrate to be a product, whereas Mtb uses around 12 steps.
3.9 Discussion and Conclusion
The high quality genome-scale metabolic network (HQMtb) is a biochemical
reaction network comprising 607 intracellular metabolic reactions and 734
metabolites (Table 3.5). All of the reactions are gene-associated reactions belonging
to 686 genes. This corresponded to ~47% of all Mtb genes that were assigned on
E.C. numbers in the five databases (686 of 1464 genes). The remaining 53%
corresponding mainly to regulatory genes, transporter genes, genes functioning in
signaling transduction, and genes with unknown unique metabolic reactions.
The complete genome sequence of the Mycobacterium tuberculosis strain H37Rv
consists of 3,994 protein-coding genes and 50 stable RNA-coding genes [63, 64].
However, only 2,058 genes (52% of the genome) have been assigned their functions.
The total number of genes included in the reconstructed network corresponded to
~33% of all characterized genes. In comparison with other model organisms, for
instance, S. cerevisiae, the current version of its genome-scale reconstructed
metabolic network by Forster et al. [27] covers ~16% of all characterized ORFs in
the yeast genome.
64

Because the high quality genome-scale metabolic network of Mtb was reconstructed
in this work, I had to deal with a huge amount of gene annotation information in
various databases during genome database-based process, for example exacting Mtb
genes and their metabolic functions in term of E.C. numbers from databases,
updating these E.C. numbers with IUBMB database, comparing retrieved gene
functions by creating gene-E.C. pairs, adding enzymatic reactions from KEGG
Ligand database via E.C. numbers, and classifying retrieved genes by number of
associated reactions before manual validation with literature. All steps of
reconstruction process were performed semi-automatically via the developed Visual
Basic for Applications (VBA) code. The VBA code was developed not only for
genome-scale metabolic network reconstruction, but also for pathway organization
and graph analysis. During pathway organization process, VBA code was written for
mapping the included metabolic reactions in the HQMtb with KEGG reaction IDs for
creating a preliminary pathway organization maps. For graph analysis, non-repeat
main metabolite pairs were created automatically via VBA code as well.
The reconstructed network was claimed to be a high quality genome-scale metabolic
network of Mtb since the entire included metabolic gene functions were validated
with the literature. The 15 genes (shown in Table 3.4) catalyzing 21 metabolic
reactions were manually retrieved from 21 related publications. The correctness of
the resulting metabolic reactions of these 15 genes was reviewed and confirmed by
Hongwu Ma, my second supervisor. These 21 reactions were assigned with 12 new
set up reaction IDs and 9 KEGG reaction IDs
The first version of the HQMtb comprises only intracellular metabolic reactions with
gene associations; however, transport reactions will be included in the next version
of the model to improve the network connectivity before performing a quantitative
simulation. For a genome-scale metabolic network, Flux Balance Analysis (FBA) is
an attractive tool to simulate and deal with a large-scaled system. This simulation
technique might be applied to the studied network in the future in order to ensure the
realistic behavior of the reconstructed network that is critical for further
improvement in the quality of Mtb metabolic network.
65
CHAPTER 4
Comparison of the HQMtb with the Published Genome-Scale Metabolic Models of Mtb
While I was reconstructing the high quality genome-scale metabolic network of Mtb
(HQMtb), two research groups independently published their genome-scale
metabolic networks for Mtb strain H37Rv: GSMN-TB model by Beste et al.(partially
used as an input for my model) and iNJ661 model by Jamshidi and Palsson. Both
models and the HQMtb model were reconstructed in parallel based on different
methods and resources of Mtb genomic data. As mentioned in Chapter 3, I have
made use of literature-based part of GSMN-TB model in the reconstruction process.
In this chapter I present a more comprehensive comparison of the three models, in
order to demonstrate the differences among them and the contributions from the
HQMtb in term of new genes or new validated metabolic reactions. Moreover, a
group of genes that should be included in the next version of the HQMtb was
proposed from the investigation of differences among three Mtb models in order to
obtain more completed version of genome-scale metabolic model of Mtb.
The comparison of the two previous Mtb models and the HQMtb model regarding
the reconstruction approach, model characteristics and its application are presented in
section 4.1. The three aspects of models comparison are described in section 4.2:
model characteristics comparison (section 4.2.1), gene comparison (section 4.2.2)
and E.C. number comparison (section 4.2.3). For each aspect, I describe about the
methodology and then show the results. Interestingly, the gene comparison among
three models, the new genes were found only in the HQMtb. The absent genes in the
HQMtb that are present in either GSMN-TB or iNJ661 model will be discussed.
Finally, discussion and conclusions of the chapter are summed up in section 4.3.
66
4.1 Introduction to the Three Models 4.1.1 The GSMN-TB model
The GSMN-TB, standing for genome-scale metabolic network of Mtb, comprises
849 unique reactions, 739 metabolites and 726 genes [34]. Not all included reactions
are gene-associated reactions. There are 210 reactions included as a result of in silico
simulation results of Flux Balance Analysis (FBA) without genomic evidence
supporting in order to make this cell replica grow up like a real cell. The details of
model characteristics are shown in Table 4.1. The genome-scale model of the related
actinomycete, Streptomyces coelicolor was used as the template for the GSMN-TB
model reconstruction. The high quality metabolic network of Streptomyces
coelicolor A3(2) was reconstructed by Borodina et al. in 2005 based on pathway
information from the KEGG database, and then manually curating the automatically
created model with information from books, literature, and other available
information source [65]. The model consists of 971 reactions, 500 metabolites, and
711 ORFs; however, only 764 reactions from the total have the assigned ORFs.
After that, Beste et al. used gene orthology clusters computed from KEGG database
to assign the respective Mtb H37Rv gene numbers to the genes present in the
S.coelicolor model and then transferred corresponding metabolic reactions of
S.coelicolor to the GSMN-TB model. 487 reactions (57% of the total reactions in
GSMN-TB model) were directly transferred from the S.coelicolor model and used as
the preliminary model before adding additional metabolic reactions from KEGG
database and BioCyc database (MtbRvCyc only) in order to complete the specific
metabolic network of Mtb. A significant proportion of the GSMN-TB model was
also manually generated from related publications describing experimental work.
The metabolic pathways that were gathered from the original literature data are
summarized in Table 4.2.
67

Table 4.1: Statistics of the GSMN-TB model
Number Total number of reactions 849 Orphan* reactions 210 Total number of genes 726 Total number of metabolites 739
*The orphan reactions are reactions from in silico simulation without genomic evidence supporting the inclusion of a reaction.
Table 4.2: Metabolic pathways in the GSMN-TB model that were reconstructed by directly extracting information from original publications Biosynthetic pathways Catabolic pathways Respiratory pathways Arabinogalactan Additional beta oxidation
pathways NADH dehydrogenases, cytochromes
Mycolic acids Odd and even numbered fatty acids catabolism
Nitrate as an alternative electron acceptor
Trehalose monomycolate, trehalose dimycolate
Dimycocerosate esters (DIMs)
Phenolic glycolipid (PGL) Sulfolipid SL-1 Phosphatidylinositol mannosides (PIMS)
Lipomannan (LM) Lipoarabinomannan (LAM)
Mannosyl β-1-phosphodolichol (MPD)
Siderophore mycobactin Cofactor F420 Mycothiol
The model was quantitatively calibrated by using Flux Balance Analysis (FBA)
technique to simulate the growth rates of Mtb and comparing with experimental data
obtained from growth of M. bovis BCG in glycerol-limited continuous culture. The
result demonstrated that the predicted biomass production yield was within the 95%
confidence interval of experimental value. Even though Mtb and M. bovis BCG are
different species, the authors claimed to use the growth rate of M. bovis BCG for
validating GSMN-TB model of Mtb since BCG and Mtb have a high degree of
homology sharing 99.9% of DNA.
68
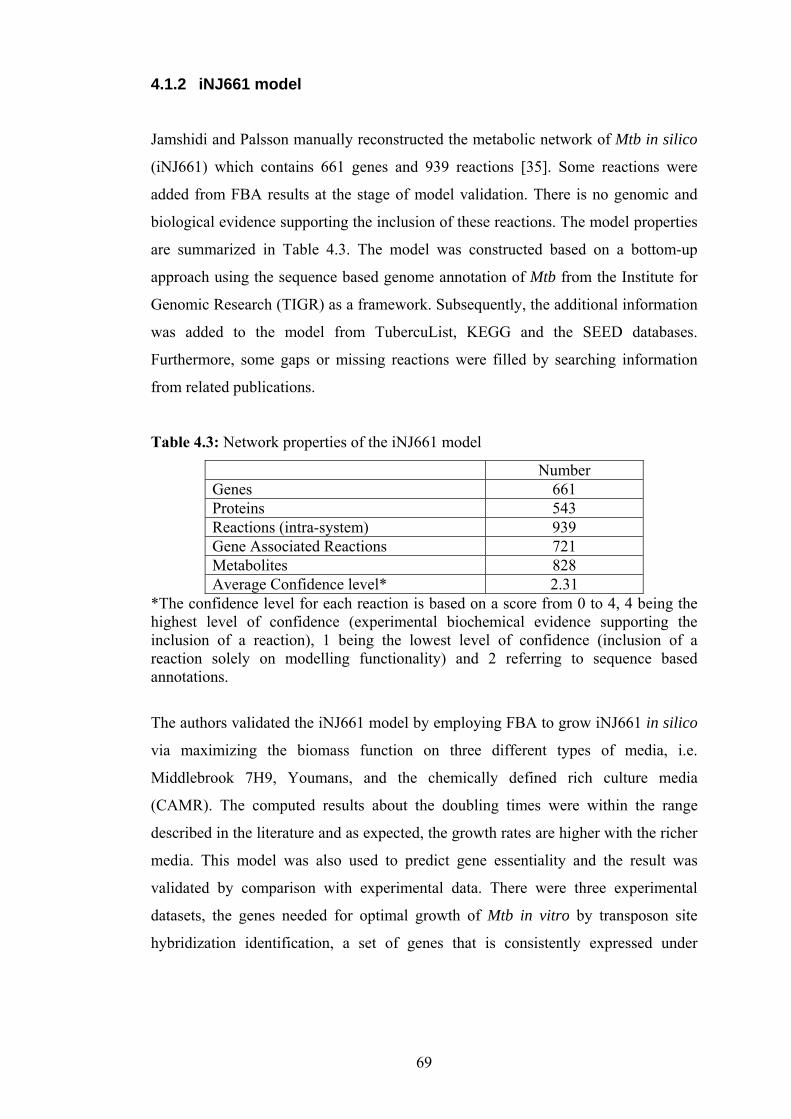
4.1.2 iNJ661 model
Jamshidi and Palsson manually reconstructed the metabolic network of Mtb in silico
(iNJ661) which contains 661 genes and 939 reactions [35]. Some reactions were
added from FBA results at the stage of model validation. There is no genomic and
biological evidence supporting the inclusion of these reactions. The model properties
are summarized in Table 4.3. The model was constructed based on a bottom-up
approach using the sequence based genome annotation of Mtb from the Institute for
Genomic Research (TIGR) as a framework. Subsequently, the additional information
was added to the model from TubercuList, KEGG and the SEED databases.
Furthermore, some gaps or missing reactions were filled by searching information
from related publications.
Table 4.3: Network properties of the iNJ661 model
Number Genes 661 Proteins 543 Reactions (intra-system) 939 Gene Associated Reactions 721 Metabolites 828 Average Confidence level* 2.31
*The confidence level for each reaction is based on a score from 0 to 4, 4 being the highest level of confidence (experimental biochemical evidence supporting the inclusion of a reaction), 1 being the lowest level of confidence (inclusion of a reaction solely on modelling functionality) and 2 referring to sequence based annotations.
The authors validated the iNJ661 model by employing FBA to grow iNJ661 in silico
via maximizing the biomass function on three different types of media, i.e.
Middlebrook 7H9, Youmans, and the chemically defined rich culture media
(CAMR). The computed results about the doubling times were within the range
described in the literature and as expected, the growth rates are higher with the richer
media. This model was also used to predict gene essentiality and the result was
validated by comparison with experimental data. There were three experimental
datasets, the genes needed for optimal growth of Mtb in vitro by transposon site
hybridization identification, a set of genes that is consistently expressed under
69
different growth conditions in liquid culture, and a set of genes needed for Mtb
survival in vivo during infection in mice. Gene deletion results were simulated from
iNJ661 model, in which each gene was individually deleted and growth was
optimized on Middlebrook media. 55% of the simulation results were in agreement
with experimental data.
4.1.3 HQMtb model
The HQMtb, a high quality genome-scale network of Mtb metabolism, was
constructed based on an unbiased reconstruction approach. The gene annotation
information of Mtb from five databases were combined and used as the template for
HQMtb reconstruction. Moreover, all gene functions in the genome database-based
network were manually validated with literature in order to consolidate the network
before doing further qualitative or quantitative analysis. The model contains 686
genes and 607 reactions, all of which are gene associated reactions. The statistics of
HQMtb model are summarized in Table 3.5 and more details about reconstruction
process are mentioned in chapter 3.
4.2 Models Comparison
Due to differences in reconstruction method, and sources of genomic data, three
genome-scale metabolic networks of Mtb mentioned above are different. The
reconstruction process of the HQMtb was based on unbiased techniques by initially
extracting and combining information from various databases to create the
framework of network, whereas one source of genome annotation information was
chosen to form a scaffold of the network in the other two Mtb models. For instance,
the genome annotation information from the Institute for Genomic Research (TIGR)
was used as framework for constructing iNJ661 model and further biochemical
reactions were added from other databases including TubercuList, KEGG and the
SEED. While the GSMN-TB model was initially reconstructed by using the genome-
scale metabolic model of Streptomyces coelicolor as the template and filling
additional Mtb specific reactions from KEGG and BioCyc databases. The model
70

using one data source as a template may experience a mistake from incorrect
annotations in that data source, as the retrieved data was not double checked with
other resources in the further steps of the reconstruction process. Therefore, the
mistake will be permanently stored in the network. Here, to resolve such a problem,
HQMtb was reconstructed from the integration of five databases and all genes
included in the HQMtb were manually validated their functions with related
publications.
At first, I planned to compare all metabolic reactions among three models, but the
formats of enzymatic reactions in each Mtb model are different. The authors
identified their own compound ID to represent a compound in each enzymatic
reaction of GSMN-TB and iNJ661 models. There is no standard compound ID, for
example, a KEGG compound ID as the reference for each compound. The compound
names are ambiguous for systematic comparison via programming since the
compounds have many synonyms and their names are symbol sensitive for
computational mapping. Because the HQMtb is based on intracellular reactions and
does not include transport reactions, I decide to do the comparison only intracellular
reactions among three models in three aspects, i.e. model characteristics, gene and
E.C. number comparison. The comparison was performed automatically via the
created Visual Basic for Applications (VBA) code.
4.2.1 Model characteristics comparison
The workflow of model characteristics comparison is illustrated in Figure 4.1.
Intracellular reactions were firstly retrieved from both previous models, whereas all
reactions in HQMtb model were used for comparison. The numbers of genes, E.C.
numbers, reactions and average confidence level were calculated. I used the same
method as mentioned in iNJ661 model for calculating the average confidence level
[35] of each Mtb model to quantify the extent to which we can rely on each Mtb
model. A 3-scale confidence score has been assigned to each metabolic reaction: 4 -
experimental evidence supporting the inclusion of a reaction, 2 - sequence based
annotations, and 1 - simulation results supporting the inclusion.
71

Extract only intracellular reactionsby deleting transport reactions from the whole metabolic network
Count numbers of genes, E.C. numbers and reactions in the list of intracellular reactions
Calculate average confidence level of each Mtb model by stating confidence score to each metabolic reaction
•4 for a reaction having experimental biochemical evidence supporting the inclusion of a reaction•2 for a reaction without any support from biological evidence but obtained from sequence based
annotations•1 for a reaction without any support from either experimental evidence or gene annotation but
resulted from model simulation
Figure 4.1: The workflow for model characteristics comparison, consisting of three main steps.
In the GSMN-TB model, there are 849 reactions; however, after excluding transport
reactions only 739 intracellular reactions remain. I calculated the numbers of genes
and E.C. numbers among these intracellular reactions. These reactions were
catalyzed by 714 genes and identified with 435 E.C. numbers, 23 of which are
incomplete E.C. numbers. Each reaction was scored with the same basis as iNJ661
model in order to declare the confidence level. I found 274 reactions with
experimental evidence supporting the inclusion of reactions, 392 reactions being
associated to genes suggested by the sequence based annotation, and the other 73
reactions resulted from computational simulation.
Among the 939 reactions in the iNJ661 model, only 844 intracellular reactions are
used in the comparison. The numbers of genes, E.C. numbers were calculated and
resulted as 608 and 420, respectively. The confidence score of each reaction was
already stated in the iNJ661 model. The numbers of reactions were defined the
confidence score as 4, 2, 1 are 194, 549 and 101, respectively.
72

For the HQMtb model, all of the metabolic reactions are intracellular reactions and
also gene-associated reactions. There are 231 reactions with experimental evidence
support obtaining the confidence level 4. The other 376 reactions are annotated based
on sequence and thus have a confidence level of 2. The comparison results are
summarized in Table 4.4.
Table 4.4: Characteristics of the intracellular reactions from three Mtb models
HQMtb model GSMN-TB model iNJ661 model Numbers of genes 686 714 608 Numbers of E.C. numbers 471 435 420 Numbers of reactions 607 739 844 Ave. confidence level* 2.76 2.64 2.34 *The confidence level for each reaction is based on a score from 0 to 4, 4 being the highest level of confidence (experimental biochemical evidence supporting the inclusion of a reaction), 1 being the lowest level of confidence (inclusion of a reaction solely on modelling functionality) and 2 referring to sequence based annotations.
4.2.2 Gene comparison
I mapped all gene IDs from the three models together in order to investigate the
similarity of gene content in the models. The workflow for gene comparison follows
Figure 4.2. The result is shown as Venn diagram in Figure 4.3. I found that there
were totally 907 genes in the three models, but only 436 genes were common to all
three models. Interestingly, 68 genes were found only in the HQMtb. The additional
genes may indicate the other extensions of HQMtb reconstructed in this thesis that
are never considered in the previously published models. However, 221 genes are
absent from the HQMtb model but present in either GSMN-TB or iNJ661 model. I
investigated the functions of all these genes in order to clarify whether they should
be included in the HQMtb model or not by comparing my retrieved gene function
information from several databases and publications with gene functions stated in the
two previous Mtb models.
73

686 genes in HQMtb model
714 genes in GSMN-TB model
608 genes in iNJ661model
List of unique genes from three models
Mapping each unique gene to each Mtb model
Venn diagram representing gene comparison result
GSMN-TB model iNJ661model
HQMtb model
Combining Mtb genes from three models
Figure 4.2: The flowchart for doing gene comparison among three Mtb models
The HQMtb model (686)
GSMN-TB model (714) iNJ661 model (608)
436
104 78
127 4747
68
Figure 4.3: The Venn diagram presenting the gene comparison results among three Mtb models regarding genes catalyzing intracellular reactions.
These 221 genes were divided into three main groups as shown in the Venn diagram
in Figure 4.3: 1) 127 genes in GSMN-TB model, 2) 47 genes in both GSMN-TB and
iNJ661 models, and 3) 47 genes in iNJ661 model. Next, each group of genes was
further separated into two groups: 1) a group of genes found in the list of 1464 genes
74

of the genome database-based network but deleted during the literature-based
process, 2) a group of genes not found in the genome database-based network
because of no relationship between these genes and E.C. numbers in the five
retrieved databases. For the first group of genes, I investigated the reason for
excluding them from the HQMtb model during literature-based process and
compared my retrieved gene function information with gene functions from the
GSMN-TB and iNJ661 models. For the second group of genes, I manually searched
for their gene functions from related publications via PubMed and genome
annotation databases including KEGG, TubercuList, and BioCyc by using gene
names and their synonyms, and then compared the extracted gene functions with the
metabolic reactions from the GSMN-TB and iNJ661 models.
127 genes in the GSMN-TB model
After dividing 127 genes into two groups, the first group consists of 81 genes which
were removed from HQMtb during the literature validation process. The second
group comprises 46 genes with enzymatic reactions in the GSMN-TB model.
Among the 81 genes, there are four genes, Rv0757, Rv0410c, Rv0758 and Rv1811,
that function in signaling transduction pathways, two-component system or function
as regulatory protein and transporter gene in KEGG, TubercuList, BioCyc and
UniProt databases. Unfortunately, there are no related publications clarifying their
functions in a metabolic network. These are reasons why they were not included in
the HQMtb. In GSMN-TB model, these four genes function in either cofactor
biosynthesis pathway or energy metabolism. Rv0757 and Rv0758 are alkaline
phosphatase, whereas Rv0410c is protein kinase and Rv1811 is Mg2+ transport
ATPase. However, these reactions have not been validated with information from
any publications. Because of the inconsistency of data from various databases and no
experimental evidence validating the functions of these four genes, I proposed to
exclude them in the next version of the HQMtb model. The remaining 77 genes have
no available unique enzymatic reactions in any publications, or in the specific
genome annotation databases of Mtb (WebTB, TubercuList, BioCyc and UniProt).
75

Nonetheless, in GSMN_TB model almost all 77 genes were identified the unique
enzymatic reactions through the E.C numbers, yet only 10 of them have literature
support. Most of the other 67 genes were identified their functions with clear E.C.
numbers and the range of metabolic reactions per gene is from 1 to 27 reactions. I
compared the gene functions of these 67 genes in GSMN-TB model with metabolic
reactions in the genome database-based metabolic network and also found the
differences. For example, Rv1104 catalyzes one reaction identified with E.C.: 3.1.4.3
in the GSMN-TB model, whereas Rv1104 can catalyze five reactions identified as
E.C.: 3.1.1.- from KEGG, TubercuList, UniProt and E.C.: 3.1.1.1 from Pedant
database in the genome database-based metabolic network. Because of the
inconsistency of information among various databases and no experimental evidence
for validating the gene functions in this group, I suggest not including these 67 genes
in the next version of the HQMtb model at the moment. However, the functions of
these 67 genes would be further checked with other available resources. After
clarifying the gene functions of 81 genes by comparing my retrieved gene functions
with the metabolic reactions from the GSMN-TB model, only 10 genes, which are
supported by the literature, are sensible to include in the next version of HQMtb
model. I tried to add the metabolic reaction of these 10 genes to the current version
of HQMtb; however, I could not extract the full compound name from these
reactions even from the publications that are references of these reactions. For
example, the product of Rv1661 gene is phenolpthiocerol synthase catalyzing a
metabolic reaction in synthesis of phthiocerol and phenolphthiocerol pathway as
follows 1 PHPAA-COA + 3 malonyl-CoA + 2 (S)-methyl-malonyl-CoA ↔ 1
phenolphthiodiolone A + 5 CO2 + 5 coenzyme_A. The reaction was validated by
Constant et al. [66] in 2002; however, the full compound name of PHPAA-COA
cannot be retrieved even from the publication. Consequently, I did not include the
ten genes in the current version of the HQMtb model.
For the second group of genes, all 46 have been manually searched for their
functions from literature and also some databases; TubercuList, KEGG and BioCyc.
The gene functions between my retrieved information and metabolic reactions from
the GSMN-TB model were compared. Same as the first group of genes mentioned in
76

previous paragraph, I found the inconsistency of information between my retrieved
information and gene functions from the GSMN-TB model. Most of gene functions
of these 46 genes from my extracted information are not involved in metabolic
network of Mtb H37Rv. For example, MT1364 and MT3443 are genes of Mtb
CDC151, which is a different stain of Mtb. There are six genes not found in
TubercuList, KEGG and BioCyc databases. It may be the mistakes in these databases
resulting in inconsistency of data between my retrieved information and gene
functions in the GSMN-TB model. However, there are 35 genes in this group of
retrieved enzymatic reactions from related publications in the GSMN-TB model.
Therefore, these 35 genes in this group with their enzymatic reactions from the
GSMN-TB model are suggested to be added in the next version of the HQMtb
model. This is a limitation of my reconstruction method because the reconstruction
begins with extracting only genes obtaining E.C. numbers from various databases.
These 35 genes are the additional genes which cannot be found from my
reconstruction process because no E.C. number was assigned to these genes in all
five databases.
47 genes in both of the GSMN-TB and iNJ661 models
These 47 genes were divided into two groups: 32 genes found in the genome
database-based network but deleted during the literature-based process, and 15 genes
not found in the genome database-based network because of no linkages between
these genes and E.C. numbers in all five retrieved databases.
Among the set of 32 genes, 12 function as cytochrome genes, transporter genes or
tRNA synthetase in my retrieved data while their metabolic reactions have been
identified in both the GSMN-TB and iNJ661 models. However, these metabolic
reactions from both of the previous Mtb models are different and without biological
evidence supporting the inclusion of these reactions. Due to the inconsistent
assignment of these 12 gene functions from various databases and no biological
evidence supporting their functions, I suggest not including these 12 genes in the
next version of HQMtb model at the moment. However, the functions of these 12
77

genes should be further checked with other available resources. For the other 20
genes in this group, 10 of them were assigned their metabolic reactions from the
related publications in the iNJ661 model. Nevertheless, only 8 of them have been
reported their metabolic reactions from literature in the GSMN-TB model. When
comparing validated metabolic reactions between both of the GSMN-TB and iNJ661
models, I found the differences. For instance, Rv2381c functioning in mycobactin
synthesis pathway catalyzes only one metabolic reaction in the GSMN-TB model,
while it catalyzes two different metabolic reactions in the iNJ661 model. Therefore,
these 10 genes should be included in the next version of the HQMtb model but their
validated reactions should have been extracted directly from those publications. For
the rest of the genes in this group, 10 genes with metabolic reactions from both
previous Mtb models were compared and identified the differences. For example,
Rv0183 catalyzes one reaction with E.C.: 3.1.1.23 in the GSMN-TB model, while it
has been identified for catalyzing two different reactions with E.C.: 3.1.1.5 in the
iNJ661 model. Because of the inconsistency of gene annotation and no biological
evidence validating these gene functions, I propose not to include them in the next
version of the HQMtb model.
For the second group of genes not found in the genome database-based network
because of no linkages between these genes and E.C. numbers in the five retrieved
databases, 15 genes with metabolic reactions from both previous Mtb models were
explored and compared with my retrieved gene functions. From my retrieved
information, only 5 genes should be added in the next version of HQMtb models and
2 of them have literature supporting the inclusion of reactions. Among these 15
genes, 12 of them have been identified their metabolic reactions from literature in
both GSMN-TB and iNJ661 models. Therefore, all 15 genes in this group, 12 genes
with validated metabolic reactions from both previous Mtb models and the additional
3 genes from my retrieved information, should be included in the next version of the
HQMtb model.
78
47 genes in the iNJ661 model
Among 47 genes, 35 of them were found in the genome database-based network and
the other 12 genes were not found because of no linkages between these genes and
their E.C. numbers in the five retrieved genome annotation databases.
For the first group of genes, only one gene, Rv2793c, has been deleted during
literature-based process because it functions as tRNA synthase. However, its
metabolic reaction has been identified without any references from literature in the
iNJ661 model. Because of the lack of biological evidence validating the metabolic
reaction of Rv2793c, this gene should not be added in the next version of the HQMtb
model. For the other 34 genes in this group, I cannot find their unique metabolic
reactions, but their metabolic reactions have been reported in the iNJ661 model.
Functions for 10 of the 34 genes have been identified by retrieving information from
literature. Therefore, these 10 genes and their metabolic reactions from the iNJ661
model should be added in the next version of the HQMtb model. For the rest of the
genes, I compared the metabolic reactions of all 24 genes from the genome database-
based network with the gene functions from the iNJ661 model and also found
differences. For example, Rv0147 can catalyze only one reaction with E.C.: 1.2.1.3
in the iNJ661 model, whereas 61 metabolic reactions identified as 4 E.C. numbers;
1.2.1.-, 1.2.1.3, 1.2.1.4, and 1.2.1.5, were retrieved in the genome database-based
network. There is no biological evidence to confirm the existing metabolic reaction
of Rv0147 and the other genes in this group; therefore, I suggest not including these
24 genes in the next version of the HQMtb.
For the second group of genes (12 genes), the functions were searched for in
literature and three genome annotation databases; KEGG, TubercuList and BioCyc. I
cannot find unique metabolic reactions for all these 12 genes; however, their
metabolic reactions have been reported in the iNJ661 model. In the iNJ661 model, 6
of them were retrieved their metabolic reactions from literature; therefore, they
should be included in the next version of the HQMtb model. Unfortunately, the other
6 genes had no biological evidence supporting the inclusion of reactions in the
79

iNJ661 model. Their functions between my retrieved information and iNJ661 model
are different. Therefore, these 6 genes should not be included in the next version of
the HQMtb model.
86 new genes from either GSMN-TB or iNJ661 models should be updated in the next version of the HQMtb model
After clarifying functions of all 221 genes absent in the current version of the
HQMtb model but present in either GSMN-TB or iNJ661 models, I found three main
reasons why they are excluded in the HQMtb model: 1) the inconsistency of gene
annotation information in various data resources, 2) mistakes due to my inability to
find literature supporting the inclusion of metabolic reactions, 3) the limitation of the
reconstruction process of the HQMtb by starting the reconstruction with extracting
only genes obtaining EC numbers in several genome annotation databases.
All these 221 genes were divided into two groups. The first group consists of 148
genes, which are present in the genome database-based network but deleted during
the literature-based process. I validated the functions of all 148 genes during
literature-based process; however, I could not find their unique metabolic reactions.
Furthermore, some of them do not function in the metabolic network, for instance,
functioning as regulatory proteins, transporter genes, hypothetical proteins,
polyketide synthase, and tRNA synthetase. Nevertheless, this group of genes has
been included in either GSMN-TB or iNJ661 models. I compared gene functions
between my retrieved information and the two previous Mtb models and found
differences. The different gene annotation information results from the inconsistency
of data in various databases, for example, WebTB, TubercuList, BioCyc and UniProt
as the resources of the HQMtb, KEGG and BioCyc of GSMN-TB model and
TubercuList, KEGG, the SEED of iNJ661 model. In conclusion, only 30 genes from
148 genes obtaining literature supporting the inclusion of their enzymatic reactions
will be included in the next version of the HQMtb model.
80
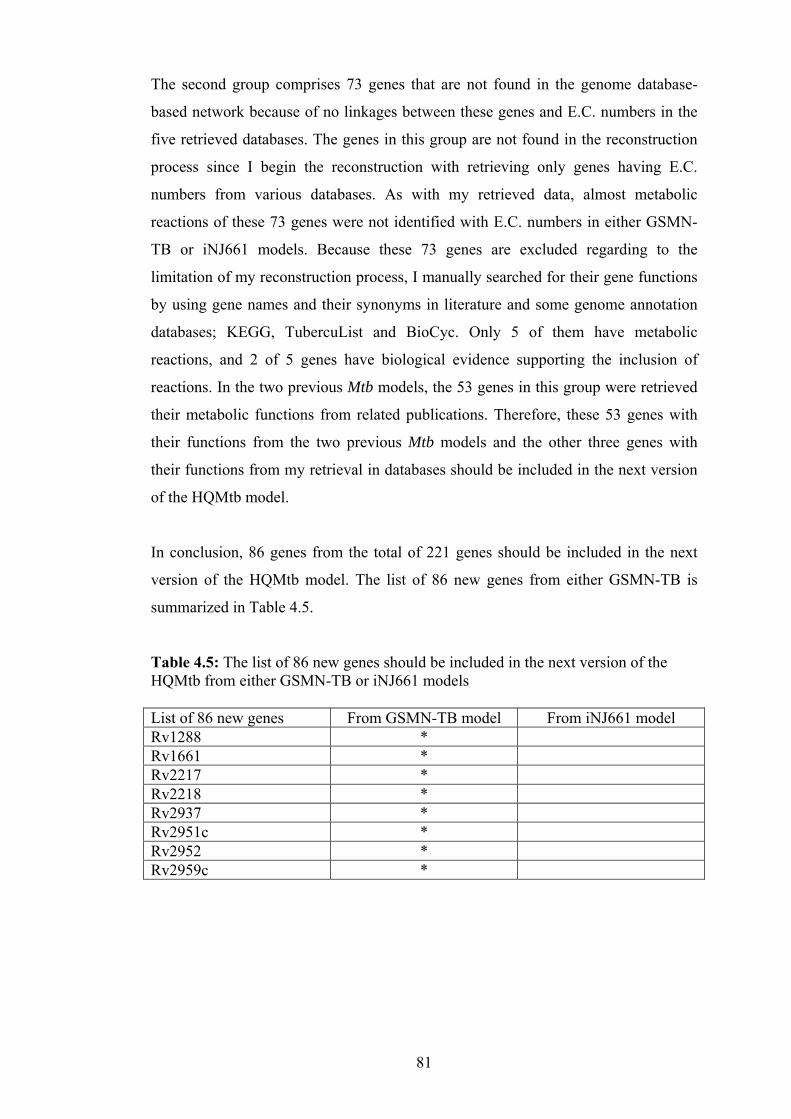
The second group comprises 73 genes that are not found in the genome database-
based network because of no linkages between these genes and E.C. numbers in the
five retrieved databases. The genes in this group are not found in the reconstruction
process since I begin the reconstruction with retrieving only genes having E.C.
numbers from various databases. As with my retrieved data, almost metabolic
reactions of these 73 genes were not identified with E.C. numbers in either GSMN-
TB or iNJ661 models. Because these 73 genes are excluded regarding to the
limitation of my reconstruction process, I manually searched for their gene functions
by using gene names and their synonyms in literature and some genome annotation
databases; KEGG, TubercuList and BioCyc. Only 5 of them have metabolic
reactions, and 2 of 5 genes have biological evidence supporting the inclusion of
reactions. In the two previous Mtb models, the 53 genes in this group were retrieved
their metabolic functions from related publications. Therefore, these 53 genes with
their functions from the two previous Mtb models and the other three genes with
their functions from my retrieval in databases should be included in the next version
of the HQMtb model.
In conclusion, 86 genes from the total of 221 genes should be included in the next
version of the HQMtb model. The list of 86 new genes from either GSMN-TB is
summarized in Table 4.5.
Table 4.5: The list of 86 new genes should be included in the next version of the HQMtb from either GSMN-TB or iNJ661 models List of 86 new genes From GSMN-TB model From iNJ661 model Rv1288 * Rv1661 * Rv2217 * Rv2218 * Rv2937 * Rv2951c * Rv2952 * Rv2959c *
81
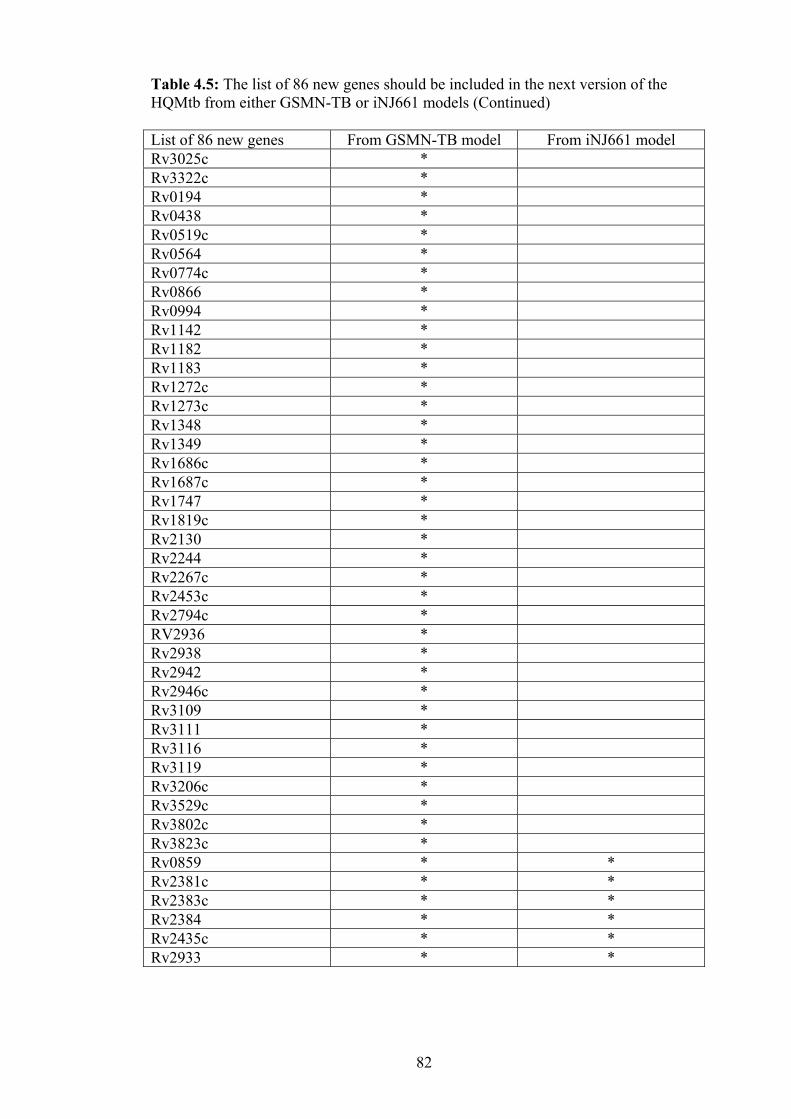
Table 4.5: The list of 86 new genes should be included in the next version of the HQMtb from either GSMN-TB or iNJ661 models (Continued) List of 86 new genes From GSMN-TB model From iNJ661 model Rv3025c * Rv3322c * Rv0194 * Rv0438 * Rv0519c * Rv0564 * Rv0774c * Rv0866 * Rv0994 * Rv1142 * Rv1182 * Rv1183 * Rv1272c * Rv1273c * Rv1348 * Rv1349 * Rv1686c * Rv1687c * Rv1747 * Rv1819c * Rv2130 * Rv2244 * Rv2267c * Rv2453c * Rv2794c * RV2936 * Rv2938 * Rv2942 * Rv2946c * Rv3109 * Rv3111 * Rv3116 * Rv3119 * Rv3206c * Rv3529c * Rv3802c * Rv3823c * Rv0859 * * Rv2381c * * Rv2383c * * Rv2384 * * Rv2435c * * Rv2933 * *
82

Table 4.5: The list of 86 new genes should be included in the next version of the HQMtb from either GSMN-TB or iNJ661 models (Continued) List of 86 new genes From GSMN-TB model From iNJ661 model Rv2947c * * Rv2958c * * Rv2962c * * Rv3792 * * Rv0098 * * Rv0417 * * Rv0423c * * Rv1082 * * Rv1170 * * Rv1594 * * Rv2380c * * Rv2382c * * Rv2931 * * Rv2932 * * Rv2934 * * Rv2935 * * Rv3800c * * Rv3806c * * Rv3818 * * Rv0373c * Rv0374c * Rv0375c * Rv0843 * Rv0855 * Rv1662 * Rv2394 * Rv2605c * Rv2928 * Rv3777 * Rv0295c * Rv1647 * Rv1663 * Rv1826 * Rv2379c * Rv3281 *
83

The 68 new genes beyond the two previous Mtb models: a contribution from the HQMtb model
Despite more than 200 genes are absent in the HQMtb model but present in the
previous Mtb models, there are 68 new genes appearing in only the HQMtb. Among
these new genes, 7 of them have been identified with 10 metabolic reactions by
directly extracting information from the related publications. For the other 61 genes,
their metabolic reactions have been retrieved from the four genome annotation
databases; TubercuList, WebTB, BioCyc and UniProt. These 61 genes catalyze 55
metabolic reactions identified with 54 E.C. numbers.
In order to report the new reactions catalyzed by the 61 new genes, I compared the
54 E.C. numbers of these 61 genes with all E.C. numbers from the two previous Mtb
models and then extracted the numbers of new metabolic reactions from these new
E.C. numbers. Even though not all metabolic reactions in both previous Mtb model
have been identified with E.C. numbers, this is a feasible way to automatically
approximate the number of new reactions as a contribution from the HQMtb model
in the context of improving the quality of Mtb metabolic network.
After comparing the 54 E.C. numbers including 9 unclear E.C. numbers with 435 and
420 E.C. numbers from GSMN-TB and iNJ661 models respectively, there are 42
E.C. numbers different from both of the previous Mtb models. The result is
summarized in Figure 4.4. These 42 new E.C. numbers linked to 42 metabolic
reactions in the HQMtb model.
84

The HQMtb model (54)
GSMN-TB model (435) iNJ661 model (420)
5
4 3
42
Figure 4.4: The Venn diagram presenting the E.C. number comparison result between 54 E.C. numbers from 61 new genes in the HQMtb model and all E.C. numbers from both of the previous Mtb models.
When combining the new reactions from two groups of genes, i.e. 7 genes –
metabolic functions supported by literature and 61 genes – metabolic functions only
suggested by the four employed databases, there are total 52 new reactions from the
68 new genes. These 52 reactions were divided into 17 metabolic pathways and one
group of isolated reactions and shown in Table 4.6.
Table 4.6: Classification of 52 new reactions from the HQMtb into pathways
17 Pathways + Isolated # reactions in each pathway Biosynthesis of steroids 3 Fatty acid metabolism 3 Glutamate metabolism 1 Glycerolipid metabolism 1 Glycolysis-Gluconeogenesis 3 Methionine metabolism 2 Nitrogen metabolism 1 Peptidoglycan biosynthesis 2 Phenylalanine, tyrosine and tryptophan biosynthesis 1 Porphyrin and chlorophyll metabolism 1 PPP 1 Purine metabolism 2 Pyruvate metabolism 2 Riboflavin metabolism 2
85

Table 4.6: Classification of 52 new reactions from the HQMtb into pathways (Continued)
17 Pathways + Isolated # reactions in each pathway TCA Cycle 3 Ubiquinone biosynthesis 2 Valine, leucine and isoleucine degradation 1 Isolated 21 Σ 52
4.2.3 E.C. number comparison
Comparison of E.C. numbers for intracellular reactions within the three Mtb models,
the E.C. numbers of each Mtb model were initially extracted from Table 4.4 and then
each set of E.C. numbers was computationally mapped. The result is shown in Figure
4.5. Altogether 641 unique E.C. numbers including 34 unclear E.C. numbers were
obtained from the three Mtb models. Only 271 E.C. numbers are common in all Mtb
models and 80 E.C. numbers are unique in the reconstructed model.
The HQMtb model (471)
GSMN-TB model (435) iNJ661 model (420)
271
77 43
80
64 23 83
Figure 4.5: The Venn diagram showing the E.C. number comparison result among three Mtb models regarding E.C. numbers of intracellular reactions.
86

4.3 Discussion and Conclusion
In this chapter I did the comparison of the HQMtb model with the two previous Mtb
models, GSMN-TB and iNJ661, after the HQMtb model was reconstructed, as
described in previous chapter. I did the comparison in three aspects; model
characteristics, gene and E.C. number comparison, so that I can demonstrate the
differences among three Mtb models, and the contributions from the HQMtb in terms
of new genes, E.C. numbers or metabolic reactions found only in the HQMtb. In
addition, the results of the comparison and the inclusion of new components into the
next version of the HQMtb model thereby improve the quality of the genome-scale
Mtb model.
From the comparison results of model characteristics, three Mtb models are different
in term of numbers of genes, E.C. numbers and reactions. All of the reactions in the
HQMtb model are intracellular gene-associated reactions, whereas 87% and 79% of
all intracellular reactions are gene associated reactions in GSMN-TB and iNJ661
model, respectively. I tried to find a way to state and evaluate the confidence level of
each Mtb model. Eventually, the method as mentioned in iNJ661 model was used to
evaluate the confidence level of models. The HQMtb obtains the highest confidence
level followed by GSMN-TB and iNJ661 models. The strength of my model is
shown the highest quality among Mtb metabolic models.
Moreover, 68 new genes and 80 new E.C. numbers were found only in the HQMtb
from gene and E.C. comparison results. These contributions lead to fulfill the
completeness of Mtb metabolic model beyond the two previous Mtb models by
linking to approximately 52 new metabolic reactions in several metabolic pathways,
for example biosynthesis of steroids, fatty acid metabolism, TCA cycle, etc.
Even though the HQMtb shows some strong points in comparison with the two
previous Mtb models, there are some additional genes from either GSMN-TB or
iNJ661 models that should be included in the next version of the HQMtb for
improving the completeness and quality of the Mtb metabolic model. There are 221
87

genes absent in the HQMtb but present in either GSMN-TB or iNJ661 models;
however, only 86 of them should be added in the next version of the HQMtb after
validating these gene functions with literature. The different annotation of each Mtb
gene in various genome annotation databases may occur from the inconsistency
among databases. Therefore, only 86 genes from 221 genes obtaining literature
validating their metabolic functions should be included.
A difficulty in the computational integration of additional genes and their metabolic
reactions into the HQMtb lies on the non-standard format employed to represent the
enzymatic reactions in an individual model. The enzymatic reactions in each Mtb
model consist of their own compound name. Standard compound IDs were not
identified to compounds in either GSMN-TB or iNJ661 model. Therefore, it will be
useful for reconstructing any further specific genome-scale metabolic networks of
living organisms, not only for Mtb, if we have the powerful database collecting
compound names and their synonyms with identified standard IDs as the reference
for all biochemical compounds in living organisms. Researchers from different part
of the world can work at the same standard by using same compound IDs
representing same biochemical compounds, which means we can easily exchange,
compare or improve the previous genome-scale metabolic networks of any
organisms.
88

CHAPTER 5
Comparison of the Mycobacterum
tuberculosis and Human Metabolic Networks in terms of Protein Signatures: An Application for Drug Targets Identification
Once a genome-scale metabolic network of an organism is completely reconstructed,
several computational and mathematical approaches can be used to analyze their
structural properties, such as connectivity of the networks in terms of metabolite or
metabolic reaction linkages, and to simulate the in silico cell under different genetic
or physiological conditions. The results may be used for the development of
metabolic engineering strategies for the construction of strains with desired and
improved properties or for finding the proper environmental conditions for culturing
any organisms [27]. Interestingly, for disease-causing pathogens their genome-scale
metabolic networks have been applied to propose drug targets in drug discovery.
There are many criteria for identifying gene products of a pathogen as a therapeutic
target; however, all of them are based on two broad types of information: a) the role
of the gene product in the pathogen, b) the likelihood of being able to develop a
compound that targets the gene product. For the role of potential targets, the
knowledge of orthology, particularly of whether the gene product lacks an
orthologue in humans, is crucial for minimizing the potential adverse events. For the
second type of information, the potential compound for being a drug indicates how
closed of such a substance to be a successful drug modulating the targets. Structural
information of the molecular targets or proteins aids drug design and development.
Additionally, the druggability of a given target in a pathogen can be predicted on the
89

basis of factors such as the physicochemical nature of small-molecule binding sites
on the target, and the availability of drug-like molecules that target related proteins in
other organisms. For example, the drug targets against Plasmodium falciparum, the
causing agent of malaria in humans, have features like: the lack of orthologous genes
in mammals, known protein structures, assayable (enzyme as gene product), and
essential for viability [67].
Enzymes are attractive as drug targets because of their potential for assayability and
good druggability precedents. Several enzymes in metabolic pathways of Mtb were
proposed as targets for the development of antimycobacterial agents by
experimentalists, including enzymes in the following pathways: histidine
biosynthesis, menaquinone biosynthesis, tryptophan biosynthesis, arginine
biosynthesis, and shikimate pathway [41, 43-46]. Most of them had been shown to be
essential for the viability and lack of orthologs in humans. Moreover, targets of some
current first-line TB drugs, which are isoniazid (INH), pyrazinamide (PZA),
ethambutol (EMB), are enzymatic genes in the following pathways: fatty acid
biosynthesis, arabinogalactam and peptidoglycan biosynthesis [68, 69].
Therefore, in this chapter the HQMtb model is applied to propose new drug target
candidates against TB via new method. One criterion for identification of drug
targets mentioned above is the absence of human orthologs, so that a drug only
targets an Mtb protein without affecting human protein to avoid side effects.
Therefore, the Mtb proteins used as drug targets should have different structures from
those human proteins. Here, I apply the InterPro accession numbers from InterPro
database to represent the structural features of a protein. The protein signatures
belonging to Mtb genes in the HQMtb model were compared with all protein
signatures of human in EHMN, a high quality human metabolic network. The details
about EHMN network and InterPro database are mentioned in section 5.1 and 5.2,
respectively. After that, the preliminary drug targets, of which protein signatures are
unique in Mtb, were mapped with the list of essential genes required by Mtb for
optimal growth from transposon site hybridization (TraSH) experiment (see in
section 5.3). The complete methodology for drug target identification is described in
90

section 5.4. Next, new drug targets are proposed and reported in section 5.5.
Furthermore, the proposed drug targets are checked to see if they form protein
complexes with other proteins. Discussion and conclusions about the accuracy of the
new proposed method when comparing the proposed drug targets with other current
validated drug targets and proposed drug targets from Jamshidi and Palsson are
illustrated in section 5.6.
5.1 Edinburgh Human Metabolic Network (EHMN)
Edinburgh human metabolic network (EHMN), reconstructed by Ma et al. in 2007, is
a high quality human metabolic network with more than 2000 metabolic genes and
nearly 3000 metabolic reactions which were reorganized into about 70 pathways
according to their functional relationships [32]. The network properties are shown in
Table 5.1.
Table 5.1: Characteristics of the EHMN
Genes: 2322 Intracellular reactions: 2823 Metabolites: 2671 E.C. numbers: 827 (excluding unclear EC numbers)
In the reconstruction process, firstly the network was reconstructed solely based on
human gene annotation information from available online databases. The resulting
network, called “genome-based network”, is thus comparable to that obtained from
the existing automated tools for genome-scale metabolic network reconstruction.
Sources of human enzyme annotation are KEGG, UniProt and HUGO Gene
Nomenclature (HGNC) databases from which human metabolic genes and their E.C.
numbers were retrieved. All human genes with clear and unclear E.C. numbers such
as 1.-.-.- were linked to their catalytic reactions via the relation between E.C.
numbers and enzymatic reactions from the KEGG ligand database, if genes have
clear E.C. numbers. For the genes with unclear E.C. numbers, their enzymatic
reactions were retrieved from the UniProt database and literature. As yet, the E.C.
91

number-reaction relationships obtained were not restricted to human. The following
verification of such relationships in human against literature is critical for providing
a human-specific network. All of literature-based information was from EMP
database and literature. The main processes for the reconstruction of EHMN are
summarized in Figure 5.1.
Figure 5.1: Processes for reconstruction of the high-quality human metabolic network (EHMN) [32].
The EHMN is better than the other two available genome-scale human metabolic
networks: a) HumanCyc, a computational reconstructed network of human
metabolism, b) Homo Sapiens Recon 1, a comprehensive literature-based genome-
scale metabolic network, as it was reconstructed based on information from both
genome annotation databases and publications, validating the inclusion of metabolic
reactions. Moreover, various databases were used to form a framework for
reconstruction of EHMN, whereas Homo Sapiens Recon 1 was mainly reconstructed
based on only one database, EntrezGene database. Importantly in terms of gene and
compound contents, EHMN covers more data than Homo Sapiens Recon 1.
92

Because EHMN is one of the most updated genome-scale human metabolic
networks, I compare the HQMtb with EHMN and apply the results for drug targets
identification. Moreover, EHMN is reconstructed by my research group; I can extract
the new released version in advance of its publication.
5.2 Protein Databases
One of the two criteria in the proposed approach for targeting Mtb genes as drug
targets is that their gene products lack homologs in humans. The protein products of
drug target genes should have different signatures from human proteins in order to
avoid adverse events. The protein signatures, such as protein families, domains and
functional sites, of Mtb and human proteins were compared with each other. In order
to obtain the protein signatures belonging to Mtb and human genes, their gene
products should be defined as protein IDs first. These can be retrieved from UniProt
database. Then, the protein IDs will link to all protein signatures from the InterPro
database. Therefore, in this section I will describe about the two protein databases in
more detail.
5.2.1 UniProt database
UniProt, the Universal Protein Resource, is the central resource for storing and
interconnecting information from large and disparate sources, and the most
comprehensive catalogue of protein sequence and functional annotation [20]. It is
established by the UniProt Consortium consisting of groups from the European
Bioinformatics Institute (EBI), the Protein Information Resource (PIR) and the Swiss
Institute of Bioinformatics (SIB). UniProt is updated and distributed every three
weeks and can be freely and easily accessed online for searches or downloaded at
www.uniprot.org. There are four major components in UniProt database, each of
which is optimized for different uses: the UniProt Archive (UniParc), the UniProt
Knowledgebase (UniProtKB), the UniProt Reference Clusters (UniRef) and the
UniProt Metagenomic and Environmental Sequence Database (UniMES).
93

UniProtKB is an expertly curated database, a central access point for integrated
protein information with cross-references to multiple sources. Statistics for
UniProtKB, release 15.0 March 24, 2009 contain UniProtKB/Swiss-Prot release 57.0
and UniProtKB/TrEMBL release 40.0. For UniProtKB/Swiss-Prot, it comprises
428650 sequence entries, containing 154416236 amino acids abstracted from 177584
references. Total number of species represented in this release is 11669 including
Mycobacterium tuberculosis coding for 1462 entries. On the other hand, there are
7537442 sequence entries comprising 2459135421 amino acids in
UniProtKB/TrEMBL. The total number of species stored in this release is 193405.
In order to identify a single contiguous amino acid sequence of any protein in
UniProtKB, the entry name and accession number are required. The entry name is
based on the name of the protein and species, for example, DNAA_MYCTU
referring to chromosomal replication initiator protein dnaA of Mycobacterium
tuberculosis. Nevertheless, the entry name is not stable like accession number, such
as P49993, a primary accession number of DNAA_MYCTU. Each protein entry can
have more than one accession number if it has been modified by merging or splitting
the protein sequence. However, the first accession number is still there and the
authors will add 2nd, 3rd accession number to the entry. Nevertheless, in order to cite I
use the first accession number as a unique ID to represent a protein. Not only will I
use accession number for searching protein information in UniProt database, but I
also use it as a key for retrieving more information from another cross-reference
database such as InterPro database.
5.2.2 InterPro database
InterPro, the Integrative Protein Signature database, is an integrated resource for
protein signatures, i.e. protein families, domains, repeats and functional sites: post-
translation modification site, active site, binding site and conserved site from ten
member databases including Gene3D, PANTHER, Pfam, PIRSF, PRINTS, ProDom
PROSITE, SMART, SUPERFAMILT and TIGRFAMs [21]. It was founded ten
years ago when the PROSITE, PRINTS, Pfam and ProDom databases formed a
94

consortium to combine the predictive protein signatures that they individually
produced into a single resource. After that six other member databases have also
joined and then their data has been merged: SMART, TIGRFAMs, PIRSF,
SUPERFAMILY, PANTHER and Gene3D.
The protein signatures of each member database are created using different but
complementary methods. When different signatures from diverse source databases
match the same set of proteins in the same region on the sequence, they are presumed
to be describing the same functional family, domain or site and placed into a single
InterPro entry by a curator, the InterProScan software. On the other hand, if a
signature only matches a subset of proteins compared to another signature, it is likely
that this signature is more functionally or taxonomically specific than the other. In
this case, the signatures would be supposed to be related, and the signature matching
the subset would be termed a child, whereas the other signature is its parent.
Besides identifying the matched protein signatures with InterPro entries, the entries
are classified according to the type of protein signatures. Each InterPro entry is
identified as one of the seven categories; family, domain, repeat, post-translation
modification (PTM) site, active site, binding site and conserved site. The conserved
sites cover any PROSITE patterns which are not a PTM or do not have a binding or
catalytic activity but are conserved across members of a protein family. Every
InterPro entry obtains an accession number in the format of IPRxxxxxx, where x is
digit. This provides a stable way of identifying InterPro entries and allows
unambiguous citation of database entries.
InterPro curator continues to integrate new signatures from member databases into
entries. The latest public release (V18.0) covers 79.8% of UniProtKB (V14.1) and
comprises 16549 entries. The coverage of various sequence databases by InterPro
signatures is illustrated in Table 5.2.
95
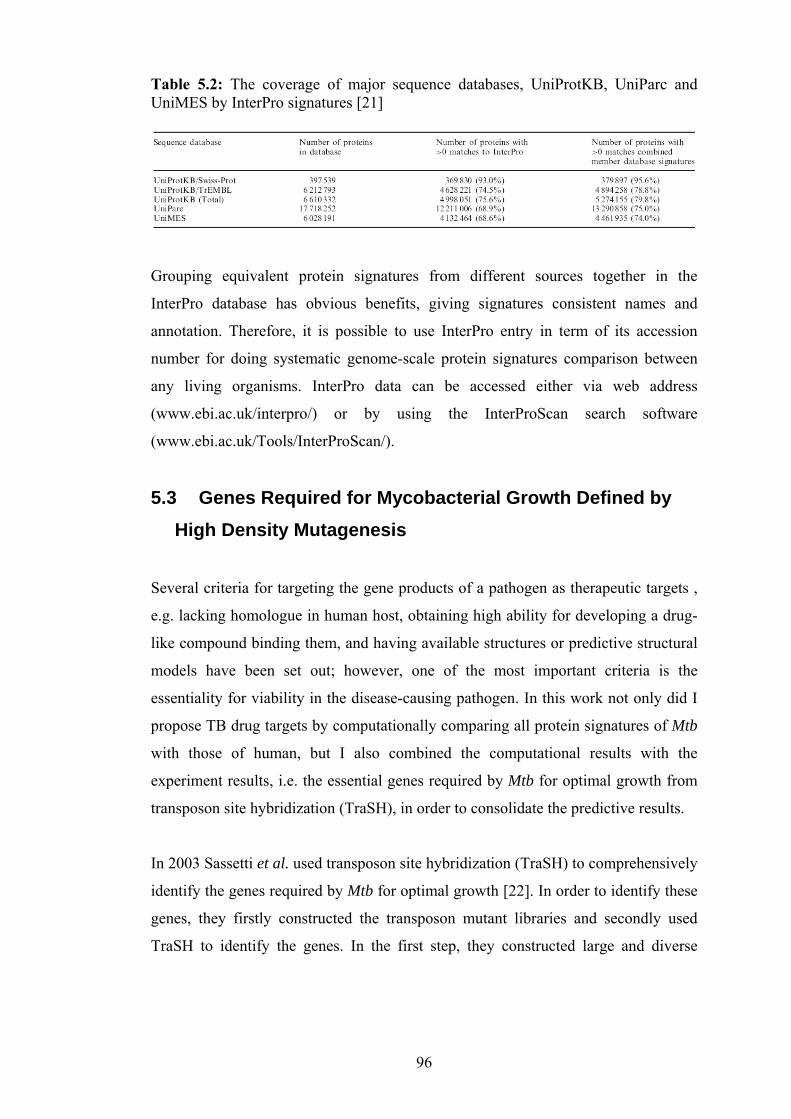
Table 5.2: The coverage of major sequence databases, UniProtKB, UniParc and UniMES by InterPro signatures [21]
Grouping equivalent protein signatures from different sources together in the
InterPro database has obvious benefits, giving signatures consistent names and
annotation. Therefore, it is possible to use InterPro entry in term of its accession
number for doing systematic genome-scale protein signatures comparison between
any living organisms. InterPro data can be accessed either via web address
(www.ebi.ac.uk/interpro/) or by using the InterProScan search software
(www.ebi.ac.uk/Tools/InterProScan/).
5.3 Genes Required for Mycobacterial Growth Defined by High Density Mutagenesis
Several criteria for targeting the gene products of a pathogen as therapeutic targets ,
e.g. lacking homologue in human host, obtaining high ability for developing a drug-
like compound binding them, and having available structures or predictive structural
models have been set out; however, one of the most important criteria is the
essentiality for viability in the disease-causing pathogen. In this work not only did I
propose TB drug targets by computationally comparing all protein signatures of Mtb
with those of human, but I also combined the computational results with the
experiment results, i.e. the essential genes required by Mtb for optimal growth from
transposon site hybridization (TraSH), in order to consolidate the predictive results.
In 2003 Sassetti et al. used transposon site hybridization (TraSH) to comprehensively
identify the genes required by Mtb for optimal growth [22]. In order to identify these
genes, they firstly constructed the transposon mutant libraries and secondly used
TraSH to identify the genes. In the first step, they constructed large and diverse
96

libraries of transposon insertion mutants in Mtb H37Rv and Mycobacterim bovis
BCG Pasteur, a closely related vaccine strain, using a Himar 1-based transposon
delivered by a transducing bacteriophage. After mutagenesis, bacteria were plated on
defined media and let them grow. Each surviving mutant strain contained one copy
of the transposon integrated into the chromosome; however, insertions in genes that
are required for growth or survival should be significantly under-represented in the
population of mutants. In the second step, identification of genes required in vitro,
TraSH can be used to analyze large pools of mutants by using a DNA microarray to
detect genes that contain insertions. Figure 5.2 shows the protocol used to identify
genes required for optimal growth. Finally, they reported the list of 614 essential
genes and 2567 non-essential genes for optimal growth of Mtb on their defined
media.
Figure 5.2: The protocol for identifying genes required for optimal growth [22]. After mutagenesis, each mutant holds a single transposon insertion (triangles), and the library contains mutations in each gene (lettered boxes) in the genome. After a growth phase, mutants harboring insertions in genes required for survival (gray boxes) are lost from library. TraSH probe is generated from the selected library, and this “insert probe” consists only of sequences complementary to genes containing insertions in the selected library. Randomly, labeled chromosomal DNA (genomic probe) will hybridize to every gene represented on the array. Spots that hybridize to the genomic probe, but not the insertion probe represent genes required for growth.
97
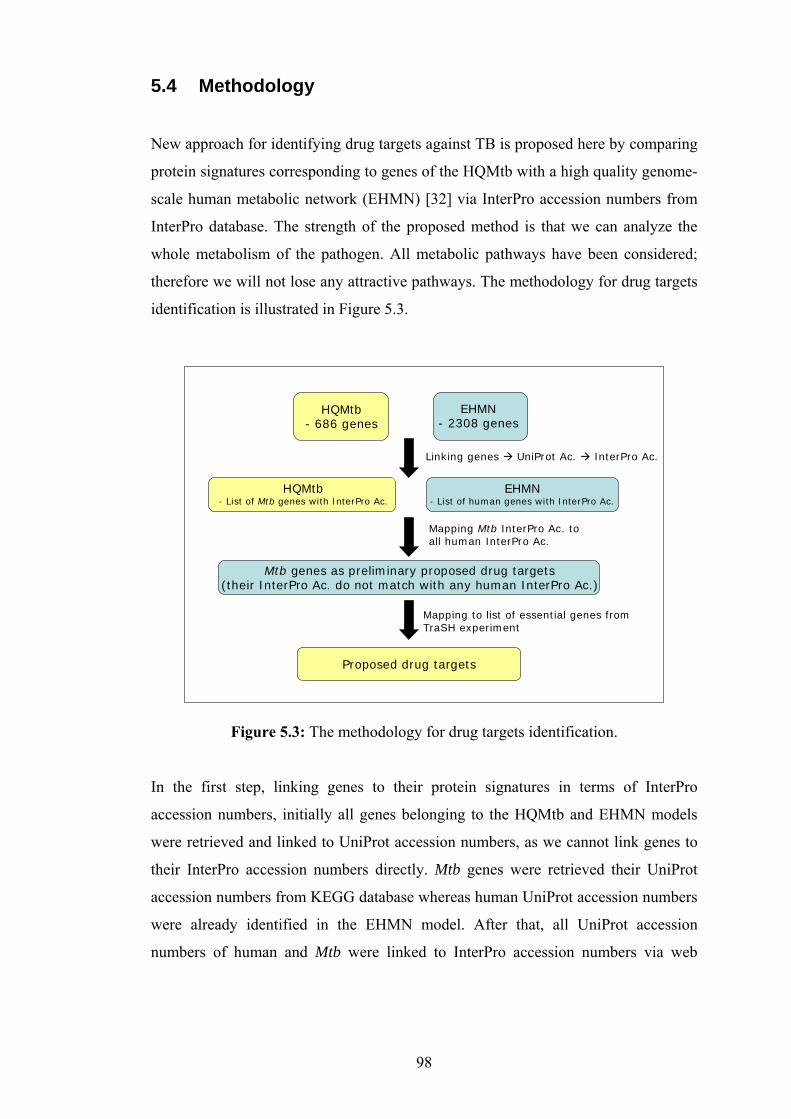
5.4 Methodology
New approach for identifying drug targets against TB is proposed here by comparing
protein signatures corresponding to genes of the HQMtb with a high quality genome-
scale human metabolic network (EHMN) [32] via InterPro accession numbers from
InterPro database. The strength of the proposed method is that we can analyze the
whole metabolism of the pathogen. All metabolic pathways have been considered;
therefore we will not lose any attractive pathways. The methodology for drug targets
identification is illustrated in Figure 5.3.
HQMtb- 686 genes
EHMN- 2308 genes
Linking genes UniProt Ac. InterPro Ac.
HQMtb- List of Mtb genes with InterPro Ac.
EHMN- List of human genes with InterPro Ac.
Mapping Mtb InterPro Ac. to all human InterPro Ac.
Mtb genes as preliminary proposed drug targets(their InterPro Ac. do not match with any human InterPro Ac.)
Mapping to list of essential genes from TraSH experiment
Proposed drug targets
Figure 5.3: The methodology for drug targets identification.
In the first step, linking genes to their protein signatures in terms of InterPro
accession numbers, initially all genes belonging to the HQMtb and EHMN models
were retrieved and linked to UniProt accession numbers, as we cannot link genes to
their InterPro accession numbers directly. Mtb genes were retrieved their UniProt
accession numbers from KEGG database whereas human UniProt accession numbers
were already identified in the EHMN model. After that, all UniProt accession
numbers of human and Mtb were linked to InterPro accession numbers via web
98

services of European Bioinformatics Institute (EBI), http://srs.ebi.ac.uk, release
7.1.3.2. Finally all genes with InterPro accession numbers were obtained for doing
the protein signatures comparison between Mtb and human.
For the second step, comparison of Mtb InterPro accession numbers with human, I
wrote the Visual Basic for Applications (VBA) code for doing systematic
comparison between two groups of InterPro accession numbers. The unique InterPro
accession numbers of each Mtb gene were counted, and then each of them was
compared with the whole set of human InterPro accession numbers. Next, unmatched
InterPro accession numbers per Mtb gene were counted again. The Mtb genes, of
which the amount of unmatched InterPro accession numbers are same as numbers of
all InterPro accession numbers, will be proposed as preliminary proposed drug
targets.
In the last step of the methodology, proposed drug targets were mapped with a list of
614 essential genes required by Mtb for optimal growth. Finally, the drug targets
were proposed based on two criteria: a) their protein signatures are unique in Mtb; b)
they are essential genes reported from the TraSH experiment.
5.5 Results 5.5.1 Linking Mtb and human genes to their protein signatures in term
of InterPro accession numbers
Since there is no direct linkage between genes and their InterPro accession numbers,
all genes were linked to UniProt accession numbers first. All UniProt accession
numbers of each Mtb gene were retrieved from KEGG database, while human
UniProt accession numbers were already stored in EHMN model. After that the
relation between UniProt accession numbers and InterPro accession numbers of Mtb
and human were retrieved from web services of EBI.
99

Retrieved Mtb UniProt accession numbers results
The data were downloaded from KEGG database following this URL,
fttp://ftp.genome/pub/keg/genes/organism/mtu/mtu_uniprot.list. The results show
that there are 3897 genes with their UniProt accession numbers. The relation shows
only one UniProt accession number per Mtb gene; however, I also found that
different genes have the same UniProt accession number due to the reason of
merging genes.
Retrieved UniProt-InterPro accession number relationship results
The relationship between UniProt accession numbers and InterPro accession
numbers of Mtb and human were extracted from the web services of EBI,
http://srs.ebi.ac.uk. The data in SRS release 7.1.3.2 were downloaded by creating
own URLs since directly downloading from their web interface did not provide the
consistent amount of data. These URLs, http://srs.ebi.ac.uk/srsbin/cgi-bin/wgetz?-
id+5YNN41WN1G1+-view+UNIPROT+-page+saveQResult+-ascii+-e+-bv+5801+-
lv+100+[uniprot-txi:1773] and http://srs.ebi.ac.uk/srsbin/cgi-bin/wgetz?-
id+5YNN41WN1G1+-view+UNIPROT+-page+saveQResult+-ascii+-e+-bv+5801+-
lv+100+[uniprot-txi:9606], were used to download data of Mtb and human,
respectively. Figure 5.4 shows the example of retrieved data. Finally for Mtb, I
obtain 5868 UniProt entries; however, 4202 of them provide at lest one InterPro
accession number per entry. On the other hand, 76122 UniProt entries were retrieved
for human but only 52806 of them have InterPro accession numbers.
100
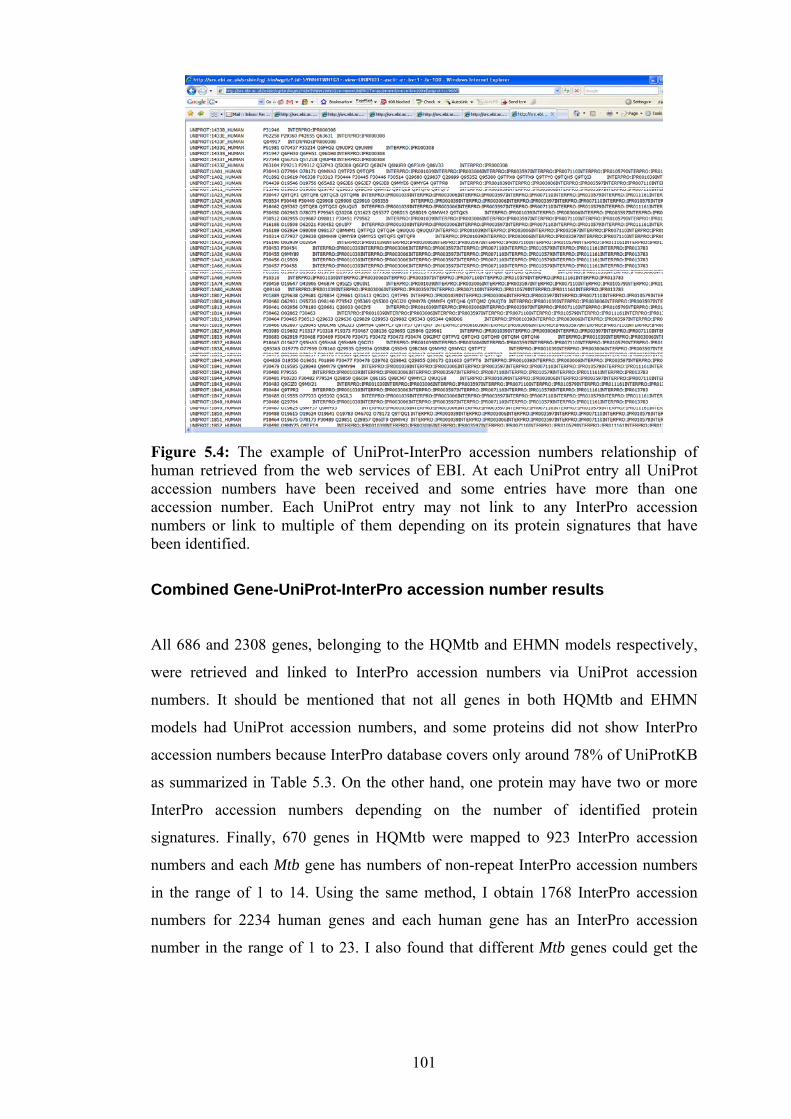
Figure 5.4: The example of UniProt-InterPro accession numbers relationship of human retrieved from the web services of EBI. At each UniProt entry all UniProt accession numbers have been received and some entries have more than one accession number. Each UniProt entry may not link to any InterPro accession numbers or link to multiple of them depending on its protein signatures that have been identified.
Combined Gene-UniProt-InterPro accession number results
All 686 and 2308 genes, belonging to the HQMtb and EHMN models respectively,
were retrieved and linked to InterPro accession numbers via UniProt accession
numbers. It should be mentioned that not all genes in both HQMtb and EHMN
models had UniProt accession numbers, and some proteins did not show InterPro
accession numbers because InterPro database covers only around 78% of UniProtKB
as summarized in Table 5.3. On the other hand, one protein may have two or more
InterPro accession numbers depending on the number of identified protein
signatures. Finally, 670 genes in HQMtb were mapped to 923 InterPro accession
numbers and each Mtb gene has numbers of non-repeat InterPro accession numbers
in the range of 1 to 14. Using the same method, I obtain 1768 InterPro accession
numbers for 2234 human genes and each human gene has an InterPro accession
number in the range of 1 to 23. I also found that different Mtb genes could get the
101

same InterPro accession number, for example Rv0819 and Rv0262c have the same
InterPro accession number, IPR000182.
Table 5.3: Characteristics of combined Gene-UniProt-InterPro accession number results of HQMtb and EHMN models Model Numbers of genes Numbers of genes
with UniProt Ac. Numbers of genes with InterPro Ac. via UniProt Ac.
HQMtb 686 685 670 EHMN 2308 2279 2234
5.5.2 Comparing protein signatures between Mtb and human via InterPro accession numbers
Based on this method, the InterPro accession numbers of 670 Mtb genes in the Table
5.3 were mapped to 1768 InterPro accession numbers of 2234 human genes. I wrote
the Visual Basic for Applications (VBA) code for doing this systematic comparison.
Eventually, I found 133 Mtb genes, of which all InterPro accession numbers do not
match any human InterPro accession numbers, from the total of 670 genes. The list
of these 133 genes is proposed as preliminary drug targets against TB.
5.5.3 Mapping the list of preliminary drug targets to essential genes from TraSH experiment
The 133 genes were then compared with the 614 essential genes and 2567 non-
essential genes reported from transposon site hybridization (TraSH) experiment by
Sassetti et al. [22]. Consequently, these 133 genes were separated into three groups:
a) 42 of them are essential genes, b) 69 of them are non-essential genes, and c) the
other 22 unclassified genes. A subset of 42 essential genes are proposed to be drug
targets against TB based on both dry and wet experiments. The list of all 42 proposed
drug targets and their functional pathways are shown in Table 5.4.
102

Table 5.4: List of 42 proposed drug targets and their functional pathways.
42 Genes PathwayRv0553 Ubiquinone biosynthesisRv2178c Phenylalanine, tyrosine and tryptophan biosynthesisRv2537c Phenylalanine, tyrosine and tryptophan biosynthesisRv2538c Phenylalanine, tyrosine and tryptophan biosynthesisRv2540c Phenylalanine, tyrosine and tryptophan biosynthesisRv2552c Phenylalanine, tyrosine and tryptophan biosynthesisRv3423c Alanine and aspartate metabolismRv3581c Biosynthesis of steroidsRv3582c Biosynthesis of steroidsRv0189c Valine, leucine and isoleucine biosynthesisRv0422c Thiamine metabolismRv1026 Purine metabolismRv1133c Methionine metabolismRv1315 Aminosugars metabolismRv1599 Histidine metabolismRv1601 Histidine metabolismRv1606 Histidine metabolismRv1652 Urea cycle and metabolism of amino groupsRv2121c Histidine metabolismRv2122c Histidine metabolismRv2361c Terpenoid biosynthesisRv2391 Nitrogen metabolismRv2726c Lysine biosynthesisRv2754c Pyrimidine metabolismRv3001c Valine, leucine and isoleucine biosynthesisRv3490 Starch and sucrose metabolismRv3607c Folate biosynthesisRv3708c Glycine, serine and threonine metabolismRv0558 Ubiquinone biosynthesisRv1653 Urea cycle and metabolism of amino groupsRv2611c Lipopolysaccharide biosynthesisRv1005c Folate biosynthesisRv1416 Riboflavin metabolismRv1622c Oxidative phosphorylationRv3793 Arabinogalactan biosynthesisRv3795 Arabinogalactan biosynthesisRv2193 Oxidative phosphorylationRv3043c Oxidative phosphorylationRv1609 Phenylalanine, tyrosine and tryptophan biosynthesisRv2386c Biosynthesis of siderophore group nonribosomal peptidesRv1284 Nitrogen metabolismRv1415 Riboflavin metabolism
103

5.5.4 Checking the protein complex and protein similarity to all human proteins of all 42 proposed drug targets
Enzyme complex or isoenzyme of 42 proposed drug targets
We think that if the proposed targets can form protein complexes or have isoenzyme,
blocking only these targets will not be enough for complete inhibition their functions.
Therefore, if targets can neither form complexes nor have isoenzyme, it will be easier
for applying the drug to block them. I checked all 42 proposed drug targets to see if
they form protein complex or have isoenzymes using both GSMN-TB and iNJ661
models and literature. Finally, I found nine gene products forming protein complexes
with other gene products and two having isoenzymes as shown in Table 5.5.
104

Table 5.5: List of 42 proposed drug targets with forming protein complex or having isoenzyme results 42 Genes Pathway Protein complex or isoenzyme resultRv0553 Ubiquinone biosynthesis No complexRv2178c Phenylalanine, tyrosine and tryptophan biosynthesis No complexRv2537c Phenylalanine, tyrosine and tryptophan biosynthesis No complexRv2538c Phenylalanine, tyrosine and tryptophan biosynthesis No complexRv2540c Phenylalanine, tyrosine and tryptophan biosynthesis No complexRv2552c Phenylalanine, tyrosine and tryptophan biosynthesis No complexRv3423c Alanine and aspartate metabolism No complexRv3581c Biosynthesis of steroids No complexRv3582c Biosynthesis of steroids No complexRv0189c Valine, leucine and isoleucine biosynthesis No complexRv0422c Thiamine metabolism No complexRv1026 Purine metabolism No complexRv1133c Methionine metabolism No complexRv1315 Aminosugars metabolism No complexRv1599 Histidine metabolism No complexRv1601 Histidine metabolism No complexRv1606 Histidine metabolism No complexRv1652 Urea cycle and metabolism of amino groups No complexRv2121c Histidine metabolism No complexRv2122c Histidine metabolism No complexRv2361c Terpenoid biosynthesis No complexRv2391 Nitrogen metabolism No complexRv2726c Lysine biosynthesis No complexRv2754c Pyrimidine metabolism No complexRv3001c Valine, leucine and isoleucine biosynthesis No complexRv3490 Starch and sucrose metabolism No complexRv3607c Folate biosynthesis No complexRv3708c Glycine, serine and threonine metabolism No complexRv0558 Ubiquinone biosynthesis No complexRv1653 Urea cycle and metabolism of amino groups No complexRv2611c Lipopolysaccharide biosynthesis No complexRv1005c Folate biosynthesis Complex (Rv1005c+Rv0013)Rv1416 Riboflavin metabolism Complex (Rv1416+Rv1412)Rv1622c Oxidative phosphorylation Complex (Rv1623c+Rv1622c)Rv3793 Arabinogalactan biosynthesis Complex (Rv3794+Rv3793+Rv3795)Rv3795 Arabinogalactan biosynthesis ComplexRv2193 Oxidative phosphorylation ComplexRv3043c Oxidative phosphorylation ComplexRv1609 Phenylalanine, tyrosine and tryptophan biosynthesis Complex (Rv1609+Rv0013)Rv2386c Biosynthesis of siderophore group nonribosomal peptides Complex or IsoenzymeRv1284 Nitrogen metabolism IsoenzymeRv1415 Riboflavin metabolism Isoenzyme (Rv1415 or Rv1940)
Protein similarity between 42 proposed drug targets and all human proteins
To confirm this result, I also did the protein sequence similarity comparison with all
human proteins via KEGG Sequence Similarity Database (SSDB) for the 42 drug
target candidates. SSDB holds information about amino acid sequence similarities
among all protein-coding genes in the complete genome, which is computationally
generated from the GENES database in KEGG. All possible pair wise genome
105

comparisons are presented by the SSEARCH program, and the gene pairs with the
Smith-Waterman similarity score of 100 or more are entered in SSDB, together with
the information about best hits and bidirectional best hits (best-best hits).
At the individual search for similar human protein-coding genes with the 42
proposed drug targets in KEGG SSDB, I chose comparison method as “Forward best
hits”. This means that Mtb gene is compared against all genes in selected organism
group such as all organisms, eukaryotes, prokaryotes, bacteria, etc. and similar genes
in term of amino acid sequence of gene product are resulted as top-scoring. I chose to
search against all organisms in the database including human and set the threshold as
100. The results of the proposed drug targets with human protein similarity are
summed up in Table 5.6. The results show that eight of them have no similarity to
all human proteins and the other 34 Mtb genes have similarity with human proteins
in the range of 19% to 44%. Based on sequence similarity, the eight Mtb genes,
Rv1026, Rv1284, Rv1601, Rv1606, Rv2122c, Rv2537c, Rv3581c, and Rv3607c,
have the highest score of the interest for testing with the wet experiment first.
106

Table 5.6: List of 42 proposed drug targets with human protein similarity Genes Pathway % Identity with human protein similar human gene
Rv1415 Riboflavin metabolism 19.20 29894Rv2178c Phenylalanine, tyrosine and tryptophan biosynthesis 22.20 11063Rv1315 Aminosugars metabolism 23.00 57060Rv1653 Urea cycle and metabolism of amino groups 23.50 114782Rv2121c Histidine metabolism 24.00 60678Rv1599 Histidine metabolism 24.10 647546Rv1133c Methionine metabolism 24.40 23082Rv2540c Phenylalanine, tyrosine and tryptophan biosynthesis 24.70 147645Rv2611c Lipopolysaccharide biosynthesis 24.70 4627Rv2538c Phenylalanine, tyrosine and tryptophan biosynthesis 24.90 123872Rv1005c Folate biosynthesis 25.30 29924Rv0189c Valine, leucine and isoleucine biosynthesis 25.50 729390Rv3423c Alanine and aspartate metabolism 25.50 387750Rv2754c Pyrimidine metabolism 25.60 7273Rv2391 Nitrogen metabolism 25.70 51144Rv2726c Lysine biosynthesis 25.80 646031Rv3793 Arabinogalactan biosynthesis 25.90 730245Rv1609 Phenylalanine, tyrosine and tryptophan biosynthesis 26.60 8837Rv0422c Thiamine metabolism 27.00 8566Rv3708c Glycine, serine and threonine metabolism 27.30 2597Rv0553 Ubiquinone biosynthesis 27.70 55556Rv1622c Oxidative phosphorylation 27.80 29988Rv2386c Biosynthesis of siderophore group nonribosomal peptides 28.10 9651Rv1416 Riboflavin metabolism 28.40 5590Rv3001c Valine, leucine and isoleucine biosynthesis 30.30 55593Rv3490 Starch and sucrose metabolism 30.40 80341Rv3582c Biosynthesis of steroids 31.00 729920Rv2552c Phenylalanine, tyrosine and tryptophan biosynthesis 32.10 2306Rv3795 Arabinogalactan biosynthesis 32.70 1289Rv0558 Ubiquinone biosynthesis 33.60 84274Rv2361c Terpenoid biosynthesis 37.30 79947Rv2193 Oxidative phosphorylation 39.20 4514Rv3043c Oxidative phosphorylation 42.90 4512Rv1652 Urea cycle and metabolism of amino groups 43.90 222484Rv1026 Purine metabolism No similarity to human proteinsRv1284 Nitrogen metabolism No similarity to human proteinsRv1601 Histidine metabolism No similarity to human proteins Rv1606 Histidine metabolism No similarity to human proteinsRv2122c Histidine metabolism No similarity to human proteinsRv2537c Phenylalanine, tyrosine and tryptophan biosynthesis No similarity to human proteinsRv3581c Biosynthesis of steroids No similarity to human proteinsRv3607c Folate biosynthesis No similarity to human proteins
5.6 Discussion and Conclusion
The 42 drug targets against TB were proposed by the new approach based on two
criteria; a) their protein signatures are different from protein signatures of human, b)
they are essential genes from TraSH experiment. In order to state the confidence of
the approach for genome-scale identification of drug targets, I mapped the proposed
drug targets with 78 current validated drug targets (absent DNA synthesis and
regulatory protein targets) reported by Mdluli and Spigelman in 2006 [47] and the
proposed drug targets from Jamshidi and Palsson [35].
107

Mdluli and Spigelman concluded several newly identified targets as well as those
that have been revisited in the past few years, and the levels to which they have been
validated to demonstrate their potential role in improving chemotherapy against TB.
All reported drug targets are in the following pathways. Firstly, they target cell wall
biosynthesis pathway including peptidoglycan biosynthesis, arabinogalactan
biosynthesis, and mycolic acid biosynthesis. Furthermore, they also target amino acid
biosynthesis pathway such as shikimic acid pathway, arginine biosynthesis, and
branched-chain amino acid biosynthesis. Cofactor biosynthesis such as folic acid
biosynthesis, pantothenic acid biosynthesis, CoA biosynthesis, riboflavin
biosynthesis, and reductive sulfur assimilation is also interesting as drug targets.
Mycothiol biosynthesis, terpenoid biosynthesis, DNA synthesis, the glyoxylate
shunt, regulatory proteins, the stringent response enzyme and ATP biosynthesis are
aims of anti-tuberculosis agents. The conclusion of reviewed drug targets with level
of validation shows in Table 5.7.
108

Table 5.7: The validated drug targets in Mycobacterium tuberculosis from Mdluli and Spigelman in 2006 [47].
109

Table 5.7: The validated drug targets in Mycobacterium tuberculosis from Mdluli and Spigelman in 2006 [47] (Continued).
I used names of gene products in Table 5.7 to manually search for their coding genes
in the format of gene accession numbers from KEGG, TubercuList and UniProt
databases. Finally, these gene products except PanE can link to 88 gene accession
numbers, ten of which function in DNA synthesis or as regulatory proteins excluded
from my study scoping to Mtb metabolism. I cannot find the coding gene of PanE,
even on searching in the referred publication. Lastly, 78 current validated drug
targets are used as the references to identify the confidence of the proposed drug
targets.
For 78 current validated drug targets, 70 of them were found in the list of 670
investigated genes. For the other eight unfound targets, three of them were found in
the list of original data gathering from five databases and the other five targets,
Rv1170, Rv2244, Rv3281, Rv3800c and Rv3806c, were not found in this
reconstruction because of no relation between these genes and E.C. numbers.
Moreover, these 78 current validated drug targets were classified into three groups,
110
48 essential genes, 17 non-essential genes and 13 unclassified genes based on TraSH
experiment. After mapping 42 proposed drug targets with 78 current validated drug
targets, 13 of them are current validated drug targets. In conclusion, 31% of the
proposed drug targets as current validated drug targets are significant enough to
indicate the quality of the new proposed method for identifying drug targets.
To state the confidence of these 42 proposed drug targets from the total of 670
investigated Mtb genes statistically, I compared the proposed and non-proposed drug
targets against 70 current validated drug targets from literature. Of my 42 proposed
drug targets, 13 (31%) were drug targets. Of the 628 non-proposed drug targets, 57
(9%) were drug targets. To demonstrate the probability for obtaining 13 or more
validated drug targets from randomly selecting 42 Mtb genes without replacement
from the total of 670 investigated Mtb genes, I calculated the hypergeometric
probability of obtaining 13 or greater validated drug targets following the below
formulas [70, 71].
)12(1)13( ≤−=≥ xpxp
999869.0670
42
70
12
600
3012
0)12( =
⎟⎠⎞⎜
⎝⎛
⎟⎠⎞⎜
⎝⎛⎟⎠⎞⎜
⎝⎛
=≤ −+∑=
ii
ixp
Whereas, population size = 670, sample size = 42, number of successes in the
population = 70, number of successes in the sample (x) = 12
I used Matlab for the probability calculation and found that the probability of
choosing 13 or more validated drug targets from a sample of 42 genes by random
selection of 670 validated Mtb genes is equal to 1.31*10-4. This probability is very
low. It means that it is highly unlikely to find 13 or more validated drug targets when
randomly sampling 42 Mtb genes from the total of 670 Mtb genes. Therefore, the
identification of 13 validated drug targets from 42 proposed drug targets (31%) is
important evidence that confirms the quality of my proposed method.
111
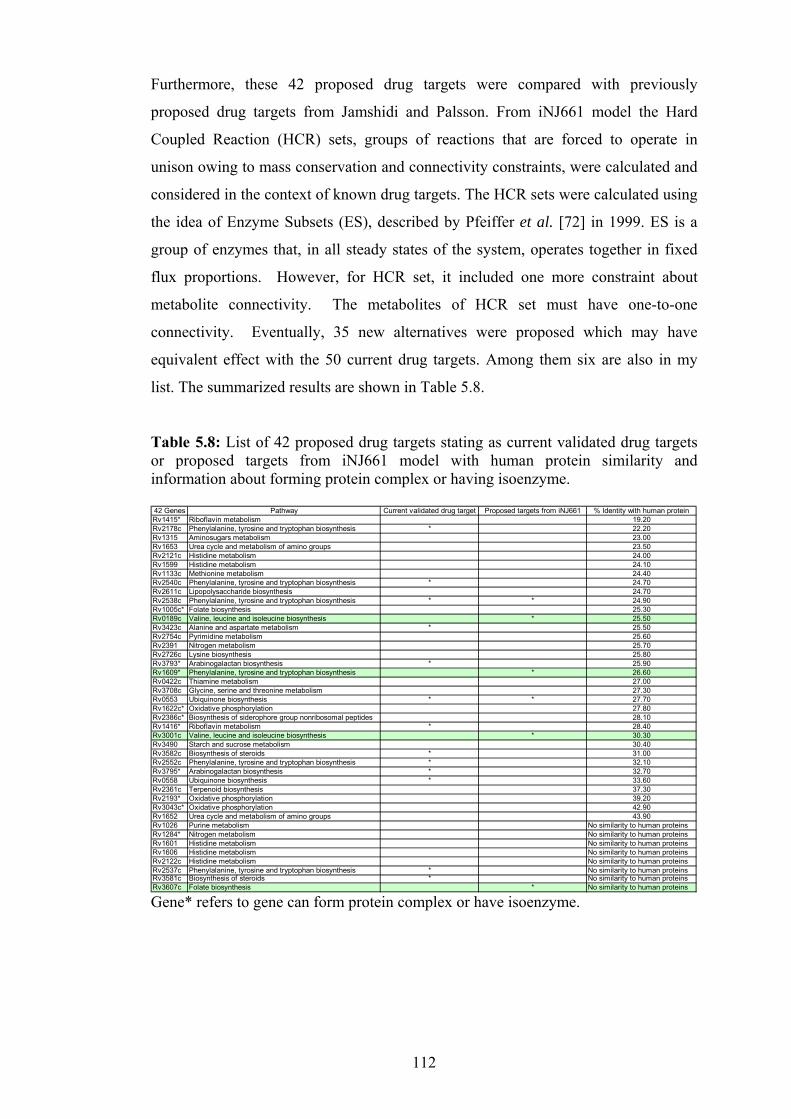
Furthermore, these 42 proposed drug targets were compared with previously
proposed drug targets from Jamshidi and Palsson. From iNJ661 model the Hard
Coupled Reaction (HCR) sets, groups of reactions that are forced to operate in
unison owing to mass conservation and connectivity constraints, were calculated and
considered in the context of known drug targets. The HCR sets were calculated using
the idea of Enzyme Subsets (ES), described by Pfeiffer et al. [72] in 1999. ES is a
group of enzymes that, in all steady states of the system, operates together in fixed
flux proportions. However, for HCR set, it included one more constraint about
metabolite connectivity. The metabolites of HCR set must have one-to-one
connectivity. Eventually, 35 new alternatives were proposed which may have
equivalent effect with the 50 current drug targets. Among them six are also in my
list. The summarized results are shown in Table 5.8.
Table 5.8: List of 42 proposed drug targets stating as current validated drug targets or proposed targets from iNJ661 model with human protein similarity and information about forming protein complex or having isoenzyme. 42 Genes Pathway Current validated drug target Proposed targets from iNJ661 % Identity with human proteinRv1415* Riboflavin metabolism 19.20Rv2178c Phenylalanine, tyrosine and tryptophan biosynthesis * 22.20Rv1315 Aminosugars metabolism 23.00Rv1653 Urea cycle and metabolism of amino groups 23.50Rv2121c Histidine metabolism 24.00Rv1599 Histidine metabolism 24.10Rv1133c Methionine metabolism 24.40Rv2540c Phenylalanine, tyrosine and tryptophan biosynthesis * 24.70Rv2611c Lipopolysaccharide biosynthesis 24.70Rv2538c Phenylalanine, tyrosine and tryptophan biosynthesis * * 24.90Rv1005c* Folate biosynthesis 25.30Rv0189c Valine, leucine and isoleucine biosynthesis * 25.50Rv3423c Alanine and aspartate metabolism * 25.50Rv2754c Pyrimidine metabolism 25.60Rv2391 Nitrogen metabolism 25.70Rv2726c Lysine biosynthesis 25.80Rv3793* Arabinogalactan biosynthesis * 25.90Rv1609* Phenylalanine, tyrosine and tryptophan biosynthesis * 26.60Rv0422c Thiamine metabolism 27.00Rv3708c Glycine, serine and threonine metabolism 27.30Rv0553 Ubiquinone biosynthesis * * 27.70Rv1622c* Oxidative phosphorylation 27.80Rv2386c* Biosynthesis of siderophore group nonribosomal peptides 28.10Rv1416* Riboflavin metabolism * 28.40Rv3001c Valine, leucine and isoleucine biosynthesis * 30.30Rv3490 Starch and sucrose metabolism 30.40Rv3582c Biosynthesis of steroids * 31.00Rv2552c Phenylalanine, tyrosine and tryptophan biosynthesis * 32.10Rv3795* Arabinogalactan biosynthesis * 32.70Rv0558 Ubiquinone biosynthesis * 33.60Rv2361c Terpenoid biosynthesis 37.30Rv2193* Oxidative phosphorylation 39.20Rv3043c* Oxidative phosphorylation 42.90Rv1652 Urea cycle and metabolism of amino groups 43.90Rv1026 Purine metabolism No similarity to human proteinsRv1284* Nitrogen metabolism No similarity to human proteinsRv1601 Histidine metabolism No similarity to human proteinsRv1606 Histidine metabolism No similarity to human proteinsRv2122c Histidine metabolism No similarity to human proteinsRv2537c Phenylalanine, tyrosine and tryptophan biosynthesis * No similarity to human proteinsRv3581c Biosynthesis of steroids * No similarity to human proteinsRv3607c Folate biosynthesis * No similarity to human proteins Gene* refers to gene can form protein complex or have isoenzyme.
112

I now highlight the best choice of drug targets for biologists to validate by
experiment. Four genes; Rv0189c, Rv3001c, Rv1609 and Rv3607c, are not current
validated drug targets but proposed by both my method and Jamshidi’s method.
Among these four genes, Rv3607c has the highest confidence because it has no
protein similarity to human proteins and does not form protein complex or has
isoenzyme.
The second interesting target is Rv0189c because the encoded protein does not form
complex or have isoenzyme. Even though it has 25.5% identity to human protein, the
current validated drug targets reported from Mdluli and Spigelman can have an
identity to human protein to 33.6% shown in Table 5.8. For the less confident targets,
Rv3001c and Rv1609 have equal attraction. Rv3001c has higher similarity with
human protein than Rv1609; however, no information about forming protein
complex or having isoenzyme of Rv3001c has been found, whereas Rv1609 can
form protein complex with Rv0013. Nevertheless, comparing these four genes with
the list of 185 potential drug targets from Anishetty et al. in 2005 [36], three of them
(Rv0189c, Rv3001c and Rv3607c) match, so they are better choices to be tested by
experiment as the additional from the current validated drug targets.
Both Rv0189c and Rv3001c function in Valine, Leucine and Isoleucine biosynthesis
pathways. There are no 3D structures of these two proteins in Protein Data Bank
(PDB) [73]; however, Rv3001c has comparative protein structure model in ModBase
[74]. Importantly, Rv3607c functioning in Folate biosynthesis pathway has two 3D
structure entries in PDB, namely 1NBU and 1Z9W. Goulding et al. also reported the
structures of three proteins, including Rv3607c which are potentially essential to the
survival of Mtb [75].
113

CHAPTER 6
General Conclusions and Future Work
High quality genome-scale metabolic networks of pathogens have many applications,
for example, finding optimal conditions for in vitro or in vivo-grown pathogens,
screening and identifying new and alternative drug targets. In this work, a high
quality genome-scale metabolic network of Mtb H37Rv was reconstructed and
applied for the identification of drug targets by comparing the reconstructed network
with EHMN in terms of protein functional sites. I summarize some of the main
points for further improvement, and discuss the limitations and contribution of this
work.
High quality genome-scale metabolic network reconstruction
• Initially, genes obtaining E.C. numbers were extracted from various genome
annotation databases to form the original data set, before confirming their
metabolic functions from specific genome databases of Mtb and related
publications. However, some genes function as enzymatic genes in metabolic
network but are not identified with E.C. numbers. These genes will be missing
during the reconstruction process. It was a limitation from my reconstruction
process; however, the problem might be overcome by including 86 new genes
from gene comparison results among three Mtb models, i.e. GSMN-TB, iNJ661
and HQMtb, to the next version of the HQMtb. Almost all new genes from either
GSMN-TB or iNJ661 models are not associated with E.C. numbers.
• The protocol for the HQMtb reconstruction was performed semi-automatically.
The first part of the reconstruction process was dealing with the way to extract a
huge amount of gene annotation information from various databases. The
programming language, i.e. Visual Basic for Applications (VBA) code was
created for automatic retrieving, e.g. retrieving enzymatic reactions from KEGG
database to store in Excel format for further systematic analysis. The VBA code
114
was written for recall gene annotation information in the text file to be stored in
Excel as the desired platform. When growing or updating gene annotation
information in many databases, the VBA code that I created is still useful for
automatically retrieving new information. Even though the first part of the
HQMtb reconstruction can be updated automatically, in order to maintain the
high quality genome-scale metabolic network the manual validation of gene
functions is still the key process.
• 68 genes absent in both previous Mtb models but present in only HQMtb model
are a contribution from this work to the completeness of Mtb metabolic network.
These genes are linked to approximately 52 new metabolic reactions divided into
17 metabolic pathways such as biosynthesis of steroids, fatty acid metabolism,
and TCA cycle.
• The big problem for metabolic network comparison in terms of enzymatic
reactions comparison between the reconstructed and previous metabolic networks
is no standard compound name or compound ID assigned to each metabolites in
the metabolic networks. The big effort was employed in this work for finding
standard compound IDs, i.e. KEGG compound IDs to all metabolites in the
HQMtb and GSMN-TB networks. Unfortunately, the compound name is symbol
sensitive and there are several synonyms for one compound. Identifying the
compound IDs to each metabolite is not completed via programming. Therefore,
the manual work is still required for completing this task. It is the bottle neck for
further combining, modifying or updating the previous metabolic network with
the new reconstructed network.
• The reorganization of metabolic reactions into metabolic pathways was
performed in order to avoid the overlapping of metabolic reactions among
pathways. Moreover, the visualization maps of all reorganized metabolic
pathways that demonstrate the main metabolite relationships in each pathway
were presented.
• The next version of the HQMtb should be incorporated further analysis such as
network gap analysis, Flux Balance Analysis (FBA), and genome-scale kinetic
model.
115

• The genome-scale kinetic model of the HQMtb might be created in the future.
The idea for combining the FBA with the kinetic data in order to build the
genome-scale kinetic model is presented. Owning to lack of kinetic data of all
enzymes in the metabolic network of Mtb, the whole genome-scale kinetic model
of Mtb is far to achieve. Comparison between flux distribution from FBA, a static
model, and half of the Vmax of each enzyme will assist to filter and identify only
the enzymes required the full set of kinetic data. This may facilitate us to create
the genome-scale kinetic model successfully.
Mtb-Human metabolic network comparison for drug targets identification
• 42 Mtb genes were proposed to be possible drug targets based on protein
functional site comparison between human and Mtb proteins. A novel genome-
scale screening method for drug targets identification is a contribution from this
work. This approach can be applied to other pathogens.
• Drug targets are proposed based on two criteria: (1) no protein functional sites
matching with any human protein functional sites and (2) essential genes from
TraSH experiment. However, not all genes in the reconstructed network have
protein functional sites in terms of InterPro accession number, 670 genes from
the total of 686 genes are analyzed by this method. Nevertheless, the InterPro
curators still continue to integrate new protein signatures from member databases
into entries and aim to cover 100% of proteins in UniProtKB.
• Rv0189c, Rv3001c and Rv3607c have the highest level of confidence among the
total of 42 proposed drug targets. The experimental validation should be
performed to prove the predicted results from the computational analysis.
• The future work in terms of combining human and Mtb metabolic networks
together as metabolite network might occur. The metabolite or compound
network will be useful for investigating the compound that the pathogen uses for
survival and also receives from the human host. This may decipher the
relationship between pathogen and host and facilitate the approach for
developing more effective drugs against TB.
116

Bibliography 1. Cole, S.T., Comparative and functional genomics of the Mycobacterium
tuberculosis complex. Microbiology, 2002. 148: p. 2919-2928. 2. Young, D.B., Blueprint for the white plague. Nature, 1998. 393: p. 515-516. 3. Clark-Curtiss, J.E., and Haydel, S. E. , Molecular Genetics of Mycobacterium
tuberculosis Pathogenesis. Annu. Rev. Microbiol., 2003. 57: p. 517-549. 4. Ducati, R.G., Ruffino-Netto, A., Basso, L.A., and Santos, D.S., The
resumption of comsumption - A review on tuberculosis. Mem Inst Oswaldo Cruz, Rio de janeiro, 2006. 101(7): p. 697-714.
5. Daniel, T.M., The history of tuberculosis. Respiratory Medicine, 2006. 100: p. 1862-1870.
6. Parish, T., and Stoker, N.G., Methods in Molecular Biology: Mycobacteria Protocols. Vol. 101. 1998: Humana Press Inc. 472.
7. Kinsella, R.J., Fitzpatrick, D. A., Creevey, C. J., and Mclnerney, J. O., Fatty acid biosynthesis in Mycobacterium tuberculosis: Lateral gene transfer, adaptive evolution, and gene duplication. PNAS, 2003. 100: p. 10320-10325.
8. World Health Organization (WHO). [cited; Available from: www.who.int. 9. Lin, P.L., Kirschner, D., and Flynn, J. L. , Modeling pathogen and host: in
vitro, in vivo and in silico models of latent Mycobacterium tuberculosis infection. Drug Discovery Today: Disease Models, 2005. 2(2): p. 149-154.
10. development, G.a.f.T.d., Scientific Blueprint for TB Drug Development. Tuberculosis (Edinburgh, Scotland), 2001. 81(Suppl1): p. 1-52.
11. Todar's Online Textbook of Bacteriology. [cited; Available from: http:// textboookofbacteriology.net.
12. Butcher, S.P., Target Discovery and Validation in the Post-Genomic Era. Neurochemical Research, 2003. 28(2): p. 367-371.
13. Cole, S.T., Brosch, R., Parkhill, J., Garnier, T., Churcher, C., Harris, D., Gordon, S.V., Eiglmeier, K., Gas, S., Barry III., C.E., Tekaia, F., Badcock, K., Basham, D., Brown, D., Chillingworth, T., Connor, R., Davies, R., Devlin, K., Feltwell, T., Gentles, S., Hamlin, N., Holroyd, S., Hornsby, T., Jagels, K., Krogh, A., McLean, J., Moule, S., Murphy, L., Oliver, K., Osborne, J., Quail, M.A., Rajandream, M.-A., Rogers, J., Rutter, S., Seeger, K., Skelton, J., Squares, R., Squares, S., Sulston, J.E., Taylor, K., Whitechead, S., and Barrell B.G., Deciphering the biology of Mycobacterium tuberculosis from the complete genome sequence. Nature, 1998. 393: p. 537-544.
14. Manabe, Y.C., Dannenberg, A. M., and Bishai, W. R. , What we can learn from the Mycobacterium tuberculosis genome sequencing projects. Int. J. Tuberc. Lung. Dis, 2000. 4(2): p. 518-523.
15. Camus, J.-C., Pryor, M. J., Medigue, C., and Cole, S. T. , Re-annotation of the genome sequence of Mycobacterium tuberculosis H37Rv. Microbiology, 2002. 148: p. 2967-2973.
16. TubercuList. [cited; Available from: http://genolist.pasteur.fr/TubercuList. 17. Ogata, H., Goto, S., Sato, K., Fujibuchi, W., Bono, H., and Kanehisa, M.,
KEGG: Kyoto Encyclopedia of Genes and Genomes. Nucleic Acids Research, 1999. 27(1): p. 29-34.
117
18. Riley, M.L., Schmidt, T., Artamonova, I.I., Wagner, C., Volz, A., Heumann, K., Mewes, H., and Frishman, D., PEDANT genome database: 10 years online. Nucleic Acids Research, 2006(Database): p. D1-D4.
19. Karp, P.D., Ouzounis, C.A., Moore-Kochlacs, C., Goldovsky, L., Kaipa, P., Ahren, D., Tsoka, S., Darzentas, N., Kunin, V., and Lopez-Bigas, N., Expansion of the BioCyc collection of pathway/genome databases to 160 genomes. Nucleic Acids Research, 2005. 33(19): p. 6083-6089.
20. Consortium, T.U., The Universal Protein Resource (UniProt). Nucleic Acids Research, 2007. 35(Database): p. D193-D197.
21. Hunter, S., Apweiler, R., Attwood, T.K., Bairoch, A., Bateman, A., Binns, D., Bork, P., Das, U., Daugherty, L., Duquenne, L., Finn, R.D., Gough, J., Haft, D., Hulo, N., Kahn, D., Kelly, E., Laugraud, A., Letunic, I., Lonsdale, D., Lopez, R., Madera, M., Maslen, J., McAnulla, C., McDowall, J., Mistry, J., Mitchell, A., Mulder, N., Natale, D., Orengo, C., Quinn, A.F., Selengut, J.D., Sigrist, C.J.A., Thimma, M., Thomas, P.D., Valentin, F., Wilson, D., Wu, C.H., and Yeats, C., InterPro: the integrative protein signature database. Nucleic Acids Research, 2009. 37(Database): p. D211-D215.
22. Sassetti, C.M., Boyd, D.H., and Rubin, E.J., Genes required for mycobacterial growth defined by high density mutagenesis. Molecular Microbiology, 2003. 48(1): p. 77-84.
23. Ideker, T., Galitski, T., and Hood L. , A New Approach to Decoding Life: Systems Biology. Annu. Rev. Genomics Hum. Genet., 2001. 2: p. 343-372.
24. Kitano, H., Computational Systems Biology. Nature, 2002. 420(6912): p. 206-210.
25. Computational and Systems biology at MIT. [cited; Available from: http://csbi.mit.edu.
26. National Institue of General Medical Sciences. [cited; Available from: http://www.nigms.nih.gov/.
27. Forster, J., Famili, I., Fu, P., Palsson, B.O., and Nielsen, J., Genome-Scale Reconstruction of the Saccharomyces cerevisiae Metabolic Network. Genome Research, 2003. 13: p. 244-253.
28. Reed, J.L., Vo, T.D., Schilling, C.H., and Palsson, B.O., An expanded genome-scale model of Escherichia coli K-12 (iJR904 GSM/GPS). Genome Biology, 2003. 4(9): p. R54.
29. Becker, S.A., and Palsson, B.O., Genome-scale reconstruction of the metabolic network in Staphylococcus aureus N315: and initial draft to the two-dimensional annotation. BMC Microbiology, 2005. 5(8).
30. Feist, A.M., Scholten, J.C., Palsson, B.O., Brockman, F.J., and Ideker, T., Modeling methanogenesis with a genome-scale metabolic reconstruction of Methanosarcina barkeri. Molecular Systems Biology, 2006: p. 1-14.
31. Duarte, N.C., Becker, S.A., Jamshidi, N., Thiele, I., Mo, L.M., Vo, T.D., Srivas, R., and Palsson, B.O., Global reconstruction of the human metabolic network based on genomic and bibliomic data. PNAS, 2007. 104(6): p. 1777-1782.
32. Ma, H., Sorokin, A., Mazein, A., Selkov, A., Selkov, E., Demin, O., and Goryanin, I., The Edinburgh human metabolic network reconstruction and its functional analysis. Molecular Systems Biology, 2007. 3(135).
118

33. Raman, K., Rajagopalan, P., and Chandra, N. , Flux Balance Analysis of Mycolic Acid Pathway: Targets for Anti-Tubercular Drugs. PLoS Computational Biology, 2005. 1(5): p. 349-358.
34. Beste, D.J., Hooper, T., Stewart, G., Bonde, B., Avignone-Rossa, C., Bushell, M., Wheeler, P., Klamt, S., Kierzek, A.M., and McFadden, J., GSMN-TB: a web-based genome scale network model of Mycobacterium tuberculosis metabolism. Genome Biology, 2007. 8: p. R89.
35. Jamshidi, N., and Palsson, B.O., Investigating the Metabolic Capabilities of Mycobacterium tuberculosis H37Rv Using the in silico Strain iNJ661 and Proposing Alternative Drug Targets. BMC Systems Biology, 2007. 1(26).
36. Anishetty, S., Pulimi, M., and Pennathur, G. , Potential drug targets in Mycobacterium tuberculosis through metabolic pathway analysis. Computational Biology and Chemistry, 2005.
37. Walter, M.C., Rattei, T., Arnold, R., Guldener, U., Munsterkotter, M., Nenova, K., Kastenmuller, G., Tischler, P., Wolling, A., Volz, A., Pongratz, N., Jost, R., Mewes, H., and Frishman, D., PEDANT covers all complete RefSef genomes. Nucleic Acids Research, 2009. 37(Databases).
38. Duncan, K., Progress in TB drug development and what is still needed. Tuberculosis, 2003. 83: p. 201-207.
39. Mendonca, J.D., Ely, F., Palma, M.S., Frazzon, J., Basso, L.A., and Santos, D.S., Functional Characterization by Genetic Complementation of aroB-Encoded Dehydroquinate Synthase from Mycobacterium tuberculosis H37Rv and Its Heterologous Expression and Purification. Journal of Bacteriology, 2007. 189(17): p. 6246-6252.
40. Ely, F., Nunes, J.E., Schroeder, E.K., Frazzon, J., Palma, M.S., Santos, D.S., and Basso, L.A., The Mycobacterium tuberculosis Rv2540c DNA sequence encodes a bifunctional chorismate synthase. BMC Biochemistry, 2008. 9.
41. Fernandes, C.L., Breda, A., Santos, S., Basso, L.A., and Souza, O.N., A structural model for chorismate synthase from Mycobacterium tuberculosis in complex with coenzyme and substrate. Computers in Biology and Medicine, 2006. 37: p. 149-158.
42. Parish, T., and Stoker, N.G., The common aromatic amino acid biosynthesis pathway is essential in Mycobacterium tuberculosis. Microbiology, 2002. 148: p. 3069-3077.
43. Rizzi, C., Frazzon, J., Ely, F., Weber, P.G., Fonseca, I.O., Gallas, M., Oliveira, J.S., Mendes, M.A., Souza, B.M., Palma, M.R., Santos, D.S., and Basso, L.A., DAHP synthase from Mycobacterium tuberculosis H37Rv: cloning, expression, and purification of functional enzyme. Protein Expression and Purification, 2005. 40: p. 23-30.
44. Sareen, D., Newton, G.L., Fahey, R.C., and Buchmeier, N.A., Mycothiol Is Essential for Growth of Mycobacterium tuberculosis Erdman. Journal of Bacteriology, 2003. 185(22): p. 6736-6740.
45. Eisenreich, W., Bacher, A., Arigoni, D., and Rohdich, F., Biosynthesis of isoprenoids via the non-mevalonate pathway. Cellular and Molecular Life Sciences, 2004. 61: p. 1401-1426.
46. Sambandamurthy, V.K., Wang, X., Chen, B., Russell, R.G., Derrick, S., Collins, F.M., Morris, S.L., and Jacobs JR, W.R., A pantothenate auxotroph
119

of Mycobacterium tuberculosis is highly attenuated and protects mice against tuberculosis. Nature Medicine, 2002. 8(10): p. 1171-1174.
47. Mdluli, K., and Spigelmen, M., Novel targets for tuberculosis drug discovery. Current Opinion in Pharmacology, 2006. 6: p. 459-467.
48. Goulding, C.W., Apostol, M., Anderson, D.H., Gill, H.S., Smith, C.V., Kuo, M.R., Yang, J.K., Waldo, G.S., Suh, S.W., Chauhan, R., Kale, A., Bachhawat, N., Mande, S.C., Johnston, J.M., Lott, J.S., Baker, E.N., Arcus, V.L., Leys, D., McLean, K.J., Munro, A.W., Berendzen, J., Sharma, V., Park, M.S., Eisenberg, D., Sacchettini, J., Alber, T., Rupp, B., Jacobs, W., and Terwilliger, T.C., The TB Structural Genomics Consortium: Providing a Structural Foundation for Drug Discovery. Current Drug Targets-Infectious Disorders, 2001. 2(3): p. 1-21.
49. Terwilliger, T.C., Park, M.S., Waldo, G.S., Berendzen, J., Hung, L.W., Kim, C.Y., Smith, C.V., Sacchettini, J.C., Bellinzoni, M., Bossi, R., Rossi, E., Mattevi, A., Milano, A., Riccardi, G., Rizzi, M., Roberts, M.M., Coker, A.R., Fossati, G., Mascagni, P., Coates, A.R.M., Wood, S.P., Goulding, C.W., Apostol, M.I., Anderson, D.H., Gill, H.S., Eisenberg, D.S., Taneja, B., Mande, S., Pohl, E., Lamzin, V., Tucker, P., Wilmanns, M., Colovos, C., Meyer-Klaucke, W., Munro, A.W., McLean, K.J., Marshall, K.R., Leys, D., Yang, J.K., Yoon, H.J., Lee, B.I., Lee, M.G., Kwak, J.E., Han, B.W., Lee, J.Y., Beak, S.H., Suh, S.W., Komen, M.M., Arcus, V.L., Baker, E.N., Lott, J.S., Jacobs Jr., W., Alber, T. and Rupp, B., The TB structural genomics consortiums: a resource for Mycobacterium tuberculosis biology. Tuberculosis, 2003. 83: p. 223-249.
50. Dejongh, M., Formsma, K., Biollot, P., Gould, J., Rycenga, M., and Best, A., Toward the automated generation of genome-scale metabolic networks in the SEED. BMC Bioinformatics, 2007. 8.
51. IUBMB. [cited; Available from: www.chem.qmul.ac.uk/iubmb/enzyme. 52. WebTB. [cited; Available from: www.webtb.org. 53. Chang, Z., and Vining, L.C., Biosynthesis of sulfur-containing amino acids in
Streptomyces venezuelae ISP5230: roles for cystathionine beta-synthase and transsulfuration. Microbiology, 2002. 148(Pt7): p. 2135-47.
54. Kern, B.A., and Inamine, E., Cystathionine gamma-lyase activity in the cephamycin C producer Streptomyces lactamdurans. J. Antibiot. (Tokyo), 1981. 34: p. 583-589.
55. Nagasawa, T., Kanzaki,H., and Yamada,H., Cystathionine gamma-lyase from Streptomyces phaeochromogenes. Methods Enzymol., 1987. 143: p. 486-492.
56. Sacco, E., Legendre, V., Laval, F., Zerbib, D., Montrozier, H., Eynard, N., Guilhot, C., Daffe, M., and Quemard, A., Rv3389C from Mycobacterium tuberculosis, a member of the(R)-specific hydratase/dehydratase family. Biochimica et Biophysica Acta, 2007. 1774: p. 303-311.
57. De Smet, K.A.L., Weston, A., Brown, I.N., Young, D.B., and Robertson, B.D., Three pathways for trehalose biosynthesis in mycobacteria. Microbiology, 2000. 146: p. 199-208.
58. Edwards, J.S., and Palsson, B.O., The Escherichia coli MG1655 in silico metabolic genotype:Its definition, characteristics, and capabilities. Proc. Natl. Acad. Sci, 2000. 97: p. 5528-5533.
120

59. Neidhardt, F.C., Ingraham, J.L., and Schaechter, M., Physiology of the Bacterial Cell: a Molecular Approach. 1990: Sinauer Associates.
60. Ma, H., and Zeng, A., Reconstruction of metabolic networks from genome data and analysis of their global structure for various organisms. Bioinformatics, 2003. 19(2): p. 270-277.
61. Batagelj, V., and Mrvar, A., Pajek-program for large network analysis. Connections, 1998. 21: p. 47-57.
62. Shannon, P., Markiel, A., Ozier, O., Baliga, N.S., Wang, J.T., Ramage, D., Amin, N., Schwikowski, B., and Ideker, T.. Cytoscape: a software environment for integrated models of biomolecular interaction networks. Genome Research, 2003. 13: p. 2498-2504.
63. Cole ST, Comparative and functional genomics of the Mycobacterium tuberculosis complex. Microbiology, 2002. 148: p. 2919-2928.
64. Cole ST, B.R., Parkhill J, Garnier T, Churcher C, Harris D, Gordon SV, Eiglmeier K, Gas S, Barry CE 3rd, Tekaia F, Badcock K, Basham D, Brown D, Chillingworth T, Connor R, Davies R, Devlin K, Feltwell T, Gentles S, Hamlin N, Holroyd S, Hornsby T, Jagels K, Krogh A, McLean J, Moule S, Murphy L, Oliver K, Osborne J, Quail MA, Rajandream MA, Rogers J, Rutter S, Seeger K, Skelton J, Squares R, Squares S, Sulston JE, Taylor K, Whitehead S, Barrell BG, Deciphering the biology of Mycobacterium tuberculosis from the complete genome sequence. Nature, 1998. 393: p. 537-544.
65. Borodina, I., Krabben, P., and Nielsen, J., Genome-scale analysis of Streptomyces coelicolor A3(2) metabolism. Genome Research, 2005. 15(6): p. 820-9.
66. Constant, P., Perez, E., Malaga, W., Laneelle, M.A., Saurel, O., Daffe, M., and Guilhot, C., Role of the pks15/1 gene in the biosynthesis of phenolglycolipids in the Mycobacterium tuberculosis complex. Evidence that all strains synthesize glycosylated p-hydroxybenzoic methly esters and that strains devoid of phenolglycolipids harbor a frameshift mutation in the pks15/1 gene. J. Biol. Chem., 2002. 277: p. 38148-38158.
67. Agüero, F., Al-Lazikani, B., Aslett, M., Berriman, M., Buckner, F.S., Campbell, R.K., Carmona, S., Carruthers, I.M., Chan, A.W., Chen, F., Crowther, G.J., Doyle, M.A., Hertz-Fowler, C., Hopkins, A.L., McAllister, G., Nwaka, S., Overington, J.P., Pain, A., Paolini, G.V., Pieper, U., Ralph, S.A., Riechers, A., Roos, D.S., Sali, A., Shanmugam, D., Suzuki, T., Van Voorhis, W.C., and Verlinde, C.L., Genomic-scale prioritization of drug targets: the TDR Targets database. Nat Rev Drug Discov., 2008. 7(11): p. 900-907.
68. Janin, Y.L., Antituberculosis drugs: Ten years of research. Bioorganic & Medicinal Chemistry, 2007. 15: p. 2479-2513.
69. Rattan, A., Kalia, A., and Ahmad, N., Multidrug-Resistant Mycobacterium tuberculosis: Molecular Perspectives. Emerging Infectious Diseases, 1998. 4(2): p. 195-209.
70. StatTrek Teach yourself statistics. [cited; Available from: www.StatTrek.com.
121

122
71. Evans, M., Hastings, N., and Peacock, B. , Statistical distributions 3rd ed. Wiley series in probability and statistics. Probability and statistics section. 2000, New York John Wiley. 221.
72. Pfeiffer, T., Sánchez-Valdenebro, I., Nuño, J.C., Montero, F., and Schuster, S., METATOOL: for studying metabolic networks. Bioinformatics, 1999. 15(3): p. 251-7.
73. Protein Data Bank. [cited; Available from: www.pdb.org. 74. Pieper, U., Eswar, N., Webb, B.M., Eramian, D., Kelly, L., Barkan, D.T.,
Carter, H., Mankoo, P., Karchin, R., Marti-Renom, M.A., Davis, F.P., and Sali, A., MODBASE, a database of annotated comparative protein structure models and associated resources. Nucleic Acids Research, 2009. 37(Database): p. D347-D354.
75. Goulding, C.W., Perry, L.J., Anderson, D., Sawaya, M.R., Cascio, D., Apostol, M.I., Chan, S., Parseghian, A., Wang, S.S., Wu, Y., Cassano, V., Gill, H.S., and Eisenberg, D., Structural genomics of Mycobacterium tuberculosis: a preliminary report of progress at UCLA. Biophysical Chemistry, 2003. 105: p. 361-370.

Appendix A
A complete list of included reactions in the HQMtb
Description: All metabolic reactions including reaction IDs, protein-coding genes,
E.C. numbers, confidence scores, pathway classification, and publications as the
reference of particular reactions. Other metabolic reactions without specific
references are from specific genome annotation database of Mtb, i.e. WebTB,
TubercuList, BioCyc, and UniProt.
123

Appendix B
A complete list of metabolites
Description: the list of all metabolites appearing in the HQMtb including
abbreviation (compound ID), and full name.
160

Appendix C
A list of references of particular reactions in the HQMtb
Description: There are 141 publications as the references of particular reactions in
the HQMtb.
184

List of publications as references of particular reactions in the HQMtb
Abdel Motaal, A., Tews, I., Schultz, J.E., and Linder, J.U. (2006) Fatty acid regulation of adenylyl cyclase Rv2212 from Mycobacterium tuberculosis H37Rv. FEBS J. 273(18), 4219-28. Adams,C.W., Fornwald,J.A., Schmidt,F.J., Rosenberg,M., and Brawner,M.E. (1988). Gene organization and structure of the Streptomyces lividans gal operon. J. Bacteriol. 170, 203-212. Alderwick,L.J., Seidel,M., Sahm,H., Besra,G.S., and Eggeling,L. (2006). Identification of a novel arabinofuranosyltransferase (AftA) involved in cell wall arabinan biosynthesis in Mycobacterium tuberculosis. J. Biol. Chem. 281, 15653-15661. Argyrou,A., Vetting,M.W., and Blanchard,J.S. (2004). Characterization of a new member of the flavoprotein disulfide reductase family of enzymes from Mycobacterium tuberculosis. J. Biol. Chem. 279, 52694-52702. Baca,A.M., Sirawaraporn,R., Turley,S., Sirawaraporn,W., and Hol,W.G. (2000). Crystal structure of Mycobacterium tuberculosis 7,8-dihydropteroate synthase in complex with pterin monophosphate: new insight into the enzymatic mechanism and sulfa-drug action. J. Mol. Biol. 302, 1193-1212. Bai,N.J., Pai,M.R., Murthy,P.S., and Venkitasubramanian,T.A. (1982). Fructose-bisphosphate aldolases from mycobacteria. Methods Enzymol. 90 Pt E, 241-250. Barona-Gomez,F. and Hodgson,D.A. (2003). Occurrence of a putative ancient-like isomerase involved in histidine and tryptophan biosynthesis. EMBO Rep. 4, 296-300. Basso,L.A., Santos,D.S., Shi,W., Furneaux,R.H., Tyler,P.C., Schramm,V.L., and Blanchard,J.S. (2001). Purine nucleoside phosphorylase from Mycobacterium tuberculosis. Analysis of inhibition by a transition-state analogue and dissection by parts. Biochemistry 40, 8196-8203. Baulard, A.R., Gurcha, S.S., Engohang-Ndong, J., Gouffi, K., Locht, C., and Besra, G.S. (2003) In vivo interaction between the polyprenol phosphate mannose synthase Ppm1 and the integral membrane protein Ppm2 from Mycobacterium smegmatis revealed by a bacterial two-hybrid system. J. Biol. Chem. 278(4), 2242-8. Belisle,J.T., Vissa,V.D., Sievert,T., Takayama,K., Brennan,P.J., and Besra,G.S. (1997). Role of the major antigen of Mycobacterium tuberculosis in cell wall biogenesis. Science 276, 1420-1422.
185
Bellinzoni,M., De Rossi,E., Branzoni,M., Milano,A., Peverali,F.A., Rizzi,M., and Riccardi,G. (2002). Heterologous expression, purification, and enzymatic activity of Mycobacterium tuberculosis NAD(+) synthetase. Protein Expr. Purif. 25, 547-557. Berg,S., Starbuck,J., Torrelles,J.B., Vissa,V.D., Crick,D.C., Chatterjee,D., and Brennan,P.J. (2005). Roles of conserved proline and glycosyltransferase motifs of EmbC in biosynthesis of lipoarabinomannan. J. Biol. Chem. 280, 5651-5663. Bhargava,U. and Venkitasubramanian,T.A. (1965). Carbohydrate metabolism in experimental tuberculosis: hepatic enzymes related to glycogen metabolism & synthesis of glycogen from labelled glucose. Indian J. Biochem. 2, 115-117. Bott,M. and Niebisch,A. (2003). The respiratory chain of Corynebacterium glutamicum. J. Biotechnol. 104, 129-153. Brown,K.L., Morris,V.K., and Izard,T. (2004). Rhombohedral crystals of Mycobacterium tuberculosis phosphopantetheine adenylyltransferase. Acta Crystallogr. D. Biol. Crystallogr. 60, 195-196. Caceres,N.E., Harris,N.B., Wellehan,J.F., Feng,Z., Kapur,V., and Barletta,R.G. (1997). Overexpression of the D-alanine racemase gene confers resistance to D-cycloserine in Mycobacterium smegmatis. J. Bacteriol. 179, 5046-5055. Cantoni,R., Branzoni,M., Labo,M., Rizzi,M., and Riccardi,G. (1998). The MTCY428.08 gene of Mycobacterium tuberculosis codes for NAD+ synthetase. J. Bacteriol. 180, 3218-3221. Chakrabarty,A.M. (1998). Nucleoside diphosphate kinase: role in bacterial growth, virulence, cell signalling and polysaccharide synthesis. Mol. Microbiol. 28, 875-882. Chan,S., Segelke,B., Lekin,T., Krupka,H., Cho,U.S., Kim,M.Y., So,M., Kim,C.Y., Naranjo,C.M., Rogers,Y.C., Park,M.S., Waldo,G.S., Pashkov,I., Cascio,D., Perry,J.L., and Sawaya,M.R. (2004). Crystal structure of the Mycobacterium tuberculosis dUTPase: insights into the catalytic mechanism. J. Mol. Biol. 341, 503-517. Chang,Z. and Vining,L.C. (2002). Biosynthesis of sulfur-containing amino acids in Streptomyces venezuelae ISP5230: roles for cystathionine beta-synthase and transsulfuration. Microbiology 148, 2135-2147. Choi,K.J., Yu,Y.G., Hahn,H.G., Choi,J.D., and Yoon,M.Y. (2005). Characterization of acetohydroxyacid synthase from Mycobacterium tuberculosis and the identification of its new inhibitor from the screening of a chemical library. FEBS Lett. 579, 4903-4910. Choi,K.P., Kendrick,N., and Daniels,L. (2002). Demonstration that fbiC is required by Mycobacterium bovis BCG for coenzyme F(420) and FO biosynthesis. J. Bacteriol. 184, 2420-2428.
186

Chopra,S., Pai,H., and Ranganathan,A. (2002). Expression, purification, and biochemical characterization of Mycobacterium tuberculosis aspartate decarboxylase, PanD. Protein Expr. Purif. 25, 533-540. Clemens,D.L., Lee,B.Y., and Horwitz,M.A. (1995). Purification, characterization, and genetic analysis of Mycobacterium tuberculosis urease, a potentially critical determinant of host-pathogen interaction. J. Bacteriol. 177, 5644-5652. Cole,S.T., Brosch,R., Parkhill,J., Garnier,T., Churcher,C., Harris,D., Gordon,S.V., Eiglmeier,K., Gas,S., Barry,C.E., III, Tekaia,F., Badcock,K., Basham,D., Brown,D., Chillingworth,T., Connor,R., Davies,R., Devlin,K., Feltwell,T., Gentles,S., Hamlin,N., Holroyd,S., Hornsby,T., Jagels,K., Krogh,A., McLean,J., Moule,S., Murphy,L., Oliver,K., Osborne,J., Quail,M.A., Rajandream,M.A., Rogers,J., Rutter,S., Seeger,K., Skelton,J., Squares,R., Squares,S., Sulston,J.E., Taylor,K., Whitehead,S., and Barrell,B.G. (1998). Deciphering the biology of Mycobacterium tuberculosis from the complete genome sequence. Nature 393, 537-544. Covarrubias,A.S., Bergfors,T., Jones,T.A., and Hogbom,M. (2006). Structural mechanics of the pH-dependent activity of beta-carbonic anhydrase from Mycobacterium tuberculosis. J. Biol. Chem. 281, 4993-4999. Crick,D.C., Mahapatra,S., and Brennan,P.J. (2001). Biosynthesis of the arabinogalactan-peptidoglycan complex of Mycobacterium tuberculosis. Glycobiology 11, 107R-118R. Cuadrado,Y., Fernandez,M., Recio,E., Aparicio,J.F., and Martin,J.F. (2004). Characterization of the ask-asd operon in aminoethoxyvinylglycine-producing Streptomyces sp. NRRL 5331. Appl. Microbiol. Biotechnol. 64, 228-236. Cushman,M., Sambaiah,T., Jin,G., Illarionov,B., Fischer,M., and Bacher,A. (2004). Design, synthesis, and evaluation of 9-D-ribitylamino-1,3,7,9-tetrahydro-2,6,8-purinetriones bearing alkyl phosphate and alpha,alpha-difluorophosphonate substituents as inhibitors of tiboflavin synthase and lumazine synthase. J. Org. Chem. 69, 601-612. Dawes,S.S., Warner,D.F., Tsenova,L., Timm,J., McKinney,J.D., Kaplan,G., Rubin,H., and Mizrahi,V. (2003). Ribonucleotide reduction in Mycobacterium tuberculosis: function and expression of genes encoding class Ib and class II ribonucleotide reductases. Infect. Immun. 71, 6124-6131. De Rossi,E., Leva,R., Gusberti,L., Manachini,P.L., and Riccardi,G. (1995). Cloning, sequencing and expression of the ilvBNC gene cluster from Streptomyces avermitilis. Gene 166, 127-132. De Smet, K.A., Weston, A., Brown, I.N., Young, D.B., and Robertson, B.D. (2000) Three pathways for trehalose biosynthesis in mycobacteria. Microbiology 146, 199-208.
187

Derkos-Sojak,V., Pigac,J., and Delic,V. (1985). Biochemical and genetic studies of a histidine regulatory mutant of Streptomyces coelicolor A3 (2). J. Basic Microbiol. 25, 479-485. Dubey,V.S., Sirakova,T.D., and Kolattukudy,P.E. (2002). Disruption of msl3 abolishes the synthesis of mycolipanoic and mycolipenic acids required for polyacyltrehalose synthesis in Mycobacterium tuberculosis H37Rv and causes cell aggregation. Mol. Microbiol. 45, 1451-1459. Ely, F., Nunes, J.E., Schroeder, E.K., Frazzon, J., Palma, M.S., Santos, D.S., and Basso, L.A. (2008) The Mycobacterium tuberculosis Rv2540c DNA sequence encodes a bifunctional chorismate synthase. BMC Biochem. 9. Errey,J.C. and Blanchard,J.S. (2005). Functional characterization of a novel ArgA from Mycobacterium tuberculosis. J. Bacteriol. 187, 3039-3044. Feng,Z. and Barletta,R.G. (2003). Roles of Mycobacterium smegmatis D-alanine:D-alanine ligase and D-alanine racemase in the mechanisms of action of and resistance to the peptidoglycan inhibitor D-cycloserine. Antimicrob. Agents Chemother. 47, 283-291. Fernandes,N.D. and Kolattukudy,P.E. (1996). Cloning, sequencing and characterization of a fatty acid synthase-encoding gene from Mycobacterium tuberculosis var. bovis BCG. Gene 170, 95-99. Fernandez,M., Cuadrado,Y., Recio,E., Aparicio,J.F., and Martin,J.F. (2002). Characterization of the hom-thrC-thrB cluster in aminoethoxyvinylglycine-producing Streptomyces sp. NRRL 5331. Microbiology 148, 1413-1420. Fischer,F., Raimondi,D., Aliverti,A., and Zanetti,G. (2002). Mycobacterium tuberculosis FprA, a novel bacterial NADPH-ferredoxin reductase. Eur. J. Biochem. 269, 3005-3013. Fisher,S.H. (1989). Glutamate synthesis in Streptomyces coelicolor. J. Bacteriol. 171, 2372-2377. Fisher,S.H. and Wray,L.V., Jr. (1989). Regulation of glutamine synthetase in Streptomyces coelicolor. J. Bacteriol. 171, 2378-2383. Flett,F., Platt,J., and Cullum,J. (1987). DNA rearrangements associated with instability of an arginine gene in Streptomyces coelicolor A3(2). J. Basic Microbiol. 27, 3-10. Galamba,A., Soetaert,K., Buyssens,P., Monnaie,D., Jacobs,P., and Content,J. (2001). Molecular and biochemical characterisation of Mycobacterium smegmatis alcohol dehydrogenase C. FEMS Microbiol. Lett. 196, 51-56.
188
Galamba,A., Soetaert,K., Wang,X.M., De Bruyn,J., Jacobs,P., and Content,J. (2001). Disruption of adhC reveals a large duplication in the Mycobacterium smegmatis mc(2)155 genome. Microbiology 147, 3281-3294. Garg, S.K., Alam, M.S., Kishan, K.V., and Agrawal, P. (2007) Expression and characterization of alpha-(1,4)-glucan branching enzyme Rv1326c of Mycobacterium tuberculosis H37Rv. Protein Expr. Purif. 51(2), 198-208. Green, M.L., and Karp, P.D. (2004) A Bayesian method for identifying missing enzymes in predicted metabolic pathway databases. BMC Bioinformatics 5. Gurcha, S.S., Baulard, A.R., Kremer, L., Locht, C., Moody, D.B., Muhlecker, W., Costello, C.E., Crick, D.C., Brennan, P.J., and Besra, G.S. (2002) Ppm1, a novel polyprenol monophosphomannose synthase from Mycobacterium tuberculosis. Biochem. J. 365(Pt 2), 441-50. Guy, M.R., Illarionov, P.A., Gurcha, S.S., Dover, L.G., Gibson, K.J., Smith, P.W., Minnikin, D.E., and Besra, G.S. (2004) Novel prenyl-linked benzophenone substrate analogues of mycobacterial mannosyltransferases. Biochem. J. 382(Pt 3), 905-12. Harth,G., Zamecnik,P.C., Tang,J.Y., Tabatadze,D., and Horwitz,M.A. (2000). Treatment of Mycobacterium tuberculosis with antisense oligonucleotides to glutamine synthetase mRNA inhibits glutamine synthetase activity, formation of the poly-L-glutamate/glutamine cell wall structure, and bacterial replication. Proc. Natl. Acad. Sci. U. S. A 97, 418-423. Hindle,Z., Callis,R., Dowden,S., Rudd,B.A., and Baumberg,S. (1994). Cloning and expression in Escherichia coli of a Streptomyces coelicolor A3(2) argCJB gene cluster. Microbiology 140 ( Pt 2), 311-320. Hodgson,D.A. (2000). Primary metabolism and its control in streptomycetes: a most unusual group of bacteria. Adv. Microb. Physiol 42, 47-238. Hood,D.W., Heidstra,R., Swoboda,U.K., and Hodgson,D.A. (1992). Molecular genetic analysis of proline and tryptophan biosynthesis in Streptomyces coelicolor A3(2): interaction between primary and secondary metabolism--a review. Gene 115, 5-12. Hsieh,P.C., Shenoy,B.C., Samols,D., and Phillips,N.F. (1996). Cloning, expression, and characterization of polyphosphate glucokinase from Mycobacterium tuberculosis. J. Biol. Chem. 271, 4909-4915. Huang,H., Scherman,M.S., D'Haeze,W., Vereecke,D., Holsters,M., Crick,D.C., and McNeil,M.R. (2005). Identification and active expression of the Mycobacterium tuberculosis gene encoding 5-phospho-{alpha}-d-ribose-1-diphosphate: decaprenyl-phosphate 5-phosphoribosyltransferase, the first enzyme committed to decaprenylphosphoryl-d-arabinose synthesis. J. Biol. Chem. 280, 24539-24543.
189
Ikeda,M., Kamada,N., Takano,Y., and Nakano,T. (1999). Molecular analysis of the Corynebacterium glutamicum transketolase gene. Biosci. Biotechnol. Biochem. 63, 1806-1810. Jackson,M., Phalen,S.W., Lagranderie,M., Ensergueix,D., Chavarot,P., Marchal,G., McMurray,D.N., Gicquel,B., and Guilhot,C. (1999). Persistence and protective efficacy of a Mycobacterium tuberculosis auxotroph vaccine. Infect. Immun. 67, 2867-2873. Kaur,D., Brennan,P.J., and Crick,D.C. (2004). Decaprenyl diphosphate synthesis in Mycobacterium tuberculosis. J. Bacteriol. 186 , 7564-7570. Kawai,S., Mori,S., Mukai,T., Suzuki,S., Yamada,T., Hashimoto,W., and Murata,K. (2000). Inorganic Polyphosphate/ATP-NAD kinase of Micrococcus flavus and Mycobacterium tuberculosis H37Rv. Biochem. Biophys. Res. Commun. 276, 57-63. Kemp,L.E., Bond,C.S., and Hunter,W.N. (2002). Structure of 2C-methyl-D-erythritol 2,4- cyclodiphosphate synthase: an essential enzyme for isoprenoid biosynthesis and target for antimicrobial drug development. Proc. Natl. Acad. Sci. U. S. A 99, 6591-6596. Kern,B.A. and Inamine,E. (1981). Cystathionine gamma-lyase activity in the cephamycin C producer Streptomyces lactamdurans. J. Antibiot. (Tokyo) 34, 583-589. Kim,D.J., Huh,J.H., Yang,Y.Y., Kang,C.M., Lee,I.H., Hyun,C.G., Hong,S.K., and Suh,J.W. (2003). Accumulation of S-adenosyl-L-methionine enhances production of actinorhodin but inhibits sporulation in Streptomyces lividans TK23. J. Bacteriol. 185, 592-600. Koffas,M., Roberge,C., Lee,K., and Stephanopoulos,G. (1999). Metabolic engineering. Annu. Rev. Biomed. Eng 1, 535-557. Kolattukudy,P.E., Fernandes,N.D., Azad,A.K., Fitzmaurice,A.M., and Sirakova,T.D. (1997). Biochemistry and molecular genetics of cell-wall lipid biosynthesis in mycobacteria. Mol. Microbiol. 24, 263-270. Kordulakova, J., Gilleron, M., Puzo, G., Brennan, P.J., Gicquel, B., Mikusova, K., and Jackson, M. (2003) Identification of the required acyltransferase step in the biosynthesis of the phosphatidylinositol mannosides of mycobacterium species. J. Biol. Chem. 278(38), 36285-95. Kremer, L., Gurcha, S.S., Bifani, P., Hitchen, P.G., Baulard, A., Morris, H.R., Dell, A., Brennan, P.J., and Besra, G.S. (2002) Characterization of a putative alpha-mannosyltransferase involved in phosphatidylinositol trimannoside biosynthesis in Mycobacterium tuberculosis. Biochem. J. 363(Pt 3), 437-47.
190

Krithika, R., Marathe, U., Saxena, P., Ansari, M.Z., Mohanty, D., and Gokhale, R.S. (2006) A genetic locus required for iron acquisition in Mycobacterium tuberculosis. Proc. Natl. Acad. Sci. U. S. A. 103(7), 2069-74. Lamichhane,G., Zignol,M., Blades,N.J., Geiman,D.E., Dougherty,A., Grosset,J., Broman,K.W., and Bishai,W.R. (2003). A postgenomic method for predicting essential genes at subsaturation levels of mutagenesis: application to Mycobacterium tuberculosis. Proc. Natl. Acad. Sci. U. S. A 100, 7213-7218. Le,Y., He,J., and Vining,L.C. (1996). Streptomyces akiyoshiensis differs from other gram-positive bacteria in the organization of a core biosynthetic pathway gene for aspartate family amino acids. Microbiology 142 ( Pt 4), 791-798. Ledwidge,R. and Blanchard,J.S. (1999). The dual biosynthetic capability of N-acetylornithine aminotransferase in arginine and lysine biosynthesis. Biochemistry 38, 3019-3024. Lee,S.H. and Lee,K.J. (1993). Aspartate aminotransferase and tylosin biosynthesis in Streptomyces fradiae. Appl. Environ. Microbiol. 59, 822-827. Li,D.W., Xiao,C.L., and Guan,Y. (2004). [Clone and expression of isocitrate lyase gene in Mycobacterium tuberculosis H37Rv]. Zhongguo Yi. Xue. Ke. Xue. Yuan Xue. Bao. 26, 368-371. Mahadevan,U. and Padmanaban,G. (1998). Cloning and expression of an acyl-CoA dehydrogenase from Mycobacterium tuberculosis. Biochem. Biophys. Res. Commun. 244, 893-897. Matsunaga,I., Bhatt,A., Young,D.C., Cheng,T.Y., Eyles,S.J., Besra,G.S., Briken,V., Porcelli,S.A., Costello,C.E., Jacobs,W.R., Jr., and Moody,D.B. (2004). Mycobacterium tuberculosis pks12 produces a novel polyketide presented by CD1c to T cells. J. Exp. Med. 200, 1559-1569. Mendelovitz,S. and Aharonowitz,Y. (1982). Regulation of cephamycin C synthesis, aspartokinase, dihydrodipicolinic acid synthetase, and homoserine dehydrogenase by aspartic acid family amino acids in Streptomyces clavuligerus. Antimicrob. Agents Chemother. 21, 74-84. Mikusova, K., Belanova, M., Kordulakova, J., Honda, K., McNeil, M.R., Mahapatra, S., Crick, D.C., and Brennan, P.J. (2006) Identification of a novel galactosyl transferase involved in biosynthesis of the mycobacterial cell wall. J. Bacteriol. 188(18), 6592-8. Mikusova,K., Huang,H., Yagi,T., Holsters,M., Vereecke,D., D'Haeze,W., Scherman,M.S., Brennan,P.J., McNeil,M.R., and Crick,D.C. (2005). Decaprenylphosphoryl arabinofuranose, the donor of the D-arabinofuranosyl residues of mycobacterial arabinan, is formed via a two-step epimerization of decaprenylphosphoryl ribose. J. Bacteriol. 187, 8020-8025.
191

Morita, Y.S., Velasquez, R., Taig, E., Waller, R.F., Patterson, J.H., Tull, D., Williams, S.J., Billman-Jacobe, H., and McConville, M.J. (2005) Compartmentalization of lipid biosynthesis in mycobacteria. J. Biol. Chem. 280(22), 21645-52. Mougous,J.D., Green,R.E., Williams,S.J., Brenner,S.E., and Bertozzi,C.R. (2002). Sulfotransferases and sulfatases in mycobacteria. Chem. Biol. 9, 767-776. Movahedzadeh,F., Rison,S.C., Wheeler,P.R., Kendall,S.L., Larson,T.J., and Stoker,N.G. (2004). The Mycobacterium tuberculosis Rv1099c gene encodes a GlpX-like class II fructose 1,6-bisphosphatase. Microbiology 150, 3499-3505. Movahedzadeh,F., Smith,D.A., Norman,R.A., Dinadayala,P., Murray-Rust,J., Russell,D.G., Kendall,S.L., Rison,S.C., McAlister,M.S., Bancroft,G.J., McDonald,N.Q., Daffe,M., Av-Gay,Y., and Stoker,N.G. (2004). The Mycobacterium tuberculosis ino1 gene is essential for growth and virulence. Mol. Microbiol. 51, 1003-1014. Munoz-Elias,E.J., Upton,A.M., Cherian,J., and McKinney,J.D. (2006). Role of the methylcitrate cycle in Mycobacterium tuberculosis metabolism, intracellular growth, and virulence. Mol. Microbiol. 60, 1109-1122. Murphy, H.N., Stewart, G.R., Mischenko, V.V., Apt, A.S., Harris, R,, McAlister, M.S., Driscoll, P.C., Young, D.B., and Robertson, B.D. (2005) The OtsAB pathway is essential for trehalose biosynthesis in Mycobacterium tuberculosis. J. Biol. Chem. 280(15), 14524-9. Nagasawa,T., Kanzaki,H., and Yamada,H. (1984). Cystathionine gamma-lyase of Streptomyces phaeochromogenes. The occurrence of cystathionine gamma-lyase in filamentous bacteria and its purification and characterization. J. Biol. Chem. 259, 10393-10403. Nagasawa,T., Kanzaki,H., and Yamada,H. (1987). Cystathionine gamma-lyase from Streptomyces phaeochromogenes. Methods Enzymol. 143, 486-492. Nassau,P.M., Martin,S.L., Brown,R.E., Weston,A., Monsey,D., McNeil,M.R., and Duncan,K. (1996). Galactofuranose biosynthesis in Escherichia coli K-12: identification and cloning of UDP-galactopyranose mutase. J. Bacteriol. 178, 1047-1052. Newton,G.L., Koledin,T., Gorovitz,B., Rawat,M., Fahey,R.C., and Av-Gay,Y. (2003). The glycosyltransferase gene encoding the enzyme catalyzing the first step of mycothiol biosynthesis (mshA). J. Bacteriol. 185, 3476-3479. Okamoto,S., Lezhava,A., Hosaka,T., Okamoto-Hosoya,Y., and Ochi,K. (2003). Enhanced expression of S-adenosylmethionine synthetase causes overproduction of actinorhodin in Streptomyces coelicolor A3(2). J. Bacteriol. 185, 601-609.
192
Onwueme,K.C., Vos,C.J., Zurita,J., Ferreras,J.A., and Quadri,L.E. (2005). The dimycocerosate ester polyketide virulence factors of mycobacteria. Prog. Lipid Res. 44, 259-302. Onwueme,K.C., Vos,C.J., Zurita,J., Soll,C.E., and Quadri,L.E. (2005). Identification of phthiodiolone ketoreductase, an enzyme required for production of mycobacterial diacyl phthiocerol virulence factors. J. Bacteriol. 187, 4760-4766. Patek,M., Hochmannova,J., Jelinkova,M., Nesvera,J., and Eggeling,L. (1998). Analysis of the leuB gene from Corynebacterium glutamicum. Appl. Microbiol. Biotechnol. 50, 42-47. Patterson,J.H., Waller,R.F., Jeevarajah,D., Billman-Jacobe,H., and McConville,M.J. (2003). Mannose metabolism is required for mycobacterial growth. Biochem. J. 372, 77-86. Perez,E., Constant,P., Laval,F., Lemassu,A., Laneelle,M.A., Daffe,M., and Guilhot,C. (2004). Molecular dissection of the role of two methyltransferases in the biosynthesis of phenolglycolipids and phthiocerol dimycoserosate in the Mycobacterium tuberculosis complex. J. Biol. Chem. 279, 42584-42592. Pinto,R., Tang,Q.X., Britton,W.J., Leyh,T.S., and Triccas,J.A. (2004). The Mycobacterium tuberculosis cysD and cysNC genes form a stress-induced operon that encodes a tri-functional sulfate-activating complex. Microbiology 150, 1681-1686. Portevin,D., Sousa-D'Auria,C., Montrozier,H., Houssin,C., Stella,A., Laneelle,M.A., Bardou,F., Guilhot,C., and Daffe,M. (2005). The acyl-AMP ligase FadD32 and AccD4-containing acyl-CoA carboxylase are required for the synthesis of mycolic acids and essential for mycobacterial growth: identification of the carboxylation product and determination of the acyl-CoA carboxylase components. J. Biol. Chem. 280, 8862-8874. Prakash,P., Aruna,B., Sardesai,A.A., and Hasnain,S.E. (2005). Purified recombinant hypothetical protein coded by open reading frame Rv1885c of Mycobacterium tuberculosis exhibits a monofunctional AroQ class of periplasmic chorismate mutase activity. J. Biol. Chem. 280, 19641-19648. Reddy,S.K., Kamireddi,M., Dhanireddy,K., Young,L., Davis,A., and Reddy,P.T. (2001). Eukaryotic-like adenylyl cyclases in Mycobacterium tuberculosis H37Rv: cloning and characterization. J. Biol. Chem. 276, 35141-35149. Rengarajan,J., Sassetti,C.M., Naroditskaya,V., Sloutsky,A., Bloom,B.R., and Rubin,E.J. (2004). The folate pathway is a target for resistance to the drug para-aminosalicylic acid (PAS) in mycobacteria. Mol. Microbiol. 53, 275-282. Rizzi,C., Frazzon,J., Ely,F., Weber,P.G., da Fonseca,I.O., Gallas,M., Oliveira,J.S., Mendes,M.A., de Souza,B.M., Palma,M.S., Santos,D.S., and Basso,L.A. (2005).
193

DAHP synthase from Mycobacterium tuberculosis H37Rv: cloning, expression, and purification of functional enzyme. Protein Expr. Purif. 40, 23-30. Roos,A.K., Burgos,E., Ericsson,D.J., Salmon,L., and Mowbray,S.L. (2005). Competitive inhibitors of Mycobacterium tuberculosis ribose-5-phosphate isomerase B reveal new information about the reaction mechanism. J. Biol. Chem. 280, 6416-6422. Rousseau,C., Neyrolles,O., Bordat,Y., Giroux,S., Sirakova,T.D., Prevost,M.C., Kolattukudy,P.E., Gicquel,B., and Jackson,M. (2003). Deficiency in mycolipenate- and mycosanoate-derived acyltrehaloses enhances early interactions of Mycobacterium tuberculosis with host cells. Cell Microbiol. 5, 405-415. Rousseau,C., Sirakova,T.D., Dubey,V.S., Bordat,Y., Kolattukudy,P.E., Gicquel,B., and Jackson,M. (2003). Virulence attenuation of two Mas-like polyketide synthase mutants of Mycobacterium tuberculosis. Microbiology 149, 1837-1847. Sacco, E., Legendre, V., Laval, F., Zerbib, D., Montrozier, H., Eynard, N., Guilhot, C., Daffe, M., and Quemard, A. (2007) Rv3389C from Mycobacterium tuberculosis, a member of the (R)-specific hydratase/dehydratase family. Biochim. Biophys. Acta. 1774(2), 303-11. Sambandamurthy,V.K., Wang,X., Chen,B., Russell,R.G., Derrick,S., Collins,F.M., Morris,S.L., and Jacobs,W.R., Jr. (2002). A pantothenate auxotroph of Mycobacterium tuberculosis is highly attenuated and protects mice against tuberculosis. Nat. Med. 8, 1171-1174. Sambandamurthy,V.K., Wang,X., Chen,B., Russell,R.G., Derrick,S., Collins,F.M., Morris,S.L., and Jacobs,W.R., Jr. (2002). A pantothenate auxotroph of Mycobacterium tuberculosis is highly attenuated and protects mice against tuberculosis. Nat. Med. 8, 1171-1174. Sareen,D., Newton,G.L., Fahey,R.C., and Buchmeier,N.A. (2003). Mycothiol is essential for growth of Mycobacterium tuberculosis Erdman. J. Bacteriol. 185, 6736-6740. Sasso,S., Ramakrishnan,C., Gamper,M., Hilvert,D., and Kast,P. (2005). Characterization of the secreted chorismate mutase from the pathogen Mycobacterium tuberculosis. FEBS J. 272, 375-389. Schaeffer, M.L., Khoo, K.H., Besra, G.S., Chatterjee, D., Brennan, P.J., Belisle, J.T., and Inamine, J.M. (1999) The pimB gene of Mycobacterium tuberculosis encodes a mannosyltransferase involved in lipoarabinomannan biosynthesis. J. Biol. Chem. 274(44), 31625-31. Schnell,R., Sandalova,T., Hellman,U., Lindqvist,Y., and Schneider,G. (2005). Siroheme- and [Fe4-S4]-dependent NirA from Mycobacterium tuberculosis is a
194

sulfite reductase with a covalent Cys-Tyr bond in the active site. J. Biol. Chem. 280, 27319-27328. Sharma, S.C., Jayaram, H.N., and Ramakrishnan, T. (1973) L-asparaginase activity in mycobacteria. Am. Rev. Respir. Dis. 108(3), 688-9. Sharma,V., Grubmeyer,C., and Sacchettini,J.C. (1998). Crystal structure of quinolinic acid phosphoribosyltransferase from Mmycobacterium tuberculosis: a potential TB drug target. Structure. 6, 1587-1599. Shenoy, A.R., Sreenath, N., Podobnik, M., Kovacevic, M., and Visweswariah, S.S. (2005) The Rv0805 gene from Mycobacterium tuberculosis encodes a 3',5'-cyclic nucleotide phosphodiesterase: biochemical and mutational analysis. Biochemistry. 44(48), 15695-704. Shimizu,S., Shiozaki,S., Ohshiro,T., and Yamada,H. (1984). Occurrence of S-adenosylhomocysteine hydrolase in prokaryote cells. Characterization of the enzyme from Alcaligenes faecalis and role of the enzyme in the activated methyl cycle. Eur. J. Biochem. 141, 385-392. Sirakova,T.D., Thirumala,A.K., Dubey,V.S., Sprecher,H., and Kolattukudy,P.E. (2001). The Mycobacterium tuberculosis pks2 gene encodes the synthase for the hepta- and octamethyl-branched fatty acids required for sulfolipid synthesis. J. Biol. Chem. 276, 16833-16839. Smith,D.A., Parish,T., Stoker,N.G., and Bancroft,G.J. (2001). Characterization of auxotrophic mutants of Mycobacterium tuberculosis and their potential as vaccine candidates. Infect. Immun. 69, 1142-1150. Sohaskey, C.D., and Wayne, L.G. (2003) Role of narK2X and narGHJI in hypoxic upregulation of nitrate reduction by Mycobacterium tuberculosis. J. Bacteriol. 185(24), 7247-56. Stadthagen,G., Kordulakova,J., Griffin,R., Constant,P., Bottova,I., Barilone,N., Gicquel,B., Daffe,M., and Jackson,M. (2005). p-Hydroxybenzoic acid synthesis in Mycobacterium tuberculosis. J. Biol. Chem. 280, 40699-40706. Sugantino,M., Zheng,R., Yu,M., and Blanchard,J.S. (2003). Mycobacterium tuberculosis ketopantoate hydroxymethyltransferase: tetrahydrofolate-independent hydroxymethyltransferase and enolization reactions with alpha-keto acids. Biochemistry 42, 191-199. Takahashi,S., Kuzuyama,T., Watanabe,H., and Seto,H. (1998). A 1-deoxy-D-xylulose 5-phosphate reductoisomerase catalyzing the formation of 2-C-methyl-D-erythritol 4-phosphate in an alternative nonmevalonate pathway for terpenoid biosynthesis. Proc. Natl. Acad. Sci. U. S. A 95, 9879-9884. Takayama,K., Wang,C., and Besra,G.S. (2005). Pathway to synthesis and processing of mycolic acids in Mycobacterium tuberculosis. Clin. Microbiol. Rev. 18, 81-101.
195
Tammenkoski,M., Benini,S., Magretova,N.N., Baykov,A.A., and Lahti,R. (2005). An unusual, His-dependent family I pyrophosphatase from Mycobacterium tuberculosis. J. Biol. Chem. 280, 41819-41826. Tarnok,I., Pechmann,H., Krallmann-Wenzel,U., Rohrscheidt,E., and Tarnok,Z. (1979). [Nicotinamidase and the so-called pyrazinamidase in mycobacteria; the simultaneous occurrence of both activites (author's transl)]. Zentralbl. Bakteriol. [Orig. A] 244, 302-308. Tatituri, R.V., Illarionov, P.A., Dover, L.G., Nigou, J., Gilleron, M., Hitchen, P., Krumbach, K., Morris, H.R., Spencer, N., Dell, A., Eggeling, L., and Besra, G.S. (2007) Inactivation of Corynebacterium glutamicum NCgl0452 and the role of MgtA in the biosynthesis of a novel mannosylated glycolipid involved in lipomannan biosynthesis. J. Biol. Chem. 282(7), 4561-72. Tian,J., Bryk,R., Itoh,M., Suematsu,M., and Nathan,C. (2005). Variant tricarboxylic acid cycle in Mycobacterium tuberculosis: identification of alpha-ketoglutarate decarboxylase. Proc. Natl. Acad. Sci. U. S. A 102, 10670-10675. Truglio,J.J., Theis,K., Feng,Y., Gajda,R., Machutta,C., Tonge,P.J., and Kisker,C. (2003). Crystal structure of Mycobacterium tuberculosis MenB, a key enzyme in vitamin K2 biosynthesis. J. Biol. Chem. 278, 42352-42360. Tullius,M.V., Harth,G., and Horwitz,M.A. (2001). High extracellular levels of Mycobacterium tuberculosis glutamine synthetase and superoxide dismutase in actively growing cultures are due to high expression and extracellular stability rather than to a protein-specific export mechanism. Infect. Immun. 69, 6348-6363. Uppsten,M., Davis,J., Rubin,H., and Uhlin,U. (2004). Crystal structure of the biologically active form of class Ib ribonucleotide reductase small subunit from Mycobacterium tuberculosis. FEBS Lett. 569, 117-122. Vaishnav,P., Randev,S., Jatiani,S., Aggarwal,S., Keharia,H., Vyas,P.R., Nareshkumar,G., and Archana,G. (2000). Characterization of carbamoyl phosphate synthetase of Streptomyces spp. Indian J. Exp. Biol. 38, 931-935. Vargha,G. (1997). A possible role of the effect of methionine on the activity of aspartokinase in sporulation of a Streptomyces fradiae mutant. Acta Biol. Hung. 48, 281-288. Vetting, M., Roderick, S.L., Hegde, S., Magnet, S., and Blanchard, J.S. (2003) What can structure tell us about in vivo function? The case of aminoglycoside-resistance genes. Biochem. Soc. Trans. 31(Pt 3), 520-2. Vetting, M.W., Hegde, S.S., Javid-Majd, F., Blanchard, J.S., and Roderick, S.L. (2002) Aminoglycoside 2'-N-acetyltransferase from Mycobacterium tuberculosis in complex with coenzyme A and aminoglycoside substrates. Nat. Struct. Biol. 9(9), 653-8.
196

197
Wheeler,P.R., Coldham,N.G., Keating,L., Gordon,S.V., Wooff,E.E., Parish,T., and Hewinson,R.G. (2005). Functional demonstration of reverse transsulfuration in the Mycobacterium tuberculosis complex reveals that methionine is the preferred sulfur source for pathogenic Mycobacteria. J. Biol. Chem. 280, 8069-8078. White,P.J., Young,J., Hunter,I.S., Nimmo,H.G., and Coggins,J.R. (1990). The purification and characterization of 3-dehydroquinase from Streptomyces coelicolor. Biochem. J. 265, 735-738. Whitney,J.G., Brannon,D.R., Mabe,J.A., and Wicker,K.J. (1972). Incorporation of labeled precursors into A16886B, a novel -lactam antibiotic produced by Streptomyces clavuligerus. Antimicrob. Agents Chemother. 1, 247-251. Wilkin, J.M., Soetaert, K., Stelandre, M., Buyssens, P., Castillo, G., Demoulin, V., Bottu, G., Laneelle, M.A., Daffe, M., and De Bruyn, J. (1999) Overexpression, purification and characterization of Mycobacterium bovis BCG alcohol dehydrogenase. Eur. J. Biochem. 262(2), 299-307. Williams,S.J., Senaratne,R.H., Mougous,J.D., Riley,L.W., and Bertozzi,C.R. (2002). 5'-adenosinephosphosulfate lies at a metabolic branch point in mycobacteria. J. Biol. Chem. 277, 32606-32615. Wolucka, B.A., and Communi, D. (2006) Mycobacterium tuberculosis possesses a functional enzyme for the synthesis of vitamin C, L-gulono-1,4-lactone dehydrogenase. FEBS J. 273(19), 4435-45. Wray,L.V., Jr. and Fisher,S.H. (1988). Cloning and nucleotide sequence of the Streptomyces coelicolor gene encoding glutamine synthetase. Gene 71, 247-256. Yang, X., Dubnau, E., Smith, I., and Sampson, N.S. (2007) Rv1106c from Mycobacterium tuberculosis is a 3beta-hydroxysteroid dehydrogenase. Biochemistry. 46(31), 9058-67. Zhang,W., Jiang,W., Zhao,G., Yang,Y., and Chiao,J. (1999). Sequence analysis and expression of the aspartokinase and aspartate semialdehyde dehydrogenase operon from rifamycin SV-producing amycolatopsis mediterranei. Gene 237, 413-419. Zimhony,O., Cox,J.S., Welch,J.T., Vilcheze,C., and Jacobs,W.R., Jr. (2000). Pyrazinamide inhibits the eukaryotic-like fatty acid synthetase I (FASI) of Mycobacterium tuberculosis. Nat. Med. 6, 1043-1047.