march 2017 redondo beach real estate market trends update
TRANSCRIPT


Table of
Contents
Key Statistics for March
Sales 2017 Residential Sales Stats Year-to-Year Total Sales by Map Area Median 2017 Median Sales Stats Year-to-Year Median Sales by Map Area Listings 2017 Active Listings by Map Area 2017 Total Active Listings vs. Total Sales Year-to-Year Active Listings by Map Area Inventory 2017 Months of Inventory by Map Area Year-to-Year Months of Inventory
Summary
About Hady Chahine Contact Information

Key Statistics for March
Back to Table of Contents
= trending positive = trending positive
= trending negative = trending negative
Month-to-Month Comparison Feb 2017 Mar 2017 Delta (qty) Delta (%) Increase Decrease
Total Sales 49 70 21 42.9%
Median Sales Price 900,000 994,000 94,000 10.4%
Median Days to Sell 30 11 -19 -63.3%
Listings 99 124 25 25.3%
Sales/Listing Ratio 49.5% 56.5% 7.0% 14.1%
Months of Inventory 2.0 2.0 0.0 0.0%
Monthly Comparison Year-to-Year Mar 2016 Mar 2017 Delta Delta Increase Decrease
Total Sales 73 70 -3 -4.1%
Median Sales Price 915,000 994,000 79,000 8.6%
Median Days to Sell 29 11 -18 -62.1%
Listings 94 124 30 31.9%
Months of Inventory 2.0 2.0 0 0.0%

Back to Table of Contents
Total Sales Month-to-Month by Map Area Jan Feb Mar
N Redondo Beach/Villas North 10 10 12
S Redondo Beach W of PCH 6 4 13
N Redondo Beach/Villas South 4 19 14
S Redondo Beach S of Torrance Blvd 4 8 9
S Redondo Beach N of Torrance Blvd 2 4 7
N Redondo Beach/Golden Hills 7 4 12
N Redondo Beach/El Nido 1 - 3
Total Sales 34 49 70
-
10
20
30
40
50
60
70
Jan Feb Mar
2017 Total Sales Month-to-Month by Map Area
N Redondo Beach/Villas North
S Redondo Beach W of PCH
N Redondo Beach/Villas South
S Redondo Beach S of Torrance Blvd
S Redondo Beach N of Torrance Blvd
N Redondo Beach/Golden Hills
N Redondo Beach/El Nido
Total Sales
Back to Table of Contents
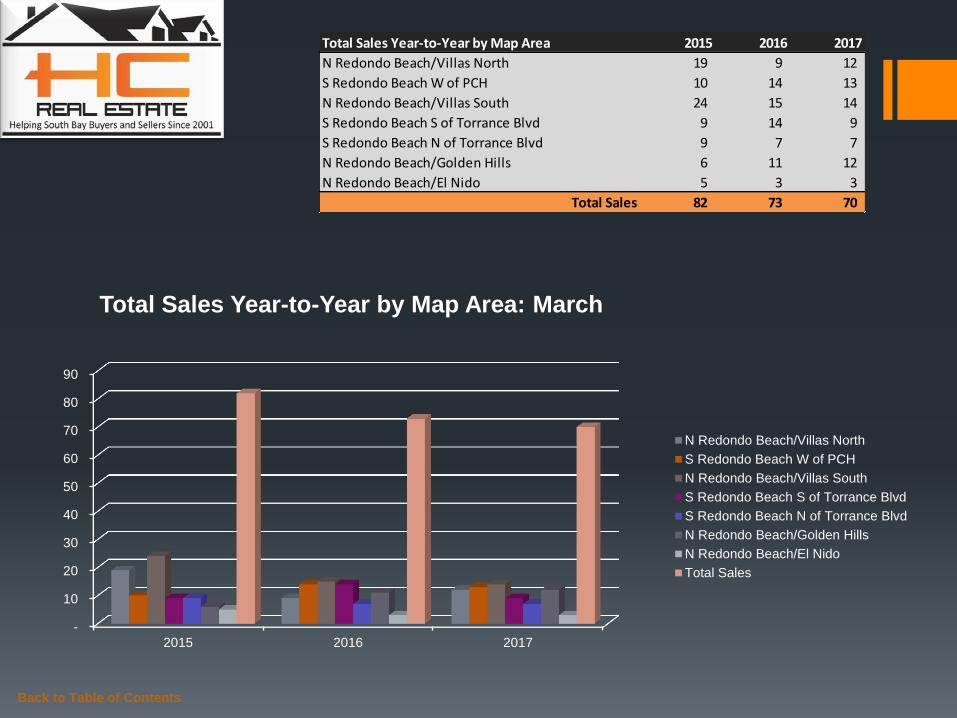
Total Sales Year-to-Year by Map Area 2015 2016 2017
N Redondo Beach/Villas North 19 9 12
S Redondo Beach W of PCH 10 14 13
N Redondo Beach/Villas South 24 15 14
S Redondo Beach S of Torrance Blvd 9 14 9
S Redondo Beach N of Torrance Blvd 9 7 7
N Redondo Beach/Golden Hills 6 11 12
N Redondo Beach/El Nido 5 3 3
Total Sales 82 73 70
-
10
20
30
40
50
60
70
80
90
2015 2016 2017
Total Sales Year-to-Year by Map Area: March
N Redondo Beach/Villas North
S Redondo Beach W of PCH
N Redondo Beach/Villas South
S Redondo Beach S of Torrance Blvd
S Redondo Beach N of Torrance Blvd
N Redondo Beach/Golden Hills
N Redondo Beach/El Nido
Total Sales

Back to Table of Contents
Median Sales Price Month-to-Month by Map Area Jan Feb Mar
N Redondo Beach/Villas North 907,000 982,500 987,000
S Redondo Beach W of PCH 897,500 1,362,500 1,270,000
N Redondo Beach/Villas South 1,067,500 890,000 838,575
S Redondo Beach S of Torrance Blvd 1,097,500 672,500 1,137,500
S Redondo Beach N of Torrance Blvd 1,212,000 1,146,000 1,131,000
N Redondo Beach/Golden Hills 929,000 813,250 1,000,250
N Redondo Beach/El Nido 821,000 - 785,000
Market Median Sales Price 927,000 900,000 994,000
-
200,000
400,000
600,000
800,000
1,000,000
1,200,000
1,400,000
Jan Feb Mar
2017 Median Sales Price Month-to-Month by Map Area
N Redondo Beach/Villas North
S Redondo Beach W of PCH
N Redondo Beach/Villas South
S Redondo Beach S of Torrance Blvd
S Redondo Beach N of Torrance Blvd
N Redondo Beach/Golden Hills
N Redondo Beach/El Nido
Market Median Sales Price
Back to Table of Contents
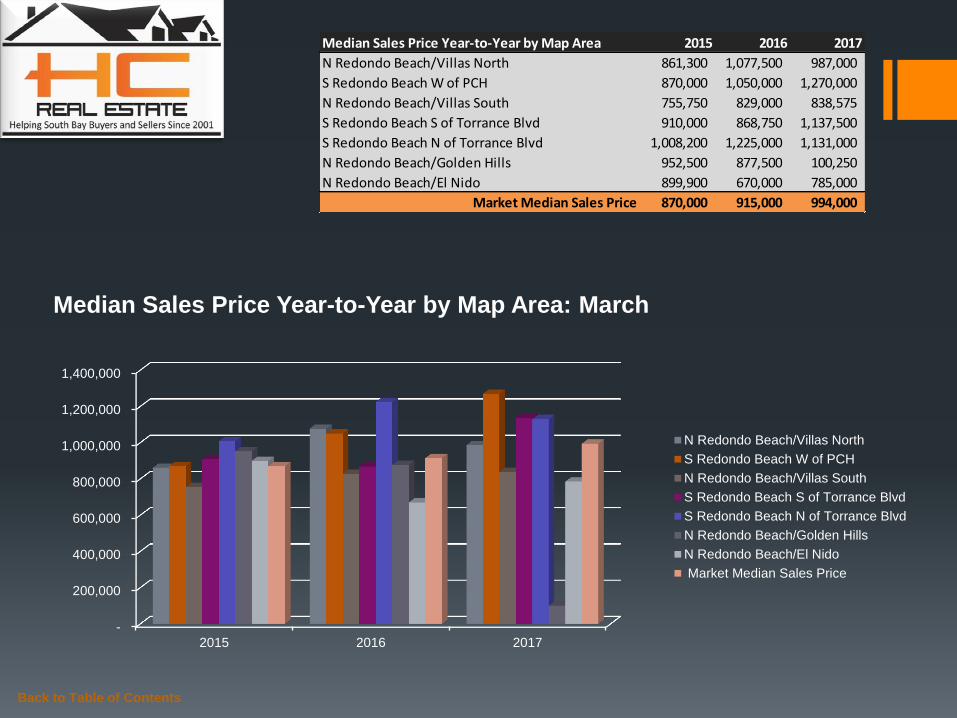
Median Sales Price Year-to-Year by Map Area 2015 2016 2017
N Redondo Beach/Villas North 861,300 1,077,500 987,000
S Redondo Beach W of PCH 870,000 1,050,000 1,270,000
N Redondo Beach/Villas South 755,750 829,000 838,575
S Redondo Beach S of Torrance Blvd 910,000 868,750 1,137,500
S Redondo Beach N of Torrance Blvd 1,008,200 1,225,000 1,131,000
N Redondo Beach/Golden Hills 952,500 877,500 100,250
N Redondo Beach/El Nido 899,900 670,000 785,000
Market Median Sales Price 870,000 915,000 994,000
-
200,000
400,000
600,000
800,000
1,000,000
1,200,000
1,400,000
2015 2016 2017
Median Sales Price Year-to-Year by Map Area: March
N Redondo Beach/Villas North
S Redondo Beach W of PCH
N Redondo Beach/Villas South
S Redondo Beach S of Torrance Blvd
S Redondo Beach N of Torrance Blvd
N Redondo Beach/Golden Hills
N Redondo Beach/El Nido
Market Median Sales Price

Back to Table of Contents
Active Listings vs. Total Sales by Map Area Jan Feb Mar Apr May Jun Jul Aug Sep Oct Nov Dec
N Redondo Beach/Villas North 27 20 21
S Redondo Beach W of PCH 19 19 20
N Redondo Beach/Villas South 27 14 26
S Redondo Beach S of Torrance Blvd 19 14 20
S Redondo Beach N of Torrance Blvd 23 18 16
N Redondo Beach/Golden Hills 14 9 11
N Redondo Beach/El Nido 5 5 10
Total Active Listings 134 99 124
-
5
10
15
20
25
30
Jan Feb Mar Apr May Jun Jul Aug Sep Oct Nov Dec
2017 Active Listings by Map Area
N Redondo Beach/Villas North
S Redondo Beach W of PCH
N Redondo Beach/Villas South
S Redondo Beach S of Torrance Blvd
S Redondo Beach N of Torrance Blvd
N Redondo Beach/Golden Hills
N Redondo Beach/El Nido
Back to Table of Contents
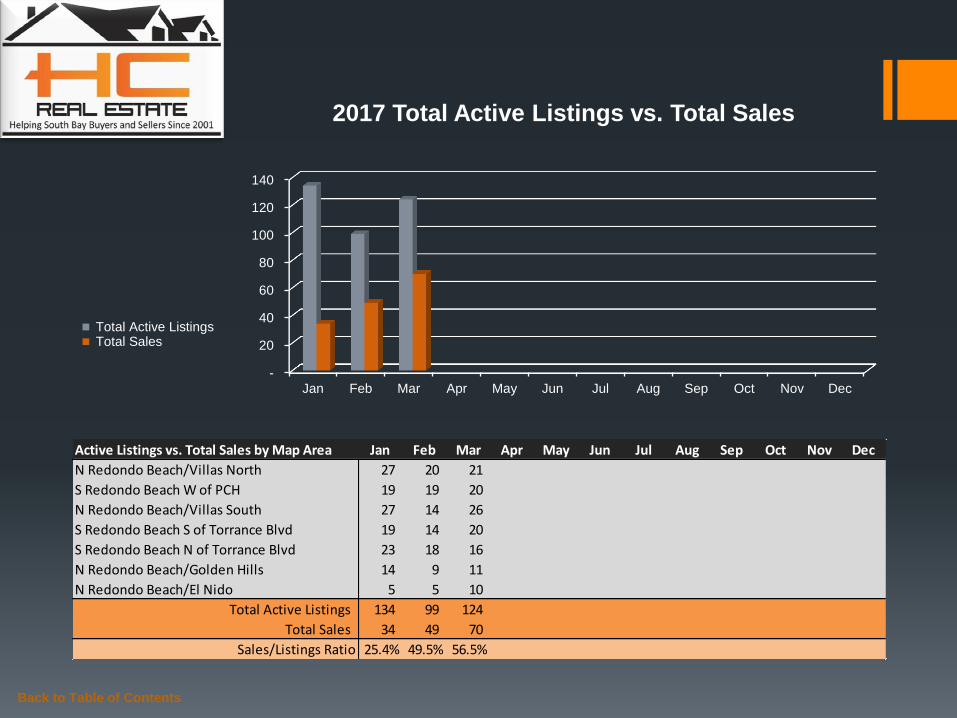
Active Listings vs. Total Sales by Map Area Jan Feb Mar Apr May Jun Jul Aug Sep Oct Nov Dec
N Redondo Beach/Villas North 27 20 21
S Redondo Beach W of PCH 19 19 20
N Redondo Beach/Villas South 27 14 26
S Redondo Beach S of Torrance Blvd 19 14 20
S Redondo Beach N of Torrance Blvd 23 18 16
N Redondo Beach/Golden Hills 14 9 11
N Redondo Beach/El Nido 5 5 10
Total Active Listings 134 99 124
Total Sales 34 49 70
Sales/Listings Ratio 25.4% 49.5% 56.5%
-
20
40
60
80
100
120
140
Jan Feb Mar Apr May Jun Jul Aug Sep Oct Nov Dec
2017 Total Active Listings vs. Total Sales
Total Active Listings Total Sales
Back to Table of Contents
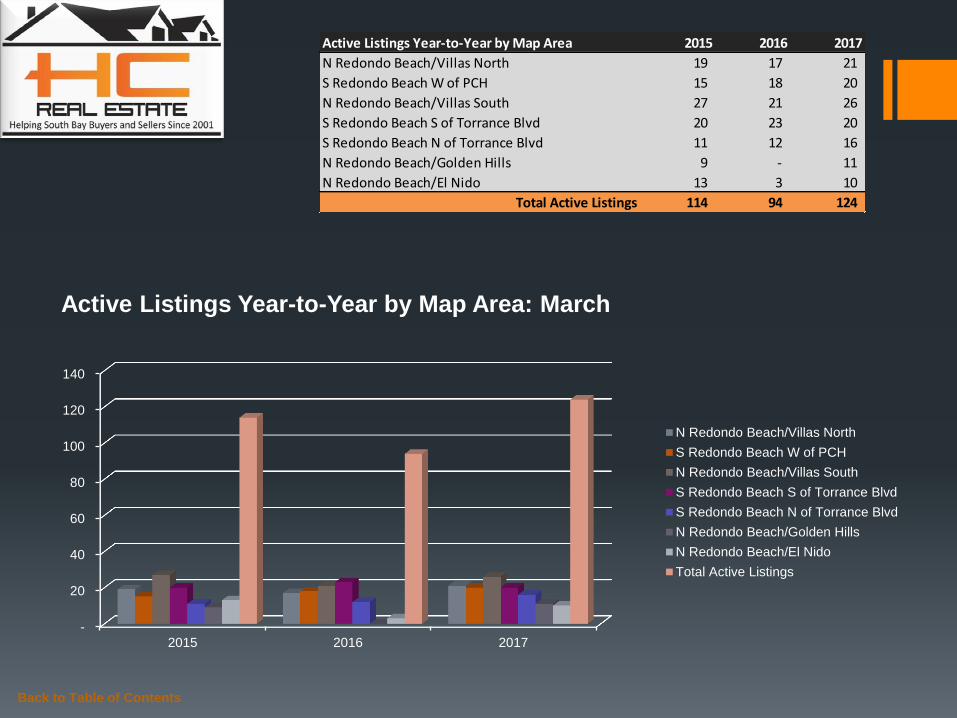
Active Listings Year-to-Year by Map Area 2015 2016 2017
N Redondo Beach/Villas North 19 17 21
S Redondo Beach W of PCH 15 18 20
N Redondo Beach/Villas South 27 21 26
S Redondo Beach S of Torrance Blvd 20 23 20
S Redondo Beach N of Torrance Blvd 11 12 16
N Redondo Beach/Golden Hills 9 - 11
N Redondo Beach/El Nido 13 3 10
Total Active Listings 114 94 124
-
20
40
60
80
100
120
140
2015 2016 2017
Active Listings Year-to-Year by Map Area: March
N Redondo Beach/Villas North
S Redondo Beach W of PCH
N Redondo Beach/Villas South
S Redondo Beach S of Torrance Blvd
S Redondo Beach N of Torrance Blvd
N Redondo Beach/Golden Hills
N Redondo Beach/El Nido
Total Active Listings

Back to Table of Contents
Months of Inventory by Map Area Jan Feb Mar Apr May Jun Jul Aug Sep Oct Nov Dec
N Redondo Beach/Villas North 3.0 2.0 2.0
S Redondo Beach W of PCH 3.0 5.0 2.0
N Redondo Beach/Villas South 7.0 1.0 2.0
S Redondo Beach S of Torrance Blvd 5.0 2.0 2.0
S Redondo Beach N of Torrance Blvd 12.0 5.0 2.0
N Redondo Beach/Golden Hills 2.0 2.0 1.0
N Redondo Beach/El Nido 5.0 - 3.0
-
2.0
4.0
6.0
8.0
10.0
12.0
Jan Feb Mar Apr May Jun Jul Aug Sep Oct Nov Dec
2017 Months of Inventory by Map Area
N Redondo Beach/Villas North
S Redondo Beach W of PCH
N Redondo Beach/Villas South
S Redondo Beach S of Torrance Blvd
S Redondo Beach N of Torrance Blvd
N Redondo Beach/Golden Hills
N Redondo Beach/El Nido
Back to Table of Contents
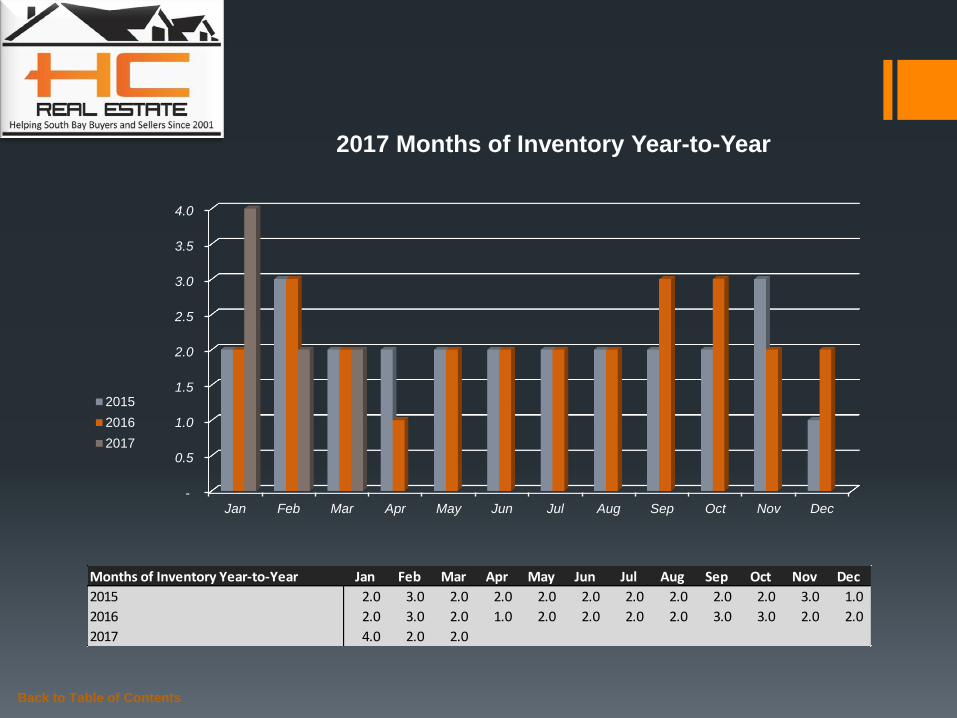
Months of Inventory Year-to-Year Jan Feb Mar Apr May Jun Jul Aug Sep Oct Nov Dec
2015 2.0 3.0 2.0 2.0 2.0 2.0 2.0 2.0 2.0 2.0 3.0 1.0
2016 2.0 3.0 2.0 1.0 2.0 2.0 2.0 2.0 3.0 3.0 2.0 2.0
2017 4.0 2.0 2.0
-
0.5
1.0
1.5
2.0
2.5
3.0
3.5
4.0
Jan Feb Mar Apr May Jun Jul Aug Sep Oct Nov Dec
2017 Months of Inventory Year-to-Year
2015
2016
2017
Summary
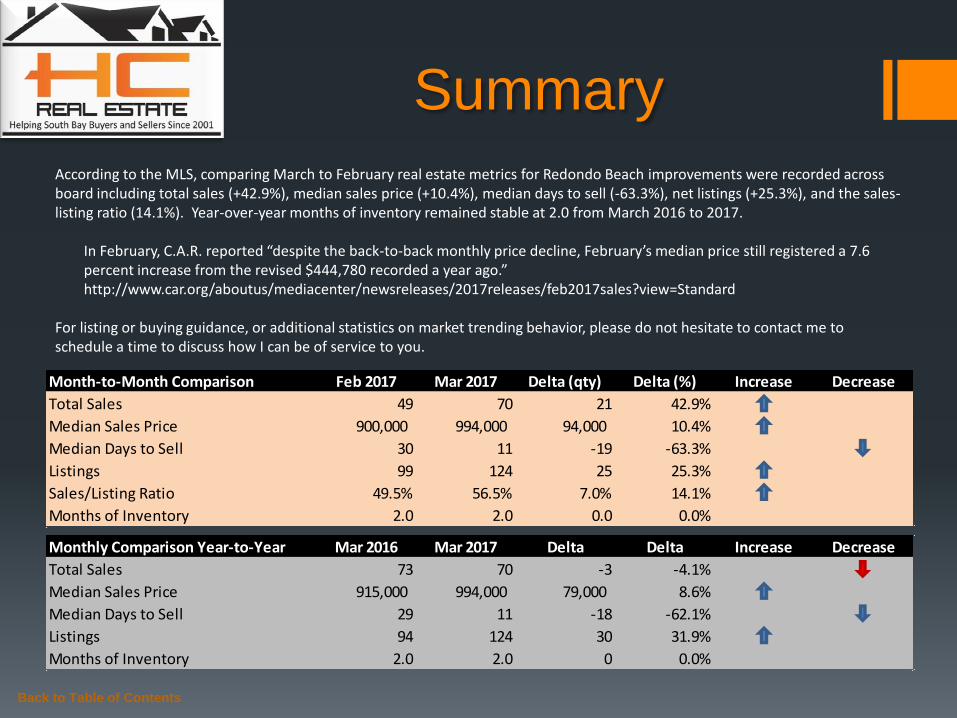
According to the MLS, comparing March to February real estate metrics for Redondo Beach improvements were recorded across board including total sales (+42.9%), median sales price (+10.4%), median days to sell (-63.3%), net listings (+25.3%), and the sales-listing ratio (14.1%). Year-over-year months of inventory remained stable at 2.0 from March 2016 to 2017.
In February, C.A.R. reported “despite the back-to-back monthly price decline, February’s median price still registered a 7.6 percent increase from the revised $444,780 recorded a year ago.” http://www.car.org/aboutus/mediacenter/newsreleases/2017releases/feb2017sales?view=Standard
For listing or buying guidance, or additional statistics on market trending behavior, please do not hesitate to contact me to schedule a time to discuss how I can be of service to you.
Back to Table of Contents
Monthly Comparison Year-to-Year Mar 2016 Mar 2017 Delta Delta Increase Decrease
Total Sales 73 70 -3 -4.1%
Median Sales Price 915,000 994,000 79,000 8.6%
Median Days to Sell 29 11 -18 -62.1%
Listings 94 124 30 31.9%
Months of Inventory 2.0 2.0 0 0.0%
Month-to-Month Comparison Feb 2017 Mar 2017 Delta (qty) Delta (%) Increase Decrease
Total Sales 49 70 21 42.9%
Median Sales Price 900,000 994,000 94,000 10.4%
Median Days to Sell 30 11 -19 -63.3%
Listings 99 124 25 25.3%
Sales/Listing Ratio 49.5% 56.5% 7.0% 14.1%
Months of Inventory 2.0 2.0 0.0 0.0%

Serving South Bay Home Buyers and Sellers Since 2001
RE/MAX Top 4 Team in California – 2012
RE/MAX 100% Club - 2011
Shorewood Realtors Top 5% in Overall Sales 2001-2006, 2008-2010
Back to Table of Contents
About
Hady Chahine…

The information being provided by CARETS (CLAW, CRISNet MLS, DAMLS, CRMLS, i-Tech MLS, and/or VCRDS) is for the visitor’s personal, non-commercial use and may not be used for
any purpose other than to identify prospective properties visitor may be interested in purchasing. Any information relating to a property referenced on this web site comes from the Internet
Data Exchange (IDX) program of CARETS. This web site may reference real estate listing(s) held by a brokerage firm other than the broker and/or agent who owns this web site. The accuracy
of all information, regardless of source, including but not limited to square footages and lot sizes, is deemed reliable but not guaranteed and should be personally verified through personal
inspection by and/or with the appropriate professionals.
Back to Table of Contents
Listings MLS BLOG Website
Hady Chahine
• 310-404-5361