redondo beach real estate market conditions - september 2015
DESCRIPTION
Redondo Beach real estate statistics and analysis for September 2015. Includes home sales, listings, inventory and historical performance on a month-to-month and year-to-year basis.TRANSCRIPT


Table of
Contents
Key Statistics for September
Sales 2015 Residential Sales Stats Year-to-Year Total Sales by Map Area Median 2015 Median Sales Stats Year-to-Year Median Sales by Map Area Listings 2015 Active Listings by Map Area 2015 Total Active Listings vs. Total Sales Year-to-Year Active Listings by Map Area Inventory 2015 Months of Inventory by Map Area Year-to-Year Months of Inventory
Summary
About Hady Chahine Contact Information

Key Statistics for September
Back to Table of Contents
= trending positive = trending positive
= trending negative = trending negative
Month-to-Month Comparison Aug 2015 Sep 2015 Delta (qty) Delta (%) Increase Decrease
Total Sales 75 73 -2 -2.7%
Median Sales Price 795,000 880,000 85,000 10.7%
Median Days to Sell 35 45 10 28.6%
Listings 137 155 18 13.1%
Sales/Listing Ratio 54.7% 47.1% -7.6% -13.9%
Months of Inventory 2.0 2.0 0.0 0.0%
Monthly Comparison Year-to-Year Sep 2014 Sep 2015 Delta Delta Increase Decrease
Total Sales 71 73 2 2.8%
Median Sales Price 780,000 880,000 100,000 12.8%
Median Days to Sell 43 45 2 4.7%
Listings 187 155 -32 -17.1%
Months of Inventory 2.2 2.0 -0.2 -9.1%
Back to Table of Contents
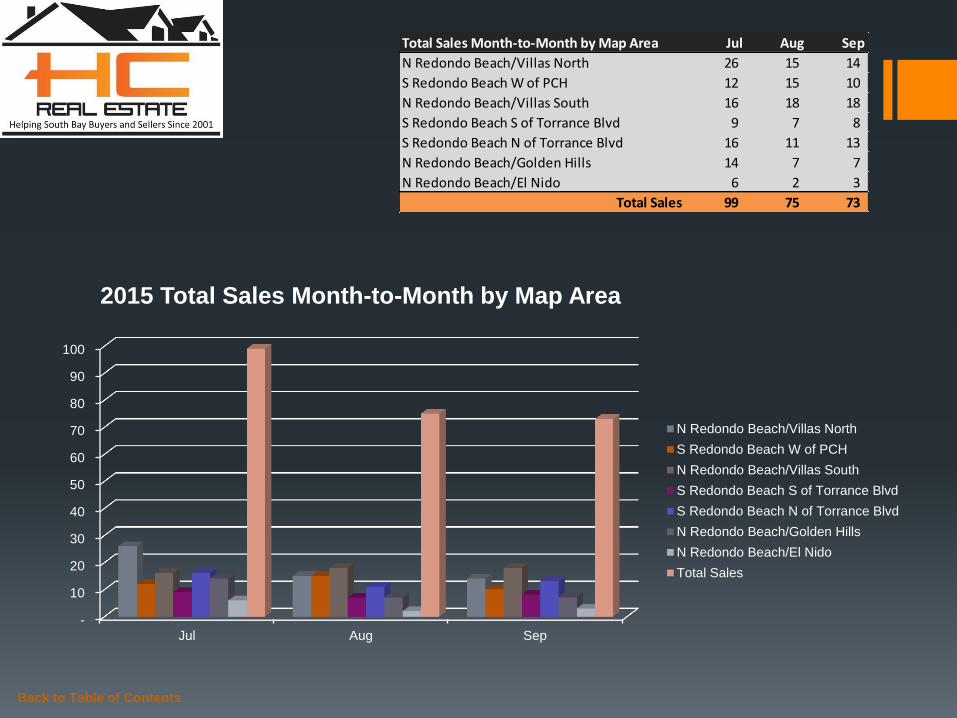
Total Sales Month-to-Month by Map Area Jul Aug Sep
N Redondo Beach/Villas North 26 15 14
S Redondo Beach W of PCH 12 15 10
N Redondo Beach/Villas South 16 18 18
S Redondo Beach S of Torrance Blvd 9 7 8
S Redondo Beach N of Torrance Blvd 16 11 13
N Redondo Beach/Golden Hills 14 7 7
N Redondo Beach/El Nido 6 2 3
Total Sales 99 75 73
-
10
20
30
40
50
60
70
80
90
100
Jul Aug Sep
2015 Total Sales Month-to-Month by Map Area
N Redondo Beach/Villas North
S Redondo Beach W of PCH
N Redondo Beach/Villas South
S Redondo Beach S of Torrance Blvd
S Redondo Beach N of Torrance Blvd
N Redondo Beach/Golden Hills
N Redondo Beach/El Nido
Total Sales

Back to Table of Contents
Total Sales Year-to-Year by Map Area 2013 2014 2015
N Redondo Beach/Villas North 16 15 14
S Redondo Beach W of PCH 15 11 10
N Redondo Beach/Villas South 23 13 18
S Redondo Beach S of Torrance Blvd 11 7 8
S Redondo Beach N of Torrance Blvd 8 13 13
N Redondo Beach/Golden Hills 3 4 7
N Redondo Beach/El Nido 6 8 3
Total Sales 82 71 73
-
10
20
30
40
50
60
70
80
90
2013 2014 2015
Total Sales Year-to-Year by Map Area: September
N Redondo Beach/Villas North
S Redondo Beach W of PCH
N Redondo Beach/Villas South
S Redondo Beach S of Torrance Blvd
S Redondo Beach N of Torrance Blvd
N Redondo Beach/Golden Hills
N Redondo Beach/El Nido
Total Sales

Back to Table of Contents
Median Sales Price Month-to-Month by Map Area Jul Aug Sep
N Redondo Beach/Villas North 826,500 839,000 749,375
S Redondo Beach W of PCH 770,000 705,000 758,750
N Redondo Beach/Villas South 882,500 706,200 728,750
S Redondo Beach S of Torrance Blvd 975,000 748,000 1,294,000
S Redondo Beach N of Torrance Blvd 1,054,000 995,000 1,043,000
N Redondo Beach/Golden Hills 907,500 935,000 1,020,000
N Redondo Beach/El Nido 817,000 1,092,250 870,000
Market Median Sales Price 876,000 795,000 880,000
-
200,000
400,000
600,000
800,000
1,000,000
1,200,000
1,400,000
Jul Aug Sep
2015 Median Sales Price Month-to-Month by Map Area
N Redondo Beach/Villas North
S Redondo Beach W of PCH
N Redondo Beach/Villas South
S Redondo Beach S of Torrance Blvd
S Redondo Beach N of Torrance Blvd
N Redondo Beach/Golden Hills
N Redondo Beach/El Nido
Market Median Sales Price
Back to Table of Contents
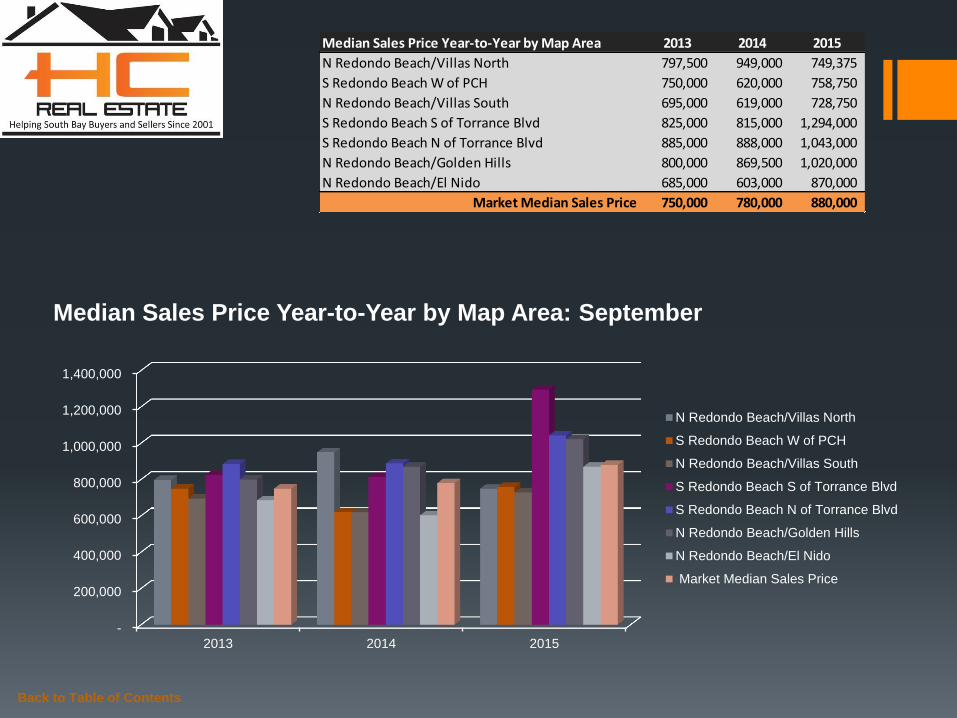
Median Sales Price Year-to-Year by Map Area 2013 2014 2015
N Redondo Beach/Villas North 797,500 949,000 749,375
S Redondo Beach W of PCH 750,000 620,000 758,750
N Redondo Beach/Villas South 695,000 619,000 728,750
S Redondo Beach S of Torrance Blvd 825,000 815,000 1,294,000
S Redondo Beach N of Torrance Blvd 885,000 888,000 1,043,000
N Redondo Beach/Golden Hills 800,000 869,500 1,020,000
N Redondo Beach/El Nido 685,000 603,000 870,000
Market Median Sales Price 750,000 780,000 880,000
-
200,000
400,000
600,000
800,000
1,000,000
1,200,000
1,400,000
2013 2014 2015
Median Sales Price Year-to-Year by Map Area: September
N Redondo Beach/Villas North
S Redondo Beach W of PCH
N Redondo Beach/Villas South
S Redondo Beach S of Torrance Blvd
S Redondo Beach N of Torrance Blvd
N Redondo Beach/Golden Hills
N Redondo Beach/El Nido
Market Median Sales Price

Back to Table of Contents
Active Listings vs. Total Sales by Map Area Jan Feb Mar Apr May Jun Jul Aug Sep Oct Nov Dec
N Redondo Beach/Villas North 18 24 25 24 38 32 31 28 31
S Redondo Beach W of PCH 13 16 17 23 21 21 25 19 26
N Redondo Beach/Villas South 31 28 26 31 29 33 30 28 33
S Redondo Beach S of Torrance Blvd 15 14 21 21 21 20 25 23 19
S Redondo Beach N of Torrance Blvd 12 14 13 30 29 17 19 23 24
N Redondo Beach/Golden Hills 2 5 7 16 18 13 12 10 12
N Redondo Beach/El Nido 6 11 10 11 8 5 5 6 10
Total Active Listings 97 112 119 156 164 141 147 137 155
-
5
10
15
20
25
30
35
40
Jan Feb Mar Apr May Jun Jul Aug Sep Oct Nov Dec
2015 Active Listings by Map Area
N Redondo Beach/Villas North
S Redondo Beach W of PCH
N Redondo Beach/Villas South
S Redondo Beach S of Torrance Blvd
S Redondo Beach N of Torrance Blvd
N Redondo Beach/Golden Hills
N Redondo Beach/El Nido

Back to Table of Contents
Active Listings vs. Total Sales by Map Area Jan Feb Mar Apr May Jun Jul Aug Sep Oct Nov Dec
N Redondo Beach/Villas North 18 24 25 24 38 32 31 28 31
S Redondo Beach W of PCH 13 16 17 23 21 21 25 19 26
N Redondo Beach/Villas South 31 28 26 31 29 33 30 28 33
S Redondo Beach S of Torrance Blvd 15 14 21 21 21 20 25 23 19
S Redondo Beach N of Torrance Blvd 12 14 13 30 29 17 19 23 24
N Redondo Beach/Golden Hills 2 5 7 16 18 13 12 10 12
N Redondo Beach/El Nido 6 11 10 11 8 5 5 6 10
Total Active Listings 97 112 119 156 164 141 147 137 155
Total Sales 46 41 81 79 89 90 99 75 73
Sales/Listings Ratio 47.4% 36.6% 68.1% 50.6% 54.3% 63.8% 67.3% 54.7% 47.1%
-
20
40
60
80
100
120
140
160
180
Jan Feb Mar Apr May Jun Jul Aug Sep Oct Nov Dec
2015 Total Active Listings vs. Total Sales
Total Active Listings
Total Sales

Back to Table of Contents
Active Listings Year-to-Year by Map Area 2013 2014 2015
N Redondo Beach/Villas North 41 41 31
S Redondo Beach W of PCH 43 31 26
N Redondo Beach/Villas South 21 37 33
S Redondo Beach S of Torrance Blvd 16 28 19
S Redondo Beach N of Torrance Blvd 39 29 24
N Redondo Beach/Golden Hills 7 10 12
N Redondo Beach/El Nido 11 11 10
Total Active Listings 178 187 155
-
20
40
60
80
100
120
140
160
180
200
2013 2014 2015
Active Listings Year-to-Year by Map Area: September
N Redondo Beach/Villas North
S Redondo Beach W of PCH
N Redondo Beach/Villas South
S Redondo Beach S of Torrance Blvd
S Redondo Beach N of Torrance Blvd
N Redondo Beach/Golden Hills
N Redondo Beach/El Nido
Total Active Listings

Back to Table of Contents
Months of Inventory by Map Area Jan Feb Mar Apr May Jun Jul Aug Sep Oct Nov Dec
N Redondo Beach/Villas North 1.4 4.8 1.4 1.6 1.9 2.0 1.0 2.0 2.0
S Redondo Beach W of PCH 2.2 4.0 1.7 1.8 1.5 2.0 2.0 1.0 3.0
N Redondo Beach/Villas South 5.2 1.8 1.1 1.9 1.5 2.0 2.0 2.0 2.0
S Redondo Beach S of Torrance Blvd 1.9 2.0 2.3 2.3 1.3 2.0 3.0 3.0 2.0
S Redondo Beach N of Torrance Blvd 2.0 2.8 1.4 2.7 4.1 2.0 1.0 2.0 2.0
N Redondo Beach/Golden Hills 0.3 1.7 1.2 2.3 2.6 1.0 1.0 1.0 2.0
N Redondo Beach/El Nido 6.0 11.0 2.0 1.4 1.6 1.0 1.0 3.0 3.0
-
2.0
4.0
6.0
8.0
10.0
12.0
Jan Feb Mar Apr May Jun Jul Aug Sep Oct Nov Dec
2015 Months of Inventory by Map Area
N Redondo Beach/Villas North
S Redondo Beach W of PCH
N Redondo Beach/Villas South
S Redondo Beach S of Torrance Blvd
S Redondo Beach N of Torrance Blvd
N Redondo Beach/Golden Hills
N Redondo Beach/El Nido

Back to Table of Contents
Months of Inventory Year-to-Year Jan Feb Mar Apr May Jun Jul Aug Sep Oct Nov Dec
2013 2.6 3.0 1.9 2.3 2.0 1.8 1.9 2.0 2.0 2.2 2.8 1.6
2014 2.6 3.2 1.9 2.0 2.5 2.1 2.0 2.3 2.2 1.8 2.1 1.2
2015 2.1 2.7 1.5 2.0 1.8 2.0 1.0 2.0 2.0
-
0.5
1.0
1.5
2.0
2.5
3.0
3.5
Jan Feb Mar Apr May Jun Jul Aug Sep Oct Nov Dec
2015 Months of Inventory Year-to-Year
2013
2014
2015
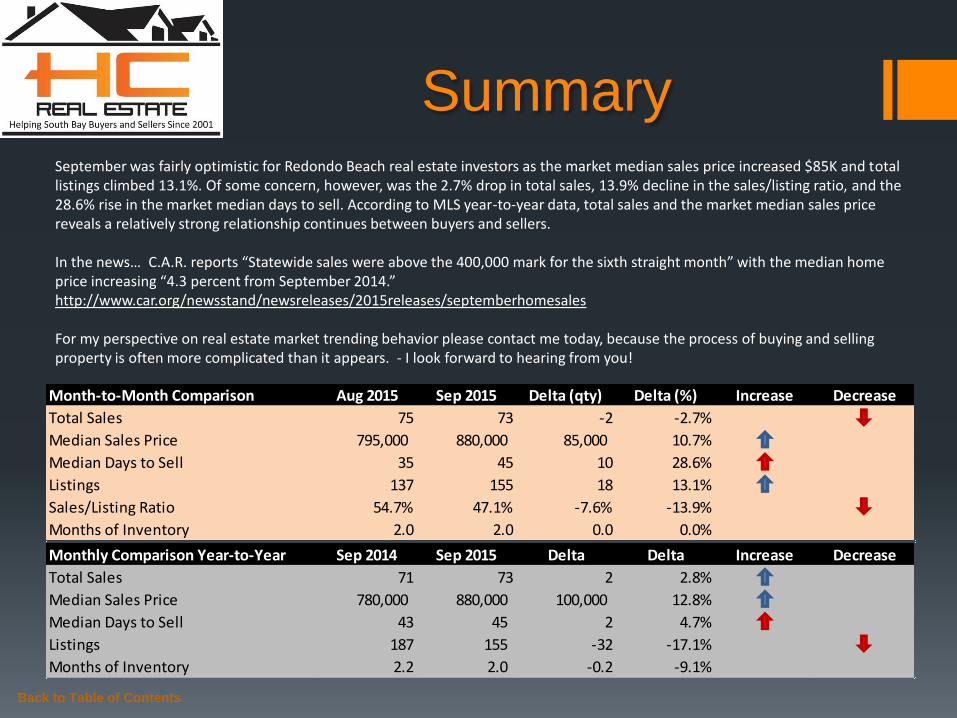
Summary September was fairly optimistic for Redondo Beach real estate investors as the market median sales price increased $85K and total listings climbed 13.1%. Of some concern, however, was the 2.7% drop in total sales, 13.9% decline in the sales/listing ratio, and the 28.6% rise in the market median days to sell. According to MLS year-to-year data, total sales and the market median sales price reveals a relatively strong relationship continues between buyers and sellers. In the news… C.A.R. reports “Statewide sales were above the 400,000 mark for the sixth straight month” with the median home price increasing “4.3 percent from September 2014.” http://www.car.org/newsstand/newsreleases/2015releases/septemberhomesales For my perspective on real estate market trending behavior please contact me today, because the process of buying and selling property is often more complicated than it appears. - I look forward to hearing from you!
Back to Table of Contents
Month-to-Month Comparison Aug 2015 Sep 2015 Delta (qty) Delta (%) Increase Decrease
Total Sales 75 73 -2 -2.7%
Median Sales Price 795,000 880,000 85,000 10.7%
Median Days to Sell 35 45 10 28.6%
Listings 137 155 18 13.1%
Sales/Listing Ratio 54.7% 47.1% -7.6% -13.9%
Months of Inventory 2.0 2.0 0.0 0.0%
Monthly Comparison Year-to-Year Sep 2014 Sep 2015 Delta Delta Increase Decrease
Total Sales 71 73 2 2.8%
Median Sales Price 780,000 880,000 100,000 12.8%
Median Days to Sell 43 45 2 4.7%
Listings 187 155 -32 -17.1%
Months of Inventory 2.2 2.0 -0.2 -9.1%

Serving South Bay Home Buyers and Sellers Since 2001
RE/MAX Top 4 Team in California – 2012
RE/MAX 100% Club - 2011
Shorewood Realtors Top 5% in Overall Sales 2001-2006, 2008-2010
Back to Table of Contents
About
Hady Chahine…

The information being provided by CARETS (CLAW, CRISNet MLS, DAMLS, CRMLS, i-Tech MLS, and/or VCRDS) is for the visitor’s personal, non-commercial use and may not be used for
any purpose other than to identify prospective properties visitor may be interested in purchasing. Any information relating to a property referenced on this web site comes from the Internet
Data Exchange (IDX) program of CARETS. This web site may reference real estate listing(s) held by a brokerage firm other than the broker and/or agent who owns this web site. The accuracy
of all information, regardless of source, including but not limited to square footages and lot sizes, is deemed reliable but not guaranteed and should be personally verified through personal
inspection by and/or with the appropriate professionals.
Back to Table of Contents
Listings MLS BLOG Website
Hady Chahine
• 310-404-5361