november 2014 redondo beach real estate market trends update
TRANSCRIPT

Table of
Contents
Key Statistics for November
Sales 2014 Residential Sales Stats Year-to-Year Total Sales by Map Area Median 2014 Median Sales Stats Year-to-Year Median Sales by Map Area Listings 2014 Active Listings by Map Area 2014 Total Active Listings vs. Total Sales Year-to-Year Active Listings by Map Area Inventory 2014 Months of Inventory by Map Area Year-to-Year Months of Inventory
Outlook for December
About Hady Chahine Contact Information
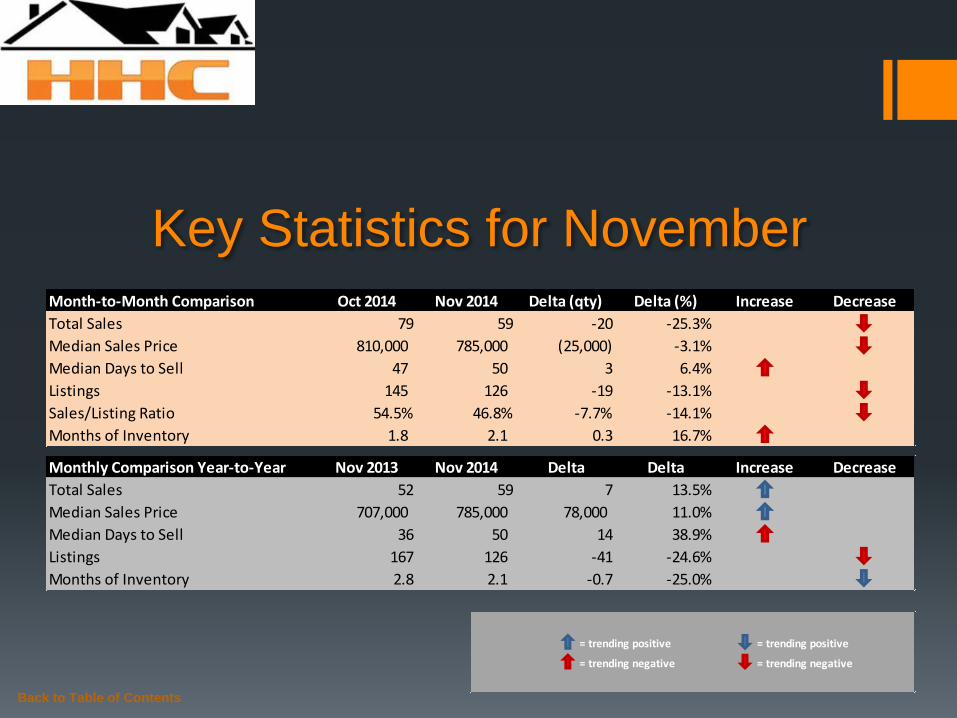
Key Statistics for November
Back to Table of Contents
= trending positive = trending positive
= trending negative = trending negative
Month-to-Month Comparison Oct 2014 Nov 2014 Delta (qty) Delta (%) Increase Decrease
Total Sales 79 59 -20 -25.3%
Median Sales Price 810,000 785,000 (25,000) -3.1%
Median Days to Sell 47 50 3 6.4%
Listings 145 126 -19 -13.1%
Sales/Listing Ratio 54.5% 46.8% -7.7% -14.1%
Months of Inventory 1.8 2.1 0.3 16.7%
Monthly Comparison Year-to-Year Nov 2013 Nov 2014 Delta Delta Increase Decrease
Total Sales 52 59 7 13.5%
Median Sales Price 707,000 785,000 78,000 11.0%
Median Days to Sell 36 50 14 38.9%
Listings 167 126 -41 -24.6%
Months of Inventory 2.8 2.1 -0.7 -25.0%
Back to Table of Contents
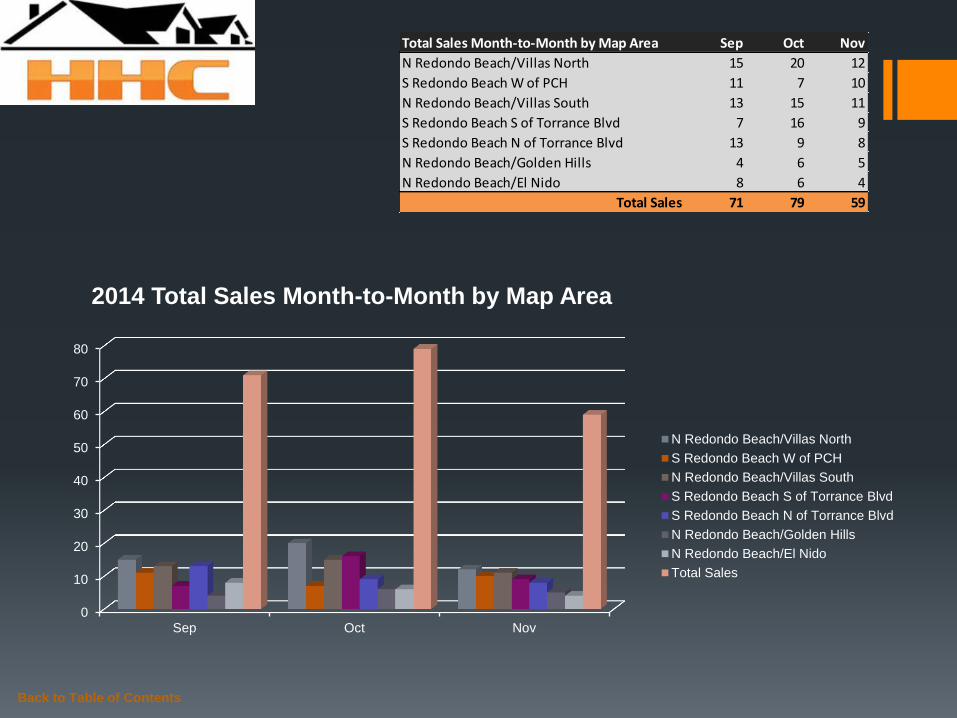
Total Sales Month-to-Month by Map Area Sep Oct Nov
N Redondo Beach/Villas North 15 20 12
S Redondo Beach W of PCH 11 7 10
N Redondo Beach/Villas South 13 15 11
S Redondo Beach S of Torrance Blvd 7 16 9
S Redondo Beach N of Torrance Blvd 13 9 8
N Redondo Beach/Golden Hills 4 6 5
N Redondo Beach/El Nido 8 6 4
Total Sales 71 79 59
0
10
20
30
40
50
60
70
80
Sep Oct Nov
2014 Total Sales Month-to-Month by Map Area
N Redondo Beach/Villas North
S Redondo Beach W of PCH
N Redondo Beach/Villas South
S Redondo Beach S of Torrance Blvd
S Redondo Beach N of Torrance Blvd
N Redondo Beach/Golden Hills
N Redondo Beach/El Nido
Total Sales
Back to Table of Contents
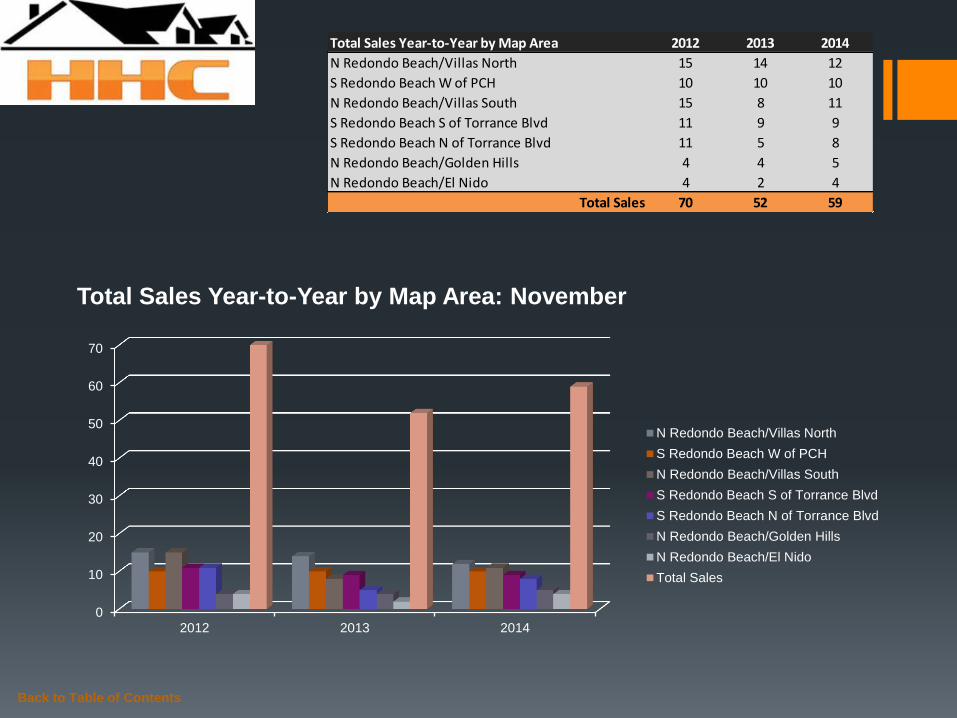
Total Sales Year-to-Year by Map Area 2012 2013 2014
N Redondo Beach/Villas North 15 14 12
S Redondo Beach W of PCH 10 10 10
N Redondo Beach/Villas South 15 8 11
S Redondo Beach S of Torrance Blvd 11 9 9
S Redondo Beach N of Torrance Blvd 11 5 8
N Redondo Beach/Golden Hills 4 4 5
N Redondo Beach/El Nido 4 2 4
Total Sales 70 52 59
0
10
20
30
40
50
60
70
2012 2013 2014
Total Sales Year-to-Year by Map Area: November
N Redondo Beach/Villas North
S Redondo Beach W of PCH
N Redondo Beach/Villas South
S Redondo Beach S of Torrance Blvd
S Redondo Beach N of Torrance Blvd
N Redondo Beach/Golden Hills
N Redondo Beach/El Nido
Total Sales
Back to Table of Contents
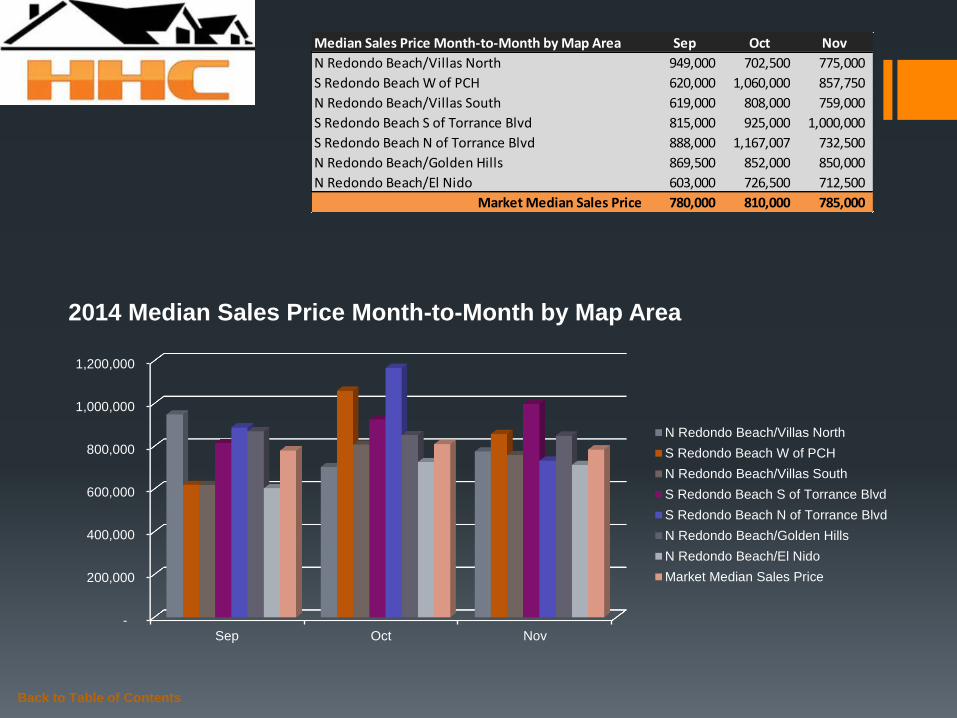
Median Sales Price Month-to-Month by Map Area Sep Oct Nov
N Redondo Beach/Villas North 949,000 702,500 775,000
S Redondo Beach W of PCH 620,000 1,060,000 857,750
N Redondo Beach/Villas South 619,000 808,000 759,000
S Redondo Beach S of Torrance Blvd 815,000 925,000 1,000,000
S Redondo Beach N of Torrance Blvd 888,000 1,167,007 732,500
N Redondo Beach/Golden Hills 869,500 852,000 850,000
N Redondo Beach/El Nido 603,000 726,500 712,500
Market Median Sales Price 780,000 810,000 785,000
-
200,000
400,000
600,000
800,000
1,000,000
1,200,000
Sep Oct Nov
2014 Median Sales Price Month-to-Month by Map Area
N Redondo Beach/Villas North
S Redondo Beach W of PCH
N Redondo Beach/Villas South
S Redondo Beach S of Torrance Blvd
S Redondo Beach N of Torrance Blvd
N Redondo Beach/Golden Hills
N Redondo Beach/El Nido
Market Median Sales Price

Back to Table of Contents
Median Sales Price Year-to-Year by Map Area 2012 2013 2014
N Redondo Beach/Villas North 650,000 603,950 775,000
S Redondo Beach W of PCH 659,500 735,000 857,500
N Redondo Beach/Villas South 560,000 763,500 759,000
S Redondo Beach S of Torrance Blvd 375,000 445,000 1,000,000
S Redondo Beach N of Torrance Blvd 790,000 897,500 732,500
N Redondo Beach/Golden Hills 774,250 767,000 850,000
N Redondo Beach/El Nido 640,000 559,750 712,500
Market Median Sales Price 657,750 707,000 785,000
-
100,000
200,000
300,000
400,000
500,000
600,000
700,000
800,000
900,000
1,000,000
2012 2013 2014
Median Sales Price Year-to-Year by Map Area: November
N Redondo Beach/Villas North
S Redondo Beach W of PCH
N Redondo Beach/Villas South
S Redondo Beach S of Torrance Blvd
S Redondo Beach N of Torrance Blvd
N Redondo Beach/Golden Hills
N Redondo Beach/El Nido
Market Median Sales Price
Back to Table of Contents
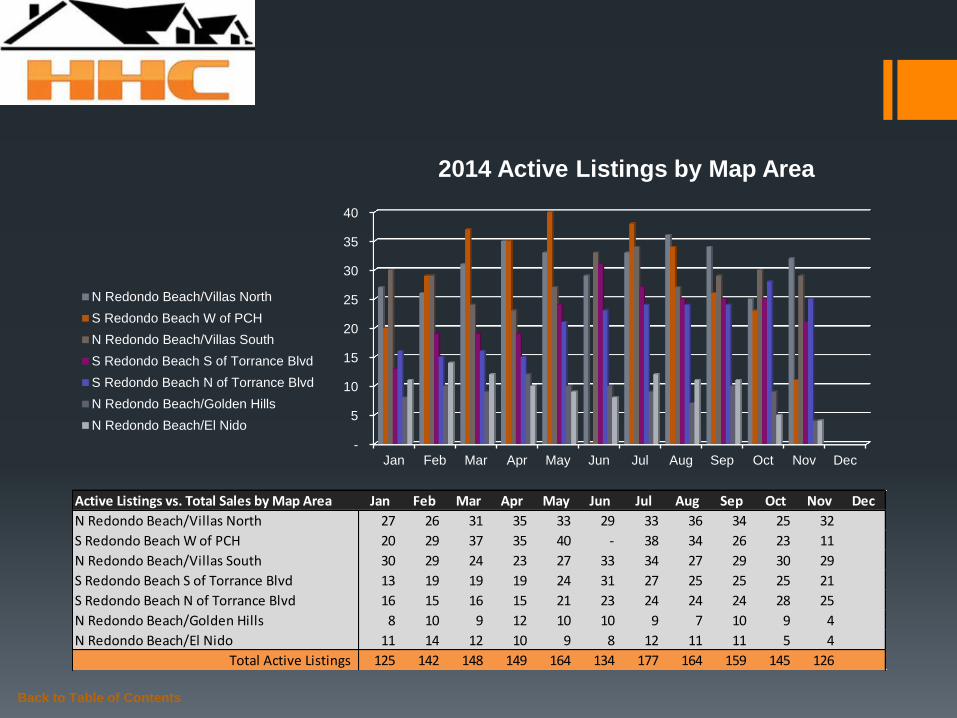
Active Listings vs. Total Sales by Map Area Jan Feb Mar Apr May Jun Jul Aug Sep Oct Nov Dec
N Redondo Beach/Villas North 27 26 31 35 33 29 33 36 34 25 32
S Redondo Beach W of PCH 20 29 37 35 40 - 38 34 26 23 11
N Redondo Beach/Villas South 30 29 24 23 27 33 34 27 29 30 29
S Redondo Beach S of Torrance Blvd 13 19 19 19 24 31 27 25 25 25 21
S Redondo Beach N of Torrance Blvd 16 15 16 15 21 23 24 24 24 28 25
N Redondo Beach/Golden Hills 8 10 9 12 10 10 9 7 10 9 4
N Redondo Beach/El Nido 11 14 12 10 9 8 12 11 11 5 4
Total Active Listings 125 142 148 149 164 134 177 164 159 145 126
-
5
10
15
20
25
30
35
40
Jan Feb Mar Apr May Jun Jul Aug Sep Oct Nov Dec
2014 Active Listings by Map Area
N Redondo Beach/Villas North
S Redondo Beach W of PCH
N Redondo Beach/Villas South
S Redondo Beach S of Torrance Blvd
S Redondo Beach N of Torrance Blvd
N Redondo Beach/Golden Hills
N Redondo Beach/El Nido
Back to Table of Contents
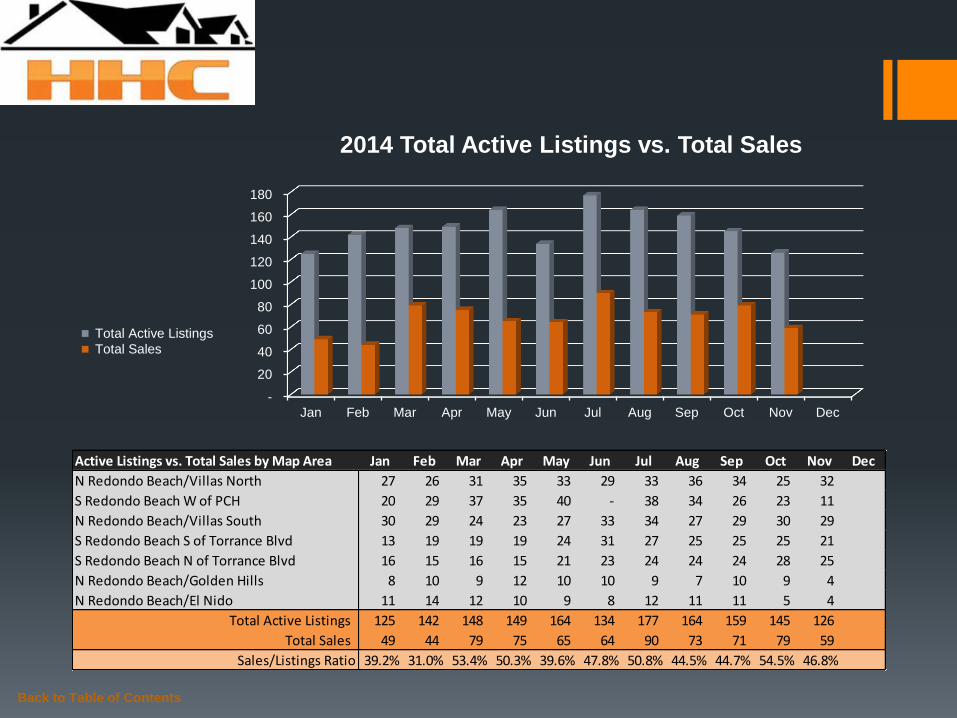
Active Listings vs. Total Sales by Map Area Jan Feb Mar Apr May Jun Jul Aug Sep Oct Nov Dec
N Redondo Beach/Villas North 27 26 31 35 33 29 33 36 34 25 32
S Redondo Beach W of PCH 20 29 37 35 40 - 38 34 26 23 11
N Redondo Beach/Villas South 30 29 24 23 27 33 34 27 29 30 29
S Redondo Beach S of Torrance Blvd 13 19 19 19 24 31 27 25 25 25 21
S Redondo Beach N of Torrance Blvd 16 15 16 15 21 23 24 24 24 28 25
N Redondo Beach/Golden Hills 8 10 9 12 10 10 9 7 10 9 4
N Redondo Beach/El Nido 11 14 12 10 9 8 12 11 11 5 4
Total Active Listings 125 142 148 149 164 134 177 164 159 145 126
Total Sales 49 44 79 75 65 64 90 73 71 79 59
Sales/Listings Ratio 39.2% 31.0% 53.4% 50.3% 39.6% 47.8% 50.8% 44.5% 44.7% 54.5% 46.8%
-
20
40
60
80
100
120
140
160
180
Jan Feb Mar Apr May Jun Jul Aug Sep Oct Nov Dec
2014 Total Active Listings vs. Total Sales
Total Active Listings
Total Sales
Back to Table of Contents
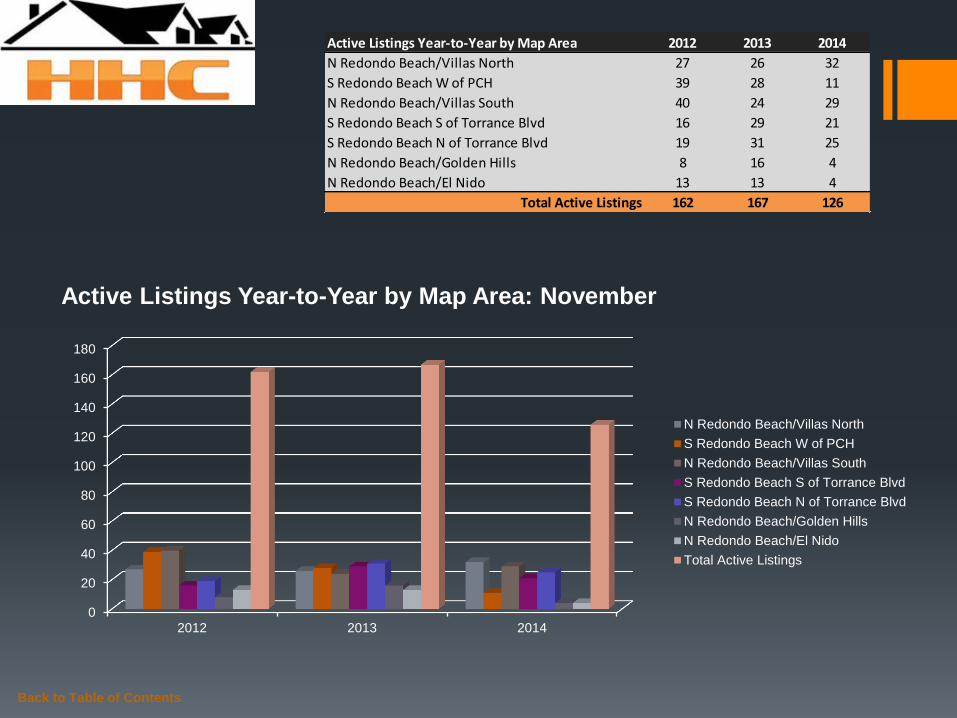
Active Listings Year-to-Year by Map Area 2012 2013 2014
N Redondo Beach/Villas North 27 26 32
S Redondo Beach W of PCH 39 28 11
N Redondo Beach/Villas South 40 24 29
S Redondo Beach S of Torrance Blvd 16 29 21
S Redondo Beach N of Torrance Blvd 19 31 25
N Redondo Beach/Golden Hills 8 16 4
N Redondo Beach/El Nido 13 13 4
Total Active Listings 162 167 126
0
20
40
60
80
100
120
140
160
180
2012 2013 2014
Active Listings Year-to-Year by Map Area: November
N Redondo Beach/Villas North
S Redondo Beach W of PCH
N Redondo Beach/Villas South
S Redondo Beach S of Torrance Blvd
S Redondo Beach N of Torrance Blvd
N Redondo Beach/Golden Hills
N Redondo Beach/El Nido
Total Active Listings
Back to Table of Contents
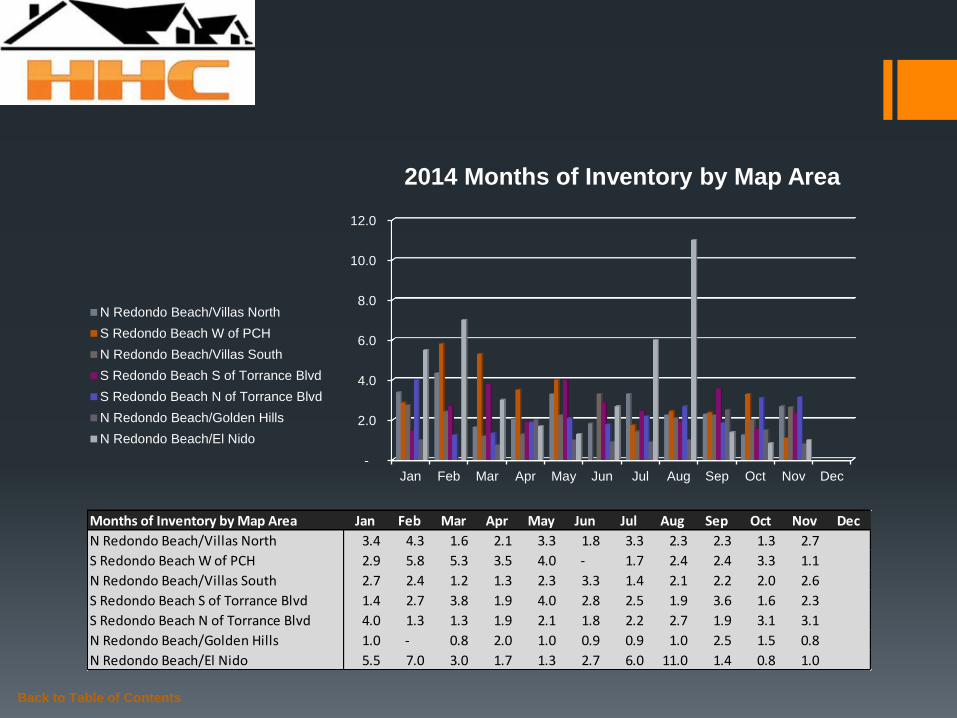
Months of Inventory by Map Area Jan Feb Mar Apr May Jun Jul Aug Sep Oct Nov Dec
N Redondo Beach/Villas North 3.4 4.3 1.6 2.1 3.3 1.8 3.3 2.3 2.3 1.3 2.7
S Redondo Beach W of PCH 2.9 5.8 5.3 3.5 4.0 - 1.7 2.4 2.4 3.3 1.1
N Redondo Beach/Villas South 2.7 2.4 1.2 1.3 2.3 3.3 1.4 2.1 2.2 2.0 2.6
S Redondo Beach S of Torrance Blvd 1.4 2.7 3.8 1.9 4.0 2.8 2.5 1.9 3.6 1.6 2.3
S Redondo Beach N of Torrance Blvd 4.0 1.3 1.3 1.9 2.1 1.8 2.2 2.7 1.9 3.1 3.1
N Redondo Beach/Golden Hills 1.0 - 0.8 2.0 1.0 0.9 0.9 1.0 2.5 1.5 0.8
N Redondo Beach/El Nido 5.5 7.0 3.0 1.7 1.3 2.7 6.0 11.0 1.4 0.8 1.0
-
2.0
4.0
6.0
8.0
10.0
12.0
Jan Feb Mar Apr May Jun Jul Aug Sep Oct Nov Dec
2014 Months of Inventory by Map Area
N Redondo Beach/Villas North
S Redondo Beach W of PCH
N Redondo Beach/Villas South
S Redondo Beach S of Torrance Blvd
S Redondo Beach N of Torrance Blvd
N Redondo Beach/Golden Hills
N Redondo Beach/El Nido
Back to Table of Contents
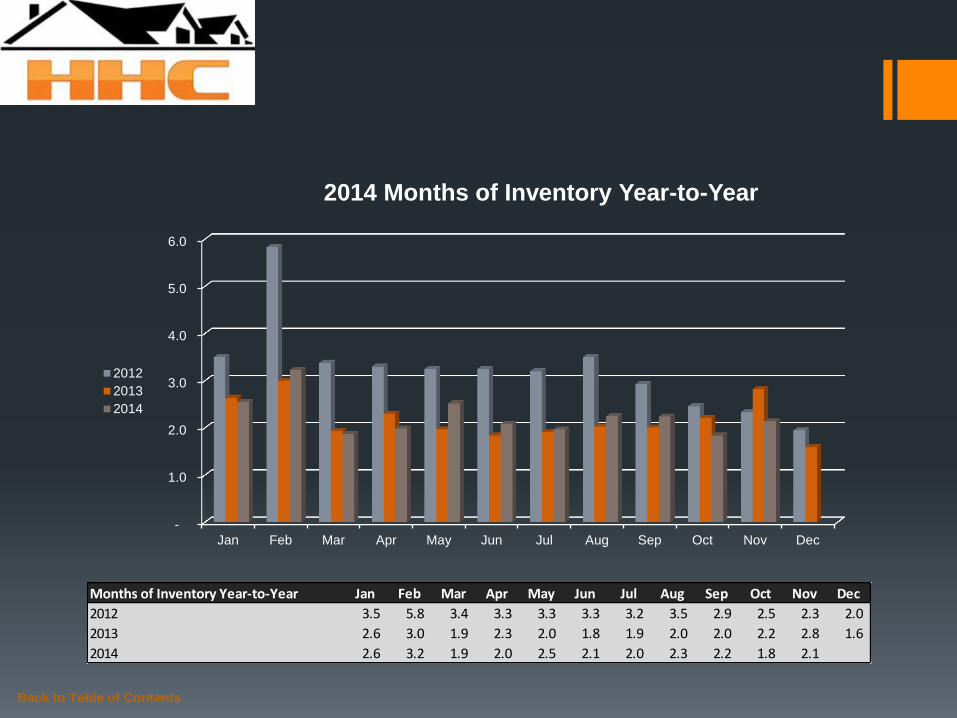
Months of Inventory Year-to-Year Jan Feb Mar Apr May Jun Jul Aug Sep Oct Nov Dec
2012 3.5 5.8 3.4 3.3 3.3 3.3 3.2 3.5 2.9 2.5 2.3 2.0
2013 2.6 3.0 1.9 2.3 2.0 1.8 1.9 2.0 2.0 2.2 2.8 1.6
2014 2.6 3.2 1.9 2.0 2.5 2.1 2.0 2.3 2.2 1.8 2.1
-
1.0
2.0
3.0
4.0
5.0
6.0
Jan Feb Mar Apr May Jun Jul Aug Sep Oct Nov Dec
2014 Months of Inventory Year-to-Year
2012
2013
2014
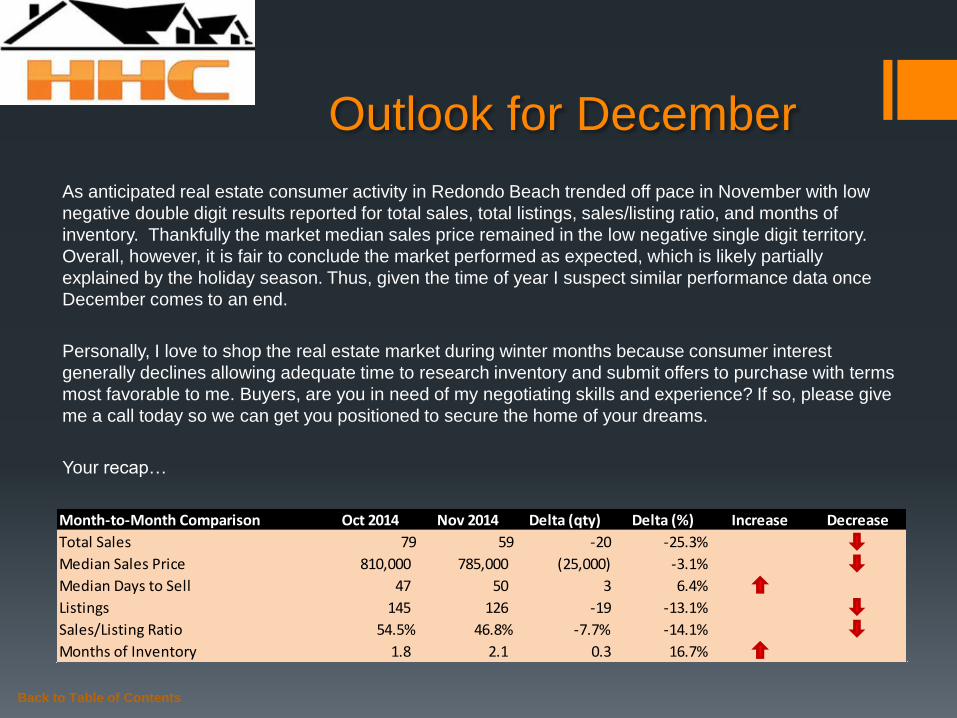
Outlook for December
As anticipated real estate consumer activity in Redondo Beach trended off pace in November with low
negative double digit results reported for total sales, total listings, sales/listing ratio, and months of
inventory. Thankfully the market median sales price remained in the low negative single digit territory.
Overall, however, it is fair to conclude the market performed as expected, which is likely partially
explained by the holiday season. Thus, given the time of year I suspect similar performance data once
December comes to an end.
Personally, I love to shop the real estate market during winter months because consumer interest
generally declines allowing adequate time to research inventory and submit offers to purchase with terms
most favorable to me. Buyers, are you in need of my negotiating skills and experience? If so, please give
me a call today so we can get you positioned to secure the home of your dreams.
Your recap…
Back to Table of Contents
Month-to-Month Comparison Oct 2014 Nov 2014 Delta (qty) Delta (%) Increase Decrease
Total Sales 79 59 -20 -25.3%
Median Sales Price 810,000 785,000 (25,000) -3.1%
Median Days to Sell 47 50 3 6.4%
Listings 145 126 -19 -13.1%
Sales/Listing Ratio 54.5% 46.8% -7.7% -14.1%
Months of Inventory 1.8 2.1 0.3 16.7%

Serving South Bay Home Buyers and Sellers Since 2001
RE/MAX Top 4 Team in California – 2012
RE/MAX 100% Club - 2011
Shorewood Realtors Top 5% in Overall Sales 2001-2006, 2008-2010
Back to Table of Contents
About
Hady Chahine…

The information being provided by CARETS (CLAW, CRISNet MLS, DAMLS, CRMLS, i-Tech MLS, and/or VCRDS) is for the visitor’s personal, non-commercial use and may not be used for
any purpose other than to identify prospective properties visitor may be interested in purchasing. Any information relating to a property referenced on this web site comes from the Internet
Data Exchange (IDX) program of CARETS. This web site may reference real estate listing(s) held by a brokerage firm other than the broker and/or agent who owns this web site. The accuracy
of all information, regardless of source, including but not limited to square footages and lot sizes, is deemed reliable but not guaranteed and should be personally verified through personal
inspection by and/or with the appropriate professionals.
Back to Table of Contents
Listings MLS BLOG Website