september 2016 redondo beach real estate market trends update
TRANSCRIPT


Table of
Contents
Key Statistics for September
Sales 2016 Residential Sales Stats Year-to-Year Total Sales by Map Area Median 2016 Median Sales Stats Year-to-Year Median Sales by Map Area Listings 2016 Active Listings by Map Area 2016 Total Active Listings vs. Total Sales Year-to-Year Active Listings by Map Area Inventory 2016 Months of Inventory by Map Area Year-to-Year Months of Inventory
Summary
About Hady Chahine Contact Information

Key Statistics for September
Back to Table of Contents
= trending positive = trending positive
= trending negative = trending negative
Month-to-Month Comparison Aug 2016 Sep 2016 Delta (qty) Delta (%) Increase Decrease
Total Sales 82 63 -19 -23.2%
Median Sales Price 963,000 899,000 (64,000) -6.6%
Median Days to Sell 33 24 -9 -27.3%
Listings 173 186 13 7.5%
Sales/Listing Ratio 47.4% 33.9% -13.5% -28.5%
Months of Inventory 2.0 3.0 1.0 50.0%
Monthly Comparison Year-to-Year Sep 2015 Sep 2016 Delta Delta Increase Decrease
Total Sales 73 63 -10 -13.7%
Median Sales Price 880,000 899,000 19,000 2.2%
Median Days to Sell 45 24 -21 -46.7%
Listings 171 186 15 8.8%
Months of Inventory 2.0 3.0 1 50.0%
Back to Table of Contents
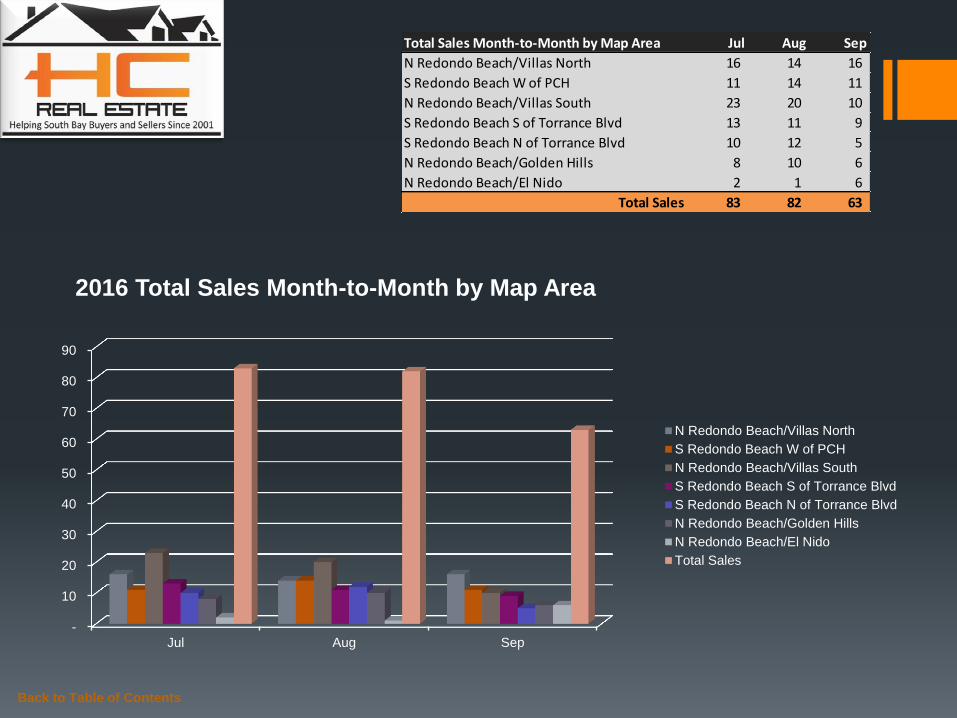
Total Sales Month-to-Month by Map Area Jul Aug Sep
N Redondo Beach/Villas North 16 14 16
S Redondo Beach W of PCH 11 14 11
N Redondo Beach/Villas South 23 20 10
S Redondo Beach S of Torrance Blvd 13 11 9
S Redondo Beach N of Torrance Blvd 10 12 5
N Redondo Beach/Golden Hills 8 10 6
N Redondo Beach/El Nido 2 1 6
Total Sales 83 82 63
-
10
20
30
40
50
60
70
80
90
Jul Aug Sep
2016 Total Sales Month-to-Month by Map Area
N Redondo Beach/Villas North
S Redondo Beach W of PCH
N Redondo Beach/Villas South
S Redondo Beach S of Torrance Blvd
S Redondo Beach N of Torrance Blvd
N Redondo Beach/Golden Hills
N Redondo Beach/El Nido
Total Sales

Back to Table of Contents
Total Sales Year-to-Year by Map Area 2014 2015 2016
N Redondo Beach/Villas North 15 14 16
S Redondo Beach W of PCH 11 10 11
N Redondo Beach/Villas South 13 18 10
S Redondo Beach S of Torrance Blvd 7 8 9
S Redondo Beach N of Torrance Blvd 13 13 5
N Redondo Beach/Golden Hills 4 7 6
N Redondo Beach/El Nido 8 3 6
Total Sales 71 73 63
-
10
20
30
40
50
60
70
80
2014 2015 2016
Total Sales Year-to-Year by Map Area: September
N Redondo Beach/Villas North
S Redondo Beach W of PCH
N Redondo Beach/Villas South
S Redondo Beach S of Torrance Blvd
S Redondo Beach N of Torrance Blvd
N Redondo Beach/Golden Hills
N Redondo Beach/El Nido
Total Sales

Back to Table of Contents
Median Sales Price Month-to-Month by Map Area Jul Aug Sep
N Redondo Beach/Villas North 800,500 942,000 807,500
S Redondo Beach W of PCH 1,085,000 882,033 671,000
N Redondo Beach/Villas South 920,000 858,000 792,500
S Redondo Beach S of Torrance Blvd 926,250 1,105,000 1,080,000
S Redondo Beach N of Torrance Blvd 917,000 1,072,500 1,040,000
N Redondo Beach/Golden Hills 1,026,508 1,037,500 993,500
N Redondo Beach/El Nido 1,137,500 816,000 871,000
Market Median Sales Price 920,000 963,000 899,000
-
200,000
400,000
600,000
800,000
1,000,000
1,200,000
Jul Aug Sep
2016 Median Sales Price Month-to-Month by Map Area
N Redondo Beach/Villas North
S Redondo Beach W of PCH
N Redondo Beach/Villas South
S Redondo Beach S of Torrance Blvd
S Redondo Beach N of Torrance Blvd
N Redondo Beach/Golden Hills
N Redondo Beach/El Nido
Market Median Sales Price

Back to Table of Contents
Median Sales Price Year-to-Year by Map Area 2014 2015 2016
N Redondo Beach/Villas North 949,000 749,375 807,500
S Redondo Beach W of PCH 620,000 758,750 671,000
N Redondo Beach/Villas South 619,000 728,750 792,500
S Redondo Beach S of Torrance Blvd 815,000 1,294,000 1,080,000
S Redondo Beach N of Torrance Blvd 888,000 1,043,000 1,040,000
N Redondo Beach/Golden Hills 869,500 1,020,000 993,500
N Redondo Beach/El Nido 603,000 870,000 871,000
Market Median Sales Price 780,000 880,000 899,000
-
200,000
400,000
600,000
800,000
1,000,000
1,200,000
1,400,000
2014 2015 2016
Median Sales Price Year-to-Year by Map Area: September
N Redondo Beach/Villas North
S Redondo Beach W of PCH
N Redondo Beach/Villas South
S Redondo Beach S of Torrance Blvd
S Redondo Beach N of Torrance Blvd
N Redondo Beach/Golden Hills
N Redondo Beach/El Nido
Market Median Sales Price

Back to Table of Contents
Active Listings vs. Total Sales by Map Area Jan Feb Mar Apr May Jun Jul Aug Sep Oct Nov Dec
N Redondo Beach/Villas North 9 18 18 14 21 29 26 47 39
S Redondo Beach W of PCH 25 31 22 28 30 40 38 30 28
N Redondo Beach/Villas South 20 23 28 25 21 40 29 34 41
S Redondo Beach S of Torrance Blvd 16 17 24 26 25 25 24 18 21
S Redondo Beach N of Torrance Blvd 16 12 13 13 19 23 20 25 29
N Redondo Beach/Golden Hills 10 15 14 12 12 11 15 12 19
N Redondo Beach/El Nido 2 - 4 4 7 6 6 7 9
Total Active Listings 98 116 123 122 135 174 158 173 186
-
5
10
15
20
25
30
35
40
45
50
Jan Feb Mar Apr May Jun Jul Aug Sep Oct Nov Dec
2016 Active Listings by Map Area
N Redondo Beach/Villas North
S Redondo Beach W of PCH
N Redondo Beach/Villas South
S Redondo Beach S of Torrance Blvd
S Redondo Beach N of Torrance Blvd
N Redondo Beach/Golden Hills
N Redondo Beach/El Nido

Back to Table of Contents
Active Listings vs. Total Sales by Map Area Jan Feb Mar Apr May Jun Jul Aug Sep Oct Nov Dec
N Redondo Beach/Villas North 9 18 18 14 21 29 26 47 39
S Redondo Beach W of PCH 25 31 22 28 30 40 38 30 28
N Redondo Beach/Villas South 20 23 28 25 21 40 29 34 41
S Redondo Beach S of Torrance Blvd 16 17 24 26 25 25 24 18 21
S Redondo Beach N of Torrance Blvd 16 12 13 13 19 23 20 25 29
N Redondo Beach/Golden Hills 10 15 14 12 12 11 15 12 19
N Redondo Beach/El Nido 2 - 4 4 7 6 6 7 9
Total Active Listings 98 116 123 122 135 174 158 173 186
Total Sales 54 34 73 87 83 89 83 82 63
Sales/Listings Ratio 55.1% 29.3% 59.3% 71.3% 61.5% 51.1% 52.5% 47.4% 33.9%
-
20
40
60
80
100
120
140
160
180
200
Jan Feb Mar Apr May Jun Jul Aug Sep Oct Nov Dec
2016 Total Active Listings vs. Total Sales
Total Active Listings Total Sales

Back to Table of Contents
Active Listings Year-to-Year by Map Area 2014 2015 2016
N Redondo Beach/Villas North 40 35 39
S Redondo Beach W of PCH 32 33 28
N Redondo Beach/Villas South 35 34 41
S Redondo Beach S of Torrance Blvd 30 14 21
S Redondo Beach N of Torrance Blvd 34 27 29
N Redondo Beach/Golden Hills 12 15 19
N Redondo Beach/El Nido 13 13 9
Total Active Listings 196 171 186
-
20
40
60
80
100
120
140
160
180
200
2014 2015 2016
Active Listings Year-to-Year by Map Area: September
N Redondo Beach/Villas North
S Redondo Beach W of PCH
N Redondo Beach/Villas South
S Redondo Beach S of Torrance Blvd
S Redondo Beach N of Torrance Blvd
N Redondo Beach/Golden Hills
N Redondo Beach/El Nido
Total Active Listings
Back to Table of Contents
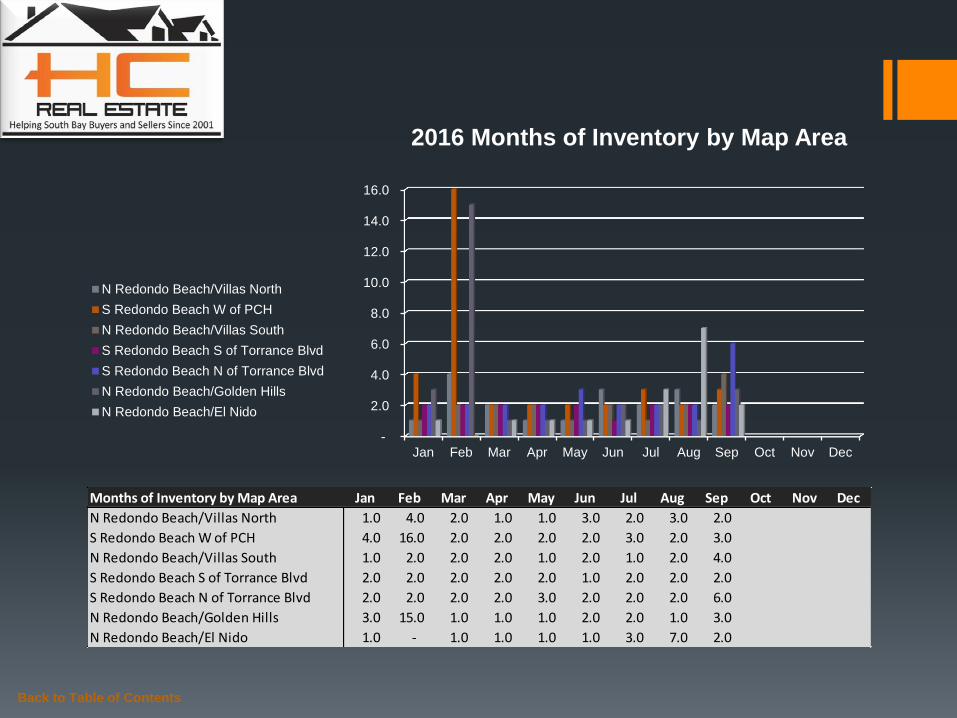
Months of Inventory by Map Area Jan Feb Mar Apr May Jun Jul Aug Sep Oct Nov Dec
N Redondo Beach/Villas North 1.0 4.0 2.0 1.0 1.0 3.0 2.0 3.0 2.0
S Redondo Beach W of PCH 4.0 16.0 2.0 2.0 2.0 2.0 3.0 2.0 3.0
N Redondo Beach/Villas South 1.0 2.0 2.0 2.0 1.0 2.0 1.0 2.0 4.0
S Redondo Beach S of Torrance Blvd 2.0 2.0 2.0 2.0 2.0 1.0 2.0 2.0 2.0
S Redondo Beach N of Torrance Blvd 2.0 2.0 2.0 2.0 3.0 2.0 2.0 2.0 6.0
N Redondo Beach/Golden Hills 3.0 15.0 1.0 1.0 1.0 2.0 2.0 1.0 3.0
N Redondo Beach/El Nido 1.0 - 1.0 1.0 1.0 1.0 3.0 7.0 2.0
-
2.0
4.0
6.0
8.0
10.0
12.0
14.0
16.0
Jan Feb Mar Apr May Jun Jul Aug Sep Oct Nov Dec
2016 Months of Inventory by Map Area
N Redondo Beach/Villas North
S Redondo Beach W of PCH
N Redondo Beach/Villas South
S Redondo Beach S of Torrance Blvd
S Redondo Beach N of Torrance Blvd
N Redondo Beach/Golden Hills
N Redondo Beach/El Nido
Back to Table of Contents
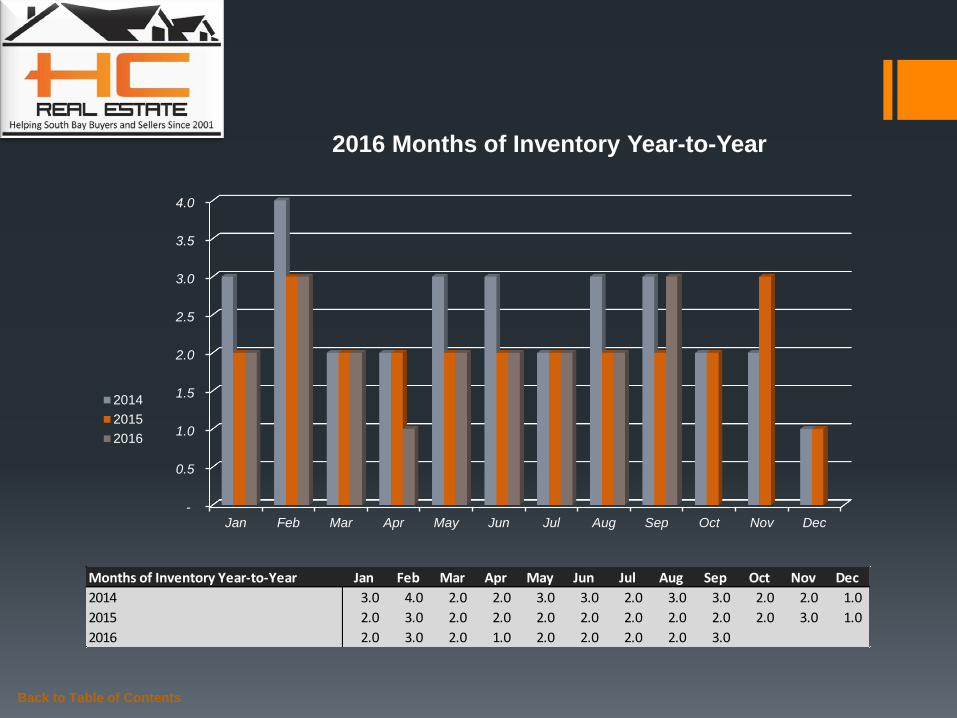
Months of Inventory Year-to-Year Jan Feb Mar Apr May Jun Jul Aug Sep Oct Nov Dec
2014 3.0 4.0 2.0 2.0 3.0 3.0 2.0 3.0 3.0 2.0 2.0 1.0
2015 2.0 3.0 2.0 2.0 2.0 2.0 2.0 2.0 2.0 2.0 3.0 1.0
2016 2.0 3.0 2.0 1.0 2.0 2.0 2.0 2.0 3.0
-
0.5
1.0
1.5
2.0
2.5
3.0
3.5
4.0
Jan Feb Mar Apr May Jun Jul Aug Sep Oct Nov Dec
2016 Months of Inventory Year-to-Year
2014
2015
2016

Summary Redondo Beach real estate investment in September produced mix results as total sales fell 23.2%, the median sale price declined 6.6%, and the sales-listing ratio contracted 28.5%. Metrics performing to the contrary included the median days to sell and net listings, which improved 27.3% and 7.5% respectively speaking. Year-over-year months of inventory data point revealed a 50% increase in 2016 compared to 2015.
In the news… According to C.A.R., ““While demand remains strong for lower-priced homes, which are more inventory constrained, sales of homes at the higher-end have slowed significantly,” said C.A.R. Vice President and Chief Economist Leslie Appleton-Young. http://www.car.org/newsstand/newsreleases/2016releases/september2016sales?view=Standard
For listing or buying guidance, or additional statistics on market trending behavior, please do not hesitate to contact me to schedule a time to discuss how I can be of service to you.
Back to Table of Contents
Monthly Comparison Year-to-Year Sep 2015 Sep 2016 Delta Delta Increase Decrease
Total Sales 73 63 -10 -13.7%
Median Sales Price 880,000 899,000 19,000 2.2%
Median Days to Sell 45 24 -21 -46.7%
Listings 171 186 15 8.8%
Months of Inventory 2.0 3.0 1 50.0%
Month-to-Month Comparison Aug 2016 Sep 2016 Delta (qty) Delta (%) Increase Decrease
Total Sales 82 63 -19 -23.2%
Median Sales Price 963,000 899,000 (64,000) -6.6%
Median Days to Sell 33 24 -9 -27.3%
Listings 173 186 13 7.5%
Sales/Listing Ratio 47.4% 33.9% -13.5% -28.5%
Months of Inventory 2.0 3.0 1.0 50.0%

Serving South Bay Home Buyers and Sellers Since 2001
RE/MAX Top 4 Team in California – 2012
RE/MAX 100% Club - 2011
Shorewood Realtors Top 5% in Overall Sales 2001-2006, 2008-2010
Back to Table of Contents
About
Hady Chahine…

The information being provided by CARETS (CLAW, CRISNet MLS, DAMLS, CRMLS, i-Tech MLS, and/or VCRDS) is for the visitor’s personal, non-commercial use and may not be used for
any purpose other than to identify prospective properties visitor may be interested in purchasing. Any information relating to a property referenced on this web site comes from the Internet
Data Exchange (IDX) program of CARETS. This web site may reference real estate listing(s) held by a brokerage firm other than the broker and/or agent who owns this web site. The accuracy
of all information, regardless of source, including but not limited to square footages and lot sizes, is deemed reliable but not guaranteed and should be personally verified through personal
inspection by and/or with the appropriate professionals.
Back to Table of Contents
Listings MLS BLOG Website
Hady Chahine
• 310-404-5361