march 2015 manhattan beach real estate market trends update
TRANSCRIPT

Table of
Contents
Key Statistics for March
Sales 2015 Residential Sales Stats Year-to-Year Total Sales by Map Area Median 2015 Median Sales Stats Year-to-Year Median Sales by Map Area Listings 2015 Active Listings by Map Area 2015 Total Active Listings vs. Total Sales Year-to-Year Active Listings by Map Area Inventory 2015 Months of Inventory by Map Area Year-to-Year Months of Inventory
Outlook for April
About Hady Chahine Contact Information

Key Statistics for March
Back to Table of Contents
= trending positive = trending positive
= trending negative = trending negative
Month-to-Month Comparison Feb 2015 Mar 2015 Delta (qty) Delta (%) Increase Decrease
Total Sales 19 34 15 78.9%
Median Sales Price 1,750,000 1,690,000 (60,000) -3.4%
Median Days to Sell 32 25 -7 -21.9%
Listings 57 77 20 35.1%
Sales/Listing Ratio 33.3% 44.2% 0.109 32.7%
Months of Inventory 3 2.3 -0.7 -23.3%
Monthly Comparison Year-to-Year Mar 2014 Mar 2015 Delta Delta Increase Decrease
Total Sales 33 34 1 3.0%
Median Sales Price 1,717,000 1,690,000 (27,000) -1.6%
Median Days to Sell 26 25 -1 -3.8%
Listings 85 77 -8 -9.4%
Months of Inventory 2.2 2.3 0.1 4.5%

Back to Table of Contents
Total Sales Month-to-Month by Map Area Jan Feb Mar
Manhattan Bch Sand 6 3 12
Manhattan Bch Tree 1 6 6
Manhattan Bch Hill 3 2 1
Manhattan Village 3 2 4
Manhattan Bch Heights/Lib Vlg 2 3 4
Manhattan Bch Mira Costa 6 3 7
Total Sales 21 19 34
0
5
10
15
20
25
30
35
Jan Feb Mar
2015 Total Sales Month-to-Month by Map Area
Manhattan Bch Sand
Manhattan Bch Tree
Manhattan Bch Hill
Manhattan Village
Manhattan Bch Heights/Lib Vlg
Manhattan Bch Mira Costa
Total Sales

Back to Table of Contents
Total Sales Year-to-Year by Map Area 2013 2014 2015
Manhattan Bch Sand 15 7 12
Manhattan Bch Tree 8 9 6
Manhattan Bch Hill 5 4 1
Manhattan Village 1 2 4
Manhattan Bch Heights/Lib Vlg 4 5 4
Manhattan Bch Mira Costa 9 6 7
Total Sales 42 33 34
0
5
10
15
20
25
30
35
40
45
2013 2014 2015
Total Sales Year-to-Year by Map Area: March
Manhattan Bch Sand
Manhattan Bch Tree
Manhattan Bch Hill
Manhattan Village
Manhattan Bch Heights/Lib Vlg
Manhattan Bch Mira Costa
Total Sales

Back to Table of Contents
Median Sales Price Month-to-Month by Map Area Jan Feb Mar
Manhattan Bch Sand 1,577,500 2,826,000 2,240,000
Manhattan Bch Tree 2,400,000 2,360,000 2,724,418
Manhattan Bch Hill 3,500,000 2,525,000 4,300,000
Manhattan Village 1,260,000 855,000 1,179,750
Manhattan Bch Heights/Lib Vlg 908,125 1,291,875 1,304,000
Manhattan Bch Mira Costa 1,667,500 1,335,000 1,609,000
Market Median Sales Price 1,635,000 1,750,000 1,690,000
-
500,000
1,000,000
1,500,000
2,000,000
2,500,000
3,000,000
3,500,000
4,000,000
4,500,000
Jan Feb Mar
2015 Median Sales Price Month-to-Month by Map Area
Manhattan Bch Sand
Manhattan Bch Tree
Manhattan Bch Hill
Manhattan Village
Manhattan Bch Heights/Lib Vlg
Manhattan Bch Mira Costa
Market Median Sales Price

Back to Table of Contents
Median Sales Price Year-to-Year by Map Area 2013 2014 2015
Manhattan Bch Sand 1,595,000 1,979,000 2,290,000
Manhattan Bch Tree 1,472,500 1,717,000 2,000,000
Manhattan Bch Hill 2,825,000 3,725,000 2,825,000
Manhattan Village 825,000 1,017,500 1,199,000
Manhattan Bch Heights/Lib Vlg 1,040,950 1,249,000 1,308,000
Manhattan Bch Mira Costa 1,320,000 1,725,000 1,667,500
Market Median Sales Price 1,552,500 1,717,000 1,690,000
-
500,000
1,000,000
1,500,000
2,000,000
2,500,000
3,000,000
3,500,000
4,000,000
2013 2014 2015
Median Sales Price Year-to-Year by Map Area: March
Manhattan Bch Sand
Manhattan Bch Tree
Manhattan Bch Hill
Manhattan Village
Manhattan Bch Heights/Lib Vlg
Manhattan Bch Mira Costa
Market Median Sales Price
Back to Table of Contents
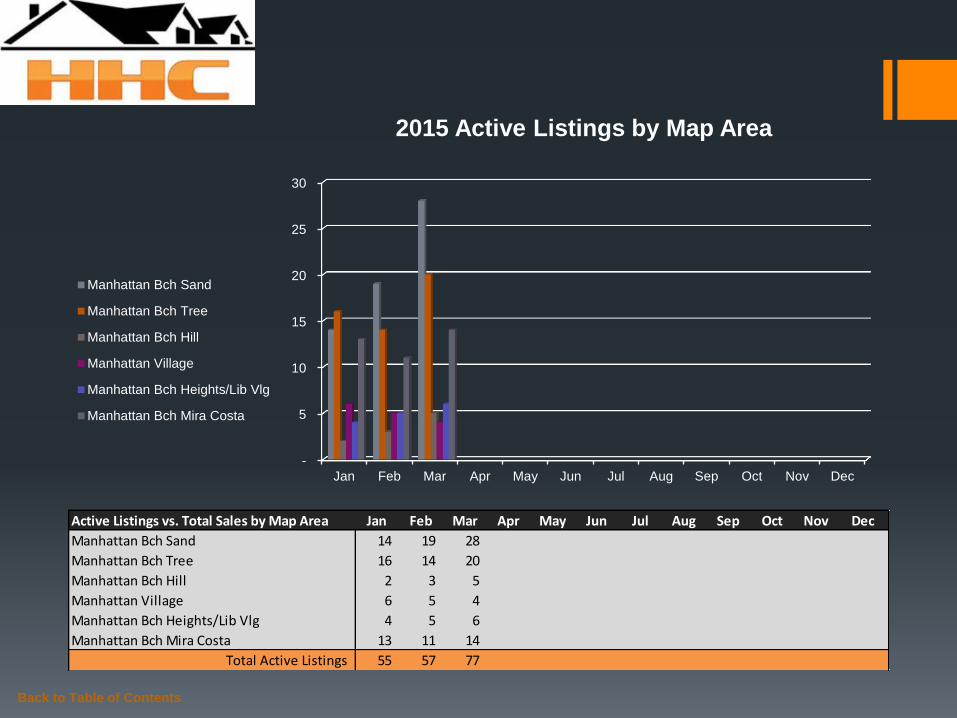
Active Listings vs. Total Sales by Map Area Jan Feb Mar Apr May Jun Jul Aug Sep Oct Nov Dec
Manhattan Bch Sand 14 19 28
Manhattan Bch Tree 16 14 20
Manhattan Bch Hill 2 3 5
Manhattan Village 6 5 4
Manhattan Bch Heights/Lib Vlg 4 5 6
Manhattan Bch Mira Costa 13 11 14
Total Active Listings 55 57 77
-
5
10
15
20
25
30
Jan Feb Mar Apr May Jun Jul Aug Sep Oct Nov Dec
2015 Active Listings by Map Area
Manhattan Bch Sand
Manhattan Bch Tree
Manhattan Bch Hill
Manhattan Village
Manhattan Bch Heights/Lib Vlg
Manhattan Bch Mira Costa

Back to Table of Contents
Active Listings vs. Total Sales by Map Area Jan Feb Mar Apr May Jun Jul Aug Sep Oct Nov Dec
Manhattan Bch Sand 14 19 28
Manhattan Bch Tree 16 14 20
Manhattan Bch Hill 2 3 5
Manhattan Village 6 5 4
Manhattan Bch Heights/Lib Vlg 4 5 6
Manhattan Bch Mira Costa 13 11 14
Total Active Listings 55 57 77
Total Sales 21 19 34
Sales/Listings Ratio 38.2% 33.3% 44.2%
-
10
20
30
40
50
60
70
80
Jan Feb Mar Apr May Jun Jul Aug Sep Oct Nov Dec
2015 Total Active Listings vs. Total Sales
Total Active Listings
Total Sales

Back to Table of Contents
Active Listings Year-to-Year by Map Area 2013 2014 2015
Manhattan Bch Sand 35 21 28
Manhattan Bch Tree 25 23 20
Manhattan Bch Hill 6 10 5
Manhattan Village 3 7 4
Manhattan Bch Heights/Lib Vlg 9 9 6
Manhattan Bch Mira Costa 7 15 14
Total Active Listings 85 85 77
0
10
20
30
40
50
60
70
80
90
2013 2014 2015
Active Listings Year-to-Year by Map Area: March
Manhattan Bch Sand
Manhattan Bch Tree
Manhattan Bch Hill
Manhattan Village
Manhattan Bch Heights/Lib Vlg
Manhattan Bch Mira Costa
Total Active Listings

Back to Table of Contents
Months of Inventory by Map Area Jan Feb Mar Apr May Jun Jul Aug Sep Oct Nov Dec
Manhattan Bch Sand 2.3 6.3 2.3
Manhattan Bch Tree 16.0 2.3 3.3
Manhattan Bch Hill 0.7 1.5 5.0
Manhattan Village 2.0 2.5 1.0
Manhattan Bch Heights/Lib Vlg 2.0 1.7 1.5
Manhattan Bch Mira Costa 2.2 3.7 2.0
-
2.0
4.0
6.0
8.0
10.0
12.0
14.0
16.0
Jan Feb Mar Apr May Jun Jul Aug Sep Oct Nov Dec
2015 Months of Inventory by Map Area
Manhattan Bch Sand
Manhattan Bch Tree
Manhattan Bch Hill
Manhattan Village
Manhattan Bch Heights/Lib Vlg
Manhattan Bch Mira Costa

Back to Table of Contents
Months of Inventory Year-to-Year Jan Feb Mar Apr May Jun Jul Aug Sep Oct Nov Dec
2013 2.9 3.4 2.0 1.7 1.8 2.5 2.1 2.0 2.2 2.0 1.5 0.8
2014 3.0 2.2 2.2 2.0 2.0 2.0 2.2 2.0 2.8 1.9 1.5 1.1
2015 2.6 3.0 2.3
-
0.5
1.0
1.5
2.0
2.5
3.0
3.5
Jan Feb Mar Apr May Jun Jul Aug Sep Oct Nov Dec
Months of Inventory Year-to-Year
2013
2014
2015

Outlook for April
Noticeably unaffected by stock market turmoil in March, the Manhattan Beach real estate market posted
several positive data points including, but not limited to, a 78.9% bump in total sales followed by a 21.9% drop
in median days to sale, 35.1% increase in active listings, and a 32.7% rise in the sales/listing ratio. According to
C.A.R., “The housing market is picking up momentum and continuing its upward trend as economic conditions
improved throughout the state.”
See http://www.car.org/newsstand/newsreleases/2015releases/march2015sales?view=Standard
Given the aforementioned it seems reasonable to conclude the supply/demand relationship governing
Manhattan Beach real estate activities will only grow stronger as summer draws nears. With that in mind, are
you ready to sell your home? Or, are you in the market to purchase the house of your dreams? Either way, I
can help. To schedule a free consultation, please contact me today!
Your recap…
Back to Table of Contents
Month-to-Month Comparison Feb 2015 Mar 2015 Delta (qty) Delta (%) Increase Decrease
Total Sales 19 34 15 78.9%
Median Sales Price 1,750,000 1,690,000 (60,000) -3.4%
Median Days to Sell 32 25 -7 -21.9%
Listings 57 77 20 35.1%
Sales/Listing Ratio 33.3% 44.2% 0.109 32.7%
Months of Inventory 3 2.3 -0.7 -23.3%

Serving South Bay Home Buyers and Sellers Since 2001
RE/MAX Top 4 Team in California – 2012
RE/MAX 100% Club - 2011
Shorewood Realtors Top 5% in Overall Sales 2001-2006, 2008-2010
Back to Table of Contents
About
Hady Chahine…

The information being provided by CARETS (CLAW, CRISNet MLS, DAMLS, CRMLS, i-Tech MLS, and/or VCRDS) is for the visitor’s personal, non-commercial use and may not be used for
any purpose other than to identify prospective properties visitor may be interested in purchasing. Any information relating to a property referenced on this web site comes from the Internet
Data Exchange (IDX) program of CARETS. This web site may reference real estate listing(s) held by a brokerage firm other than the broker and/or agent who owns this web site. The accuracy
of all information, regardless of source, including but not limited to square footages and lot sizes, is deemed reliable but not guaranteed and should be personally verified through personal
inspection by and/or with the appropriate professionals.
Back to Table of Contents
Listings MLS BLOG Website