march 10, 2006 economic study, feasibility...
TRANSCRIPT
Spectrum Gaming Group LLC 1001 Tilton Road, Suite 201 Northfield NJ 08225 March 10, 2006
Economic Study,
Feasibility Report Regarding proposed Pocono Manor casino/hotel complex Prepared for Matzel and Associates Acquisition LLC
Executive Summary..................................................................................................................... 4 Introduction .................................................................................................................................. 6 Background: Capital investment ............................................................................................... 8 Working with public sector: parallel interests......................................................................... 9 Construction estimates.............................................................................................................. 11 Projecting gaming revenue....................................................................................................... 12
Core markets...........................................................................................................13 Gaming revenue model: assumptions...........................................................................13 Number of slots: Initial installation of 3,000 units.....................................................13 Determining optimal level of machines..................................................................... 17 Peak‐period analysis: Justifying 5,000 slots ...........................................................18
Number of regular gaming customers: up to 1.4 million adults...............................18 Sensitivity analysis: Pocono Manor’s share ...........................................................19 Assumptions: hotel occupancy, ADR ................................................................... 20
Determining ‘lift’: benefits of hotel rooms................................................................ 20 Sensitivity analysis: complimentary room nights..................................................21 Future expansion: Adding up to 1,000 additional rooms..................................... 22
Gauging Profitability................................................................................................................. 23 Revenue, earnings...................................................................................................................... 27
Competitive challenge: gaming-tax rates ..................................................................... 28 Leveraging strength: Creating a resort from a resort ........................................................... 30
Golf..........................................................................................................................31 Spa...........................................................................................................................31 Other assets............................................................................................................ 34 Targeting family market ........................................................................................ 35
Advancing public policy ........................................................................................... 35 Withstanding competition ........................................................................................ 36 Improving returns ......................................................................................................37 Benefits of building destinations .............................................................................. 40
Advancing public policy: Withstanding competition .......................................................... 41 Las Vegas experience ................................................................................................ 42 Borgata Hotel Casino & Spa .................................................................................. 45 Dover Downs Hotel & Conference Center............................................................ 46 Seminole Hard Rock Hotel & Casino .................................................................... 48
Convention business: added boost ........................................................................... 49 Meeting and Exhibit Space........................................................................................ 54
Tapping convention market .................................................................................. 54 Regional leadership ................................................................................................55
Page 2 of 96
Identifying capacity needs........................................................................................................ 68 Parking capacity ........................................................................................................ 78
Competitive landscape.............................................................................................................. 78 Access .............................................................................................................................79
Air access ................................................................................................................... 80 Comparative access: Pocono region ............................................................................. 82
Competition for license ............................................................................................. 82 Mount Airy Lodge...................................................................................................... 83 Pocono Raceway ........................................................................................................ 84
Regional competition .................................................................................................... 85 Pennsylvania.............................................................................................................. 85
Chester................................................................................................................... 86 Philadelphia Park ................................................................................................... 86 Philadelphia............................................................................................................ 86 Harrisburg area ...................................................................................................... 87 Lehigh Valley ......................................................................................................... 87 Mohegan Sun at Pocono Downs........................................................................... 88 Gettysburg.............................................................................................................. 88 Pittsburgh ............................................................................................................... 89 Erie area................................................................................................................. 89
New Jersey................................................................................................................. 90 New York ....................................................................................................................91
New York metro ......................................................................................................91 Catskills .................................................................................................................. 92 Long Island............................................................................................................. 92 Southern Tier ......................................................................................................... 92
Delaware .................................................................................................................... 93 Delaware Park ....................................................................................................... 93 Dover Downs.......................................................................................................... 93 Harrington Raceway .............................................................................................. 93
Connecticut................................................................................................................ 94 Maine ......................................................................................................................... 94 Rhode Island.............................................................................................................. 94 Maryland.................................................................................................................... 94
Conclusion .................................................................................................................................. 95
Page 3 of 96
Executive Summary Pocono Manor is competing for a Category 2 gaming license in Pennsylvania. If
successful, this would allow it to host up to 5,000 slot machines.
Pocono Manor is extremely well positioned to capitalize on several assets that would ensure both its long‐term viability and the economic health of the greater Pocono region:
The Pocono region already enjoys natural beauty and a thriving hospitality industry and is among the states top tourism locations with core assets – such as the Pocono Mountains Visitors Bureau that can help leverage marking efforts.
It has ample acreage and access to capital that would ensure it can develop an optimal mix of attractions that would make it an important regional entertainment destination.
It has easy access to several densely populated, affluent markets throughout the Mid‐Atlantic region, including New York City and its various suburbs.
The property already operates as a profitable resort but if selected as a licensed facility could ultimately be a highly profitable resort. Positioned as a northeast regional destination, targeting the middle market as well as affluent adults seeking a diverse entertainment experience. The property needs to do more than target a locals, convenience‐driven gaming market.
From the standpoint of the Poconos region and of the commonwealth of Pennsylvania, Pocono Manor would advance several public policies and maximize the potential benefits of such policies, from employment to tax revenue to attracting out‐of‐state visitation.
Pocono Manor would become the largest hotel and convention center in the greater Poconos region. As such, it would generate at least $800,000 annually in fees that would be used by the Pocono Mountain Visitors Bureau (“PMVB”) to promote the entire region. Such fees would likely be a self‐sustaining revenue source, promoting business throughout the region and promoting overnight visitation which would, in turn, generate future fees.
To be a successful regional destination, we recommend the property include the following features:
750 new hotel rooms, attached to the casino
50,000 square feet of convention space
Page 4 of 96
A significant retail, dining and entertainment offering
44,000 square feet for a coffee shop/deli, buffet, two gourmet restaurants and a nightclub/pub
An 1,800‐seat theater
4,150 spaces for casino guests in a parking garage
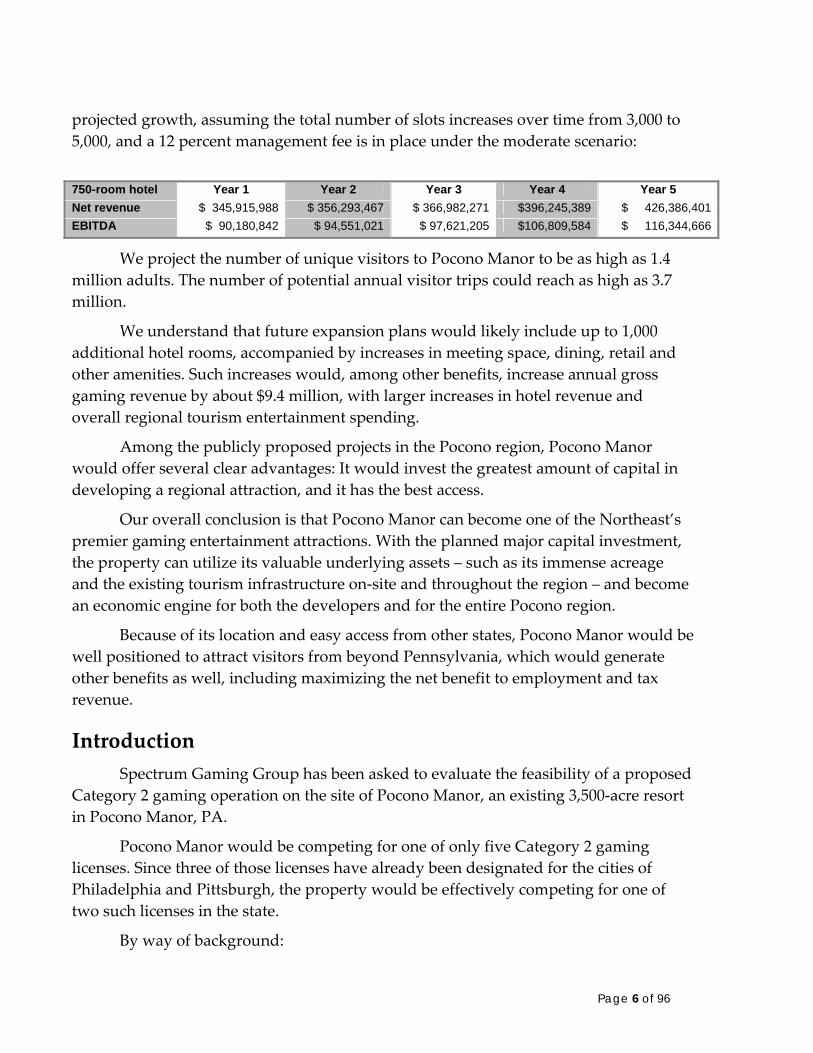
As planned by New England Design, the property will, in fact, include those features, plus many others that will collectively ensure that Pocono Manor would be a top‐tier competitor in the Northeastern United States. Such planned features include:
A. Porte Cochere 6 Lanes
B. Atrium/Front Desk 20,000 square feet +/-
C. Hotel Rooms 750 Keys
D. VIP Check-In 1,200 SF
E. Spa w/ Roof-Top Terraces 20,000 square feet / Terraces 10,000 SF
F. Fitness Center 3,750 SF
The estimated construction cost for such a project would be $446.8 million, exclusive of acquisition, site‐improvement or licensing costs. We recommend that the project be commenced with an initial installation of 3,000 slot machines (the cost of which is included in our construction estimates).
As the property grows its customer base and attracts conventions and other ancillary forms of business, it should expand as soon as allowable to the maximum number of 5,000 slots. It is our understanding that Matzel and Associates plans to do this.
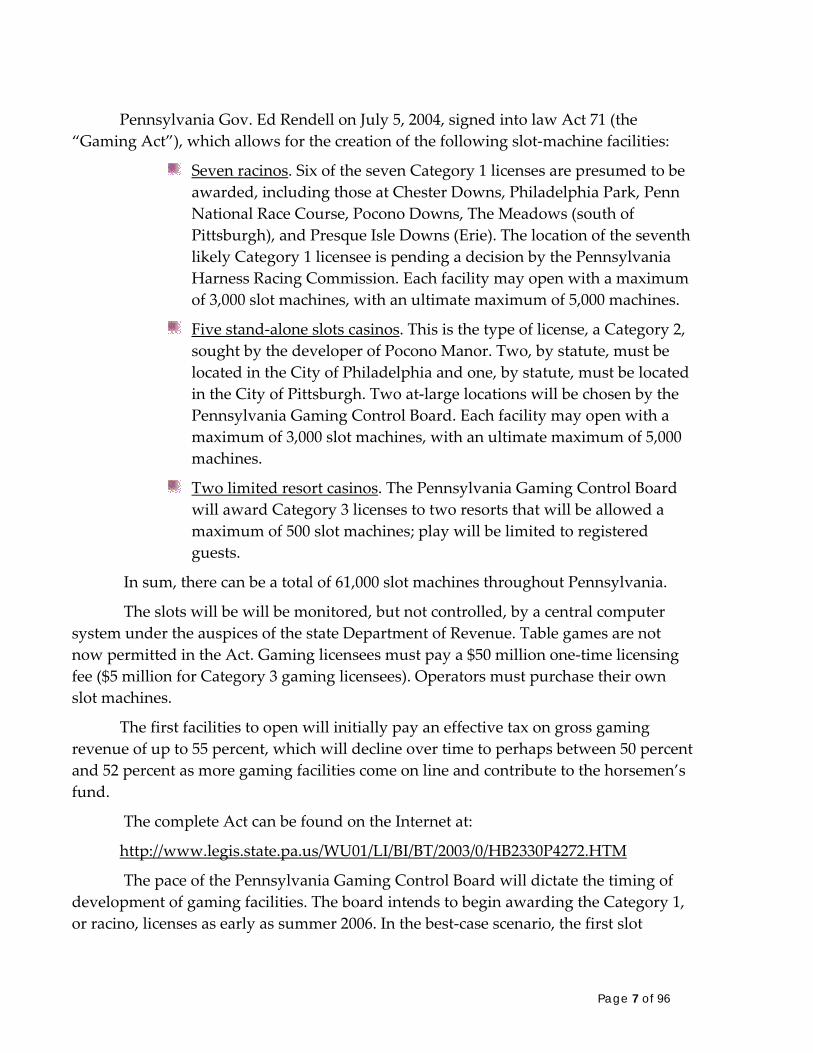
We anticipate that, with 750 rooms and 3,000 slots, Year 1 gaming revenue would be within the following ranges:
Worst-case scenario Moderate-case
scenario Best-case scenario
Expected daily win per unit $ 213 $ 286 $ 327
Total gaming revenue $ 233,758,512 $ 313,388,310 $ 358,592,186
Pocono Manor – with a recommended initial construction of 750 hotel rooms and 3,000 slot machines along with six restaurants, four lounges and 1,800‐seat theater – would generate earnings before interest, taxes, depreciation and amortization (EBITDA) of between $59.9 million and $131.2 million in Year 1. The table below shows five‐year
Page 5 of 96
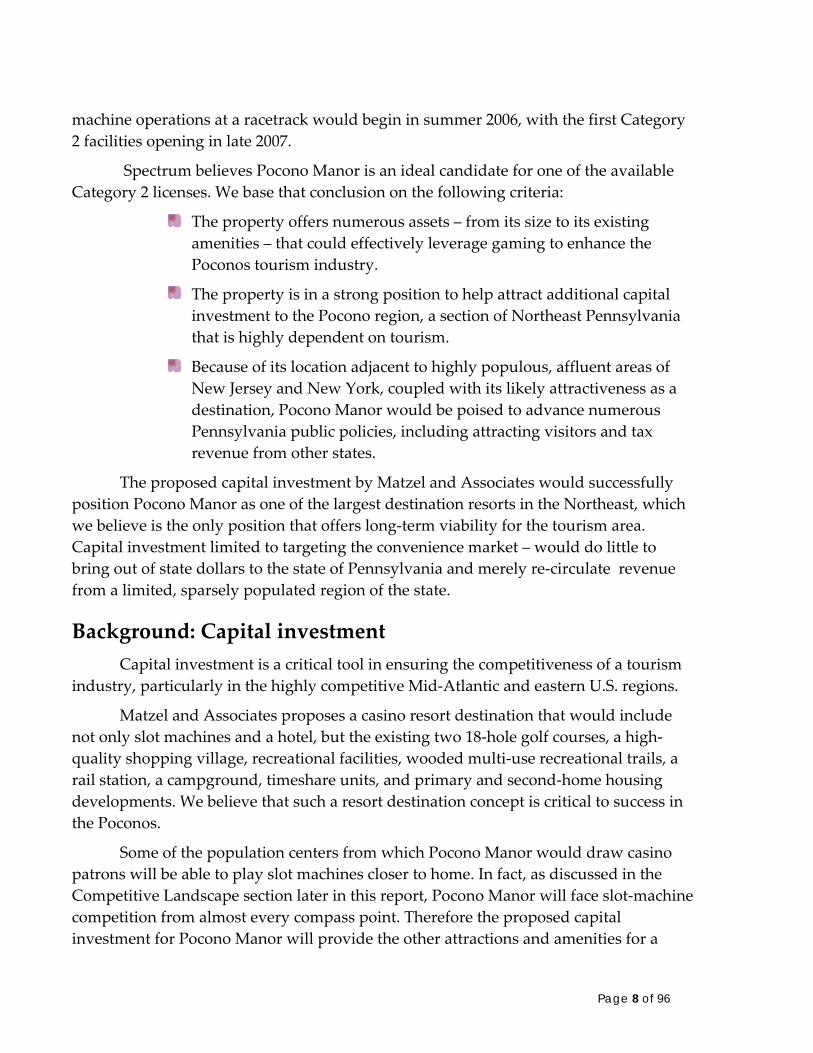
projected growth, assuming the total number of slots increases over time from 3,000 to 5,000, and a 12 percent management fee is in place under the moderate scenario:
750-room hotel Year 1 Year 2 Year 3 Year 4 Year 5 Net revenue $ 345,915,988 $ 356,293,467 $ 366,982,271 $396,245,389 $ 426,386,401 EBITDA $ 90,180,842 $ 94,551,021 $ 97,621,205 $106,809,584 $ 116,344,666
We project the number of unique visitors to Pocono Manor to be as high as 1.4 million adults. The number of potential annual visitor trips could reach as high as 3.7 million.
We understand that future expansion plans would likely include up to 1,000 additional hotel rooms, accompanied by increases in meeting space, dining, retail and other amenities. Such increases would, among other benefits, increase annual gross gaming revenue by about $9.4 million, with larger increases in hotel revenue and overall regional tourism entertainment spending.
Among the publicly proposed projects in the Pocono region, Pocono Manor would offer several clear advantages: It would invest the greatest amount of capital in developing a regional attraction, and it has the best access.
Our overall conclusion is that Pocono Manor can become one of the Northeast’s premier gaming entertainment attractions. With the planned major capital investment, the property can utilize its valuable underlying assets – such as its immense acreage and the existing tourism infrastructure on‐site and throughout the region – and become an economic engine for both the developers and for the entire Pocono region.
Because of its location and easy access from other states, Pocono Manor would be well positioned to attract visitors from beyond Pennsylvania, which would generate other benefits as well, including maximizing the net benefit to employment and tax revenue.
Introduction Spectrum Gaming Group has been asked to evaluate the feasibility of a proposed
Category 2 gaming operation on the site of Pocono Manor, an existing 3,500‐acre resort in Pocono Manor, PA.
Pocono Manor would be competing for one of only five Category 2 gaming licenses. Since three of those licenses have already been designated for the cities of Philadelphia and Pittsburgh, the property would be effectively competing for one of two such licenses in the state.
By way of background:
Page 6 of 96
Pennsylvania Gov. Ed Rendell on July 5, 2004, signed into law Act 71 (the “Gaming Act”), which allows for the creation of the following slot‐machine facilities:
Seven racinos. Six of the seven Category 1 licenses are presumed to be awarded, including those at Chester Downs, Philadelphia Park, Penn National Race Course, Pocono Downs, The Meadows (south of Pittsburgh), and Presque Isle Downs (Erie). The location of the seventh likely Category 1 licensee is pending a decision by the Pennsylvania Harness Racing Commission. Each facility may open with a maximum of 3,000 slot machines, with an ultimate maximum of 5,000 machines.
Five stand‐alone slots casinos. This is the type of license, a Category 2, sought by the developer of Pocono Manor. Two, by statute, must be located in the City of Philadelphia and one, by statute, must be located in the City of Pittsburgh. Two at‐large locations will be chosen by the Pennsylvania Gaming Control Board. Each facility may open with a maximum of 3,000 slot machines, with an ultimate maximum of 5,000 machines.
Two limited resort casinos. The Pennsylvania Gaming Control Board will award Category 3 licenses to two resorts that will be allowed a maximum of 500 slot machines; play will be limited to registered guests.
In sum, there can be a total of 61,000 slot machines throughout Pennsylvania.
The slots will be will be monitored, but not controlled, by a central computer system under the auspices of the state Department of Revenue. Table games are not now permitted in the Act. Gaming licensees must pay a $50 million one‐time licensing fee ($5 million for Category 3 gaming licensees). Operators must purchase their own slot machines.
The first facilities to open will initially pay an effective tax on gross gaming revenue of up to 55 percent, which will decline over time to perhaps between 50 percent and 52 percent as more gaming facilities come on line and contribute to the horsemen’s fund.
The complete Act can be found on the Internet at:
http://www.legis.state.pa.us/WU01/LI/BI/BT/2003/0/HB2330P4272.HTM
The pace of the Pennsylvania Gaming Control Board will dictate the timing of development of gaming facilities. The board intends to begin awarding the Category 1, or racino, licenses as early as summer 2006. In the best‐case scenario, the first slot
Page 7 of 96
machine operations at a racetrack would begin in summer 2006, with the first Category 2 facilities opening in late 2007.
Spectrum believes Pocono Manor is an ideal candidate for one of the available Category 2 licenses. We base that conclusion on the following criteria:
The property offers numerous assets – from its size to its existing amenities – that could effectively leverage gaming to enhance the Poconos tourism industry.
The property is in a strong position to help attract additional capital investment to the Pocono region, a section of Northeast Pennsylvania that is highly dependent on tourism.
Because of its location adjacent to highly populous, affluent areas of New Jersey and New York, coupled with its likely attractiveness as a destination, Pocono Manor would be poised to advance numerous Pennsylvania public policies, including attracting visitors and tax revenue from other states.
The proposed capital investment by Matzel and Associates would successfully position Pocono Manor as one of the largest destination resorts in the Northeast, which we believe is the only position that offers long‐term viability for the tourism area. Capital investment limited to targeting the convenience market – would do little to bring out of state dollars to the state of Pennsylvania and merely re‐circulate revenue from a limited, sparsely populated region of the state.
Background: Capital investment Capital investment is a critical tool in ensuring the competitiveness of a tourism
industry, particularly in the highly competitive Mid‐Atlantic and eastern U.S. regions.
Matzel and Associates proposes a casino resort destination that would include not only slot machines and a hotel, but the existing two 18‐hole golf courses, a high‐quality shopping village, recreational facilities, wooded multi‐use recreational trails, a rail station, a campground, timeshare units, and primary and second‐home housing developments. We believe that such a resort destination concept is critical to success in the Poconos.
Some of the population centers from which Pocono Manor would draw casino patrons will be able to play slot machines closer to home. In fact, as discussed in the Competitive Landscape section later in this report, Pocono Manor will face slot‐machine competition from almost every compass point. Therefore the proposed capital investment for Pocono Manor will provide the other attractions and amenities for a
Page 8 of 96

broad‐based resort destination that gives patrons compelling reasons to bypass slot machines closer to home.
Working with public sector: parallel interests In our experience, the most successful gaming properties are those whose
interests are directly parallel with the interests of the local community, of the region and of the state as a whole. Intuitively, this makes sense. When a property operates successfully, it attracts visitors from a wide region, including adults from other states. As it reinvests in itself, it adds jobs and becomes a magnet for the region. All that obviously benefits the wider area, and advances public policy. Similarly, public policy should be such that it promotes tourism and enhances the investment climate.
In Pennsylvania, and in the Pocono Mountains region in general, the following broad‐based public policy goals have been developed:
Promote tourism.
Generate tax revenue for the state.
Encourage Pennsylvanians to spend money in‐state.
Create employment.
The planned development at Pocono Manor would clearly advance all those public policies. We then looked at the necessary ingredients to ensure that the interests of the operator and of the public sector would be parallel. Such ingredients would include such factors as:
An existing tourism infrastructure.
Public and private leadership that has the resources to market the region.
Interestingly and coincidentally, the Pocono Mountain Visitors Bureau (“PMVB”) recently gained the ability to collect money generated from a 3 percent tax on hotel room nights to fund marketing efforts to promote tourism in the region.
Based on our observations, the Pocono Mountains Vacation Bureau appears to be an aggressive, dynamic agency that has worked hard to promote the region and to identify its customers and potential customers. We base that observation on conversations with personnel there and at other visitors bureaus throughout the nation, and on the quality of the research presented by the PMVB.
In previous years, the PMVB has relied mostly on membership dues, marketing and brochure revenue, Tourist Promotion Agency funds, as well as some other funding
Page 9 of 96
sources. This has given it a budget of $6.2 million.1 To put that in perspective, the Atlantic City Convention and Visitors Bureau has an annual operating budget of around $9 million.
According to Executive Director Robert Uguccioni, the PMVB has recently been authorized by state statute to begin receiving a 3 percent fee on all occupied room nights in the region.
This should provide a more robust and stable funding source. In our experience, such room fees offer numerous benefits, including:
They are self‐sustaining. By funding a marketing budget, they will be used to attract new visitors and generate repeat visitation, which will generate more room fees in coming periods.
They can be passed on to customers, who are not likely to object to the reasonable fee of 3 percent.
By focusing on occupied room nights, they will ensure fairness in the system, with the major beneficiaries – the largest properties with the most rooms – also serving as the major providers.
With that latter point in mind, Pocono Manor will clearly be a huge beneficiary of the PMVB’s budget, but will also be the largest provider of funding.
With 750 rooms – a number that can be expected to increase in coming years as the property becomes more successful – Pocono Manor would have a theoretical 273,750 room nights that could generate fees.
We expect a year‐round occupancy rate of 80 percent, a number that is generally higher than can be found at a typical Poconos resort hotel. However, the presence of gaming on site will inevitably increase the high‐demand seasons of summer and winter, and will generate year‐round demand.
We expect that, even on mid‐week, off‐season periods, the growth of conventions and meetings, coupled with competitively priced room products for gaming and non‐gaming customers, the property could easily meet the 80‐percent threshold.
That would create 219,000 occupied room nights. We expect that the property would generate an average year‐round ADR in excess of $120. That would generate at least $788,400 in marketing fees for the PMVB.
We expect that, in reality, the property will perform much better than that base case, enjoying an ADR of $150 (see the section on hotel occupancy), with an occupancy
1 2005 Pocono Mountains Annual Report
Page 10 of 96

rate of 90 percent, which would generate $1.1 million in marketing fees. However, we expect that the better gaming customers, as they are identified, will qualify for complimentary rooms or rooms at reduced rates. With that in mind, we think that the property can reasonably generate at least $800,000 in marketing fees for the PMVB.
Construction estimates In estimating construction costs, we relied on our experience in the eastern
United States, including estimates prepared in conjunction with architectural firms. The estimates do not include any costs for acquisition, site preparation or environmental clean‐up.
In preparing these estimates, we rely on industry guidelines that allocate approximately 40 square feet of space for each slot machine, an estimate that includes all necessary aisle and support space. The following summarizes our estimate for a 3,000‐slot property with a square‐footage build out to accommodate 5,000 slots in the future:
Each hotel room would include 450 square feet of space and a three‐fixture bath.
The costs per hotel room include a built‐in allocation for support and common areas, as well as attendant meeting and banquet space that would total about 20,000 square feet.
Slot‐machine acquisition costs are inclusive of customer‐rating interface and slot bases.
The information technology investment includes a casino management system, human resource system, point of sale system, hotel system, and accounting systems, all inclusive of cabling.
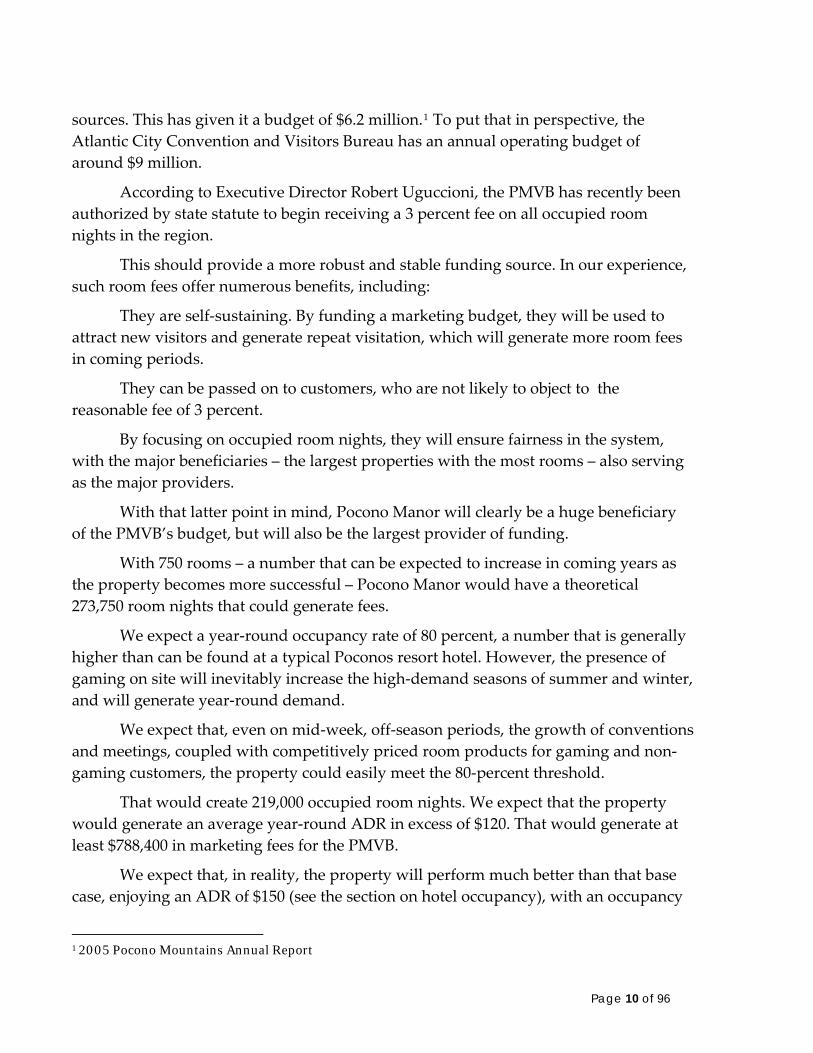
750 rooms Total units Units of Measure
Cost per Unit Total
Casino (3,000 slots, built for 5,000 slots) with Back of House Support 200,000 Square feet $ 600 $ 120,000,000 Slots 3,000 Units $ 15,000 $ 45,000,000 Information Technology Investment Various Various $8,000,000 $ 8,000,000 Retail Space 47,500 Square feet $350 $16,625,000 Convention Space 60,000 Square feet $400 $24,000,000 Restaurants (Coffee Shop/Deli, Buffet, 6 restaurants, 4 Lounges/Pub) 64,300 Square feet $ 450 $ 28,935,000
Page 11 of 96
750 rooms Total units Units of Measure
Cost per Unit Total
Hotel (750 Keys with Meeting Rooms and Banquet Facilities)
750 Keys $ 175,000 $131,250,000 Theater (1,800 seats)
36,000 Square feet $ 250 $ 9,000,000 Parking Structure (4,150 spaces)
4,150 Spaces $ 13,500 $ 56,025,000 Spa & 2 Pools 20,000 Square feet $400 $8,000,000 Total Estimated Cost2 $446,835,000
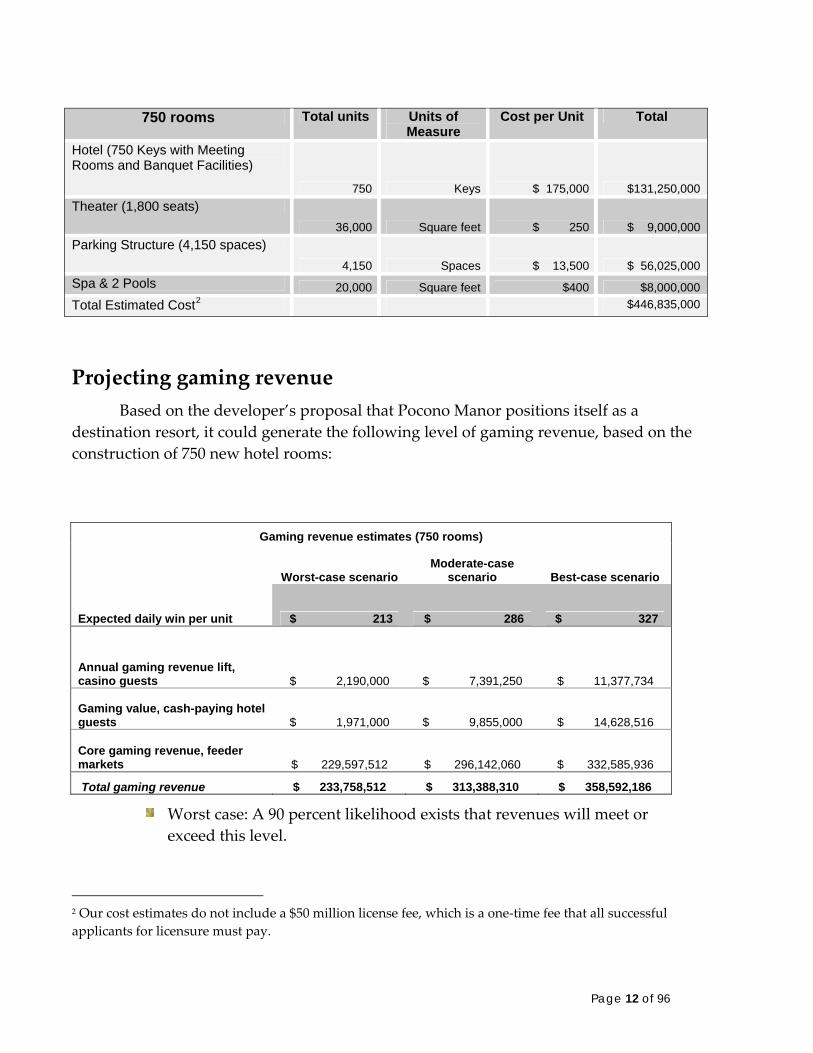
Projecting gaming revenue Based on the developer’s proposal that Pocono Manor positions itself as a
destination resort, it could generate the following level of gaming revenue, based on the construction of 750 new hotel rooms:
Gaming revenue estimates (750 rooms)
Worst-case scenario Moderate-case
scenario Best-case scenario
Expected daily win per unit $ 213 $ 286 $ 327
Annual gaming revenue lift, casino guests $ 2,190,000 $ 7,391,250 $ 11,377,734
Gaming value, cash-paying hotel guests $ 1,971,000 $ 9,855,000 $ 14,628,516
Core gaming revenue, feeder markets $ 229,597,512 $ 296,142,060 $ 332,585,936
Total gaming revenue $ 233,758,512 $ 313,388,310 $ 358,592,186
Worst case: A 90 percent likelihood exists that revenues will meet or exceed this level.
2 Our cost estimates do not include a $50 million license fee, which is a one‐time fee that all successful applicants for licensure must pay.
Page 12 of 96
Moderate case: A 50 percent likelihood exists that revenues will meet or exceed this level.
Best case: A 20 percent likelihood exists that revenues will meet or exceed this level.
Core markets We examined the 10 counties closest to Pocono Manor, and found a population
of 1,539,489 adults. We then estimated a gaming participation rate of 33 percent and have estimated that more than 500,000 adults have the desire to gamble. These adults presently produce a total gaming value of $134.2 million in our moderate scenario. Most of that is presently spent in Atlantic City.
Of the $134 million in potential revenue, we have estimated that Pocono Manor – positioned as a regional, amenity‐laden entertainment destination in the market – would capture at least 60 percent, or $80.4 million in gaming revenue from those close markets. The remainder, or 40 percent of the gaming revenue potential, would be captured by Pocono Downs’ racino, or would remain in Atlantic City. However, we note that Pocono Manor – as a full‐service destination – would be highly competitive against Atlantic City for that dollar due to its significantly shorter drive time.
Pocono Manor would garner the majority of revenues from these core markets due to it superior access and the availability of accompanying amenities. The real potential for upside in these convenience markets within 60 miles may be captured in increased trip frequency due to close proximity.
Gaming revenue model: assumptions
Number of slots: Initial installation of 3,000 units
The first assumption built into our model is the projected number of slots. We support the wisdom that says a Category 2 facility should start with 3,000 slots, and if projections hold, the number can increase in future years up to the statutory maximum of 5,000.
We believe this is how slots will roll out in Pennsylvania. First, the state would limit openings to no more than 3,000. Secondly, in most instances, that is more than public policy; it is good advice.
Page 13 of 96
At the February 2005 Pennsylvania Gaming Congress3, analyst Aimee Marcel of Jefferies & Co. made the point that the initial installations would be likely lower to avoid the risk of being perceived as “empty.” We concur.
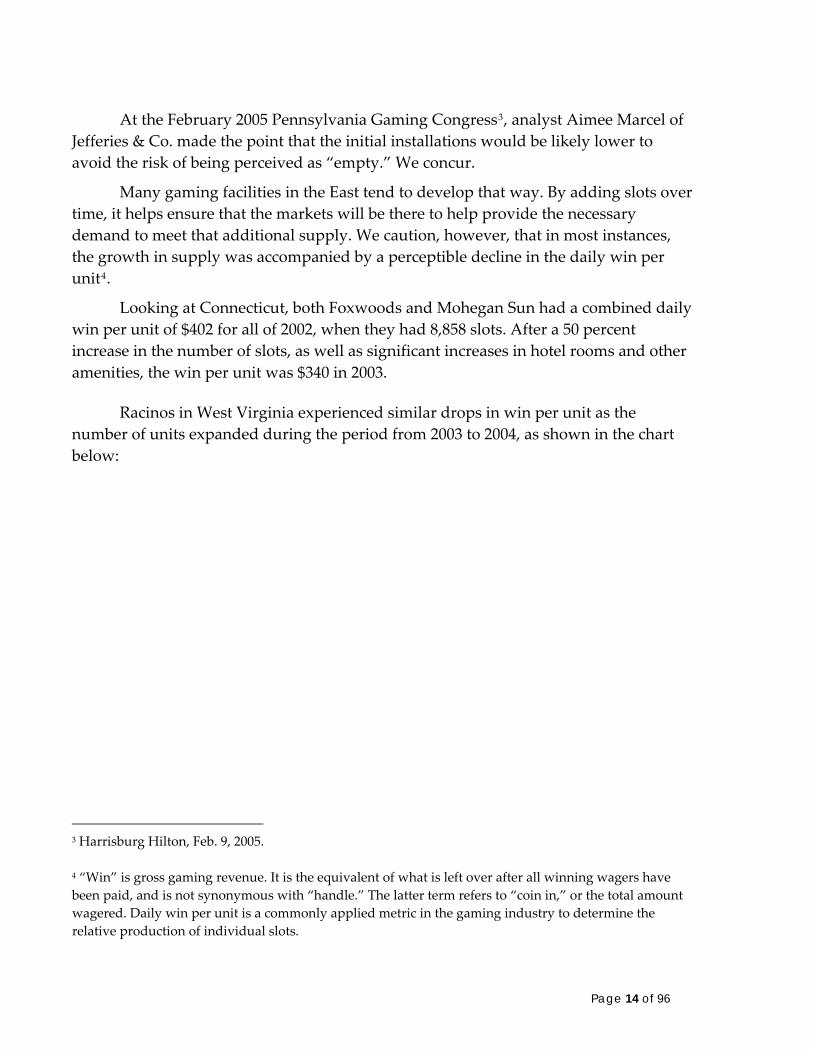
Many gaming facilities in the East tend to develop that way. By adding slots over time, it helps ensure that the markets will be there to help provide the necessary demand to meet that additional supply. We caution, however, that in most instances, the growth in supply was accompanied by a perceptible decline in the daily win per unit4.
Looking at Connecticut, both Foxwoods and Mohegan Sun had a combined daily win per unit of $402 for all of 2002, when they had 8,858 slots. After a 50 percent increase in the number of slots, as well as significant increases in hotel rooms and other amenities, the win per unit was $340 in 2003.
Racinos in West Virginia experienced similar drops in win per unit as the number of units expanded during the period from 2003 to 2004, as shown in the chart below:
3 Harrisburg Hilton, Feb. 9, 2005. 4 “Win” is gross gaming revenue. It is the equivalent of what is left over after all winning wagers have been paid, and is not synonymous with “handle.” The latter term refers to “coin in,” or the total amount wagered. Daily win per unit is a commonly applied metric in the gaming industry to determine the relative production of individual slots.
Page 14 of 96

West Virginia: Win per unit vs. no. of units
$0
$50
$100
$150
$200
$250
$300Ja
n-02
Apr
-02
Jul-0
2
Oct
-02
Jan-
03
Apr
-03
Jul-0
3
Oct
-03
Jan-
04
Dai
ly w
in p
er u
nit
0
2,000
4,000
6,000
8,000
10,000
12,000
no. o
f uni
ts
Daily w in per unitno. of units
We did the same analysis with racinos in Rhode Island for the 10‐year period starting in 1993. The trends were different, although the number of units in the state has been relatively low, as shown in the chart below:
Rhode Island: Win per unit vs. no. of units
$0
$50
$100
$150
$200
$250
$300
$350
1993
1994
1995
1996
1997
1998
1999
2000
2001
2002
2003
Dai
ly w
in p
er u
nit
0
500
1,000
1,500
2,000
2,500
3,000
3,500no
. of u
nits
Daily w in per unitNo. of units
Page 15 of 96

So, based on our revenue projections – based on 3,000 units in an initial installation – the daily win per unit would range from $177 to $253. To put that in perspective, the following table shows daily win per unit for all gaming properties in the northeastern United States for the most recent 12‐month period:
LTM OCTOBER 2005 Win No. of units Daily win per unit
Foxwoods $ 815,598,924 7,409 $ 302
Mohegan Sun $ 864,082,894 6,230 $ 380
Connecticut total $ 1,679,681,818 13,639 $ 337
Delaware Park $ 271,582,000 2,500 $ 298
Dover Downs $ 193,993,000 2,500 $ 213
Harrington Raceway $ 111,787,400 1,517 $ 202
Delaware total $ 577,362,400 6,517 $ 243
AC Hilton $ 204,042,417 2,046 $ 273
Bally's $ 471,843,020 5,707 $ 227
Borgata $ 435,488,370 3,562 $ 335
Caesars $ 358,534,392 3,297 $ 298
Harrah's $ 416,759,807 3,899 $ 293
Resorts $ 200,716,168 2,890 $ 190
Sands $ 139,855,514 2,166 $ 177
Showboat $ 361,911,149 3,943 $ 251
Tropicana $ 295,363,217 4,300 $ 188
Trump Marina $ 201,719,494 2,511 $ 220
Trump Plaza $ 226,087,734 2,776 $ 223
Trump Taj Mahal $ 333,357,098 4,361 $ 209
New Jersey total $ 3,645,678,380 41,459 $ 241
Batavia Downs (165 days) $ 11,348,580 586 $ 117
Fairgrounds $ 36,937,021 990 $ 103
Finger Lakes $ 69,412,985 1,010 $ 189
Monticello $ 66,047,277 1,718 $ 106
Saratoga $ 99,642,436 1,324 $ 207
New York total $ 272,039,719 5,055 n/a
Lincoln Park $ 326,851,497 2,775 $ 323
Newport Grand $ 78,652,485 1,037 $ 208
Rhode Island total $ 405,503,981 3,812 $ 291
Charles Town Races $ 392,414,765 3,977 $ 271
Mountaineer Park $ 251,926,633 3,160 $ 219
Tri-State Park $ 64,730,820 1,747 $ 102
Wheeling Island $ 189,608,383 2,263 $ 230
West Virginia total $ 898,680,600 11,148 $ 221
NORTHEAST TOTAL $ 7,478,946,899 81,630 $ 251
Based on our model, the moderate‐case scenario would produce a daily win per unit roughly equivalent to that of Harrah’s Atlantic City (which has less than 4,000 units), while the best‐case would put the daily win per unit at a level slightly below
Page 16 of 96
Borgata in Atlantic City, which has about 3,500 units. The worst‐case would generate a daily win per unit roughly equivalent to Bally’s in Atlantic City, which has more than 5,800 units, or Newport Grand in Rhode Island, at about 1,000 units.
Based on the moderate‐case and best‐case scenarios, the daily win per unit at Pocono Manor would exceed the average for the Northeast.
Determining optimal level of machines
Well‐managed slot floors are never 100 percent occupied, even in the most demanding hours. A fully occupied floor means that the property lacks a sufficient number of machines to meet various market segments, and likely is turning away business.
One important rule of thumb is that, when daily win per unit, exceeds $250, a property should consider increasing the number and variety of slots. Thus, based on our analysis, Pocono Manor would appear to be a candidate for a quick expansion.
Pocono Manor is considering an initial installation of 3,000 units, a level determined by both regulatory and market limits. Still, the property should consider increasing that number as soon as practicable, particularly if the property meets or exceeds the revenue projections in our moderate scenario within the first year of operation. We find that a greater number of slots results in a more pleasant customer experience, since those customers are more likely to find and play the machines of their choice. We recognize the statutory limitations that prohibit starting with 5,000 machines, but we believe that a level of 5,000 would be justified, however, if the attendant nongaming amenities such as hotel rooms, conventions and meetings, along with dining, retail and nightlife help grow demand. Based on our model, four out of the six scenarios shown in the previous tables would warrant serious examinations as to the possibility of adding machines.
We caution against a commonly held assumption that adding more slots will inevitably drive additional demand. That would only occur if certain pre‐conditions exist, such as visitors being unable to play their favorite machines at peak hours. Otherwise, adding more machines would simply dilute the daily win per unit and increase the operator’s costs. Note that, under the scenarios outlined above, moving too quickly from 3,000 units to 5,000 units – absent catalysts to drive additional demand – would send the daily win per unit under $200.
The chief catalysts that could drive demand are: improved amenities, and an effective marketing program that identifies, targets and rewards customer.
Page 17 of 96
Peak‐period analysis: Justifying 5,000 slots Our analysis indicates that, under the best scenario, the number of adult visitors
at peak periods – such as July 4th or Memorial Day weekends – could reach as many as 16,000 adults in a 24‐hour period. (The methodology as to how we reached that estimate is detailed later in the report.) The more likely peak would be closer to 14,000.
We believe that one important determinant as to when gaming capacity should be expanded is when customers cannot find a machine to play during peak periods. During such periods, business is being turned away and customers are having an unpleasant experience.
So, we set out to determine the ideal ratio between peak‐period visitation and gaming positions. In Atlantic City, the number of adults visiting during a peak day is about 138,900. The number of gaming positions in Atlantic City is 49,632, translating to a ratio of 2.8 visitors per gaming position during a peak day.
With 750 available rooms, based on our moderate scenario, Pocono Manor would generate 14,000 visitor trips on a peak day. To maintain the same ratio as Atlantic City, Pocono Manor would need 5,000 gaming positions to avoid turning away business during peak periods.
Number of regular gaming customers: up to 1.4 million adults
Spectrum Gaming Group examined 72 counties in three states to determine the potential pool of adults who could become regular visitors to a casino at Pocono Manor. We examined each county on an individual basis, focusing on certain criteria:
The number of adults 21 and older
The potential traveling distance to Pocono Manor
The percentage of adults in each county who would be casino visitors, i.e., the penetration rate
The share of adults who would visit competing properties –existing and/or potential – in the region
The potential gaming budget for such adults
The assumptions varied by county. For example, we note that for the closest counties in Pennsylvania and northwest New Jersey, the gaming budget per trip might be smaller than from other areas, but the frequency of visitation would be higher, and Pocono Manor would get a larger share of the gaming budget than it would from more distant counties.
Page 18 of 96
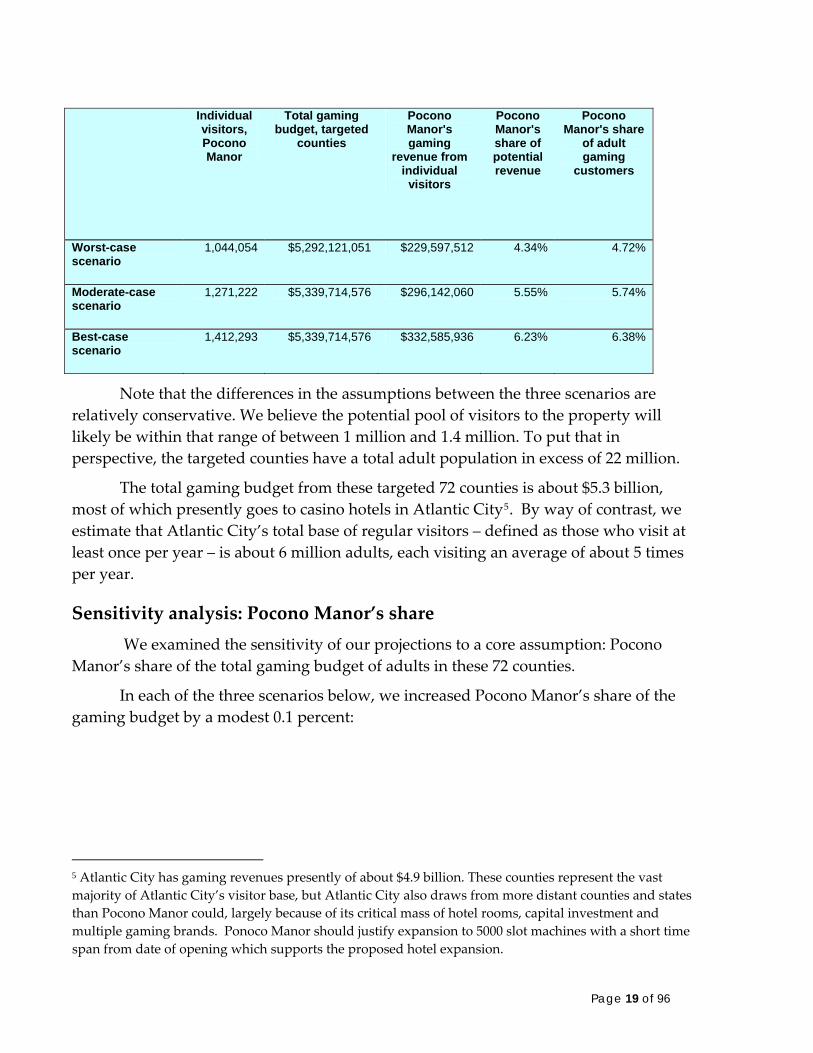
Individual visitors, Pocono Manor
Total gaming budget, targeted
counties
Pocono Manor's gaming
revenue from individual
visitors
Pocono Manor's share of potential revenue
Pocono Manor's share
of adult gaming
customers
Worst-case scenario
1,044,054 $5,292,121,051 $229,597,512 4.34% 4.72%
Moderate-case scenario
1,271,222 $5,339,714,576 $296,142,060 5.55% 5.74%
Best-case scenario
1,412,293 $5,339,714,576 $332,585,936 6.23% 6.38%
Note that the differences in the assumptions between the three scenarios are relatively conservative. We believe the potential pool of visitors to the property will likely be within that range of between 1 million and 1.4 million. To put that in perspective, the targeted counties have a total adult population in excess of 22 million.
The total gaming budget from these targeted 72 counties is about $5.3 billion, most of which presently goes to casino hotels in Atlantic City5. By way of contrast, we estimate that Atlantic City’s total base of regular visitors – defined as those who visit at least once per year – is about 6 million adults, each visiting an average of about 5 times per year.
Sensitivity analysis: Pocono Manor’s share We examined the sensitivity of our projections to a core assumption: Pocono
Manor’s share of the total gaming budget of adults in these 72 counties.
In each of the three scenarios below, we increased Pocono Manor’s share of the gaming budget by a modest 0.1 percent:
5 Atlantic City has gaming revenues presently of about $4.9 billion. These counties represent the vast majority of Atlantic City’s visitor base, but Atlantic City also draws from more distant counties and states than Pocono Manor could, largely because of its critical mass of hotel rooms, capital investment and multiple gaming brands. Ponoco Manor should justify expansion to 5000 slot machines with a short time span from date of opening which supports the proposed hotel expansion.
Page 19 of 96
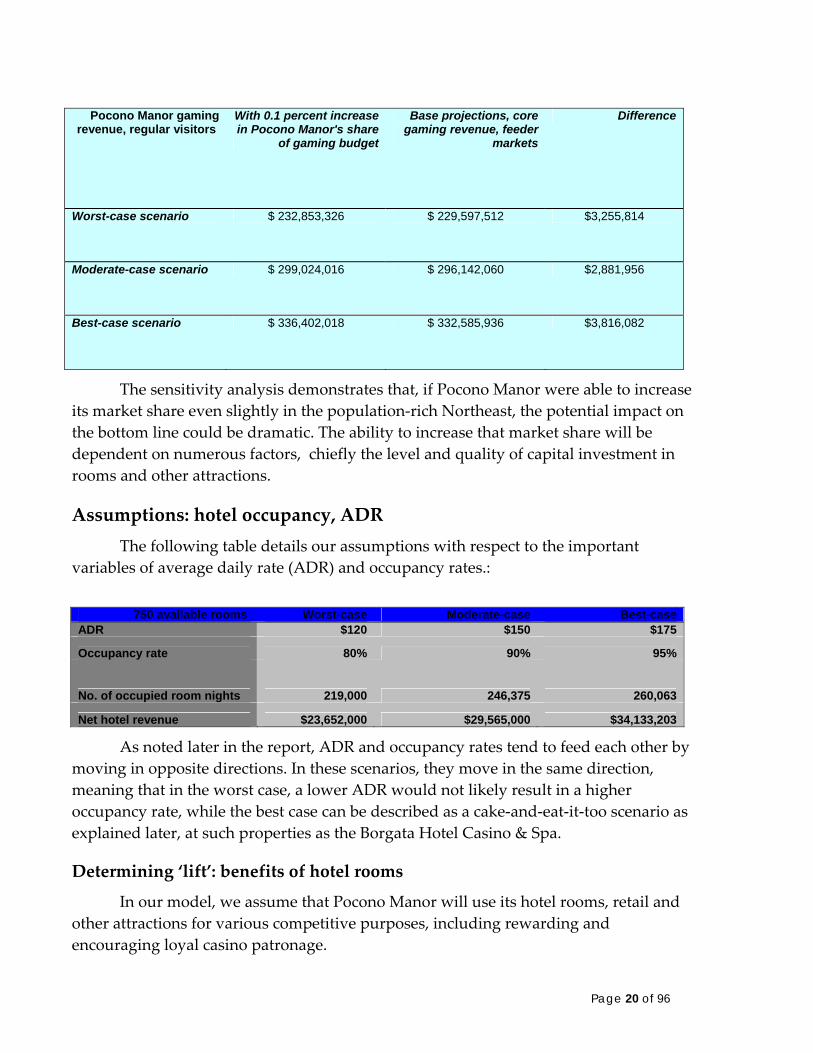
Pocono Manor gaming revenue, regular visitors
With 0.1 percent increase in Pocono Manor's share
of gaming budget
Base projections, core gaming revenue, feeder
markets
Difference
Worst-case scenario $ 232,853,326 $ 229,597,512 $3,255,814
Moderate-case scenario $ 299,024,016 $ 296,142,060 $2,881,956
Best-case scenario $ 336,402,018 $ 332,585,936 $3,816,082
The sensitivity analysis demonstrates that, if Pocono Manor were able to increase its market share even slightly in the population‐rich Northeast, the potential impact on the bottom line could be dramatic. The ability to increase that market share will be dependent on numerous factors, chiefly the level and quality of capital investment in rooms and other attractions.
Assumptions: hotel occupancy, ADR The following table details our assumptions with respect to the important
variables of average daily rate (ADR) and occupancy rates.:
750 available rooms Worst-case Moderate-case Best-case
ADR $120 $150 $175
Occupancy rate 80% 90% 95%
No. of occupied room nights 219,000 246,375 260,063
Net hotel revenue $23,652,000 $29,565,000 $34,133,203
As noted later in the report, ADR and occupancy rates tend to feed each other by moving in opposite directions. In these scenarios, they move in the same direction, meaning that in the worst case, a lower ADR would not likely result in a higher occupancy rate, while the best case can be described as a cake‐and‐eat‐it‐too scenario as explained later, at such properties as the Borgata Hotel Casino & Spa.
Determining ‘lift’: benefits of hotel rooms
In our model, we assume that Pocono Manor will use its hotel rooms, retail and other attractions for various competitive purposes, including rewarding and encouraging loyal casino patronage.
Page 20 of 96
As such, we have built in certain additional “lifts” to gaming revenue that could be generated through the effective management of such assets.
Our model assumes that, at various levels, Pocono Manor will offer complimentary or reduced‐rate room nights to its better customers, thus increasing casino revenue beyond normal levels. Additionally, cash‐paying hotel guests would also be expected to play in the casino, albeit with smaller gaming budgets. The assumptions are noted in the following table:
With 750 available rooms, the results were:
Cash-paying guests as pct. of occupied room nights
90% 80% 75%
Gaming lift per room night, casino guests
$100 $150 $175
Gaming Worth, Retail Hotel Room Night
$10 $50 $75
Annual gaming revenue lift, overnight casino guests
$2,190,000 $7,391,250 $11,377,734
Gaming value, cash-paying hotel guests
$1,971,000 $9,855,000 $14,628,516
The tables detail both the differing assumptions and the differing results of the various scenarios. Notably, even though the casino guests have a higher gaming value than their cash‐paying counterparts, both groups play critical roles in generating this important lift. In the worst‐case scenario – in which cash‐paying guests generate only $10 in casino play per room night – the casino guests are worth more in aggregate. In the other scenarios, the cash‐paying guests generate more gaming revenue, because of their much larger presence.
Note that this lift focuses solely on incremental gaming revenue, and does not account for hotel revenue, which is dealt with in more detail later.
Sensitivity analysis: complimentary room nights We analyzed the sensitivity of revenue to changes in management strategy with
respect to comping casino guests to room nights. Under certain conditions, such a policy can be an effective means of utilizing assets to maximize revenue and profitability. These conditions – such as existing periods of weak demand, a quality
Page 21 of 96

room product and access to a large customer database – would likely be present at Pocono Manor.
Focusing first on the moderate scenario, we adjusted two important variables – the gaming worth of casino guests, and the percentage of room nights set aside for casino guests – to determine their impact on overall revenue.
The results are summarized in the following table:
Pct. of occupied room nights set aside for casino guests
Gaming revenue (in millions) 750 rooms 10% 20% 30% 40% 50% 60% 70% $ 75 $309.1 $309.7 $310.3 $310.9 $311.5 $312.2 $312.8 $ 100 $309.7 $310.9 $312.2 $313.4 $314.6 $315.9 $317.1 $ 125 $310.3 $312.2 $314.0 $315.9 $317.7 $319.5 $321.4 $ 150 $310.9 $313.4 $315.9 $318.3 $320.8 $323.2 $325.7 $ 175 $311.5 $314.6 $317.7 $320.8 $323.9 $326.9 $330.0
Gam
ing
wor
th p
er ro
om n
ight
, cas
ino
gues
ts
$ 200 $312.2 $315.9 $319.5 $323.2 $326.9 $330.6 $334.3
Note that, as more rooms are added to the property, the differences become more pronounced as the value of the gaming customer increases. Indeed, the value of the gaming customer is more important than the percentage of room nights set aside for casino guests. We must caution, however, that – while it is relatively simple to set aside room nights for valued gaming customers – identifying the most valuable customers and securing their business becomes a much more competitive and complex exercise.
Future expansion: Adding up to 1,000 additional rooms Future plans for expansion may include a 1,000 room hotel tower with
approximately 108,000 square feet of amenity‐laden support with possible additional retail, dining and entertainment square footage. The additional hotel rooms would likely produce hotel revenues of $39.8 million at an average ADR of $150, with 90 percent occupancy and would contribute incremental gaming revenue of $9.4 million, assuming that 20 percent of the room nights would be complimentary, accompanied by a nightly gaming spend of $150 per complimentary room night. The total expansion has the potential to generate an accretive EBITDA of $12.3 million, with a 25 percent margin.
Page 22 of 96
Additionally, based on the 3 percent marketing tax, such an additional tower would generate an estimated $1.18 million annually that the Pocono Mountains Visitors Bureau would use to promote the region.
Gauging Profitability We have developed a projected profit‐and‐loss five year forecast for Pocono
Manor, based on the above scenarios and competition coming on line.
In the base profit‐loss forecast model, we have fixed and variable expenses. The major fixed expense items are marketing costs excluding promotional allowances, which are variable, labor, and selling, general and administrative. The variable expenses and their associated ratios are:
Gaming taxes are as high as 55 percent of gaming revenue.
The slot devices are voucher‐based.
One slot attendant per 150 games at a utilization rate of 30 percent.
Promotional allowances are 6 percent of revenues.
Payroll taxes are 8.8 percent of salaries and wages.
Benefit costs are 25.7 percent of salaries and wages.
Food and Beverage product costs are 33 percent of F&B revenue.
Casino floor beverage costs are 1.3 percent of gross gaming revenue.
Cost of retail is 80 percent of retail revenue.
Cost of conventions is 75 percent of convention revenue.
The profit/loss model for a 750‐room hotel relies on the following assumptions:
Occupancy rate of 90 percent.
Annual room nights of 246,375.
An average daily rate of $150.
We have modeled a 750‐room hotel with 3,000 slots graduating to 5,000 slots over years four and five, with 1,000 units added each of the last two years in the model. We have also added in the model a management fee of 12 percent of gross operating profits.
Page 23 of 96
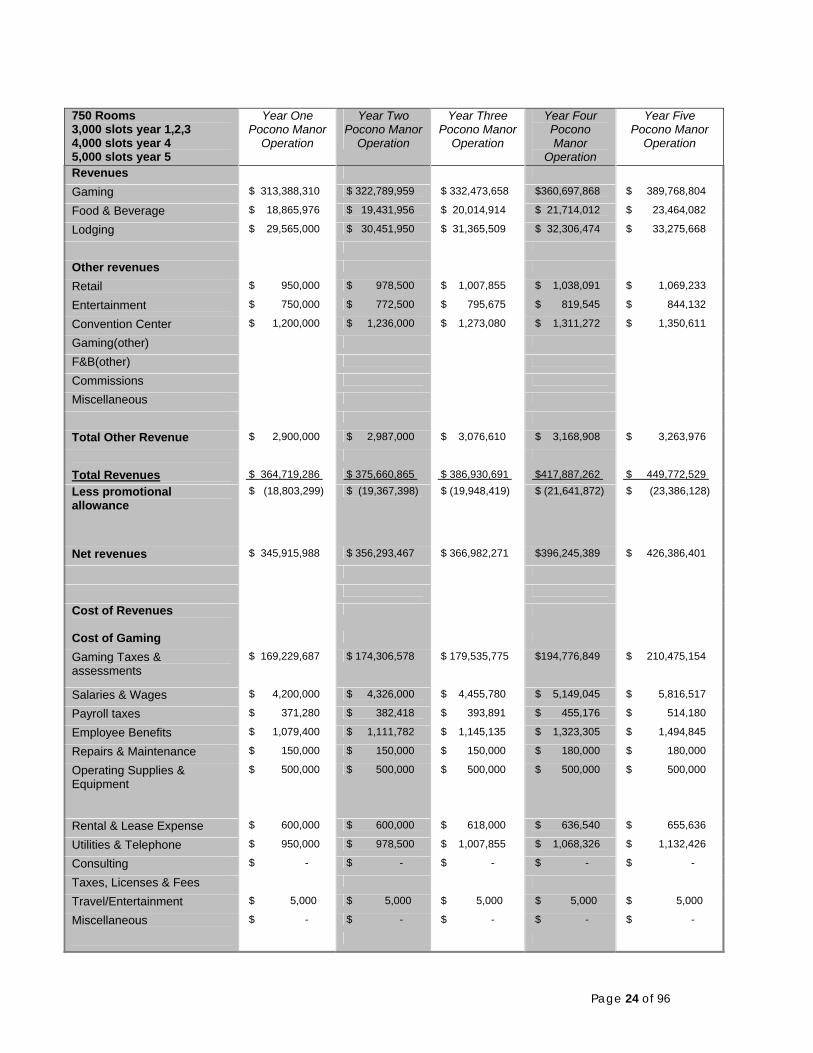
750 Rooms 3,000 slots year 1,2,3 4,000 slots year 4 5,000 slots year 5
Year One Pocono Manor
Operation
Year Two Pocono Manor
Operation
Year Three Pocono Manor
Operation
Year Four Pocono Manor
Operation
Year Five Pocono Manor
Operation
Revenues Gaming $ 313,388,310 $ 322,789,959 $ 332,473,658 $360,697,868 $ 389,768,804
Food & Beverage $ 18,865,976 $ 19,431,956 $ 20,014,914 $ 21,714,012 $ 23,464,082
Lodging $ 29,565,000 $ 30,451,950 $ 31,365,509 $ 32,306,474 $ 33,275,668
Other revenues
Retail $ 950,000 $ 978,500 $ 1,007,855 $ 1,038,091 $ 1,069,233
Entertainment $ 750,000 $ 772,500 $ 795,675 $ 819,545 $ 844,132
Convention Center $ 1,200,000 $ 1,236,000 $ 1,273,080 $ 1,311,272 $ 1,350,611
Gaming(other)
F&B(other)
Commissions
Miscellaneous
Total Other Revenue $ 2,900,000 $ 2,987,000 $ 3,076,610 $ 3,168,908 $ 3,263,976
Total Revenues $ 364,719,286 $ 375,660,865 $ 386,930,691 $417,887,262 $ 449,772,529
Less promotional allowance
$ (18,803,299) $ (19,367,398) $ (19,948,419) $ (21,641,872) $ (23,386,128)
Net revenues $ 345,915,988 $ 356,293,467 $ 366,982,271 $396,245,389 $ 426,386,401
Cost of Revenues
Cost of Gaming
Gaming Taxes & assessments
$ 169,229,687 $ 174,306,578 $ 179,535,775 $194,776,849 $ 210,475,154
Salaries & Wages $ 4,200,000 $ 4,326,000 $ 4,455,780 $ 5,149,045 $ 5,816,517
Payroll taxes $ 371,280 $ 382,418 $ 393,891 $ 455,176 $ 514,180
Employee Benefits $ 1,079,400 $ 1,111,782 $ 1,145,135 $ 1,323,305 $ 1,494,845
Repairs & Maintenance $ 150,000 $ 150,000 $ 150,000 $ 180,000 $ 180,000
Operating Supplies & Equipment
$ 500,000 $ 500,000 $ 500,000 $ 500,000 $ 500,000
Rental & Lease Expense $ 600,000 $ 600,000 $ 618,000 $ 636,540 $ 655,636
Utilities & Telephone $ 950,000 $ 978,500 $ 1,007,855 $ 1,068,326 $ 1,132,426
Consulting $ - $ - $ - $ - $ -
Taxes, Licenses & Fees
Travel/Entertainment $ 5,000 $ 5,000 $ 5,000 $ 5,000 $ 5,000
Miscellaneous $ - $ - $ - $ - $ -
Page 24 of 96
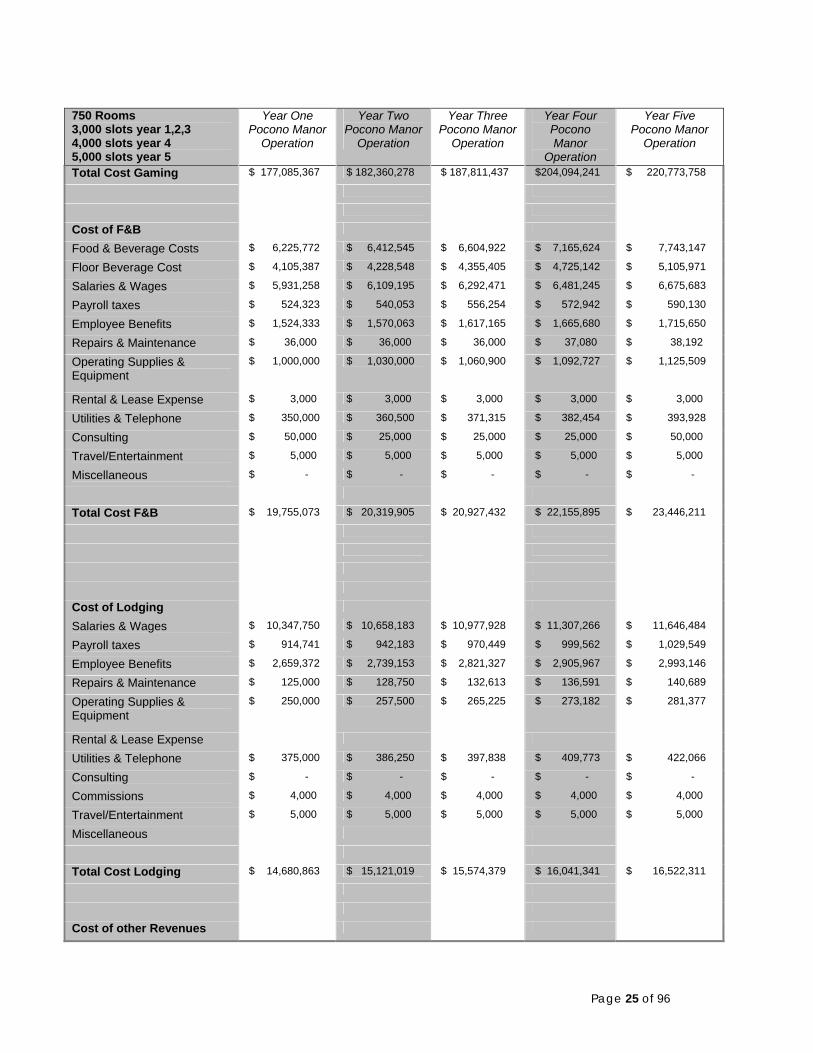
750 Rooms 3,000 slots year 1,2,3 4,000 slots year 4 5,000 slots year 5
Year One Pocono Manor
Operation
Year Two Pocono Manor
Operation
Year Three Pocono Manor
Operation
Year Four Pocono Manor
Operation
Year Five Pocono Manor
Operation
Total Cost Gaming $ 177,085,367 $ 182,360,278 $ 187,811,437 $204,094,241 $ 220,773,758
Cost of F&B
Food & Beverage Costs $ 6,225,772 $ 6,412,545 $ 6,604,922 $ 7,165,624 $ 7,743,147
Floor Beverage Cost $ 4,105,387 $ 4,228,548 $ 4,355,405 $ 4,725,142 $ 5,105,971
Salaries & Wages $ 5,931,258 $ 6,109,195 $ 6,292,471 $ 6,481,245 $ 6,675,683
Payroll taxes $ 524,323 $ 540,053 $ 556,254 $ 572,942 $ 590,130
Employee Benefits $ 1,524,333 $ 1,570,063 $ 1,617,165 $ 1,665,680 $ 1,715,650
Repairs & Maintenance $ 36,000 $ 36,000 $ 36,000 $ 37,080 $ 38,192
Operating Supplies & Equipment
$ 1,000,000 $ 1,030,000 $ 1,060,900 $ 1,092,727 $ 1,125,509
Rental & Lease Expense $ 3,000 $ 3,000 $ 3,000 $ 3,000 $ 3,000
Utilities & Telephone $ 350,000 $ 360,500 $ 371,315 $ 382,454 $ 393,928
Consulting $ 50,000 $ 25,000 $ 25,000 $ 25,000 $ 50,000
Travel/Entertainment $ 5,000 $ 5,000 $ 5,000 $ 5,000 $ 5,000
Miscellaneous $ - $ - $ - $ - $ -
Total Cost F&B $ 19,755,073 $ 20,319,905 $ 20,927,432 $ 22,155,895 $ 23,446,211
Cost of Lodging
Salaries & Wages $ 10,347,750 $ 10,658,183 $ 10,977,928 $ 11,307,266 $ 11,646,484
Payroll taxes $ 914,741 $ 942,183 $ 970,449 $ 999,562 $ 1,029,549
Employee Benefits $ 2,659,372 $ 2,739,153 $ 2,821,327 $ 2,905,967 $ 2,993,146
Repairs & Maintenance $ 125,000 $ 128,750 $ 132,613 $ 136,591 $ 140,689
Operating Supplies & Equipment
$ 250,000 $ 257,500 $ 265,225 $ 273,182 $ 281,377
Rental & Lease Expense
Utilities & Telephone $ 375,000 $ 386,250 $ 397,838 $ 409,773 $ 422,066
Consulting $ - $ - $ - $ - $ -
Commissions $ 4,000 $ 4,000 $ 4,000 $ 4,000 $ 4,000
Travel/Entertainment $ 5,000 $ 5,000 $ 5,000 $ 5,000 $ 5,000
Miscellaneous
Total Cost Lodging $ 14,680,863 $ 15,121,019 $ 15,574,379 $ 16,041,341 $ 16,522,311
Cost of other Revenues
Page 25 of 96
750 Rooms 3,000 slots year 1,2,3 4,000 slots year 4 5,000 slots year 5
Year One Pocono Manor
Operation
Year Two Pocono Manor
Operation
Year Three Pocono Manor
Operation
Year Four Pocono Manor
Operation
Year Five Pocono Manor
Operation
Retail $ 760,000 $ 782,800 $ 806,284 $ 830,473 $ 855,387
Entertainment $ 600,000 $ 618,000 $ 636,540 $ 655,636 $ 675,305
Convention Center $ 900,000 $ 927,000 $ 954,810 $ 983,454 $ 1,012,958
Total Cost of other Revenue $ 2,260,000 $ 2,327,800 $ 2,397,634 $ 2,469,563 $ 2,543,650
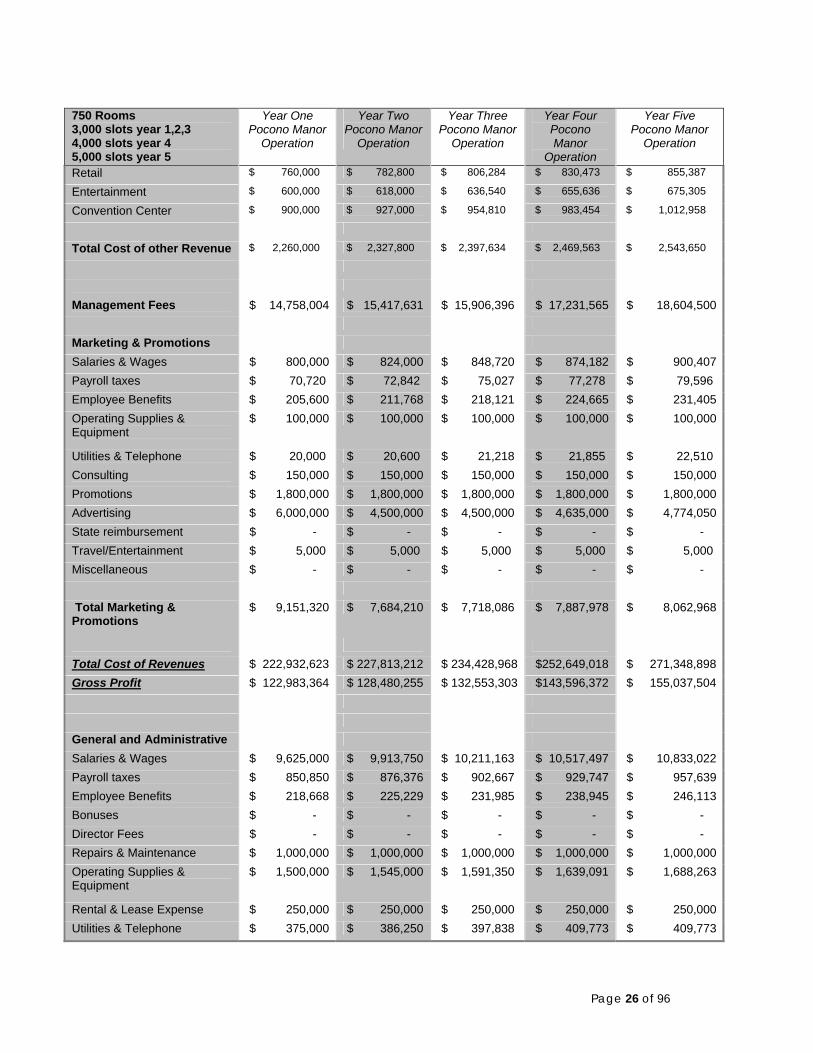
Management Fees $ 14,758,004 $ 15,417,631 $ 15,906,396 $ 17,231,565 $ 18,604,500 Marketing & Promotions Salaries & Wages $ 800,000 $ 824,000 $ 848,720 $ 874,182 $ 900,407 Payroll taxes $ 70,720 $ 72,842 $ 75,027 $ 77,278 $ 79,596 Employee Benefits $ 205,600 $ 211,768 $ 218,121 $ 224,665 $ 231,405 Operating Supplies & Equipment
$ 100,000 $ 100,000 $ 100,000 $ 100,000 $ 100,000
Utilities & Telephone $ 20,000 $ 20,600 $ 21,218 $ 21,855 $ 22,510 Consulting $ 150,000 $ 150,000 $ 150,000 $ 150,000 $ 150,000 Promotions $ 1,800,000 $ 1,800,000 $ 1,800,000 $ 1,800,000 $ 1,800,000 Advertising $ 6,000,000 $ 4,500,000 $ 4,500,000 $ 4,635,000 $ 4,774,050 State reimbursement $ - $ - $ - $ - $ - Travel/Entertainment $ 5,000 $ 5,000 $ 5,000 $ 5,000 $ 5,000 Miscellaneous $ - $ - $ - $ - $ - Total Marketing & Promotions
$ 9,151,320 $ 7,684,210 $ 7,718,086 $ 7,887,978 $ 8,062,968
Total Cost of Revenues $ 222,932,623 $ 227,813,212 $ 234,428,968 $252,649,018 $ 271,348,898 Gross Profit $ 122,983,364 $ 128,480,255 $ 132,553,303 $143,596,372 $ 155,037,504 General and Administrative Salaries & Wages $ 9,625,000 $ 9,913,750 $ 10,211,163 $ 10,517,497 $ 10,833,022 Payroll taxes $ 850,850 $ 876,376 $ 902,667 $ 929,747 $ 957,639 Employee Benefits $ 218,668 $ 225,229 $ 231,985 $ 238,945 $ 246,113 Bonuses $ - $ - $ - $ - $ - Director Fees $ - $ - $ - $ - $ - Repairs & Maintenance $ 1,000,000 $ 1,000,000 $ 1,000,000 $ 1,000,000 $ 1,000,000 Operating Supplies & Equipment
$ 1,500,000 $ 1,545,000 $ 1,591,350 $ 1,639,091 $ 1,688,263
Rental & Lease Expense $ 250,000 $ 250,000 $ 250,000 $ 250,000 $ 250,000 Utilities & Telephone $ 375,000 $ 386,250 $ 397,838 $ 409,773 $ 409,773
Page 26 of 96
750 Rooms 3,000 slots year 1,2,3 4,000 slots year 4 5,000 slots year 5
Year One Pocono Manor
Operation
Year Two Pocono Manor
Operation
Year Three Pocono Manor
Operation
Year Four Pocono Manor
Operation
Year Five Pocono Manor
Operation
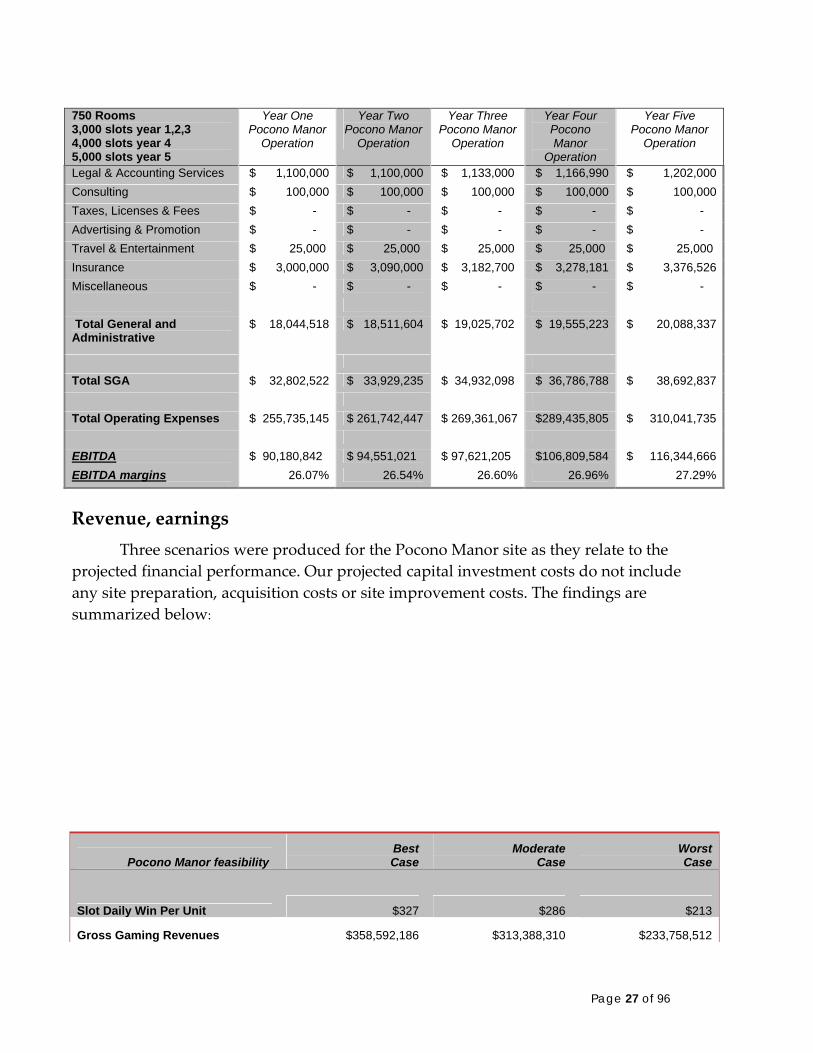
Legal & Accounting Services $ 1,100,000 $ 1,100,000 $ 1,133,000 $ 1,166,990 $ 1,202,000 Consulting $ 100,000 $ 100,000 $ 100,000 $ 100,000 $ 100,000 Taxes, Licenses & Fees $ - $ - $ - $ - $ - Advertising & Promotion $ - $ - $ - $ - $ - Travel & Entertainment $ 25,000 $ 25,000 $ 25,000 $ 25,000 $ 25,000 Insurance $ 3,000,000 $ 3,090,000 $ 3,182,700 $ 3,278,181 $ 3,376,526 Miscellaneous $ - $ - $ - $ - $ - Total General and Administrative
$ 18,044,518 $ 18,511,604 $ 19,025,702 $ 19,555,223 $ 20,088,337
Total SGA $ 32,802,522 $ 33,929,235 $ 34,932,098 $ 36,786,788 $ 38,692,837 Total Operating Expenses $ 255,735,145 $ 261,742,447 $ 269,361,067 $289,435,805 $ 310,041,735 EBITDA $ 90,180,842 $ 94,551,021 $ 97,621,205 $106,809,584 $ 116,344,666 EBITDA margins 26.07% 26.54% 26.60% 26.96% 27.29%
Revenue, earnings Three scenarios were produced for the Pocono Manor site as they relate to the
projected financial performance. Our projected capital investment costs do not include any site preparation, acquisition costs or site improvement costs. The findings are summarized below:
Pocono Manor feasibility BestCase
ModerateCase
WorstCase
Slot Daily Win Per Unit $327 $286 $213
Gross Gaming Revenues $358,592,186 $313,388,310 $233,758,512
Page 27 of 96

Best Moderate WorstPocono Manor feasibility Case Case Case
Other Revenue $58,620,453 $51,330,976 $40,624,262
Total Net Revenue $399,283,029 $345,915,988 $255,682,093
Effective Gaming Tax $193,639,780 $169,229,687 $126,229,596
Operating Expenses $250,018,257 $222,932,623 $177,693,654
Total Expenses $268,062,775 $240,977,142 $195,738,172
EBITDA $131,220,254 $104,938,846 $59,943,921
Capital Investment $446,835,000 $446,835,000 $446,835,000
ROIC 29.36% 23.48% 13.41%
The findings above represent an excellent return on invested capital in the best and moderate cases; the worse case has a marginal payback period of slightly more than seven years. In order for these results to be achievable, any project in the Pocono Tourism area must be a major attraction on the East Coast with superior transit access from major metropolitan areas, like New York City combined with its favorable current interstate access.
Competitive challenge: gaming-tax rates Pennsylvania’s gaming industry will pay an effective gaming‐tax rate as high as
55 percent. For purposes of this analysis and for purposes of determining the potential profitability of any site, we make no distinction between taxes and fees paid to third parties, such as the racing industry. And, we hasten to add, investors would similarly make no such distinction, since there is no effective difference on the bottom line between taxes and fees.
We also point out that – while other potential operators in Pennsylvania would be paying similar tax rates – that is effectively a minor distinction. Even though gaming properties in some nearby states, such as Delaware and New York, will also be paying similar rates, that is also not the decisive factor.
The potential developer of Pocono Manor must understand the tax implications in light of two critical factors:
What advantages do properties in low‐tax markets – such as New Jersey, or among tribal casinos in Connecticut or New York – have as a result, and how would they leverage those advantages?
How do high tax rates affect the cost of capital, and the potential returns on investment?
Page 28 of 96
As to the first point, we anticipate that Atlantic City operators will leverage their advantage in several ways. They will collectively and individually invest capital in their properties to broaden their offerings and diversify their visitor base. As explained in more detail later, they will also take full advantage of tax subsidies afforded by New Jersey to lower the risk and increase the returns on investment.
Just as important from a competitive standpoint, Atlantic City operators will leverage their advantageous tax rates to “reinvest” more dollars as promotional marketing tools to encourage visitation from customers in their database.
For some individual properties and operating companies that are expected to have operations across state lines, such as Harrah’s Entertainment, the relatively lopsided tax rates between the states will also require them to adopt marketing strategies that encourage their better customers to play in Atlantic City, rather than in Pennsylvania. That could, in turn, make Atlantic City more attractive to investors by further improving returns, which could add to Atlantic City’s relative advantage in attracting affordable capital.
On that point, it should be noted that Pennsylvania operators without sister properties in Atlantic City would not have such incentives to send business to New Jersey.
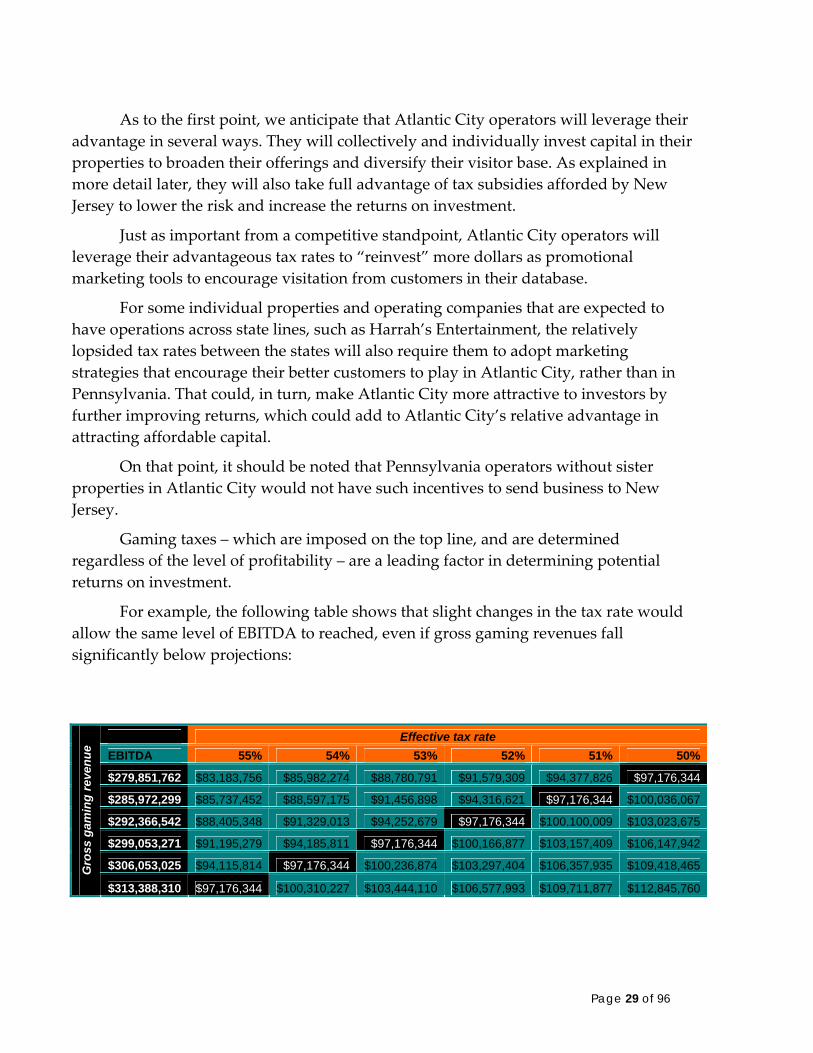
Gaming taxes – which are imposed on the top line, and are determined regardless of the level of profitability – are a leading factor in determining potential returns on investment.
For example, the following table shows that slight changes in the tax rate would allow the same level of EBITDA to reached, even if gross gaming revenues fall significantly below projections:
Effective tax rate
EBITDA 55% 54% 53% 52% 51% 50%
$279,851,762 $83,183,756 $85,982,274 $88,780,791 $91,579,309 $94,377,826 $97,176,344
$285,972,299 $85,737,452 $88,597,175 $91,456,898 $94,316,621 $97,176,344 $100,036,067
$292,366,542 $88,405,348 $91,329,013 $94,252,679 $97,176,344 $100,100,009 $103,023,675
$299,053,271 $91,195,279 $94,185,811 $97,176,344 $100,166,877 $103,157,409 $106,147,942
$306,053,025 $94,115,814 $97,176,344 $100,236,874 $103,297,404 $106,357,935 $109,418,465 Gro
ss g
amin
g re
venu
e
$313,388,310 $97,176,344 $100,310,227 $103,444,110 $106,577,993 $109,711,877 $112,845,760
Page 29 of 96

The highlighted cells show a constant level of EBITDA, with changes in the two key variables. Note that a difference of 5 percent in the effective tax rate could produce the same level of earnings, even with a difference of $33.5 million in gaming revenue.
For purposes of this feasibility study, the implications are that the tax policy in Pennsylvania does not encourage capital investment, especially for those entities that own properties in more tax friendly jurisdictions, even though the market conditions are such that significant capital investment offers the only means of developing a successful gaming destination.
Clearly, Pocono Manor’s business strategy -- creating an entertainment destination of high quality in which gaming is an important component of a varied menu of offerings -- can overcome the inherent problem in the tax structure. As a result, it would certainly generate more tax revenue than would a competing applicant that offers fewer high-quality amenities or whose financial investment incentives are better placed in tax friendlier jurisdictions.
Leveraging strength: Creating a resort from a resort
Spectrum Gaming Group has been studying the evolution of gaming for nearly 30 years, and we find that certain pre‐conditions are more likely to generate successful operations:
Good location, with easy access to multiple major markets
Existing tourism infrastructure
Sufficient capital assets, including but not limited to: ample acreage, scenic beauty, an attractive physical plant
Such assets offer no guarantees of success, but their presence increases the likelihood of:
Advancing several public policies
Enhancing overall profitability
Helping to insulate a property against competition from other gaming venues
Pocono Manor clearly has all these assets in varying but appreciable measures. These assets support our core thesis that gaming works best when:
It helps attract capital investment to a property and region
It helps leverage other tourism‐related assets
Pocono Manor already enjoys numerous existing strengths, including:
Page 30 of 96

3,000 acres6
Two golf courses
A trout stream and trap‐shooting course
Numerous other assets, from cross‐country skiing trails to stables, a skating rink and spa.
Golf We have spent time investigating the relationship between golf and gaming to
see if there is any beneficial effect to gaming revenues when golf amenities are offered. Major casino operators do see a slight benefit to golf amenities when table games are present in the gaming arena, since golf is a male‐dominated sport and table games demographics are majority male. Slots on the other hand have a strong, 60 percent‐plus female demographic, which is not strongly associated with golf activities.
A major gaming corporation has recently merged with another major gaming corporation and as a result of the acquisition it has also acquired four private, top‐notch golf courses and it has decided to open those course to retail cash business, in order to be profitable at golf operations. We recommend to the developer of Pocono Manor that golf on its own can be a seasonal profit center, but we do not anticipate any significant gaming lift as result of its operation.
Still, golf remains a desirable attribute and a necessary competitive component that will help Pocono Manor position itself as a quality destination resort.
Spa We endorse Pocono Manor’s decision to add to the existing spa facility a new
casino hotel, a spa with at least 20,000 square feet of space. Increasingly, spas are becoming a necessary component in properties that position themselves as destinations. From the Borgata in Atlantic City to the MGM Grand and numerous other properties in Las Vegas, the spa is a focal point within the entertainment experience, and is becoming a profit center in its own right.
The following chart details some key attributes that adults look for in a leisure experience:
6 To put that in perspective, 3,500 acres equals nearly 5.5 square miles. The square footage of Atlantic City’s entire gaming industry would occupy less than 10 percent of Pocono Manor’s total acreage.
Page 31 of 96
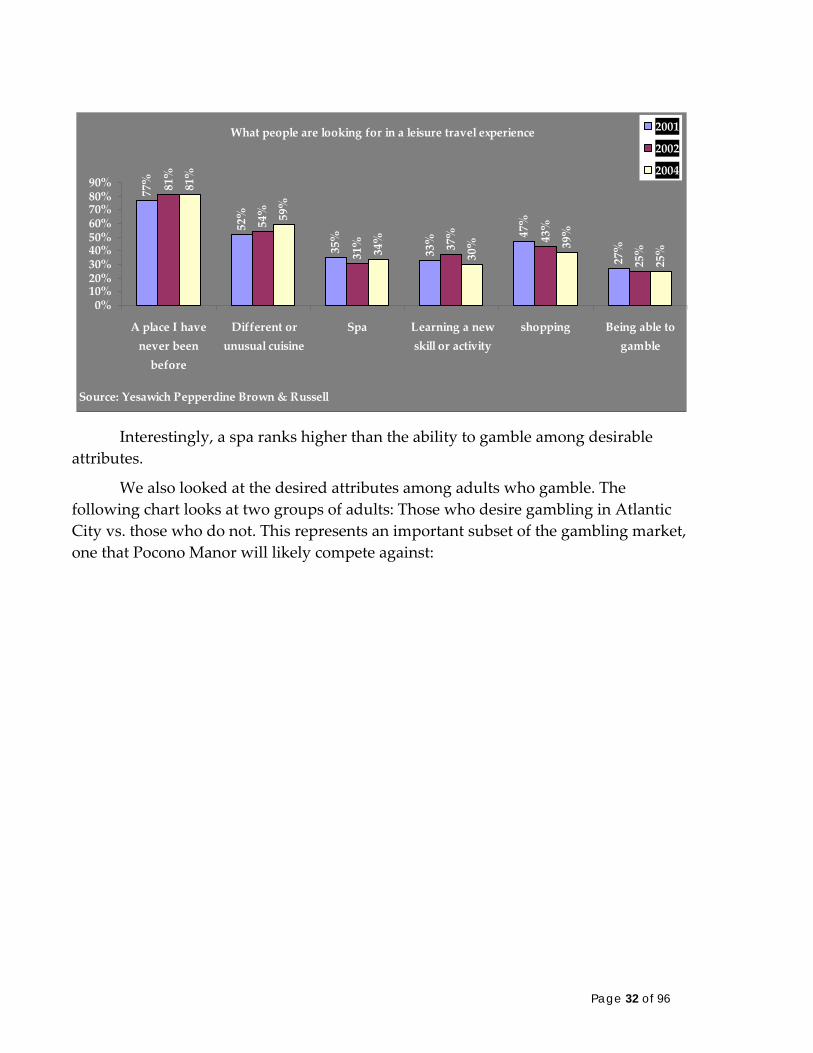
What people are looking for in a leisure travel experience77%
52%
35%
33% 47
%
27%
81%
54%
31% 37% 43%
25%
81%
59%
34%
30% 39%
25%
0%10%20%30%40%50%60%70%80%90%
A place I havenever beenbefore
Different orunusual cuisine
Spa Learning a newskill or activity
shopping Being able togamble
Source: Yesawich Pepperdine Brown & Russell
2001
2002
2004
Interestingly, a spa ranks higher than the ability to gamble among desirable
attributes.
We also looked at the desired attributes among adults who gamble. The following chart looks at two groups of adults: Those who desire gambling in Atlantic City vs. those who do not. This represents an important subset of the gambling market, one that Pocono Manor will likely compete against:
Page 32 of 96

Casino attributes considered very/extremely important46%
36%
34%
34%
32%
29%
13%
53%
37%
35%
34%
32%
31%
17%
0%
10%
20%
30%
40%
50%
60%
Nightlife andlive
entertainment
Concerts Beach Familyattractions
Shopping Spa Golf courses
Source: YPB&R ʹPortrait of American Gamblersʹ
Adults who do not desire gambling inAtlantic City
Adults who desire gambling inAtlantic City
Note that, in this context, spas rank significantly higher than golf as an important attribute.
As the following chart shows, spas are clearly growing as revenue generators as well:
CHANGE IN HOTEL GOLF vs SPA REVENUE 2003 to 2004
2.4%
8.1%
‐2.1%
3.4%
‐4.0%‐2.0%0.0%2.0%4.0%6.0%8.0%10.0%
Golf revenue peravailable room
Spa revenue peravailable room
Golf revenue peroccupied room
Spa revenue peroccupied room
Source: PKF Consulting
Spas are also operating at relatively high profit margins as well:
Page 33 of 96
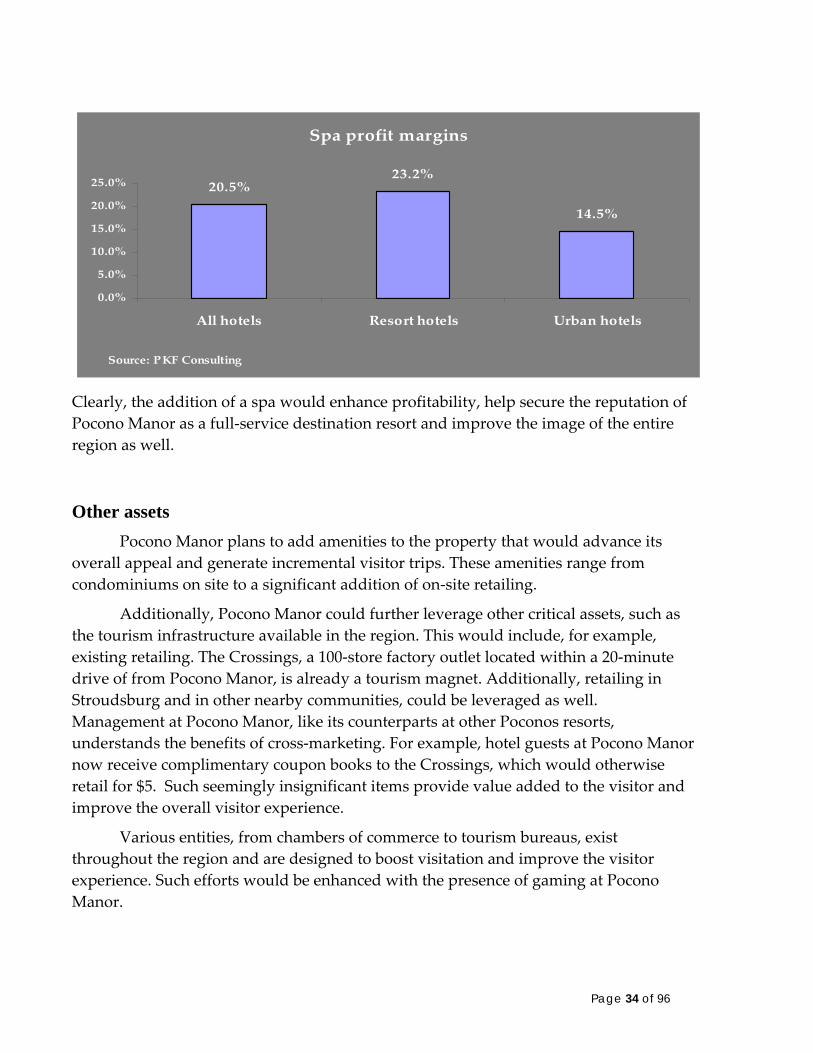
Spa profit margins
20.5%23.2%
14.5%
0.0%
5.0%
10.0%
15.0%
20.0%
25.0%
All hotels Resort hotels Urban hotels
Source: PKF Consulting
Clearly, the addition of a spa would enhance profitability, help secure the reputation of Pocono Manor as a full‐service destination resort and improve the image of the entire region as well.
Other assets Pocono Manor plans to add amenities to the property that would advance its
overall appeal and generate incremental visitor trips. These amenities range from condominiums on site to a significant addition of on‐site retailing.
Additionally, Pocono Manor could further leverage other critical assets, such as the tourism infrastructure available in the region. This would include, for example, existing retailing. The Crossings, a 100‐store factory outlet located within a 20‐minute drive of from Pocono Manor, is already a tourism magnet. Additionally, retailing in Stroudsburg and in other nearby communities, could be leveraged as well. Management at Pocono Manor, like its counterparts at other Poconos resorts, understands the benefits of cross‐marketing. For example, hotel guests at Pocono Manor now receive complimentary coupon books to the Crossings, which would otherwise retail for $5. Such seemingly insignificant items provide value added to the visitor and improve the overall visitor experience.
Various entities, from chambers of commerce to tourism bureaus, exist throughout the region and are designed to boost visitation and improve the visitor experience. Such efforts would be enhanced with the presence of gaming at Pocono Manor.
Page 34 of 96
Targeting family market In our experience, gaming works best when it is marketed – and viewed – as
adult entertainment.
In our operational experience, and in interviews with marketing executives and others, adults who enjoy participating in gaming – and who are among the more profitable gaming customers – prefer the experience without children. Interestingly, even adults who have children often prefer to visit gaming destinations without their children.
We recognize that the developer is considering adding various attractions that would appeal to families and children, as well as to adults. The size and scope of the planned Pocono Manor Resort allows for them best of both worlds. We suggest that using the existing Pocono Manor facilities to focus more on families would enhance the appeal of both sites, the existing and proposed hotel facilities. Additionally, in our experience, by striving to keep minors away from the gaming floor would clearly demonstrate that Pocono Manor management supports the public policy of promoting gambling as a responsible adult‐only activity.
Advancing public policy
Gaming’s supporters in Pennsylvania are seeking to promote several public policies, ranging from property‐tax relief to increased employment to protecting or nurturing the tourism industry.
A gaming property that has at least some of the aforementioned assets is more likely to advance multiple public interests. For example, an existing resort that has a customer base spanning several states has a proven ability to draw visitors from greater distances. More out‐of‐state visitation to Pennsylvania creates a clear net gain in tax revenue, since there would be virtually no “substitution effect7.”
Additionally, an existing destination with a sufficient tourism infrastructure is more likely to offer more attractions that will help diversify the customer base and keep visitors on‐site longer. This helps create more jobs, since obviously a gaming property with hotel rooms, restaurants and other attractions creates a greater need for employment than would a gaming property that lacks those amenities.
When these two advantages – drawing out‐of‐state visitors plus creating an employment magnet – are combined, the benefits become even more enhanced. The
7 The “substitution effect,” as explained later in the report, relates to the question of whether gaming revenues would simply siphon money from other areas of the local economy.
Page 35 of 96

property’s payroll creates greater discretionary income within the Poconos region, thus increasing spending throughout the local economy. That, in turn, creates further employment opportunities and helps attract additional capital investment.
As noted earlier in the report, Pocono Manor would also, by building the largest hotel and convention center in the region, generate marketing dollars that would be used by the Pocono Mountains Visitors Bureau to promote the entire region.
Withstanding competition
Properties that offer a broader tourism experience are less vulnerable to competition as gaming expands elsewhere. For nearly 20 years, the history of gaming has demonstrated that properties – and, in a larger sense, entire markets – can withstand competition and even grow in the face of emerging threats if they can convert themselves into more than just gaming venues.
The logic behind this is simple:
Gaming that survives because it enjoys a regional monopoly is vulnerable to losing revenue as other states legalize gaming.
Gaming that focuses solely on convenience‐driven revenue has limited appeal.
By focusing on gaming‐oriented customers, properties and markets limit themselves to adults who are relatively gaming‐centric, i.e., they view gaming as an important pastime, which serves as the primary – if not sole – purpose for their visit to a gaming property. Such adults, however, are in a minority. For example, Harrah’s Entertainment found that only 26 percent of the adult population gambled at a casino in 2003, the last year for which data is available. But even in Nevada, where casinos are omnipresent, particularly in major population centers, the penetration rate is only 40 percent8.
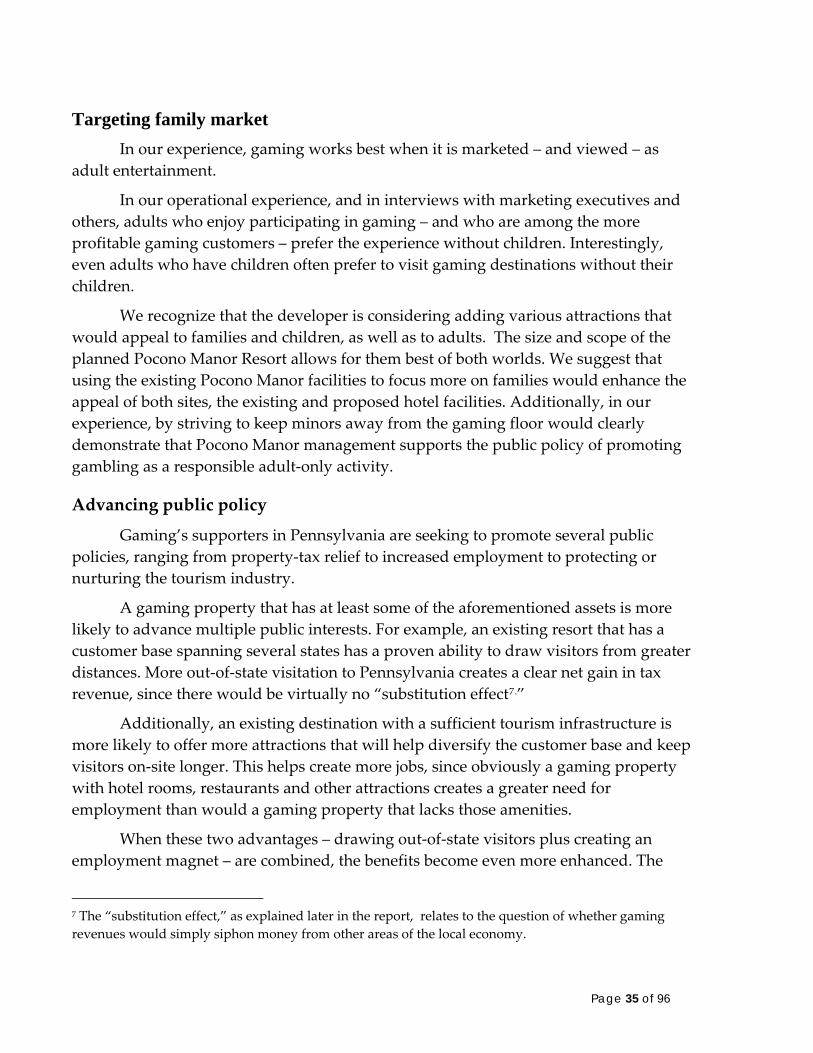
The following chart from the same survey shows the penetration rate by age group. Clearly, the opportunities are even greater among younger adults.
8 Harrah’s Survey ’04: Profile of the American Casino Gambler.
Page 36 of 96
C a s i n o p a r t i c i p a t i o n r a t e b y a g e
2 4 %
2 4 %2 9 %
2 6 %
2 1 - 3 5 3 6 - 5 0
5 1 - 6 5 6 6 a n d a b o v e
For Pocono Manor, the notion that success depends on attracting visitors beyond
the core gaming customers works to its inherent advantage. The property was not built for gaming, but to leverage other assets, such as the natural beauty of the Poconos, golf and other attractions.
Adding gaming to the mix is one way of further leveraging those additional assets to the benefit of the property’s overall bottom line.
Improving returns
Experience has demonstrated generally that properties with hotel rooms and other attractions have the ability to significantly increase overall returns.
The incremental return on investment by adding hotel rooms and other amenities might not necessarily increase. But overall cash flow – as measured by earnings before interest, taxes, depreciation and amortization – can generally be expected to increase.
Several factors can fuel this phenomenon, such as:
Hotel rooms, along with other amenities, are effective marketing tools that can be used to reward loyal customers and encourage more frequent visitation.
Gaming, as a central attraction, can help management price the other amenities more competitively.
Page 37 of 96
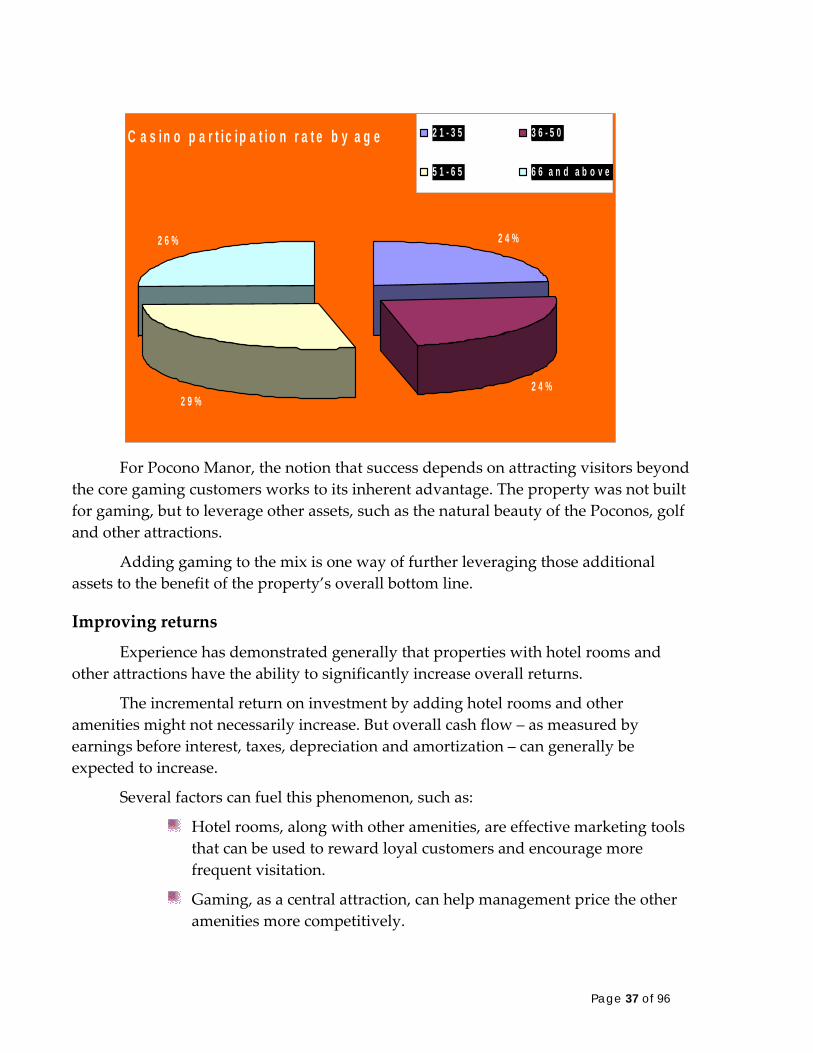
As an example, if management knows that overnight guests can be expected to spend at least $20 per adult per night on the casino floor, that can be factored into the room rate. Similarly, if a property targets midweek convention business, it can price its meals, lodging and meeting rooms at highly competitive rates since it expects that convention visitors will spend at least some additional money at the casino.
The following chart shows: average daily rates (ADR) for Atlantic City casino hotels over the past four quarterly reporting periods:
2nd quarter 2004 3rd quarter 2004 4th quarter 2004 1st quarter 2005 Hilton $ 89.50 $ 99.39 $ 86.90 $ 78.23 Bally's $ 89.08 $103.39 $ 83.80 $ 80.14 Borgata $120.67 $131.10 $128.37 $123.76 Caesars $ 91.23 $ 97.97 $ 92.46 $ 91.61 Harrah's $ 88.11 $ 98.12 $ 92.09 $ 92.63 Resorts $ 86.19 $ 92.90 $ 91.43 $ 89.03 Sands $ 57.36 $ 63.91 $ 60.36 $ 52.49 Showboat $ 90.22 $ 97.37 $ 89.74 $ 87.22 Tropicana $ 93.34 $ 96.73 $ 83.46 $ 83.82 Trump Marina $ 80.40 $ 82.49 $ 79.73 $ 75.91 Trump Plaza $ 78.93 $ 82.52 $ 80.79 $ 73.40 Trump Taj Mahal $ 77.03 $ 82.07 $ 78.22 $ 73.17 Total $ 90.59 $ 98.40 $ 91.22 $ 87.66
Source: New Jersey Casino Control Commission
Historically, about 60 percent of room nights in Atlantic City are offered complimentary, and that rate can vary significantly from property to property. Still, the rates shown above do, in large measure, reflect the amount paid by cash‐paying guests. Notably, the rates can vary significantly from property to property, but do not shift widely from season to season. The rates also reflect Atlantic City’s ability to offer a competitively priced room product, largely because managers there recognize that – even with cash‐paying guests – each occupied room night can reasonably be expected to generate at least $20 to $30 in incremental gaming revenue. Obviously, for gaming customers who are receiving the rooms at reduced rates, gaming spending would be even greater.
The combination of competitive pricing and a loyalty program that rewards gaming customers will have a positive effect on occupancy rates as well. Note the occupancy rates for Atlantic City for the same time periods:
2nd quarter 2004 3rd quarter 2004 4th quarter 2004 1st quarter 2005 Hilton 96.4% 99.1% 78.8% 88.7%
Page 38 of 96
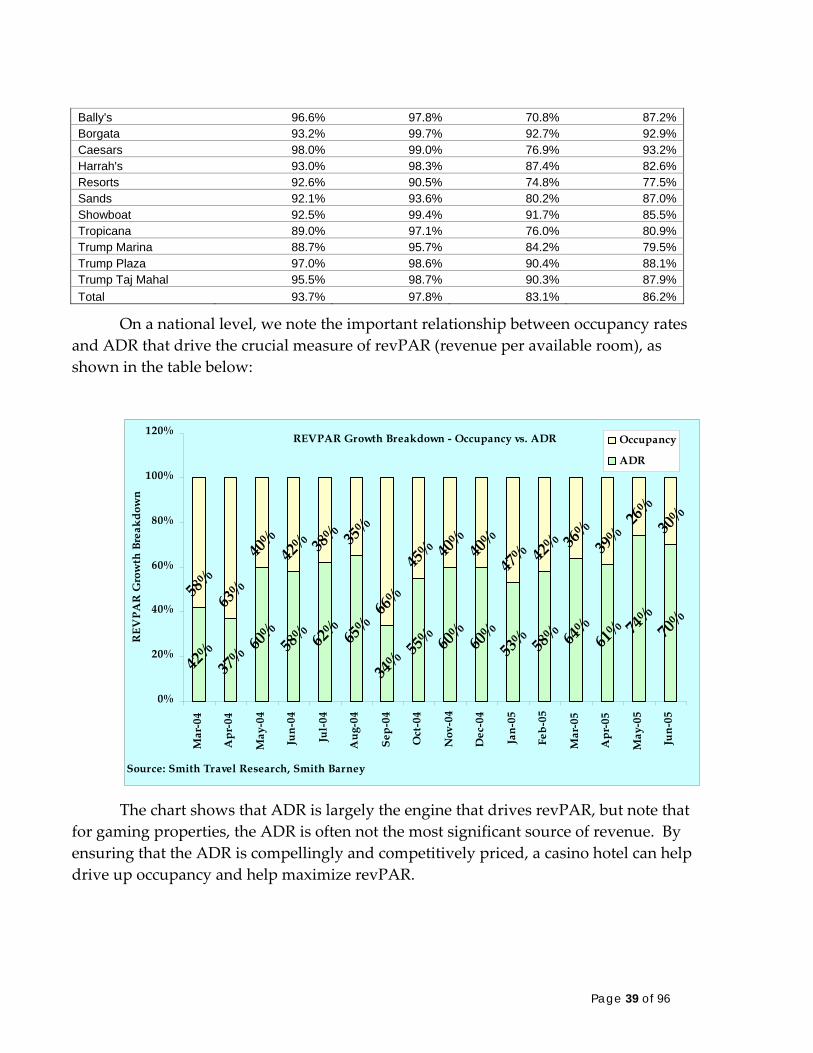
Bally's 96.6% 97.8% 70.8% 87.2% Borgata 93.2% 99.7% 92.7% 92.9% Caesars 98.0% 99.0% 76.9% 93.2% Harrah's 93.0% 98.3% 87.4% 82.6% Resorts 92.6% 90.5% 74.8% 77.5% Sands 92.1% 93.6% 80.2% 87.0% Showboat 92.5% 99.4% 91.7% 85.5% Tropicana 89.0% 97.1% 76.0% 80.9% Trump Marina 88.7% 95.7% 84.2% 79.5% Trump Plaza 97.0% 98.6% 90.4% 88.1% Trump Taj Mahal 95.5% 98.7% 90.3% 87.9% Total 93.7% 97.8% 83.1% 86.2%
On a national level, we note the important relationship between occupancy rates and ADR that drive the crucial measure of revPAR (revenue per available room), as shown in the table below:
REVPAR Growth Breakdown - Occupancy vs. ADR
42%
37%
60%
58% 62
% 65%
34%
55% 60
%60
%53
% 58% 64
%61
% 74%
70%
58%
63%
40%
42% 38
% 35%
66%
45% 40
%40
%47
% 42% 36
%39
%26
%30
%
0%
20%
40%
60%
80%
100%
120%
Mar
-04
Apr
-04
May
-04
Jun-
04
Jul-
04
Aug
-04
Sep-
04
Oct
-04
Nov
-04
Dec
-04
Jan-
05
Feb-
05
Mar
-05
Apr
-05
May
-05
Jun-
05
Source: Smith Travel Research, Smith Barney
REV
PAR
Gro
wth
Bre
akdo
wn
Occupancy
ADR
The chart shows that ADR is largely the engine that drives revPAR, but note that
for gaming properties, the ADR is often not the most significant source of revenue. By ensuring that the ADR is compellingly and competitively priced, a casino hotel can help drive up occupancy and help maximize revPAR.
Page 39 of 96

Benefits of building destinations
A property with a variety of attractions would outperform a facility with relatively Spartan offerings. The following charts show data from the “Portrait of American Gamblers9,” which surveyed 2,500 adults in 2004. “Active gamblers” are defined as “adults who visited a casino for the primary purpose of gambling on at least one occasion during the previous 12 months.10”
E n t e r t a i n m e n t : P c t . O f a c t i v e g a m b l e r s w h o v i e w t h e s e a s V e r y / E x t r e m e l y D e s i r a b l e A t t r i b u t e s I n T h e S e l e c t i o n
O f A C a s i n o
4 7 %
3 5 %2 6 %
1 3 % 1 0 %
0 %1 0 %2 0 %3 0 %4 0 %5 0 %
N ig h t l i f e a n dl iv e
e n t e r t a in m e n t
C o n c e r t s P r o d u c t io ns h o w s
B o x in g A d u l t r e v u es h o w s
S o u r c e : 'P o r t r a i t o f A m e r i c a n G a m b l e r s '
The chart shows a pronounced interest in varied attractions among gaming customers, as does the following:
9 Yesawich Pepperdine Brown & Russell 10 Interview with Peter C. Yesawich.
Page 40 of 96
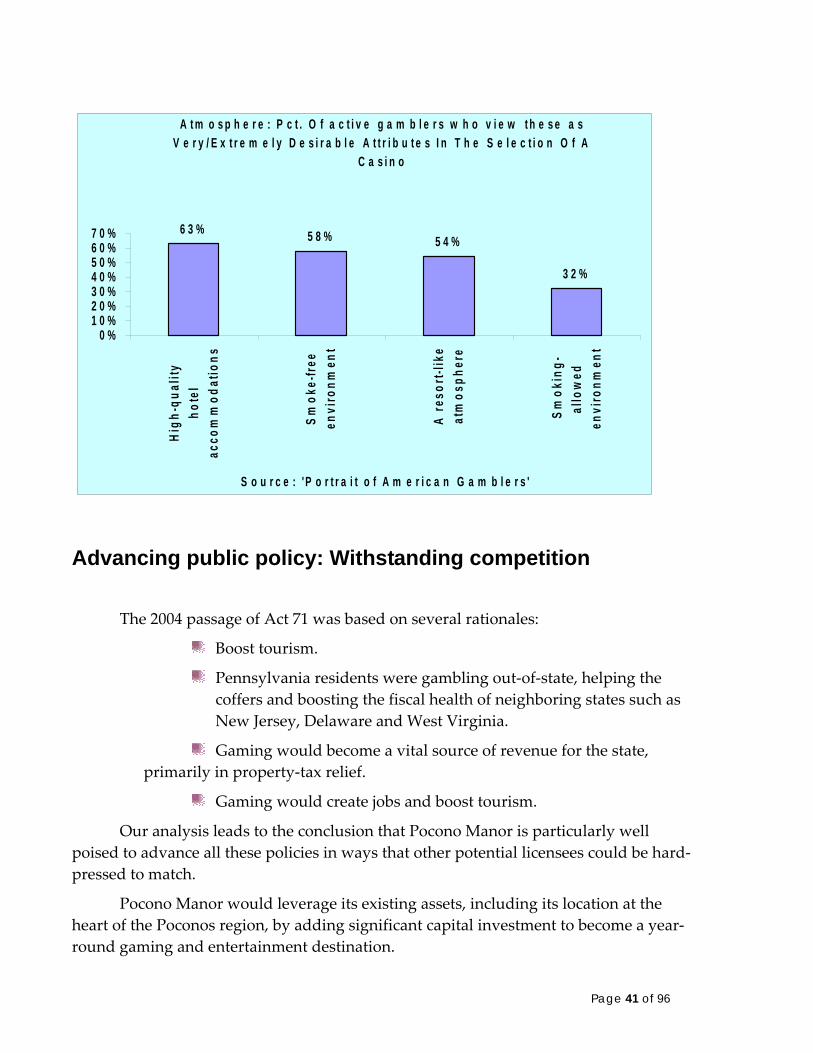
A t m o s p h e r e : P c t . O f a c t i v e g a m b l e r s w h o v i e w t h e s e a s V e r y / E x t r e m e l y D e s i r a b l e A t t r i b u t e s I n T h e S e l e c t i o n O f A
C a s i n o
6 3 % 5 8 % 5 4 %
3 2 %
0 %1 0 %2 0 %3 0 %4 0 %5 0 %6 0 %7 0 %
High
-qua
lity
hote
lac
com
mod
atio
ns
Sm
oke-
free
envi
ronm
ent
A re
sort
-like
atm
osph
ere
Smok
ing-
allo
wed
envi
ronm
ent
S o u r c e : 'P o r t r a i t o f A m e r i c a n G a m b l e r s '
Advancing public policy: Withstanding competition
The 2004 passage of Act 71 was based on several rationales:
Boost tourism.
Pennsylvania residents were gambling out‐of‐state, helping the coffers and boosting the fiscal health of neighboring states such as New Jersey, Delaware and West Virginia.
Gaming would become a vital source of revenue for the state, primarily in property‐tax relief.
Gaming would create jobs and boost tourism.
Our analysis leads to the conclusion that Pocono Manor is particularly well poised to advance all these policies in ways that other potential licensees could be hard‐pressed to match.
Pocono Manor would leverage its existing assets, including its location at the heart of the Poconos region, by adding significant capital investment to become a year‐round gaming and entertainment destination.
Page 41 of 96
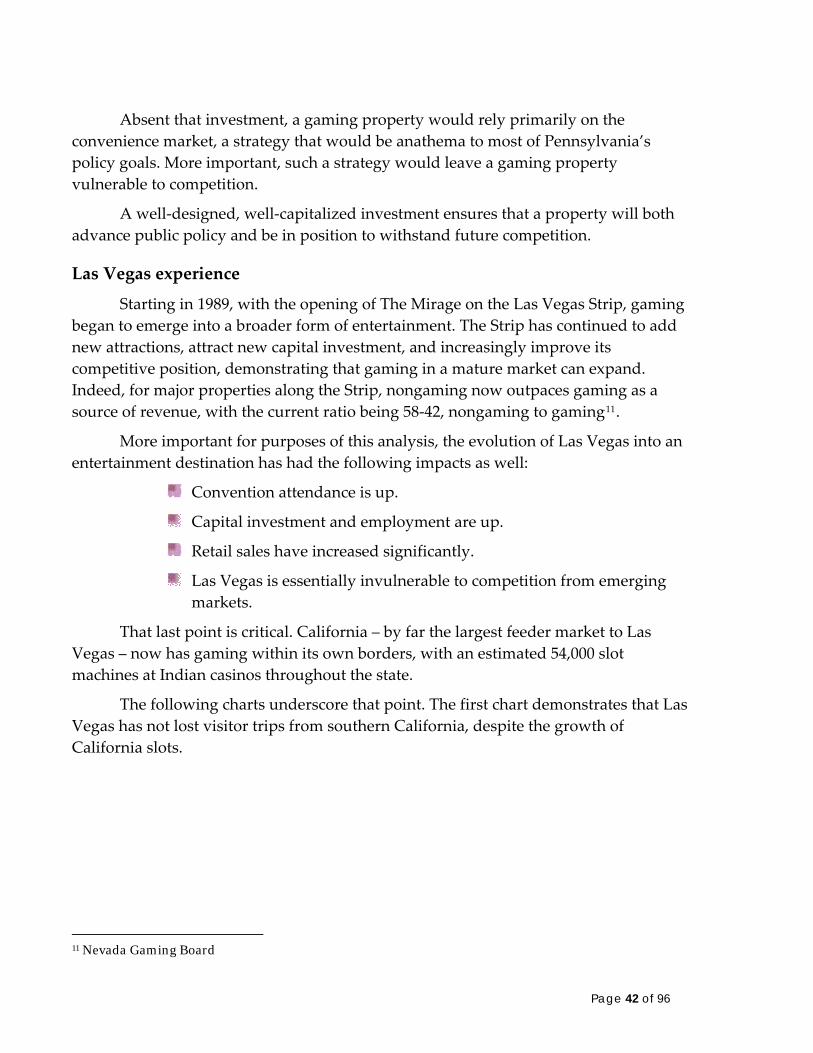
Absent that investment, a gaming property would rely primarily on the convenience market, a strategy that would be anathema to most of Pennsylvania’s policy goals. More important, such a strategy would leave a gaming property vulnerable to competition.
A well‐designed, well‐capitalized investment ensures that a property will both advance public policy and be in position to withstand future competition.
Las Vegas experience
Starting in 1989, with the opening of The Mirage on the Las Vegas Strip, gaming began to emerge into a broader form of entertainment. The Strip has continued to add new attractions, attract new capital investment, and increasingly improve its competitive position, demonstrating that gaming in a mature market can expand. Indeed, for major properties along the Strip, nongaming now outpaces gaming as a source of revenue, with the current ratio being 58‐42, nongaming to gaming11.
More important for purposes of this analysis, the evolution of Las Vegas into an entertainment destination has had the following impacts as well:
Convention attendance is up.
Capital investment and employment are up.
Retail sales have increased significantly.
Las Vegas is essentially invulnerable to competition from emerging markets.
That last point is critical. California – by far the largest feeder market to Las Vegas – now has gaming within its own borders, with an estimated 54,000 slot machines at Indian casinos throughout the state.
The following charts underscore that point. The first chart demonstrates that Las Vegas has not lost visitor trips from southern California, despite the growth of California slots.
11 Nevada Gaming Board
Page 42 of 96
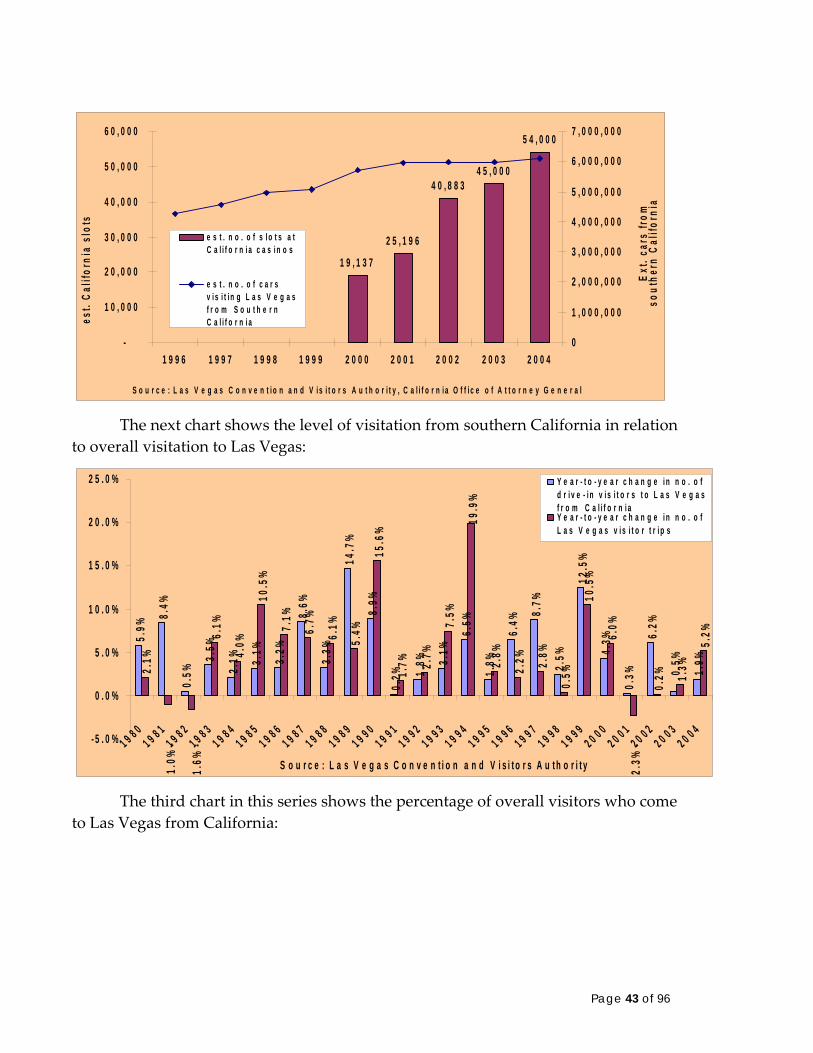
1 9 , 1 3 7
2 5 , 1 9 6
4 0 , 8 8 34 5 , 0 0 0
5 4 , 0 0 0
-
1 0 , 0 0 0
2 0 , 0 0 0
3 0 , 0 0 0
4 0 , 0 0 0
5 0 , 0 0 0
6 0 , 0 0 0
1 9 9 6 1 9 9 7 1 9 9 8 1 9 9 9 2 0 0 0 2 0 0 1 2 0 0 2 2 0 0 3 2 0 0 4
S o u r c e : L a s V e g a s C o n v e n t i o n a n d V i s i t o r s A u t h o r i t y , C a l i f o r n i a O f f i c e o f A t t o r n e y G e n e r a l
est.
Calif
orni
a sl
ots
0
1 , 0 0 0 , 0 0 0
2 , 0 0 0 , 0 0 0
3 , 0 0 0 , 0 0 0
4 , 0 0 0 , 0 0 0
5 , 0 0 0 , 0 0 0
6 , 0 0 0 , 0 0 0
7 , 0 0 0 , 0 0 0
Ext
. car
s fro
m
sout
hern
Cal
iforn
ia
e s t . n o . o f s l o t s a tC a l i f o r n i a c a s i n o s
e s t . n o . o f c a r sv i s i t i n g L a s V e g a sf r o m S o u t h e r nC a l i f o r n i a
The next chart shows the level of visitation from southern California in relation
to overall visitation to Las Vegas:
5.9%
8.4%
0.5%
3.5%
2.1% 3.
1%
3.2%
8.6%
3.3%
14.7
%
8.9%
0.2% 1.
8% 3.1%
6.5%
1.8%
6.4%
8.7%
2.5%
12.5
%
4.3%
0.3%
6.2%
1.9%
2.1%
6.1%
4.0%
10.5
%
7.1%
6.7%
6.1%
5.4%
15.6
%
1.7% 2.
7%
7.5%
19.9
%
2.8%
2.2% 2.
8%
0.5%
10.5
%
6.0%
0.2% 1.
3%
5.2%
0.5%
1.0%
-
1.6%
-
2.3%
-- 5 . 0 %
0 . 0 %
5 . 0 %
1 0 . 0 %
1 5 . 0 %
2 0 . 0 %
2 5 . 0 %
1 9 8 01 9 8 1
1 9 8 21 9 8 3
1 9 8 41 9 8 5
1 9 8 61 9 8 7
1 9 8 81 9 8 9
1 9 9 01 9 9 1
1 9 9 21 9 9 3
1 9 9 41 9 9 5
1 9 9 61 9 9 7
1 9 9 81 9 9 9
2 0 0 02 0 0 1
2 0 0 22 0 0 3
2 0 0 4
S o u r c e : L a s V e g a s C o n v e n t i o n a n d V i s i t o r s A u t h o r i t y
Y e a r - t o - y e a r c h a n g e i n n o . o fd r i v e - i n v i s i t o r s t o L a s V e g a sf r o m C a l i f o r n i aY e a r - t o - y e a r c h a n g e i n n o . o fL a s V e g a s v i s i t o r t r i p s
The third chart in this series shows the percentage of overall visitors who come
to Las Vegas from California:
Page 43 of 96
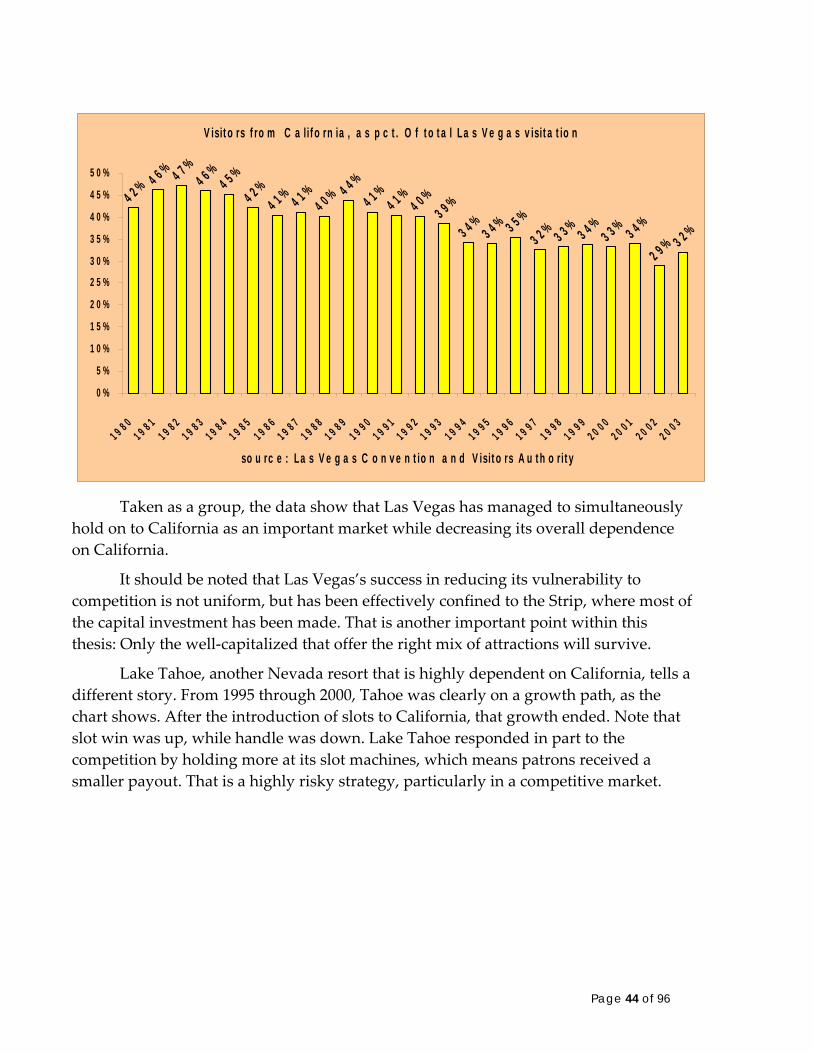
V isit o rs f ro m C a lif o rn ia , a s p c t . O f t o t a l La s V e g a s v isit a t io n
4 2 % 4 6 % 4 7 %4 6 %
4 5 %
4 2 %4 1 % 4 1 %
4 0 % 4 4 %4 1 %
4 1 %4 0 %
3 9 %
3 4 %3 4 % 3 5 %
3 2 % 3 3 % 3 4 %3 3 % 3 4 %
2 9 % 3 2 %
0 %
5 %
1 0 %
1 5 %
2 0 %
2 5 %
3 0 %
3 5 %
4 0 %
4 5 %
5 0 %
1 9 8 01 9 8 1
1 9 8 21 9 8 3
1 9 8 41 9 8 5
1 9 8 61 9 8 7
1 9 8 81 9 8 9
1 9 9 01 9 9 1
1 9 9 21 9 9 3
1 9 9 41 9 9 5
1 9 9 61 9 9 7
1 9 9 81 9 9 9
2 0 0 02 0 0 1
2 0 0 22 0 0 3
so u rc e : La s V e g a s C o n v e n t io n a n d V isit o rs A u t h o rit y
Taken as a group, the data show that Las Vegas has managed to simultaneously
hold on to California as an important market while decreasing its overall dependence on California.
It should be noted that Las Vegas’s success in reducing its vulnerability to competition is not uniform, but has been effectively confined to the Strip, where most of the capital investment has been made. That is another important point within this thesis: Only the well‐capitalized that offer the right mix of attractions will survive.
Lake Tahoe, another Nevada resort that is highly dependent on California, tells a different story. From 1995 through 2000, Tahoe was clearly on a growth path, as the chart shows. After the introduction of slots to California, that growth ended. Note that slot win was up, while handle was down. Lake Tahoe responded in part to the competition by holding more at its slot machines, which means patrons received a smaller payout. That is a highly risky strategy, particularly in a competitive market.
Page 44 of 96
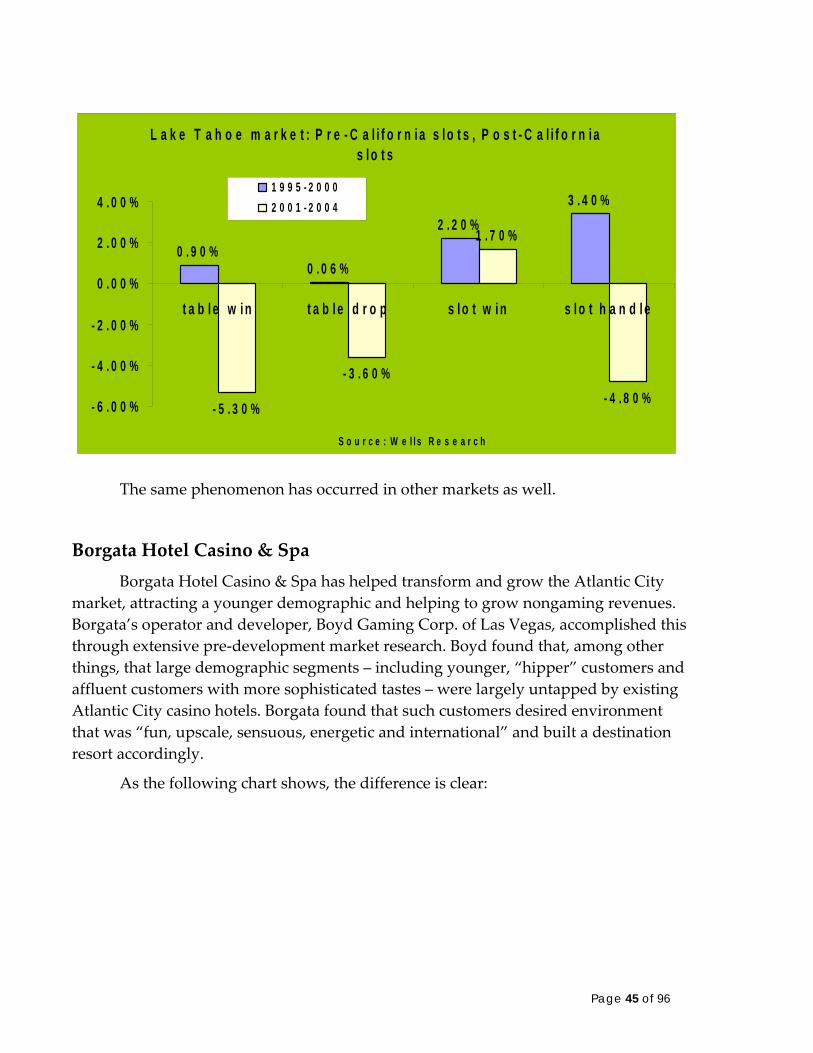
L a k e T a h o e m a r k e t : P r e - C a l i f o r n i a s l o t s , P o s t - C a l i f o r n i a s l o t s
0 . 9 0 %0 . 0 6 %
2 . 2 0 %3 . 4 0 %
- 5 . 3 0 %
- 3 . 6 0 %
1 . 7 0 %
- 4 . 8 0 %- 6 . 0 0 %
- 4 . 0 0 %
- 2 . 0 0 %
0 . 0 0 %
2 . 0 0 %
4 . 0 0 %
t a b l e w i n t a b l e d r o p s l o t w i n s l o t h a n d l e
S o u r c e : W e l l s R e s e a r c h
1 9 9 5 - 2 0 0 02 0 0 1 - 2 0 0 4
The same phenomenon has occurred in other markets as well.
Borgata Hotel Casino & Spa Borgata Hotel Casino & Spa has helped transform and grow the Atlantic City
market, attracting a younger demographic and helping to grow nongaming revenues. Borgata’s operator and developer, Boyd Gaming Corp. of Las Vegas, accomplished this through extensive pre‐development market research. Boyd found that, among other things, that large demographic segments – including younger, “hipper” customers and affluent customers with more sophisticated tastes – were largely untapped by existing Atlantic City casino hotels. Borgata found that such customers desired environment that was “fun, upscale, sensuous, energetic and international” and built a destination resort accordingly.
As the following chart shows, the difference is clear:
Page 45 of 96
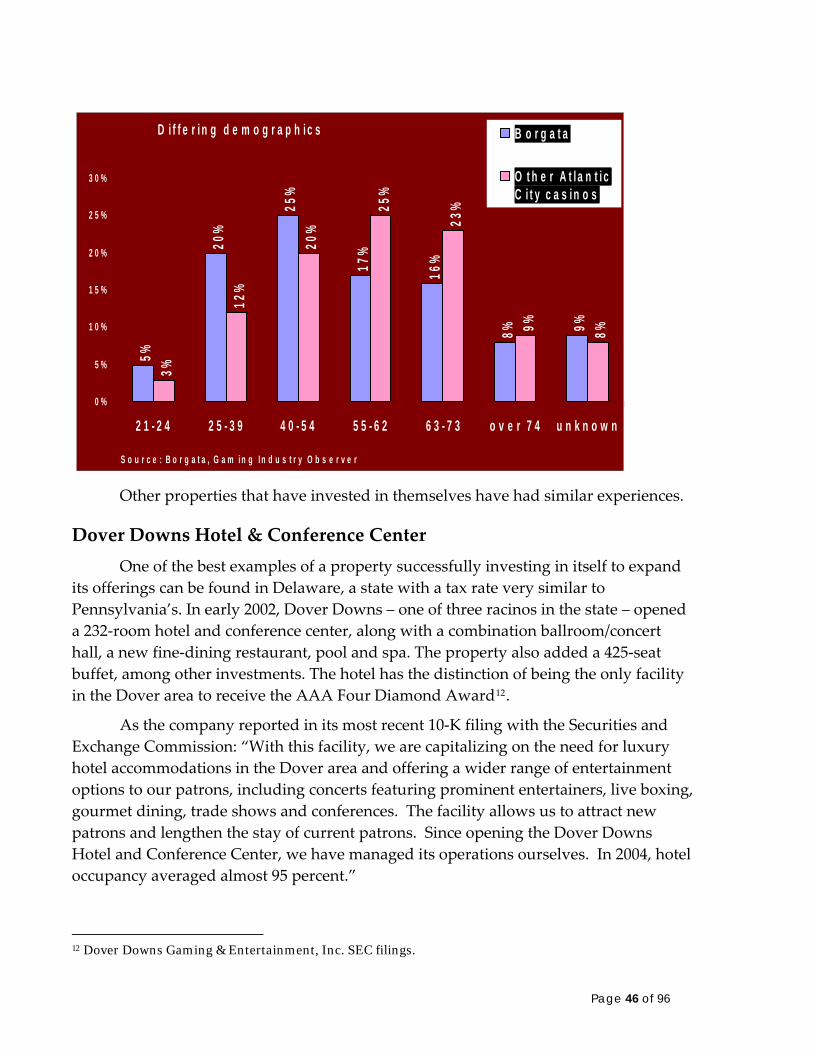
D i f f e r i n g d e m o g r a p h i c s5%
20%
25%
17%
16%
8% 9%
3%
12%
20%
25%
23%
9% 8%
0 %
5 %
1 0 %
1 5 %
2 0 %
2 5 %
3 0 %
2 1 - 2 4 2 5 - 3 9 4 0 - 5 4 5 5 - 6 2 6 3 - 7 3 o v e r 7 4 u n k n o w n
S o u r c e : B o r g a t a , G a m i n g I n d u s t r y O b s e r v e r
B o r g a t a
O t h e r A t l a n t i cC i t y c a s i n o s
Other properties that have invested in themselves have had similar experiences.
Dover Downs Hotel & Conference Center One of the best examples of a property successfully investing in itself to expand
its offerings can be found in Delaware, a state with a tax rate very similar to Pennsylvania’s. In early 2002, Dover Downs – one of three racinos in the state – opened a 232‐room hotel and conference center, along with a combination ballroom/concert hall, a new fine‐dining restaurant, pool and spa. The property also added a 425‐seat buffet, among other investments. The hotel has the distinction of being the only facility in the Dover area to receive the AAA Four Diamond Award12.
As the company reported in its most recent 10‐K filing with the Securities and Exchange Commission: “With this facility, we are capitalizing on the need for luxury hotel accommodations in the Dover area and offering a wider range of entertainment options to our patrons, including concerts featuring prominent entertainers, live boxing, gourmet dining, trade shows and conferences. The facility allows us to attract new patrons and lengthen the stay of current patrons. Since opening the Dover Downs Hotel and Conference Center, we have managed its operations ourselves. In 2004, hotel occupancy averaged almost 95 percent.”
12 Dover Downs Gaming & Entertainment, Inc. SEC filings.
Page 46 of 96
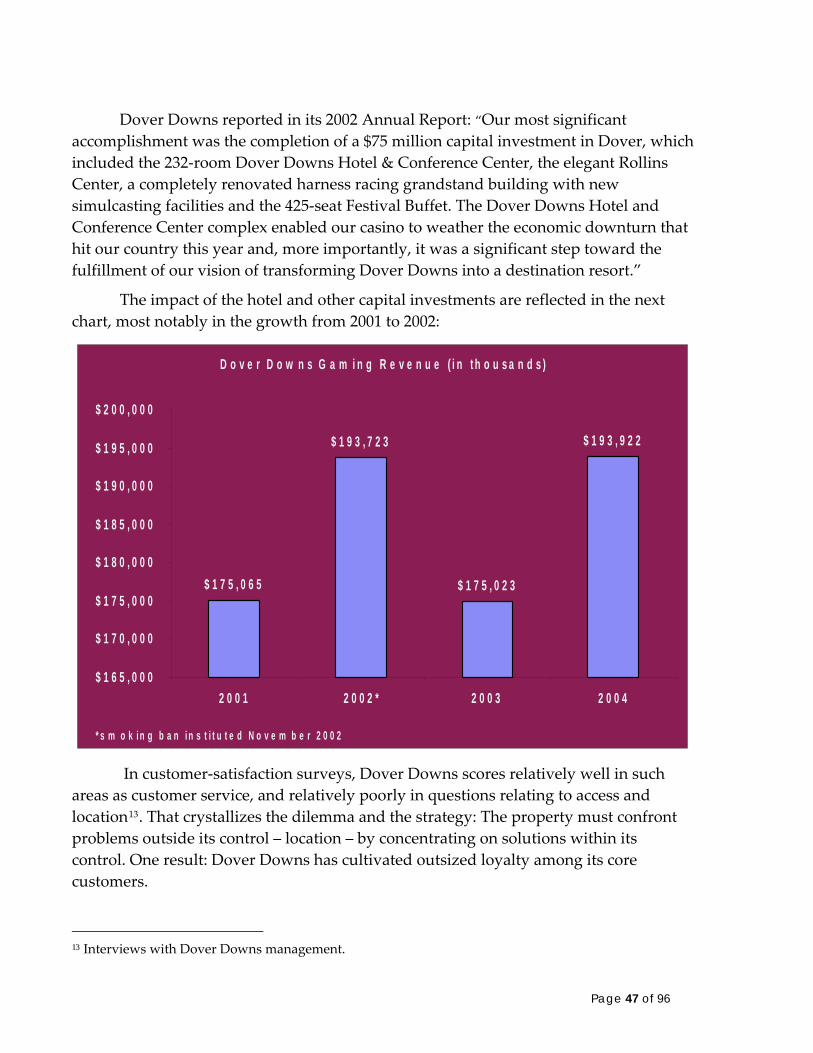
Dover Downs reported in its 2002 Annual Report: “Our most significant accomplishment was the completion of a $75 million capital investment in Dover, which included the 232‐room Dover Downs Hotel & Conference Center, the elegant Rollins Center, a completely renovated harness racing grandstand building with new simulcasting facilities and the 425‐seat Festival Buffet. The Dover Downs Hotel and Conference Center complex enabled our casino to weather the economic downturn that hit our country this year and, more importantly, it was a significant step toward the fulfillment of our vision of transforming Dover Downs into a destination resort.”
The impact of the hotel and other capital investments are reflected in the next chart, most notably in the growth from 2001 to 2002:
D o v e r D o w n s G a m i n g R e v e n u e ( i n t h o u s a n d s )
$ 1 7 5 , 0 6 5
$ 1 9 3 , 7 2 3
$ 1 7 5 , 0 2 3
$ 1 9 3 , 9 2 2
$ 1 6 5 , 0 0 0
$ 1 7 0 , 0 0 0
$ 1 7 5 , 0 0 0
$ 1 8 0 , 0 0 0
$ 1 8 5 , 0 0 0
$ 1 9 0 , 0 0 0
$ 1 9 5 , 0 0 0
$ 2 0 0 , 0 0 0
2 0 0 1 2 0 0 2 * 2 0 0 3 2 0 0 4
* s m o k i n g b a n i n s t i t u t e d N o v e m b e r 2 0 0 2
In customer‐satisfaction surveys, Dover Downs scores relatively well in such areas as customer service, and relatively poorly in questions relating to access and location13. That crystallizes the dilemma and the strategy: The property must confront problems outside its control – location – by concentrating on solutions within its control. One result: Dover Downs has cultivated outsized loyalty among its core customers.
13 Interviews with Dover Downs management.
Page 47 of 96
An estimated 60 percent of Dover Downsʹ slot play comes from rated customers in its database. That is at least 20 points higher than what would be expected at its competitorsʹ properties – although it is about 10 percent lower than the norm in Atlantic City.
Loyalty programs at racinos cannot be as generous as those at Atlantic City properties, due in large measure to the tax differential – Atlantic City casinos pay 8 percent on gross gaming revenue, plus an additional 1.25 percent in reinvestment obligations. Until December 2004, Dover Downs could not offer cash back or free casino play. Now, the Capital Club program offers both, plus free room nights at its hotel, along with some other benefits.
Seminole Hard Rock Hotel & Casino Another example of a successful, well‐capitalized gaming entertainment
destination can be found in central Florida, where the Seminole Indians operate several properties, including two in Hollywood and Tampa, respectively, that are branded with the Hard Rock theme. Notably, these properties are Class II facilities, meaning that their slots are variations of electronic bingo. The only table games they offer are poker.
The various Seminole properties in Florida, from Hollywood to Tampa, generate earnings before interest, taxes, depreciation and amortization of about $800 million a year, although their gaming product is limited to poker, bingo and Class II slots.
The Seminole Hard Rock’s success stems from various factors: an excellent design, location and a carefully planned deployment of capital.
Directors of player development in such markets as Las Vegas or Atlantic City could only begin to understand how difficult it is to have access to numerous affluent gamblers – from professional athletes in the sports‐rich Florida market to wealthy business people from Latin America to well‐heeled retirees – while being able to offer them, at best, access to a poker table or a bingo‐based slot machine.
As one example, the Seminole Hard Rock Hotel & Casino in Hollywood sits on an 86‐acre site, with parking for more than 10,000 cars.
The public areas are expansive and well‐designed, managing to incorporate everything from sunlight and water to an interesting blend of both rock‐and‐roll memorabilia and tribal regalia.
Its back‐of‐the‐house operations rise to a level of efficiency that exceeds most commercial properties in the United States. In Atlantic City, for example, only the Borgata Hotel Casino & Spa offers non‐public areas that are as well‐designed. More
Page 48 of 96
important, the areas are clean, fresh and inviting to employees, who enjoy piped‐in music in the hallways and plasma TVs in the employee cafeteria.
The hotel benefits from a strict focus on detail that leaves little to chance. The potted plants near the elevators and in each guest room are real, relying on low‐maintenance species to do the trick. Hotel guests’ keycards are inserted into a compact‐disc sleeve with a custom mix of seven popular songs. Rooms are equipped with radios pre‐tuned to selected stations that are playing when guests enter for the first time.
The Seminoles built a 12‐story, 500‐room hotel tower at the Hollywood property, including 63 suites, at a capital cost that we estimate to be about $100,000 per room, not counting furniture or fixtures.
The retail, dining and entertainment area, known as Seminole Paradise (developed and managed by the Cordish Co.), includes 12 restaurants, 10 nightclubs and 22 specialty retailers. Here, Seminole Hard Rock capitalizes on a major sustainable competitive advantage relative to any other gaming jurisdiction: a year‐round favorable climate. Seminole Paradise is outside, inviting patrons to promenade Disney World‐style on tiled avenues along the retail offerings.
Nearly all the outlets are outsourced. A notable exceptions is the 5,000‐seat arena (which is rarely used on weekends because the property is maxed out).
The Seminole properties are successfully pursuing the convention and meetings trade, while building an enviable reputation among both locals and tourists.
Both the Hollywood property and its more‐successful counterpart in Tampa already exceed the far larger, Class III Borgata in Atlantic City in their estimated earnings. Once they become Class III properties, the Seminole casinos will instantly become industry leaders.
Convention business: added boost
The convention business lends itself particularly well to gaming destinations, as evidenced by Las Vegas and Atlantic City, both of which have been increasingly successful in targeting national and regional conventions, respectively.
Gaming destinations offer two advantages not found in non‐gaming convention markets:
Rooms can be priced competitively, since the operator has other revenue centers – such as a casino – to capture additional spending.
Page 49 of 96
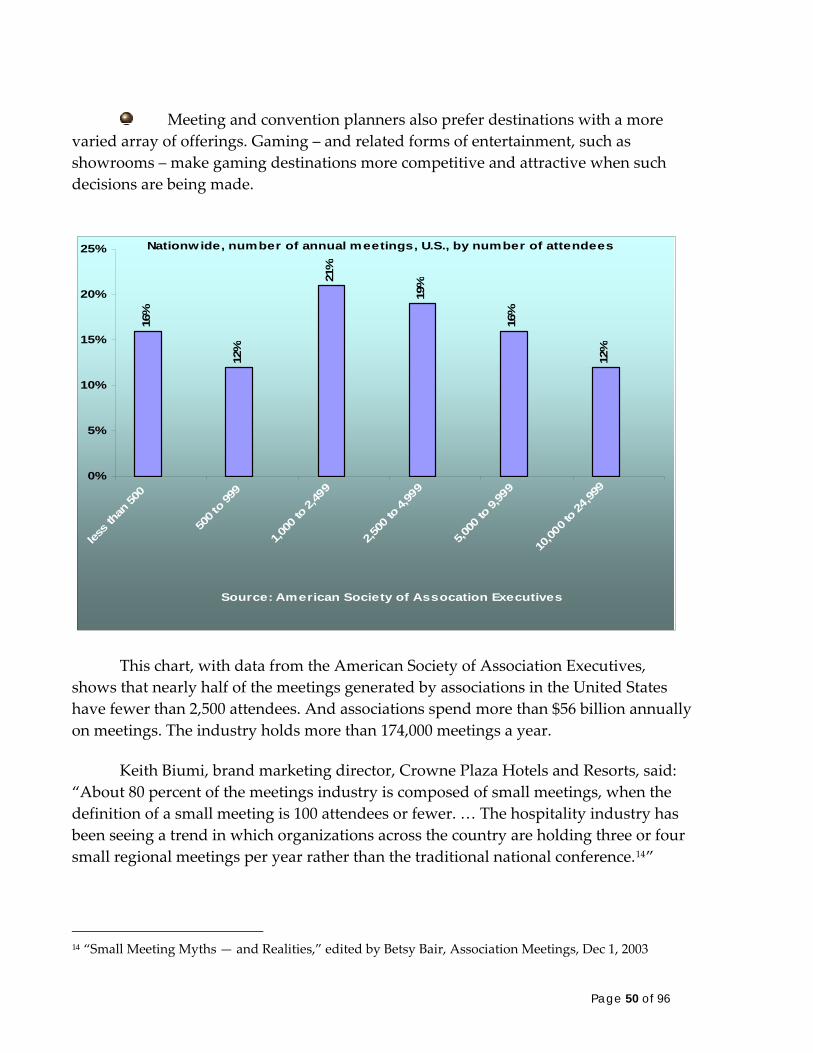
Meeting and convention planners also prefer destinations with a more varied array of offerings. Gaming – and related forms of entertainment, such as showrooms – make gaming destinations more competitive and attractive when such decisions are being made.
Nationwide, number of annual meetings, U.S., by number of attendees
16%
12%
21%
19%
16%
12%
0%
5%
10%
15%
20%
25%
less
than
500
500 t
o 99
9
1,000
to 2,
499
2,500
to 4,
999
5,000
to 9,
999
10,00
0 to
24,99
9
Source: American Society of Assocation Executives
This chart, with data from the American Society of Association Executives, shows that nearly half of the meetings generated by associations in the United States have fewer than 2,500 attendees. And associations spend more than $56 billion annually on meetings. The industry holds more than 174,000 meetings a year.
Keith Biumi, brand marketing director, Crowne Plaza Hotels and Resorts, said: “About 80 percent of the meetings industry is composed of small meetings, when the definition of a small meeting is 100 attendees or fewer. … The hospitality industry has been seeing a trend in which organizations across the country are holding three or four small regional meetings per year rather than the traditional national conference.14”
14 “Small Meeting Myths — and Realities,” edited by Betsy Bair, Association Meetings, Dec 1, 2003
Page 50 of 96
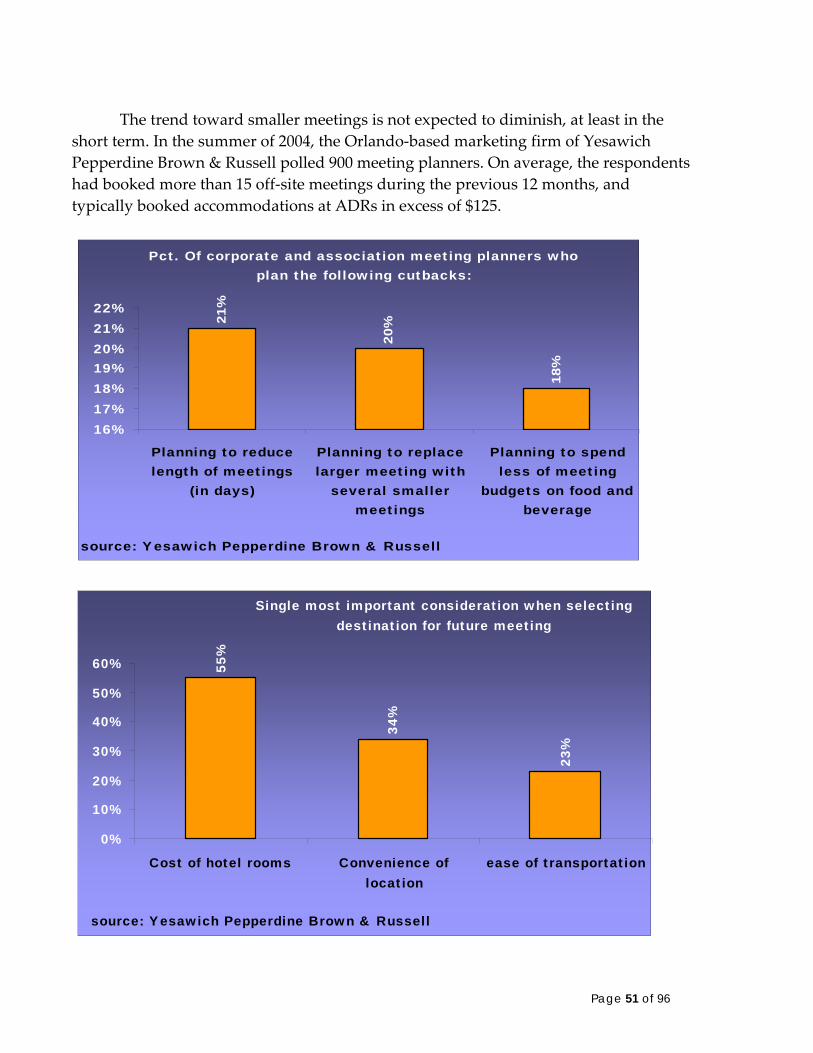
The trend toward smaller meetings is not expected to diminish, at least in the short term. In the summer of 2004, the Orlando‐based marketing firm of Yesawich Pepperdine Brown & Russell polled 900 meeting planners. On average, the respondents had booked more than 15 off‐site meetings during the previous 12 months, and typically booked accommodations at ADRs in excess of $125.
Pct. Of corporate and association meeting planners who plan the following cutbacks:
21%
20%
18%
16%17%18%19%20%21%22%
Planning to reducelength of meetings
(in days)
Planning to replacelarger meeting with
several smallermeetings
Planning to spendless of meeting
budgets on food andbeverage
source: Yesawich Pepperdine Brown & Russell
Single most important consideration when selecting destination for future meeting
55%
34%
23%
0%
10%
20%
30%
40%
50%
60%
Cost of hotel rooms Convenience oflocation
ease of transportation
source: Yesawich Pepperdine Brown & Russell
Page 51 of 96

As the charts show, more smaller meetings are being planned. Also, by far, cost was the most important consideration in booking a meeting. A gaming destination, as noted, can price its product more competitively. At the same time, convention attendees also view gaming as an important amenity.
Pocono Manor is uniquely positioned for the adding of convention and meeting space to support its operations, particularly midweek and during non‐summer months when the demand for gaming activity is lessened. Such space could also serve to support neighboring hotels and restaurants, particularly if rooms are not available at Pocono Manor.
The following chart shows the value of convention visitors based on Las Vegas data:
La s Ve g a s c o nv e nt io n a t t e nd e e
10
% 21
%
72
%
45
%
30
%
32
%
30
%
2%
74
%
65
%
6%
0 %1 0 %
2 0 %3 0 %
4 0 %5 0 %
6 0 %7 0 %
8 0 %
pct.
Of
tota
l vi
sito
rs
1st
-ti
me
visi
tor
trav
eled
by
air
plan
ned
trip
mor
e th
an6
0 d
ays
in a
dvan
ce
used
ass
ista
nce
oftr
avel
age
nt
used
int
erne
t to
pla
ntr
ip
arri
ved
duri
ng a
wee
kend
trav
elin
g w
ith
som
eone
unde
r 2
1
gam
bled
dur
ing
visi
t
atte
nded
a s
how
(pa
idad
mis
sion
)
visi
ted
an a
ttra
ctio
n(p
aid
adm
issi
on)
s o urc e : La s Ve g a s Co nv e nt io n a nd Vis ito rs A utho rity
Page 52 of 96
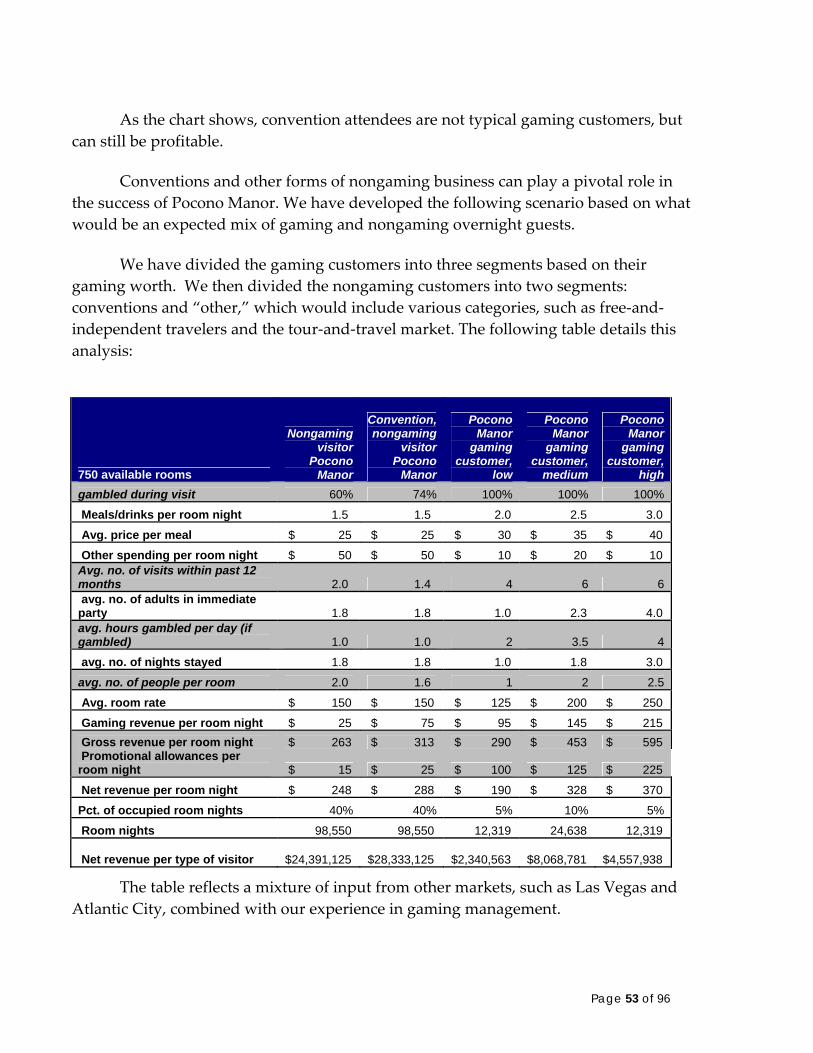
As the chart shows, convention attendees are not typical gaming customers, but can still be profitable.
Conventions and other forms of nongaming business can play a pivotal role in the success of Pocono Manor. We have developed the following scenario based on what would be an expected mix of gaming and nongaming overnight guests.
We have divided the gaming customers into three segments based on their gaming worth. We then divided the nongaming customers into two segments: conventions and “other,” which would include various categories, such as free‐and‐independent travelers and the tour‐and‐travel market. The following table details this analysis:
750 available rooms
Nongaming visitor
Pocono Manor
Convention, nongaming
visitor Pocono
Manor
Pocono Manor
gaming customer,
low
Pocono Manor
gaming customer,
medium
Pocono Manor
gaming customer,
high gambled during visit 60% 74% 100% 100% 100%
Meals/drinks per room night 1.5 1.5 2.0 2.5 3.0
Avg. price per meal $ 25 $ 25 $ 30 $ 35 $ 40
Other spending per room night $ 50 $ 50 $ 10 $ 20 $ 10 Avg. no. of visits within past 12 months 2.0 1.4 4 6 6 avg. no. of adults in immediate party 1.8 1.8 1.0 2.3 4.0 avg. hours gambled per day (if gambled) 1.0 1.0 2 3.5 4
avg. no. of nights stayed 1.8 1.8 1.0 1.8 3.0
avg. no. of people per room 2.0 1.6 1 2 2.5
Avg. room rate $ 150 $ 150 $ 125 $ 200 $ 250
Gaming revenue per room night $ 25 $ 75 $ 95 $ 145 $ 215 Gross revenue per room night $ 263 $ 313 $ 290 $ 453 $ 595 Promotional allowances per room night $ 15 $ 25 $ 100 $ 125 $ 225
Net revenue per room night $ 248 $ 288 $ 190 $ 328 $ 370
Pct. of occupied room nights 40% 40% 5% 10% 5%
Room nights 98,550 98,550 12,319 24,638 12,319
Net revenue per type of visitor $24,391,125
$28,333,125
$2,340,563
$8,068,781
$4,557,938
The table reflects a mixture of input from other markets, such as Las Vegas and Atlantic City, combined with our experience in gaming management.
Page 53 of 96
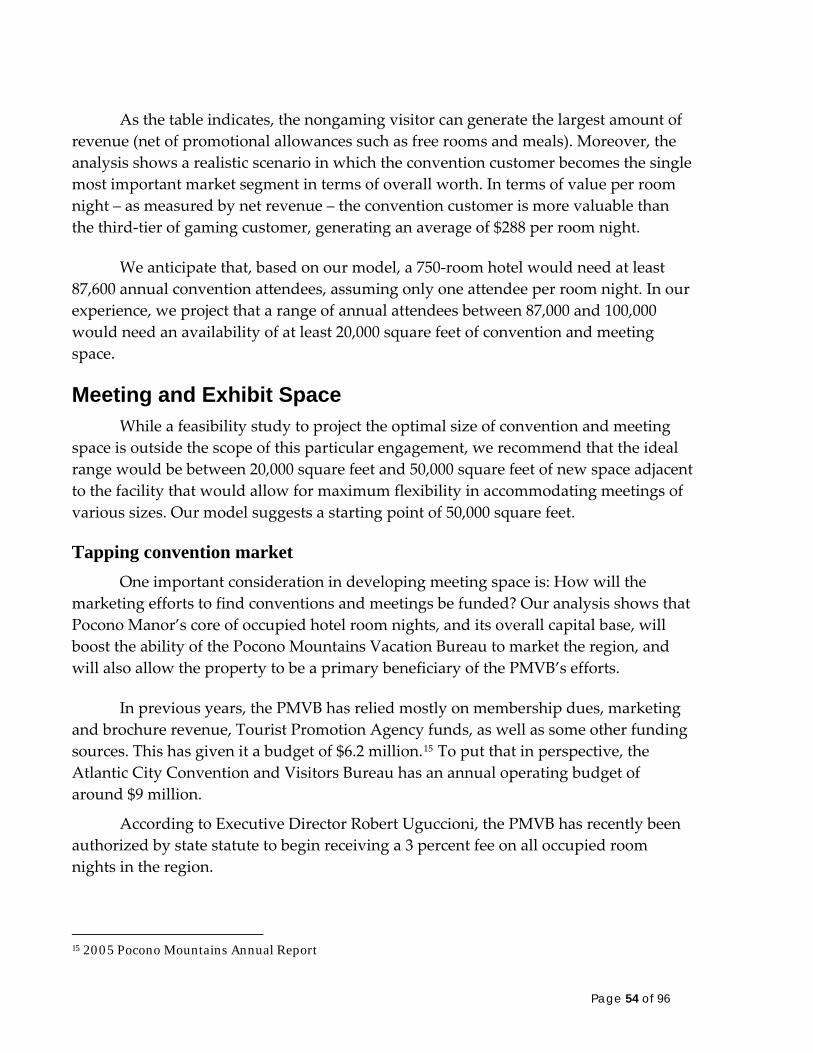
As the table indicates, the nongaming visitor can generate the largest amount of revenue (net of promotional allowances such as free rooms and meals). Moreover, the analysis shows a realistic scenario in which the convention customer becomes the single most important market segment in terms of overall worth. In terms of value per room night – as measured by net revenue – the convention customer is more valuable than the third‐tier of gaming customer, generating an average of $288 per room night.
We anticipate that, based on our model, a 750‐room hotel would need at least 87,600 annual convention attendees, assuming only one attendee per room night. In our experience, we project that a range of annual attendees between 87,000 and 100,000 would need an availability of at least 20,000 square feet of convention and meeting space.
Meeting and Exhibit Space While a feasibility study to project the optimal size of convention and meeting
space is outside the scope of this particular engagement, we recommend that the ideal range would be between 20,000 square feet and 50,000 square feet of new space adjacent to the facility that would allow for maximum flexibility in accommodating meetings of various sizes. Our model suggests a starting point of 50,000 square feet.
Tapping convention market One important consideration in developing meeting space is: How will the
marketing efforts to find conventions and meetings be funded? Our analysis shows that Pocono Manor’s core of occupied hotel room nights, and its overall capital base, will boost the ability of the Pocono Mountains Vacation Bureau to market the region, and will also allow the property to be a primary beneficiary of the PMVB’s efforts.
In previous years, the PMVB has relied mostly on membership dues, marketing and brochure revenue, Tourist Promotion Agency funds, as well as some other funding sources. This has given it a budget of $6.2 million.15 To put that in perspective, the Atlantic City Convention and Visitors Bureau has an annual operating budget of around $9 million.
According to Executive Director Robert Uguccioni, the PMVB has recently been authorized by state statute to begin receiving a 3 percent fee on all occupied room nights in the region.
15 2005 Pocono Mountains Annual Report
Page 54 of 96
This should provide a more robust and stable funding source. In our experience, such room fees offer numerous benefits, including:
They are self‐sustaining. By funding a marketing budget, they will be used to attract new visitors and generate repeat visitation, which will generate more room fees in coming periods.
They can be passed on to customers, who are not likely to object to the reasonable fee of 3 percent.
By focusing on occupied room nights, they will ensure fairness in the system, with the major beneficiaries – the largest properties with the most rooms – also serving as the major providers.
With that latter point in mind, Pocono Manor will clearly be a huge beneficiary of the PMVB’s budget, but will also be the largest provider of funding.
With 750 rooms – a number that can be expected to increase in coming years as the property becomes more successful – Pocono Manor would have a theoretical 273,750 room nights that could generate fees.
As noted earlier in the report, we expect a year‐round occupancy rate of 80 percent, a number that is generally higher than can be found at a typical Poconos resort hotel. However, the presence of gaming on site will inevitably increase the high‐demand seasons of summer and winter, and will generate year‐round demand.
We expect that, even on mid‐week, off‐season periods, the growth of conventions and meetings, coupled with competitively priced room products for gaming and non‐gaming customers, the property could easily meet the 80‐percent threshold.
That would create 219,000 occupied room nights. We expect that the property would generate an average year‐round ADR in excess of $120. That would generate at least $788,400 in marketing fees for the PMVB.
We expect that, in reality, the property will perform much better than that base case, enjoying an ADR of $150, with an occupancy rate of 90 percent, which would generate $1.1 million in marketing fees. However, we expect that the better gaming customers, as they are identified, will qualify for complimentary rooms or rooms at reduced rates. With that in mind, we think that the property can reasonably generate at least $800,000 in marketing fees for the PMVB.
Regional leadership We endorse the plan to build 50,000 square feet of contiguous meeting space,
plus add an additional 10,000 square feet of space to accommodate smaller meetings.
Page 55 of 96

To put that in perspective, that total of 60,000 square feet of meeting space would be more than most casino hotels in Las Vegas, with the notable exceptions of the large properties along the Las Vegas Strip. Pocono Manor would rank 17th in total meeting space in Las Vegas, tied with the Hard Rock Hotel and Casino.16
Even at 20,000 square feet, Pocono Manor – by adding to its existing space – would be a leader within the Pocono region. The next table shows a range of existing accommodations in the region:
Property Name
Sleeping rooms
Suites Additional rooms nearby
Total number
of meeting rooms
Theater style,
largest capacity
Classroom style,
largest capacity
Exhibit space
In-house
AV
Planning Department
Best Western Inn at Hunt's Landing
108 Y Y 10 700 250 Y Y Y
The Chateau Resort & Conference Center
152 Y Y 7 550 300 Y Y Y
Fernwood Hotel & Resort
700 Y Y 15 1,800 700 Y Y Y
Pocmont Resort & Conference Center
166 Y Y 11 550 275 Y Y Y
The Resort at Split Rock
395 Y Y 35 2,000 850 Y Y Y
Shawnee Inn & Conference Center
113 Y Y 11 500 200 Y Y Y
Skytop Lodge 185 Y Y 18 250 180 Y Y Y
The Sterling Inn
65 Y Y 4 100 65 N Y Y
Stroudsmoor Country Inn
45 Y Y 10 450 200 Y Y Y
Woodloch Resort & Meeting Facility
180 Y Y 11 220 180 Y Y Y
Source: Pocono Mountains Convention & Visitors Bureau
By way of comparison, the following table details the available space at The Inn at Split Rock, which has 395 guest rooms:
16 Las Vegas Convention and Visitors Authority
Page 56 of 96
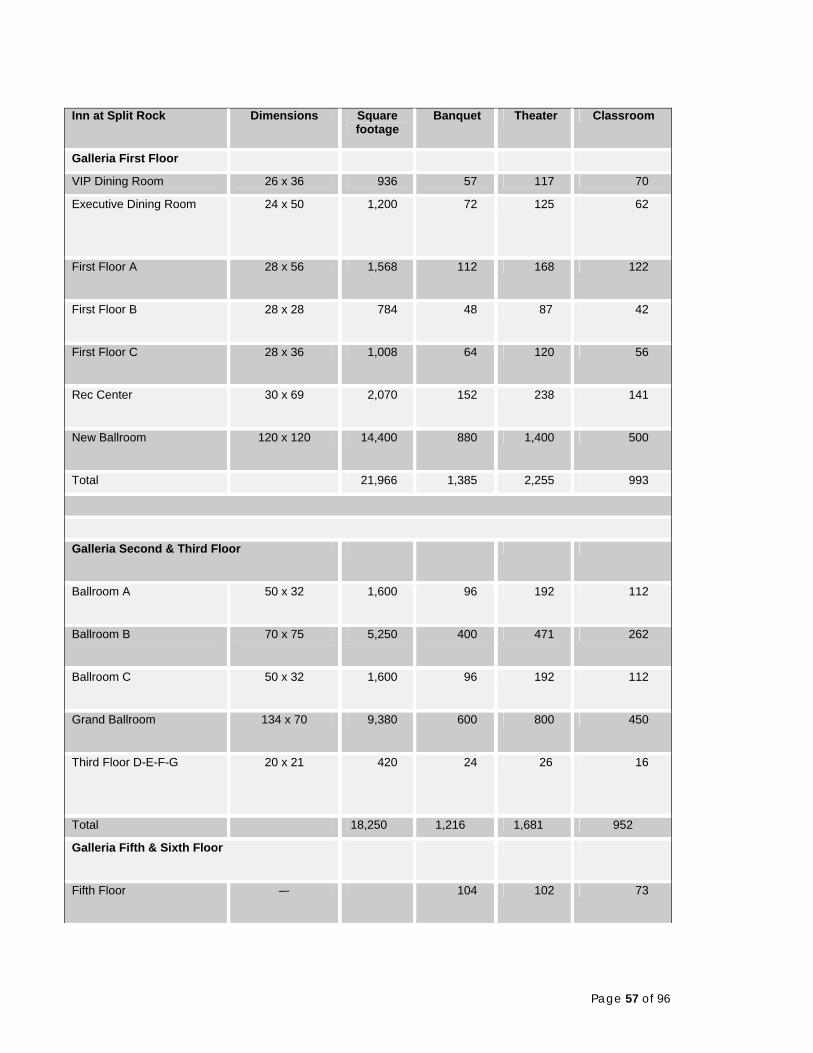
Inn at Split Rock Dimensions Square footage
Banquet Theater Classroom
Galleria First Floor
VIP Dining Room 26 x 36 936 57 117 70
Executive Dining Room 24 x 50 1,200 72 125 62
First Floor A 28 x 56 1,568 112 168 122
First Floor B 28 x 28 784 48 87 42
First Floor C 28 x 36 1,008 64 120 56
Rec Center 30 x 69 2,070 152 238 141
New Ballroom 120 x 120 14,400 880 1,400 500
Total 21,966 1,385 2,255 993
Galleria Second & Third Floor
Ballroom A 50 x 32 1,600 96 192 112
Ballroom B 70 x 75 5,250 400 471 262
Ballroom C 50 x 32 1,600 96 192 112
Grand Ballroom 134 x 70 9,380 600 800 450
Third Floor D-E-F-G 20 x 21 420 24 26 16
Total 18,250 1,216 1,681 952
Galleria Fifth & Sixth Floor
Fifth Floor –- 104 102 73
Page 57 of 96
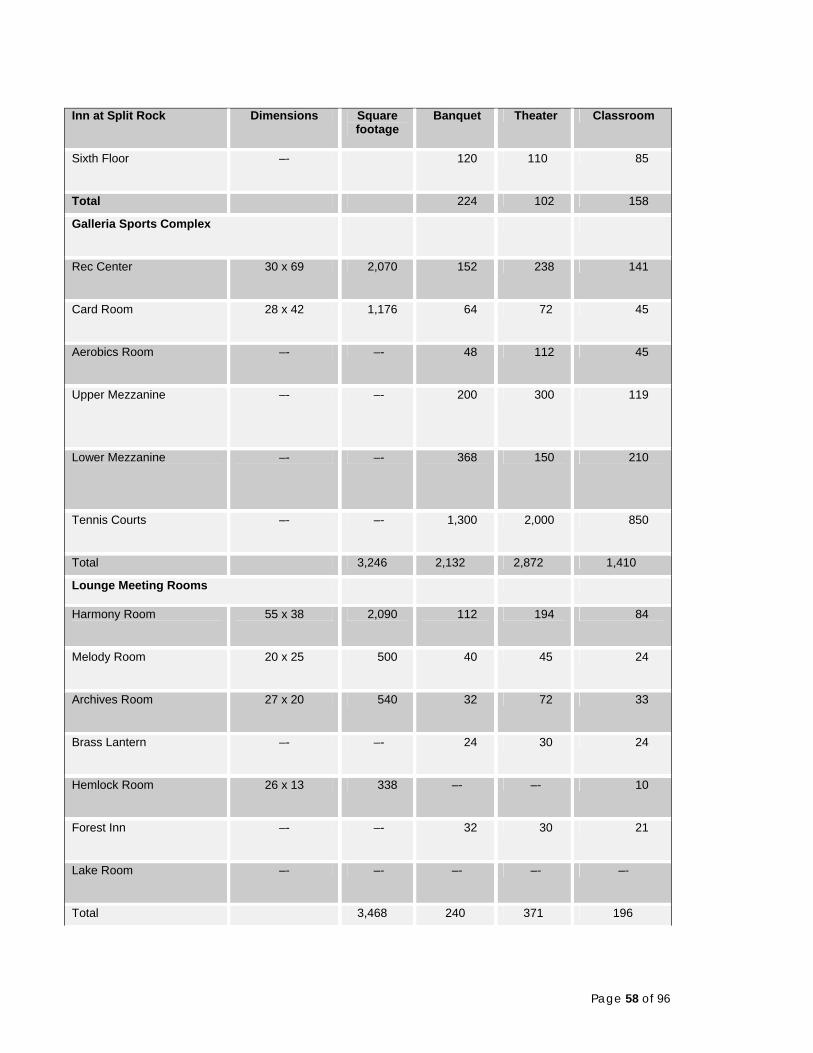
Inn at Split Rock Dimensions Square footage
Banquet Theater Classroom
Sixth Floor –- 120 110 85
Total 224 102 158
Galleria Sports Complex
Rec Center 30 x 69 2,070 152 238 141
Card Room 28 x 42 1,176 64 72 45
Aerobics Room –- –- 48 112 45
Upper Mezzanine –- –- 200 300 119
Lower Mezzanine –- –- 368 150 210
Tennis Courts –- –- 1,300 2,000 850
Total 3,246 2,132 2,872 1,410
Lounge Meeting Rooms
Harmony Room 55 x 38 2,090 112 194 84
Melody Room 20 x 25 500 40 45 24
Archives Room 27 x 20 540 32 72 33
Brass Lantern –- –- 24 30 24
Hemlock Room 26 x 13 338 –- –- 10
Forest Inn –- –- 32 30 21
Lake Room –- –- –- –- –-
Total 3,468 240 371 196
Page 58 of 96
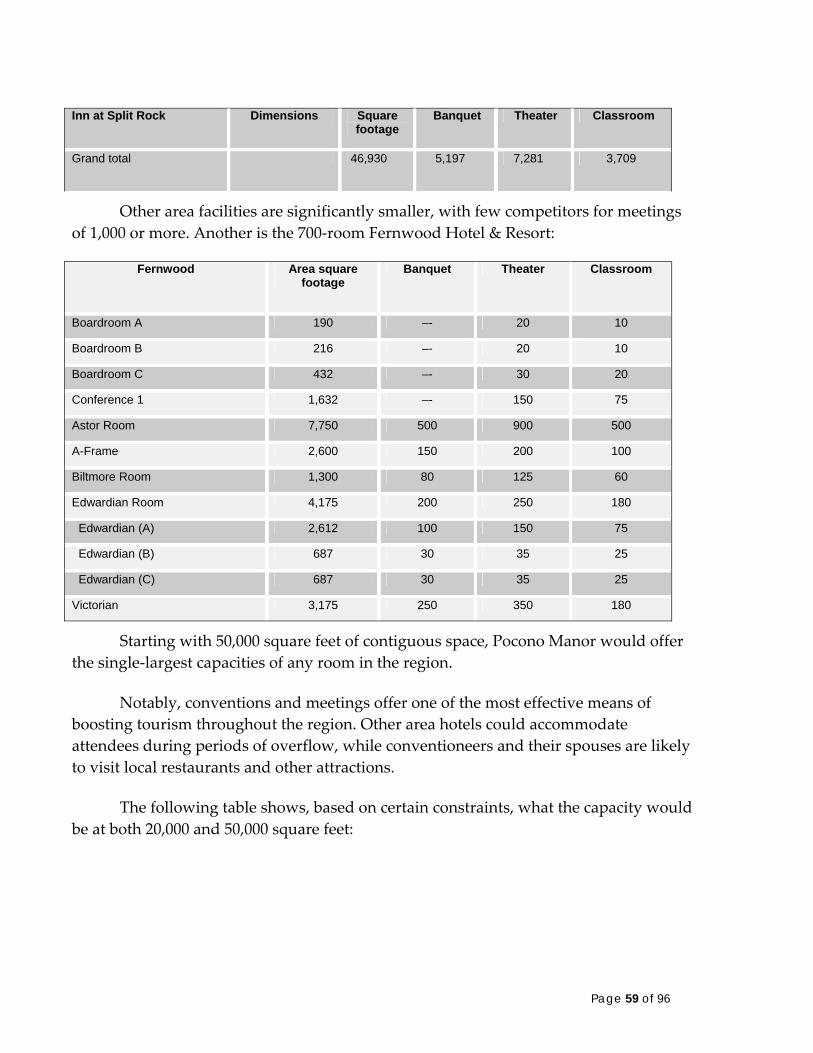
Inn at Split Rock Dimensions Square footage
Banquet Theater Classroom
Grand total 46,930 5,197 7,281 3,709
Other area facilities are significantly smaller, with few competitors for meetings of 1,000 or more. Another is the 700‐room Fernwood Hotel & Resort:
Fernwood Area square footage
Banquet Theater Classroom
Boardroom A 190 –- 20 10
Boardroom B 216 –- 20 10
Boardroom C 432 –- 30 20
Conference 1 1,632 –- 150 75
Astor Room 7,750 500 900 500
A-Frame 2,600 150 200 100
Biltmore Room 1,300 80 125 60
Edwardian Room 4,175 200 250 180
Edwardian (A) 2,612 100 150 75
Edwardian (B) 687 30 35 25
Edwardian (C) 687 30 35 25
Victorian 3,175 250 350 180
Starting with 50,000 square feet of contiguous space, Pocono Manor would offer the single‐largest capacities of any room in the region.
Notably, conventions and meetings offer one of the most effective means of boosting tourism throughout the region. Other area hotels could accommodate attendees during periods of overflow, while conventioneers and their spouses are likely to visit local restaurants and other attractions.
The following table shows, based on certain constraints, what the capacity would be at both 20,000 and 50,000 square feet:
Page 59 of 96
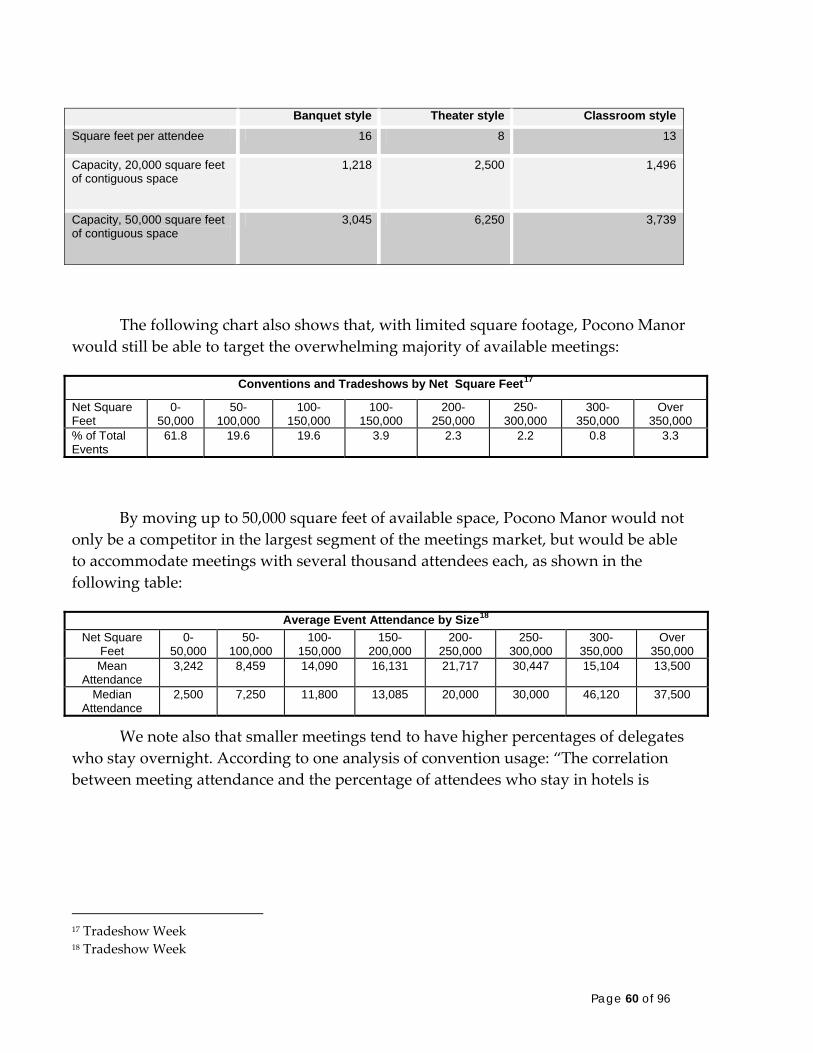
Banquet style Theater style Classroom style Square feet per attendee 16 8 13
Capacity, 20,000 square feet of contiguous space
1,218 2,500 1,496
Capacity, 50,000 square feet of contiguous space
3,045 6,250 3,739
The following chart also shows that, with limited square footage, Pocono Manor would still be able to target the overwhelming majority of available meetings:
Conventions and Tradeshows by Net Square Feet17
Net Square Feet
0-50,000
50- 100,000
100- 150,000
100- 150,000
200- 250,000
250- 300,000
300- 350,000
Over 350,000
% of Total Events
61.8 19.6 19.6 3.9 2.3 2.2 0.8 3.3
By moving up to 50,000 square feet of available space, Pocono Manor would not only be a competitor in the largest segment of the meetings market, but would be able to accommodate meetings with several thousand attendees each, as shown in the following table:
Average Event Attendance by Size18
Net Square Feet
0- 50,000
50- 100,000
100- 150,000
150- 200,000
200- 250,000
250- 300,000
300- 350,000
Over 350,000
Mean Attendance
3,242 8,459 14,090 16,131 21,717 30,447 15,104 13,500
Median Attendance
2,500 7,250 11,800 13,085 20,000 30,000 46,120 37,500
We note also that smaller meetings tend to have higher percentages of delegates who stay overnight. According to one analysis of convention usage: “The correlation between meeting attendance and the percentage of attendees who stay in hotels is
17 Tradeshow Week 18 Tradeshow Week
Page 60 of 96
clearly negative. For meetings with attendance under 5,000, about 59 percent stay in hotel rooms. But above 10,000, the proportion falls to just 24 percent.”19
With 750 rooms, Pocono Manor should be able to accommodate some of the region’s largest events, utilizing its own non‐casino hotel as well as other area properties for the runover.
By establishing itself as a headquarters hotel and encouraging overnight stays at other properties nearby, Pocono Manor would also develop strong relationships with other nearby resorts, positioning itself as an ally rather than a competitor.
Additionally, we note that having 50,000 square feet of contiguous meeting space opens the possibility of other options as well, including creating a special‐events arena for concerts that would likely exceed the 1,500‐seat theater.
Retail
Pocono Manor intends to add at least 275,000 square feet of retail, dining and entertainment. We strongly suggest that a well‐planned RDE addition, with attractions such as specialty retailers that would appeal to the target demographics, would work well with gaming and make it easier to achieve our more optimistic revenue projections.
With the acreage at Pocono Manor, a substantial opportunity exists to deploy retail shopping and dining attractions that would complement gaming and other attractions. Nongaming purchases in gaming locations have increased dramatically since the Forum Shops at Caesars Palace were introduced in May 1992. This was a revolutionary concept at the time, combining shopping and dining outlets operated by third‐party vendors, along with traditional gaming. There were lingering questions asked by observers: Would people want to shop and dine in Las Vegas instead of gambling? And, would an operator see accretive profitability as a result? The answer to both of those questions was yes.
Twelve years later, the Forum Shops have undergone three expansions. Originally opened with 283,000 square feet, the retail center now encompasses 675,000
19 “Challenging Convention(al) Wisdom: Hard Facts about the Proposed Boston Convention Center,” Heywood T. Sanders, Department of Urban Administration, Trinity University
Page 61 of 96
square feet and houses 160 shops and 13 restaurants. Like any good idea, it gets copied quickly. Retail square footage in Las Vegas now covers 4,000,000 square feet, which is considerable since the total square footage of gaming in the entire state of Nevada is 7,827,450. Nongaming revenue on the Nevada Strip accounts for 58 percent of total revenue versus 43 percent ten years ago20. The major venues for retail in Las Vegas are:
Forum Shops at Caesars Palace, operated by the Simon Property Group The Grand Canal Shoppes at the Venetian, with 500,000 square feet, operated by General Growth Properties Inc
Fashion Show Mall, 1,900,000 square feet, also operated by General Growth Properties Inc.
Desert Passage, at the Aladdin, is 475,000 square feet, owned by Boulevard Invest and managed by The Related Companies.
We also note that – from a competitive standpoint – gaming destinations in the Northeast are adding retail attractions, and in some cases, the additional capital investment is being subsidized by the public sector.
Atlantic City, with 33 million annual visitor trips per year, has been historically an under‐performer in the retail sales sector. Operators faced with small, constrained sites and potential high business volumes of short trip duration focused on deploying gaming products and not retail. The State of New Jersey – through a series of statutory changes enacted in recent years – is leading the evolution and helping to ensure the success of Atlantic City by establishing incentives to foster the creation of entertainment/retail districts in Atlantic City. Two bills signed into law would establish as many as 11 such districts that would ultimately help Atlantic City withstand competition and grow its visitor base.
The “Casino Reinvestment Development Authority urban revitalization incentive program,” popularly known as the Gormley‐James bill,21 was enacted in 2001. The relevant portion of the legislation allows for the creation of six entertainment‐retail districts in Atlantic City as well as revitalization of other urban areas in the state. The bill was expanded in August 2004 to include five more entertainment‐retail districts, for a total of 11.
The purpose of the legislation is to develop nongaming attractions in Atlantic City and broaden its appeal beyond that of a day‐trip gambling market. As stated in the bill summary, the legislation was “to benefit the overall development of Atlantic City and strengthen the stateʹs economy.”
20 Nevada Gaming Control Board 21 Its principal sponsors were Sen. William Gormley, R-Atlantic, and Sen. Sharpe James, D-Essex.
Page 62 of 96

In exchange for building an entertainment‐retail district with at least 150,000 square feet of public space, casino licensees are entitled to these benefits:
A rebate of sales and use tax on construction materials used in building the district project.
A rebate of sales tax generated by the retail sales of tangible personal property and services originating from the district, with an annual cap of $2.5 million, payable annually through 2022, or until the grant equals the approved cost of the district project.
A rebate of the incremental Luxury Tax – as determined from an approved base amount – from the project to be paid from all casino hotel room fees, payable annually through 2022, or until the grant equals the approved cost of the district project.
The first tranche of the legislation is fully subscribed, although only two of the district projects are now accruing the benefits: The Harrah’s‐Showboat‐Walk project, which comprises seven square blocks in the heart of Atlantic City and is home to 41 retail tenets, and the Tropicana expansion, The Quarter, which opened in the fourth quarter of 2004 and is 200,000 square feet housing 25 shops, 9 dining venues and 6 entertainment areas.
The other major qualifying retail projects on the horizon are:
The Pier at Caesars, being developed by the Gordon Group, which will have 320,000 square feet of retail space with 90 middle‐ to high‐end retailers, located on a pier directly opposite Caesars on the boardwalk. The Pier is scheduled to open in 200622
A two‐phased expansion project of the Borgata, which will add 4 restaurants, 2 night clubs and 6 retail shops to the facility. The expansion is expected to open in 2006.
House of Blues addition to the Showboat, which has a southern‐inspired restaurant, a 2,200‐seat multi‐level music hall, nightclub, beach bar and outdoor lounge. House of Blues opened in July 200523.
22 Gordon Group press release 23 House of Blues press release
Page 63 of 96
The building of a quality entertainment offering has shown to be able to significantly increase nongaming revenue as a percentage of overall revenue, as is the case with the Borgata, which enjoys non‐gaming revenues of 34.4 percent24 of total revenues, more than twice the industry average.
The State of New Jersey has anticipated the threat of increased competition to the casino industry and has responded with a legislative program aimed at protecting its existing base and increasing the state’s benefits of new employment through subsidized retail development.
We point this out because it is becoming increasingly clear that retail is an important weapon in the arsenal of resorts that are determined to withstand competition from the expansion of gaming. In short, retailing is an important consideration when resorts seek to become destinations, rather than convenience‐driven alternatives.
As part of our analysis, we have examined retail outlet performance at U.S. shopping malls, and compared it to retail performance in gaming destinations. Here is a summary of national sales at malls:
24 Borgata press release
Page 64 of 96
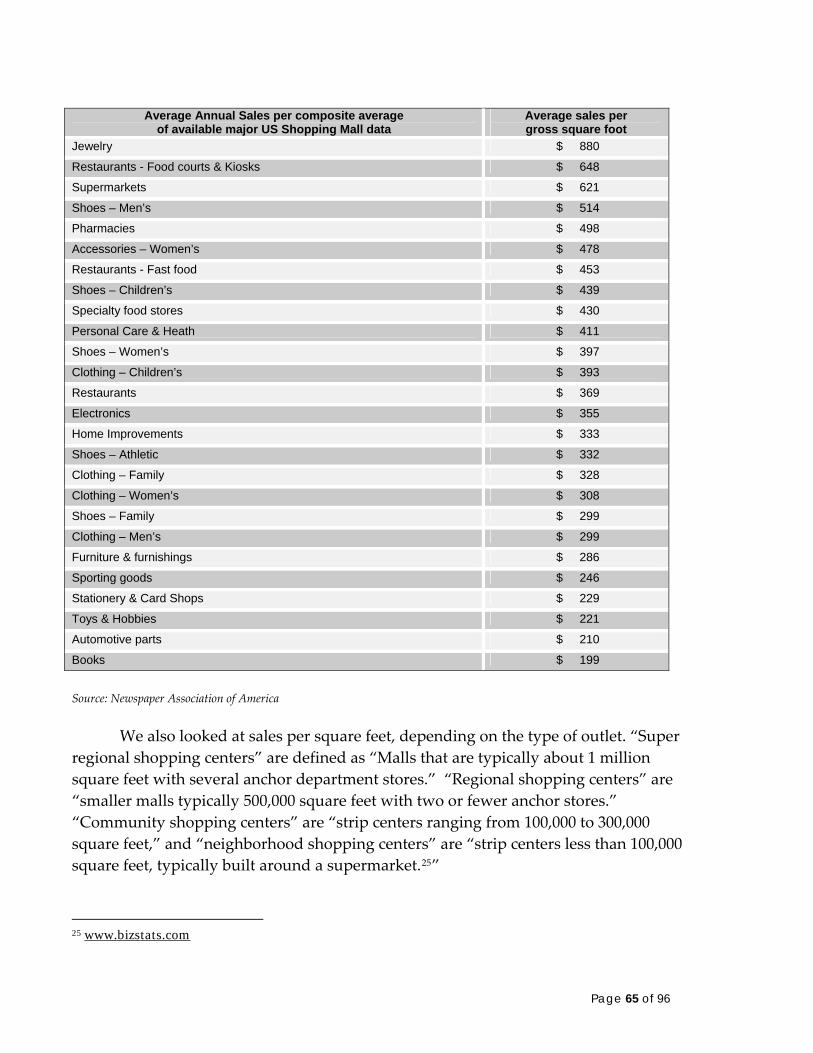
Average Annual Sales per composite average of available major US Shopping Mall data
Average sales per gross square foot
Jewelry $ 880
Restaurants - Food courts & Kiosks $ 648
Supermarkets $ 621
Shoes – Men’s $ 514
Pharmacies $ 498
Accessories – Women’s $ 478
Restaurants - Fast food $ 453
Shoes – Children’s $ 439
Specialty food stores $ 430
Personal Care & Heath $ 411
Shoes – Women’s $ 397
Clothing – Children’s $ 393
Restaurants $ 369
Electronics $ 355
Home Improvements $ 333
Shoes – Athletic $ 332
Clothing – Family $ 328
Clothing – Women’s $ 308
Shoes – Family $ 299
Clothing – Men’s $ 299
Furniture & furnishings $ 286
Sporting goods $ 246
Stationery & Card Shops $ 229
Toys & Hobbies $ 221
Automotive parts $ 210
Books $ 199
Source: Newspaper Association of America
We also looked at sales per square feet, depending on the type of outlet. “Super regional shopping centers” are defined as “Malls that are typically about 1 million square feet with several anchor department stores.” “Regional shopping centers” are “smaller malls typically 500,000 square feet with two or fewer anchor stores.” “Community shopping centers” are “strip centers ranging from 100,000 to 300,000 square feet,” and “neighborhood shopping centers” are “strip centers less than 100,000 square feet, typically built around a supermarket.25”
25 www.bizstats.com
Page 65 of 96

Sales per Square Foot Super Regional Shopping Centers
Regional Shopping Centers
Community Shopping Centers
Neighborhood Shopping Centers
General Merchandise $ 155 $ 144 $ 133 $ 100
Food $ 340 $ 303 $ 310 $ 312
Food Service $ 406 $ 289 $ 229 $ 183
Clothing and Accessories
$ 229 $ 209 $ 167 $ 201
Shoes $ 291 $ 241 $ 168 $ 145
Home Furnishings $ 257 $ 234 $ 158 $ 160
Home Appliances/Music $ 312 $ 282 $ 189 $ 175
Building Materials/Hardware
n/a $ 178 $ 131 $ 111
Automotive $ 140 $ 184 $ 146 $ 136
Hobby/Special Interest $ 274 $ 234 $ 156 $ 163
Gifts/Specialty $ 267 $ 197 $ 146 $ 149
Jewelry $ 748 $ 549 $ 264 $ 280
Liquor n/a n/a $ 250 $ 217
Drugs $ 229 $ 228 $ 247 $ 241
Other Retail $ 371 $ 288 $ 172 $ 143
Source: www.bizstats.com
The range of overall sales appears to be within a blend of between $300 per square foot and $400 per square foot. This appears to be an acceptable range. We also looked at sales from the Simon Property Group, which operates the Forum Shops along with regional malls across America; its overall production is $421.20 per square foot.
Although difficult to verify, we did gather information on retail sales in gaming locations in both Atlantic City and Las Vegas.
Page 66 of 96
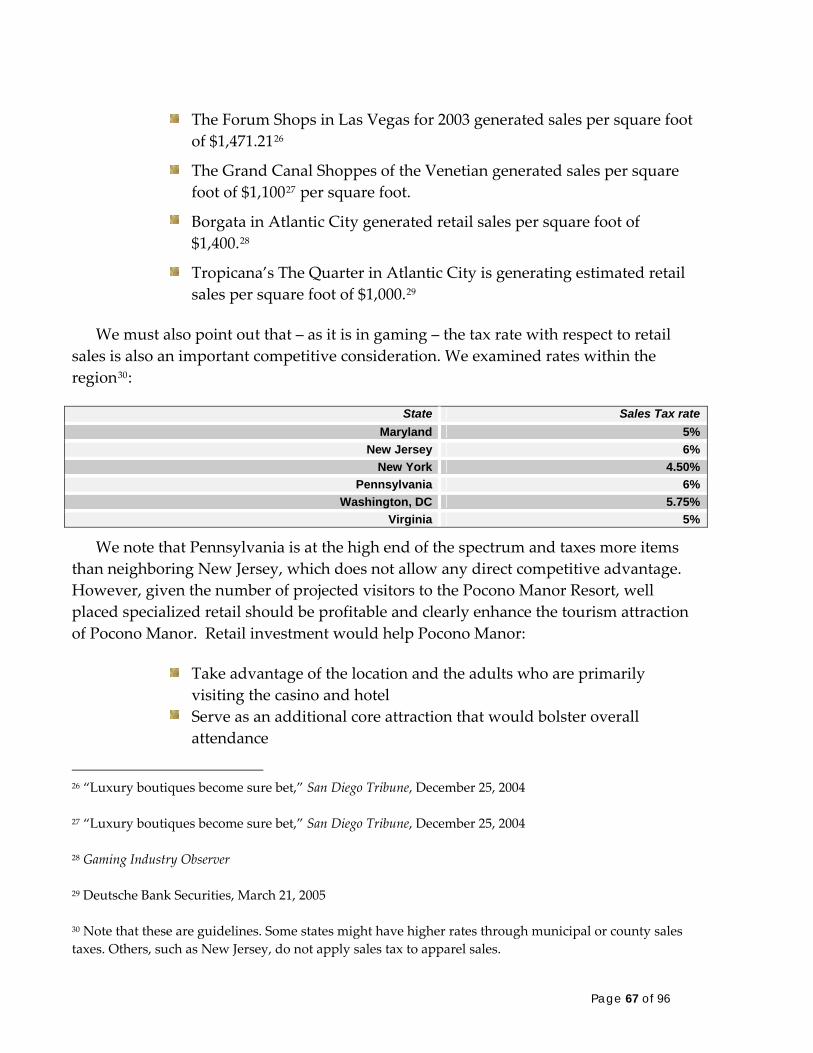
The Forum Shops in Las Vegas for 2003 generated sales per square foot of $1,471.2126
The Grand Canal Shoppes of the Venetian generated sales per square foot of $1,10027 per square foot.
Borgata in Atlantic City generated retail sales per square foot of $1,400.28
Tropicana’s The Quarter in Atlantic City is generating estimated retail sales per square foot of $1,000.29
We must also point out that – as it is in gaming – the tax rate with respect to retail sales is also an important competitive consideration. We examined rates within the region30:
State Sales Tax rate Maryland 5%
New Jersey 6% New York 4.50%
Pennsylvania 6% Washington, DC 5.75%
Virginia 5%
We note that Pennsylvania is at the high end of the spectrum and taxes more items than neighboring New Jersey, which does not allow any direct competitive advantage. However, given the number of projected visitors to the Pocono Manor Resort, well placed specialized retail should be profitable and clearly enhance the tourism attraction of Pocono Manor. Retail investment would help Pocono Manor:
Take advantage of the location and the adults who are primarily visiting the casino and hotel
Serve as an additional core attraction that would bolster overall attendance
26 “Luxury boutiques become sure bet,” San Diego Tribune, December 25, 2004 27 “Luxury boutiques become sure bet,” San Diego Tribune, December 25, 2004 28 Gaming Industry Observer 29 Deutsche Bank Securities, March 21, 2005 30 Note that these are guidelines. Some states might have higher rates through municipal or county sales taxes. Others, such as New Jersey, do not apply sales tax to apparel sales.
Page 67 of 96
Pocono Manor should establish a unique hybrid of a ”Lifestyle Center” as the retail, dining and entertainment (RDE) component of its overall development plan that capitalizes on the unique magnet of its casino anchor and enhances and reinforces the residential elements of the program. Such lifestyle centers typically take up less than half the land of a traditional mall, are more productive economically, and are increasingly desirable by both tenants, and residents and visitors alike. The centers provide customers with a gathering place and offer communities a sense of identity. The hybrid involves elements of a traditional lifestyle center / town center combined with a unique approach to integrating the retail, dining and entertainment uses within the gaming and hotel experiences.
Such a well‐conceived RDE component would bolster the entire property, helping to transform the entire development into an entertainment destination that could help anchor tourism in the entire Poconos region.
Our initial recommendation is that the first phase of the lifestyle center should comprise approximately 275,000 square feet of RDE, which would consist of:
A core gaming‐linked RDE component of 49,000 to 77,000 square feet, exclusive of live theater and any entertainment uses integrated within gaming space (e.g. stages, performance areas, etc.)
Additional GLA (gross leaseable area) of 128,000 square feet, for a combined phase 1 lifestyle / town center full destination program of 203,000 square feet.
A “lifestyle center” RDE would generate approximately:
$46 million of dining & entertainment sales.
$53 million of retail sales.
This would result in total sales of approximately $500 per square foot.
Identifying capacity needs This section of the analysis deals with the issue of how many people will be on
site during peak and non‐peak periods. To determine peak demand, we start with the highest level of revenue and visitation in our model: $ 358,592,186 in revenue and 1.4 million discrete visitors. In our experience as managers, and in discussions with various gaming operators, an average patron loses an average of 80 cents per minute, or $48 per hour while actively playing. Note that this is a blended average of various denominations and player preferences – including the number of coins per handle pull. For a 3,000‐slot casino, this would equate to the following:
Page 68 of 96
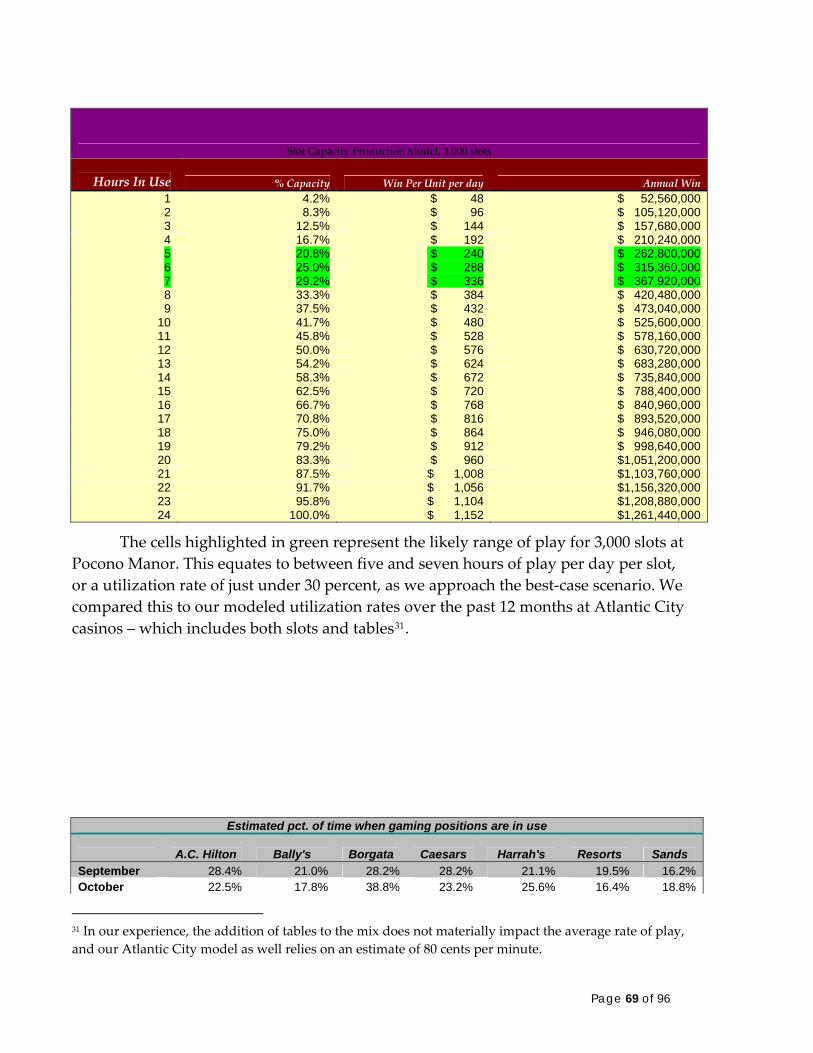
Slot Capacity Production Model, 3,000 slots
Hours In Use % Capacity Win Per Unit per day Annual Win 1 4.2% $ 48 $ 52,560,000 2 8.3% $ 96 $ 105,120,000 3 12.5% $ 144 $ 157,680,000 4 16.7% $ 192 $ 210,240,000 5 20.8% $ 240 $ 262,800,000 6 25.0% $ 288 $ 315,360,000 7 29.2% $ 336 $ 367,920,000 8 33.3% $ 384 $ 420,480,000 9 37.5% $ 432 $ 473,040,000
10 41.7% $ 480 $ 525,600,000 11 45.8% $ 528 $ 578,160,000 12 50.0% $ 576 $ 630,720,000 13 54.2% $ 624 $ 683,280,000 14 58.3% $ 672 $ 735,840,000 15 62.5% $ 720 $ 788,400,000 16 66.7% $ 768 $ 840,960,000 17 70.8% $ 816 $ 893,520,000 18 75.0% $ 864 $ 946,080,000 19 79.2% $ 912 $ 998,640,000 20 83.3% $ 960 $1,051,200,000 21 87.5% $ 1,008 $1,103,760,000 22 91.7% $ 1,056 $1,156,320,000 23 95.8% $ 1,104 $1,208,880,000 24 100.0% $ 1,152 $1,261,440,000
The cells highlighted in green represent the likely range of play for 3,000 slots at Pocono Manor. This equates to between five and seven hours of play per day per slot, or a utilization rate of just under 30 percent, as we approach the best‐case scenario. We compared this to our modeled utilization rates over the past 12 months at Atlantic City casinos – which includes both slots and tables31.
Estimated pct. of time when gaming positions are in use
A.C. Hilton Bally's Borgata Caesars Harrah's Resorts Sands September 28.4% 21.0% 28.2% 28.2% 21.1% 19.5% 16.2% October 22.5% 17.8% 38.8% 23.2% 25.6% 16.4% 18.8%
31 In our experience, the addition of tables to the mix does not materially impact the average rate of play, and our Atlantic City model as well relies on an estimate of 80 cents per minute.
Page 69 of 96
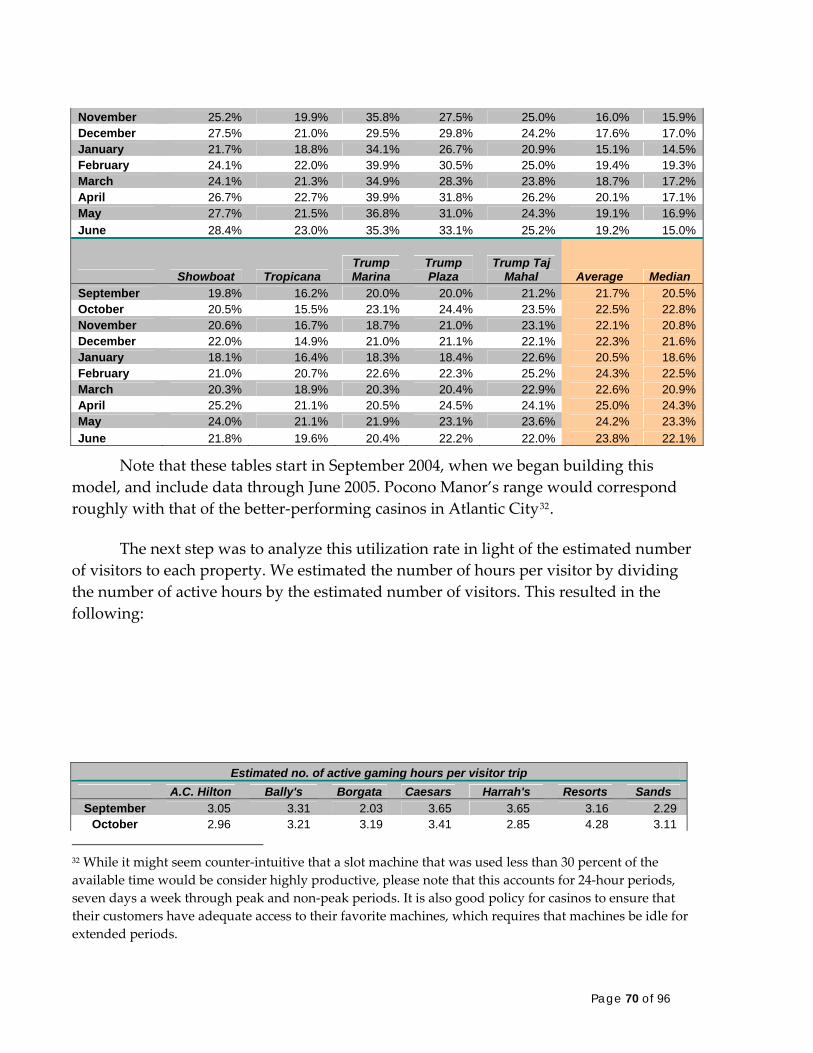
November 25.2% 19.9% 35.8% 27.5% 25.0% 16.0% 15.9% December 27.5% 21.0% 29.5% 29.8% 24.2% 17.6% 17.0% January 21.7% 18.8% 34.1% 26.7% 20.9% 15.1% 14.5% February 24.1% 22.0% 39.9% 30.5% 25.0% 19.4% 19.3% March 24.1% 21.3% 34.9% 28.3% 23.8% 18.7% 17.2% April 26.7% 22.7% 39.9% 31.8% 26.2% 20.1% 17.1% May 27.7% 21.5% 36.8% 31.0% 24.3% 19.1% 16.9% June 28.4% 23.0% 35.3% 33.1% 25.2% 19.2% 15.0%
Showboat Tropicana Trump Marina
Trump Plaza
Trump Taj Mahal Average Median
September 19.8% 16.2% 20.0% 20.0% 21.2% 21.7% 20.5% October 20.5% 15.5% 23.1% 24.4% 23.5% 22.5% 22.8% November 20.6% 16.7% 18.7% 21.0% 23.1% 22.1% 20.8% December 22.0% 14.9% 21.0% 21.1% 22.1% 22.3% 21.6% January 18.1% 16.4% 18.3% 18.4% 22.6% 20.5% 18.6% February 21.0% 20.7% 22.6% 22.3% 25.2% 24.3% 22.5% March 20.3% 18.9% 20.3% 20.4% 22.9% 22.6% 20.9% April 25.2% 21.1% 20.5% 24.5% 24.1% 25.0% 24.3% May 24.0% 21.1% 21.9% 23.1% 23.6% 24.2% 23.3% June 21.8% 19.6% 20.4% 22.2% 22.0% 23.8% 22.1%
Note that these tables start in September 2004, when we began building this model, and include data through June 2005. Pocono Manor’s range would correspond roughly with that of the better‐performing casinos in Atlantic City32.
The next step was to analyze this utilization rate in light of the estimated number of visitors to each property. We estimated the number of hours per visitor by dividing the number of active hours by the estimated number of visitors. This resulted in the following:
Estimated no. of active gaming hours per visitor trip A.C. Hilton Bally's Borgata Caesars Harrah's Resorts Sands
September 3.05 3.31 2.03 3.65 3.65 3.16 2.29 October 2.96 3.21 3.19 3.41 2.85 4.28 3.11
32 While it might seem counter‐intuitive that a slot machine that was used less than 30 percent of the available time would be consider highly productive, please note that this accounts for 24‐hour periods, seven days a week through peak and non‐peak periods. It is also good policy for casinos to ensure that their customers have adequate access to their favorite machines, which requires that machines be idle for extended periods.
Page 70 of 96
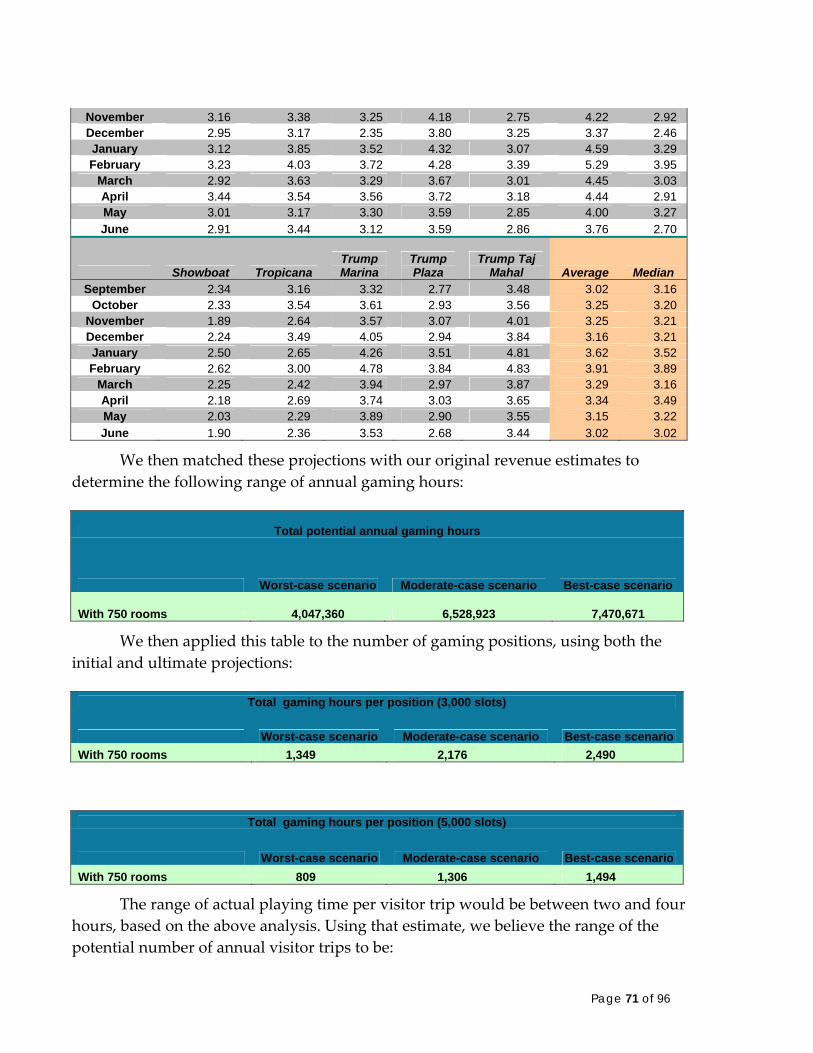
November 3.16 3.38 3.25 4.18 2.75 4.22 2.92 December 2.95 3.17 2.35 3.80 3.25 3.37 2.46 January 3.12 3.85 3.52 4.32 3.07 4.59 3.29 February 3.23 4.03 3.72 4.28 3.39 5.29 3.95
March 2.92 3.63 3.29 3.67 3.01 4.45 3.03 April 3.44 3.54 3.56 3.72 3.18 4.44 2.91 May 3.01 3.17 3.30 3.59 2.85 4.00 3.27 June 2.91 3.44 3.12 3.59 2.86 3.76 2.70
Showboat Tropicana Trump Marina
Trump Plaza
Trump Taj Mahal Average Median
September 2.34 3.16 3.32 2.77 3.48 3.02 3.16 October 2.33 3.54 3.61 2.93 3.56 3.25 3.20
November 1.89 2.64 3.57 3.07 4.01 3.25 3.21 December 2.24 3.49 4.05 2.94 3.84 3.16 3.21 January 2.50 2.65 4.26 3.51 4.81 3.62 3.52 February 2.62 3.00 4.78 3.84 4.83 3.91 3.89
March 2.25 2.42 3.94 2.97 3.87 3.29 3.16 April 2.18 2.69 3.74 3.03 3.65 3.34 3.49 May 2.03 2.29 3.89 2.90 3.55 3.15 3.22 June 1.90 2.36 3.53 2.68 3.44 3.02 3.02
We then matched these projections with our original revenue estimates to determine the following range of annual gaming hours:
Total potential annual gaming hours
Worst-case scenario Moderate-case scenario Best-case scenario
With 750 rooms 4,047,360 6,528,923 7,470,671
We then applied this table to the number of gaming positions, using both the initial and ultimate projections:
Total gaming hours per position (3,000 slots)
Worst-case scenario Moderate-case scenario Best-case scenario With 750 rooms 1,349 2,176 2,490
Total gaming hours per position (5,000 slots)
Worst-case scenario Moderate-case scenario Best-case scenario With 750 rooms 809 1,306 1,494
The range of actual playing time per visitor trip would be between two and four hours, based on the above analysis. Using that estimate, we believe the range of the potential number of annual visitor trips to be:
Page 71 of 96
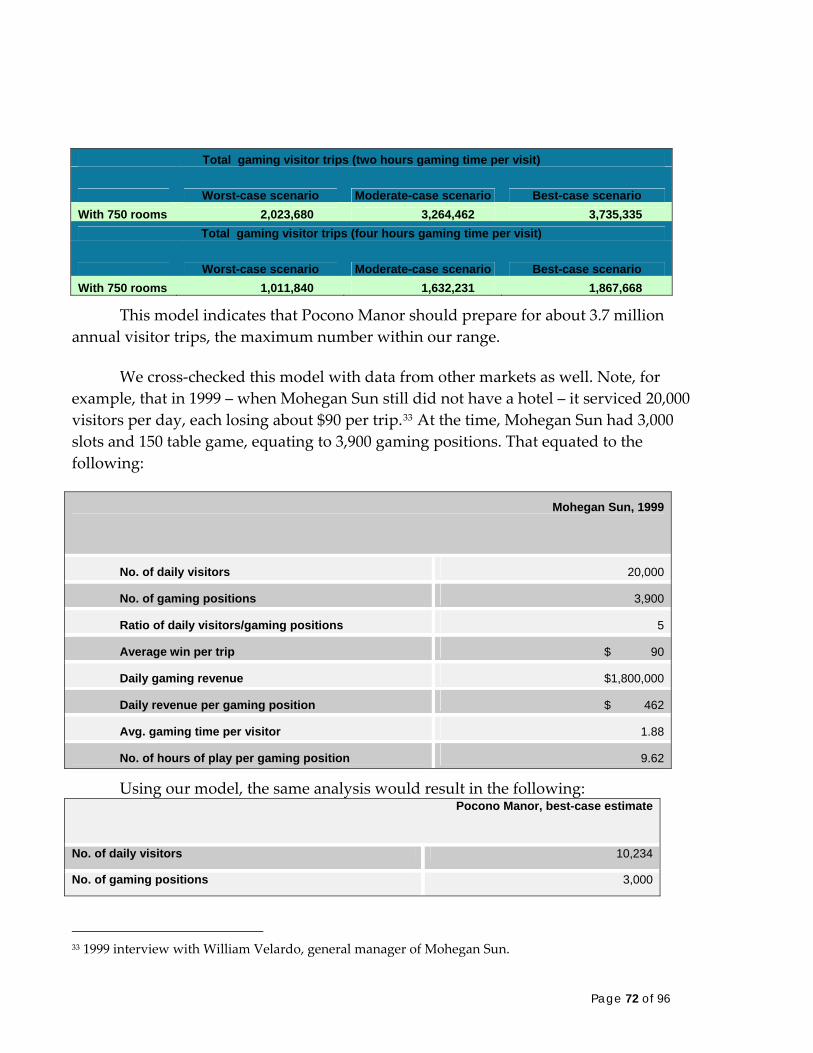
Total gaming visitor trips (two hours gaming time per visit)
Worst-case scenario Moderate-case scenario Best-case scenario With 750 rooms 2,023,680 3,264,462 3,735,335
Total gaming visitor trips (four hours gaming time per visit)
Worst-case scenario Moderate-case scenario Best-case scenario With 750 rooms 1,011,840 1,632,231 1,867,668
This model indicates that Pocono Manor should prepare for about 3.7 million annual visitor trips, the maximum number within our range.
We cross‐checked this model with data from other markets as well. Note, for example, that in 1999 – when Mohegan Sun still did not have a hotel – it serviced 20,000 visitors per day, each losing about $90 per trip.33 At the time, Mohegan Sun had 3,000 slots and 150 table game, equating to 3,900 gaming positions. That equated to the following:
Mohegan Sun, 1999
No. of daily visitors 20,000
No. of gaming positions 3,900
Ratio of daily visitors/gaming positions 5
Average win per trip $ 90
Daily gaming revenue $1,800,000
Daily revenue per gaming position $ 462
Avg. gaming time per visitor 1.88
No. of hours of play per gaming position 9.62
Using our model, the same analysis would result in the following: Pocono Manor, best-case estimate
No. of daily visitors 10,234
No. of gaming positions 3,000
33 1999 interview with William Velardo, general manager of Mohegan Sun.
Page 72 of 96
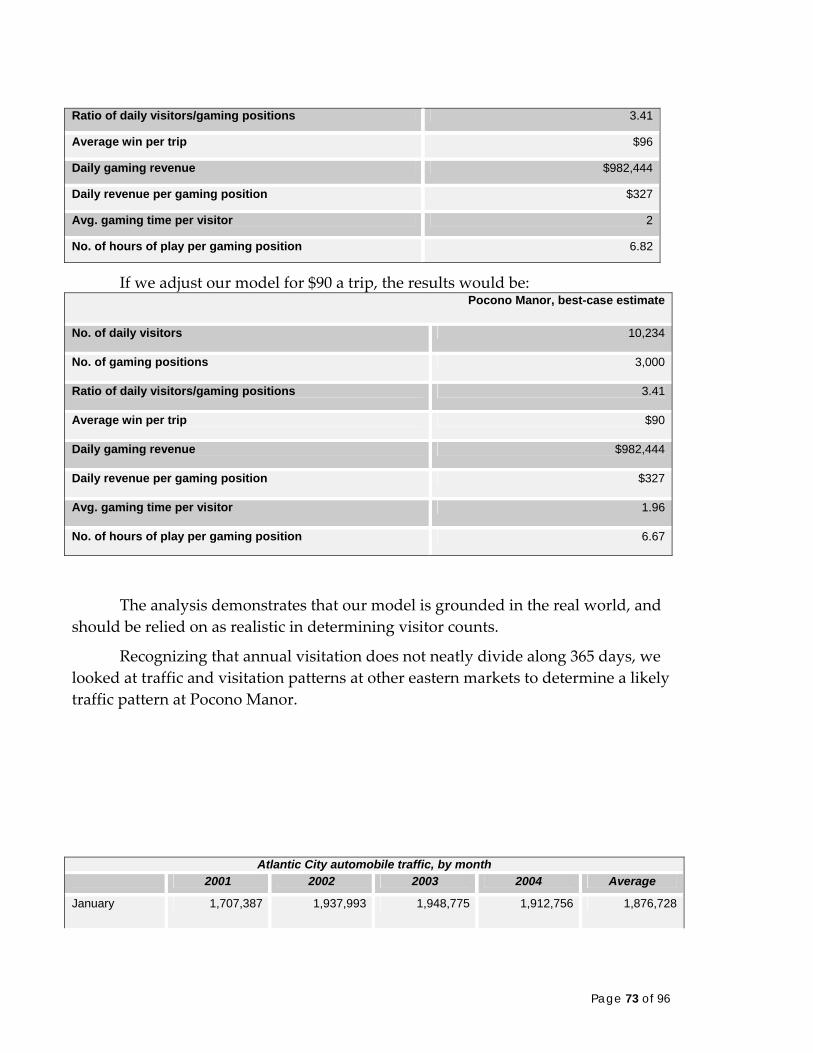
Ratio of daily visitors/gaming positions 3.41
Average win per trip $96
Daily gaming revenue $982,444
Daily revenue per gaming position $327
Avg. gaming time per visitor 2
No. of hours of play per gaming position 6.82
If we adjust our model for $90 a trip, the results would be: Pocono Manor, best-case estimate
No. of daily visitors 10,234
No. of gaming positions 3,000
Ratio of daily visitors/gaming positions 3.41
Average win per trip $90
Daily gaming revenue $982,444
Daily revenue per gaming position $327
Avg. gaming time per visitor 1.96
No. of hours of play per gaming position 6.67
The analysis demonstrates that our model is grounded in the real world, and should be relied on as realistic in determining visitor counts.
Recognizing that annual visitation does not neatly divide along 365 days, we looked at traffic and visitation patterns at other eastern markets to determine a likely traffic pattern at Pocono Manor.
Atlantic City automobile traffic, by month
2001 2002 2003 2004 Average
January 1,707,387 1,937,993 1,948,775 1,912,756 1,876,728
Page 73 of 96
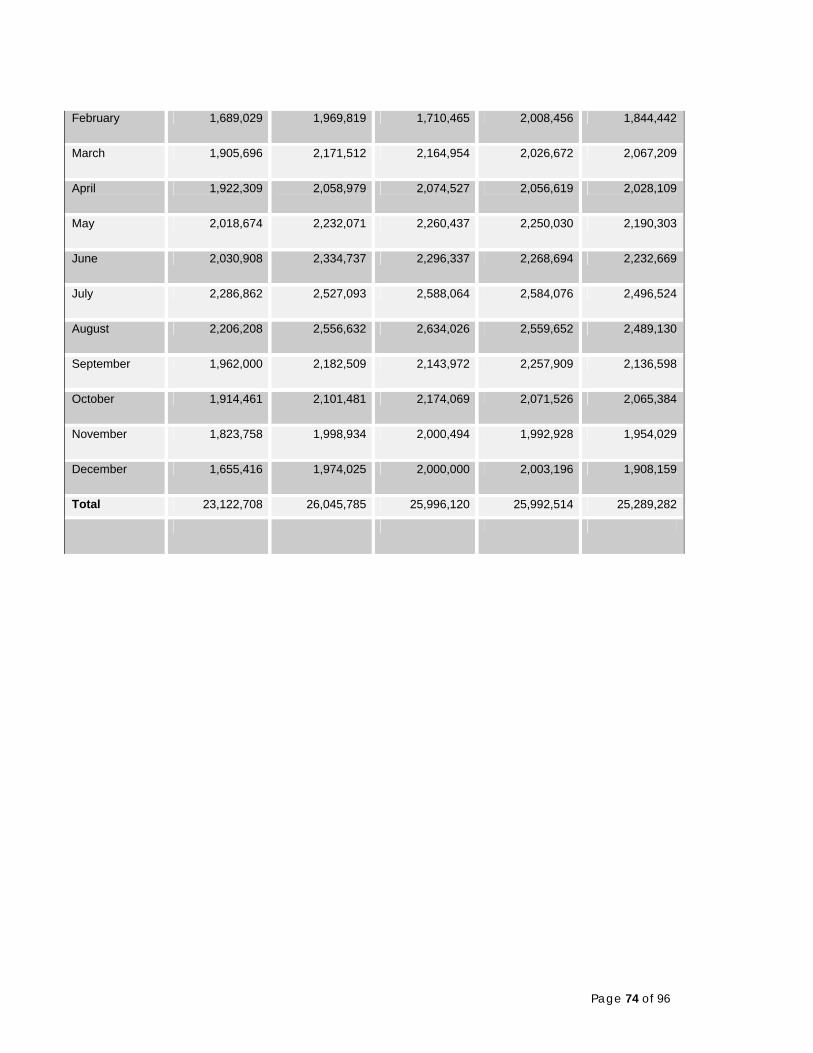
February 1,689,029 1,969,819 1,710,465 2,008,456 1,844,442
March 1,905,696 2,171,512 2,164,954 2,026,672 2,067,209
April 1,922,309 2,058,979 2,074,527 2,056,619 2,028,109
May 2,018,674 2,232,071 2,260,437 2,250,030 2,190,303
June 2,030,908 2,334,737 2,296,337 2,268,694 2,232,669
July 2,286,862 2,527,093 2,588,064 2,584,076 2,496,524
August 2,206,208 2,556,632 2,634,026 2,559,652 2,489,130
September 1,962,000 2,182,509 2,143,972 2,257,909 2,136,598
October 1,914,461 2,101,481 2,174,069 2,071,526 2,065,384
November 1,823,758 1,998,934 2,000,494 1,992,928 1,954,029
December 1,655,416 1,974,025 2,000,000 2,003,196 1,908,159
Total 23,122,708 26,045,785 25,996,120 25,992,514 25,289,282
Page 74 of 96
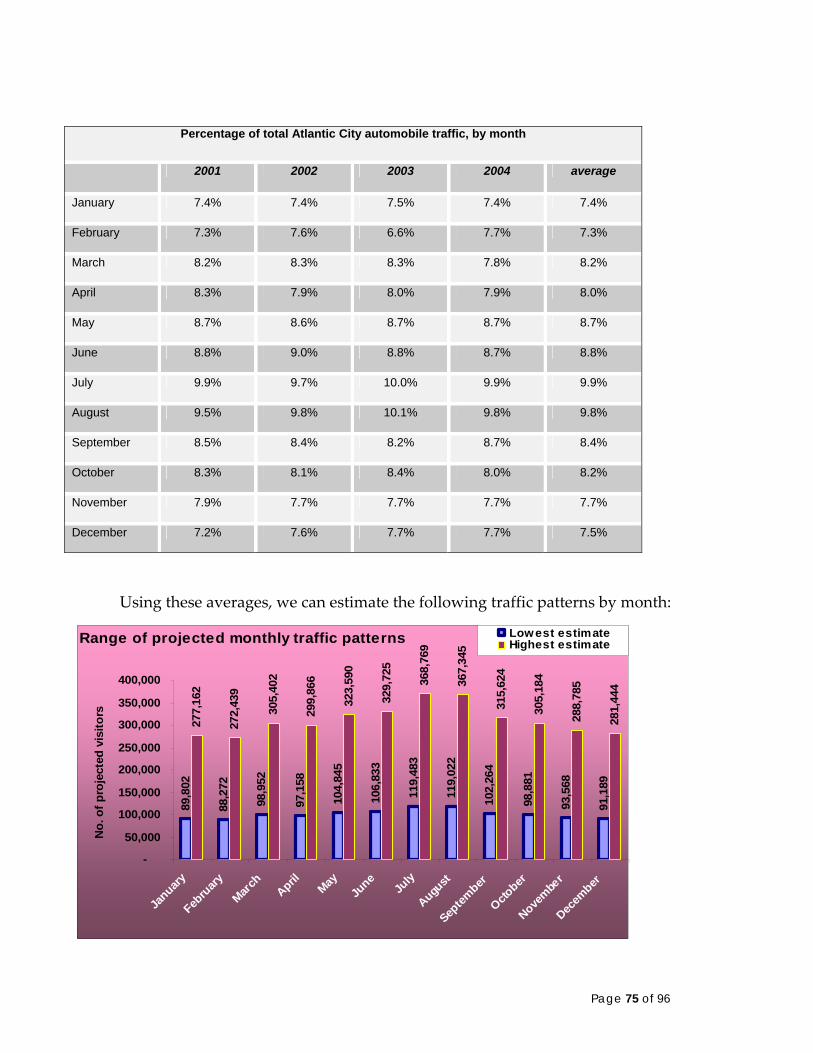
Percentage of total Atlantic City automobile traffic, by month
2001 2002 2003 2004 average
January 7.4% 7.4% 7.5% 7.4% 7.4%
February 7.3% 7.6% 6.6% 7.7% 7.3%
March 8.2% 8.3% 8.3% 7.8% 8.2%
April 8.3% 7.9% 8.0% 7.9% 8.0%
May 8.7% 8.6% 8.7% 8.7% 8.7%
June 8.8% 9.0% 8.8% 8.7% 8.8%
July 9.9% 9.7% 10.0% 9.9% 9.9%
August 9.5% 9.8% 10.1% 9.8% 9.8%
September 8.5% 8.4% 8.2% 8.7% 8.4%
October 8.3% 8.1% 8.4% 8.0% 8.2%
November 7.9% 7.7% 7.7% 7.7% 7.7%
December 7.2% 7.6% 7.7% 7.7% 7.5%
Using these averages, we can estimate the following traffic patterns by month:
Range of projected monthly traffic patterns
89,8
02
88,2
72
98,9
52
97,1
58
104,
845
106,
833
119,
483
119,
022
102,
264
98,8
81
93,5
68
91,1
89
277,
162
272,
439
305,
402
299,
866
323,
590
329,
725
368,
769
367,
345
315,
624
305,
184
288,
785
281,
444
-
50,000
100,000
150,000
200,000
250,000
300,000
350,000
400,000
January
Febru
ary
March
AprilMay
June
July
August
Septem
ber
October
Novembe
r
Decem
ber
No.
of p
roje
cted
vis
itors
Lowest estimateHighest estimate
Page 75 of 96

We can expect the summer months at Pocono Manor to be the periods of peak traffic. Within those periods, weekends are busiest, and among weekends, July 4th would tend to be the busiest, thus giving a clear picture as to traffic during periods of peak demand.
In recent years in Atlantic City, the Saturday of that first weekend in July generates about 3.5 percent to 4.3 percent of all inbound automobile traffic in July. Extrapolating from that, we can estimate that up to 16,000 adults would visit Pocono Manor on the Saturday of the July 4th weekend. That is our highest estimate based on the scenarios we tested, and more likely the peak would be less than 14,000 in the initial years. In terms of vehicles – assuming all visitors arrive by car and assuming only 1.8 passengers per vehicle – this would generate nearly 9,000 vehicles on a peak day. Again, that is the scenario based on the highest assumptions regarding visitation and the lowest regarding passengers per vehicle. More likely, the peak would be closer to 6,100 vehicles on a busy holiday weekend.
We also estimate that the Saturday peak hours entering Pocono Manor would be between 2 and 4 p.m., and the peak hour leaving would be from 9 p.m. to 11 p.m.34
We also examined available data for Foxwoods and Mohegan Sun, Native‐American casinos in Connecticut that have long been among the world leaders in such important measures as size, profitability and win per unit.
The first chart shows snapshots of weekend days in May 1997 at Foxwoods and Mohegan Sun:35
34 These estimates are for casino patrons only, and would not include employees or minors traveling with adults.
35 Bridgeport Casino Traffic Impacts On The South Western Region Of Connecticut Draft Report, April 2001, Prepared for the South Western Regional Planning Agency, by Buckhurst Fish & Jacquemart Inc., New York.
Page 76 of 96
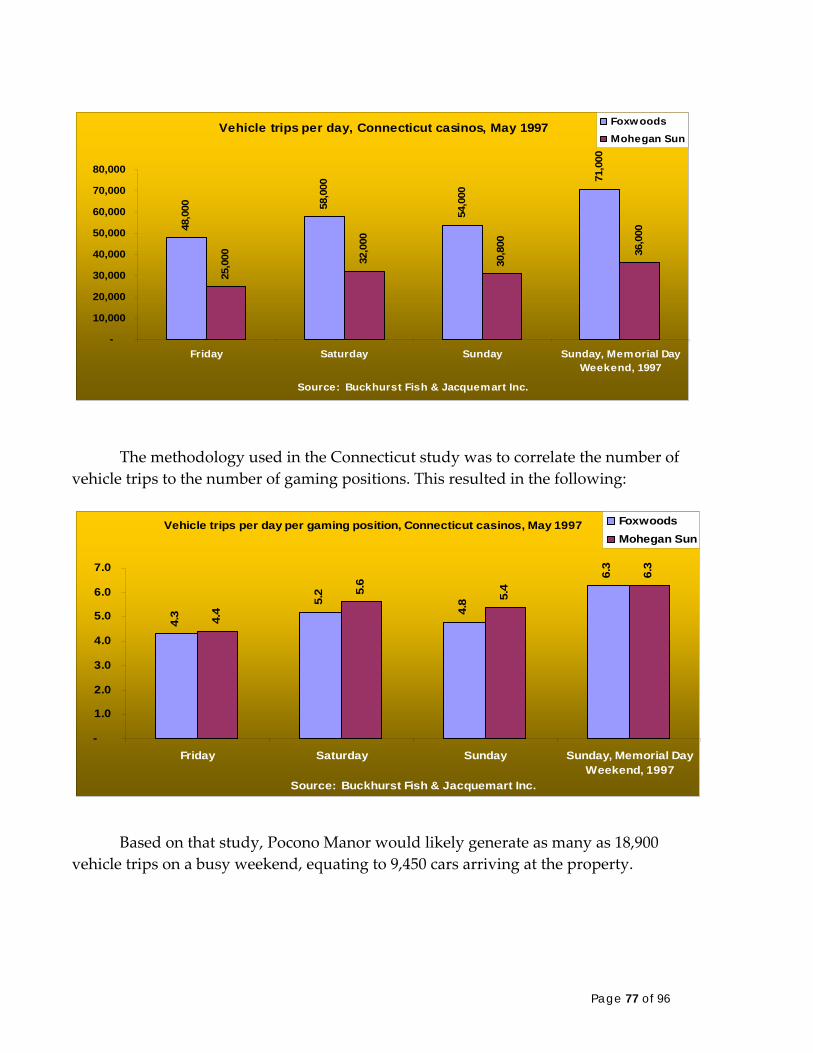
Vehicle trips per day, Connecticut casinos, May 1997
48,0
00 58,0
00
54,0
00
71,0
00
25,0
00 32,0
00
30,8
00
36,0
00
-
10,000
20,000
30,000
40,000
50,000
60,000
70,000
80,000
Friday Saturday Sunday Sunday, Memorial DayWeekend, 1997
Source: Buckhurst Fish & Jacquemart Inc.
FoxwoodsMohegan Sun
The methodology used in the Connecticut study was to correlate the number of vehicle trips to the number of gaming positions. This resulted in the following:
Vehicle trips per day per gaming position, Connecticut casinos, May 1997
4.3
5.2
4.8
6.3
4.4
5.6
5.4
6.3
-
1.0
2.0
3.0
4.0
5.0
6.0
7.0
Friday Saturday Sunday Sunday, Memorial DayWeekend, 1997
Source: Buckhurst Fish & Jacquemart Inc.
FoxwoodsMohegan Sun
Based on that study, Pocono Manor would likely generate as many as 18,900 vehicle trips on a busy weekend, equating to 9,450 cars arriving at the property.
Page 77 of 96
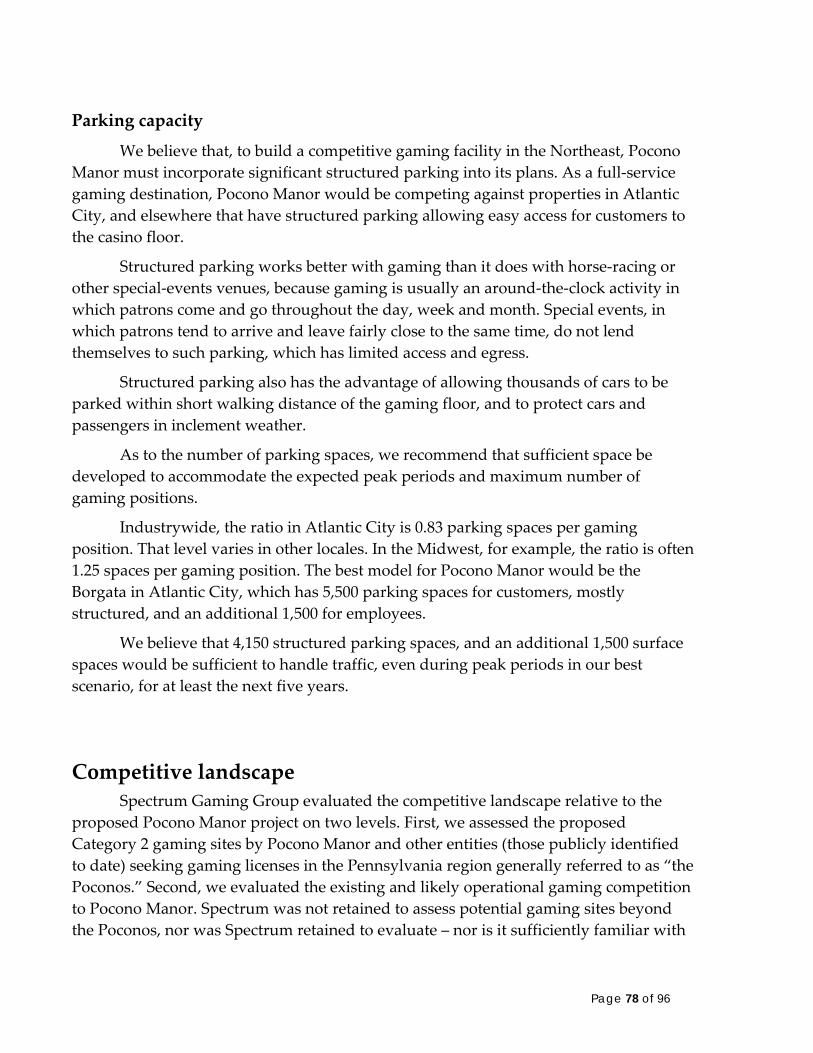
Parking capacity
We believe that, to build a competitive gaming facility in the Northeast, Pocono Manor must incorporate significant structured parking into its plans. As a full‐service gaming destination, Pocono Manor would be competing against properties in Atlantic City, and elsewhere that have structured parking allowing easy access for customers to the casino floor.
Structured parking works better with gaming than it does with horse‐racing or other special‐events venues, because gaming is usually an around‐the‐clock activity in which patrons come and go throughout the day, week and month. Special events, in which patrons tend to arrive and leave fairly close to the same time, do not lend themselves to such parking, which has limited access and egress.
Structured parking also has the advantage of allowing thousands of cars to be parked within short walking distance of the gaming floor, and to protect cars and passengers in inclement weather.
As to the number of parking spaces, we recommend that sufficient space be developed to accommodate the expected peak periods and maximum number of gaming positions.
Industrywide, the ratio in Atlantic City is 0.83 parking spaces per gaming position. That level varies in other locales. In the Midwest, for example, the ratio is often 1.25 spaces per gaming position. The best model for Pocono Manor would be the Borgata in Atlantic City, which has 5,500 parking spaces for customers, mostly structured, and an additional 1,500 for employees.
We believe that 4,150 structured parking spaces, and an additional 1,500 surface spaces would be sufficient to handle traffic, even during peak periods in our best scenario, for at least the next five years.
Competitive landscape Spectrum Gaming Group evaluated the competitive landscape relative to the
proposed Pocono Manor project on two levels. First, we assessed the proposed Category 2 gaming sites by Pocono Manor and other entities (those publicly identified to date) seeking gaming licenses in the Pennsylvania region generally referred to as “the Poconos.” Second, we evaluated the existing and likely operational gaming competition to Pocono Manor. Spectrum was not retained to assess potential gaming sites beyond the Poconos, nor was Spectrum retained to evaluate – nor is it sufficiently familiar with
Page 78 of 96
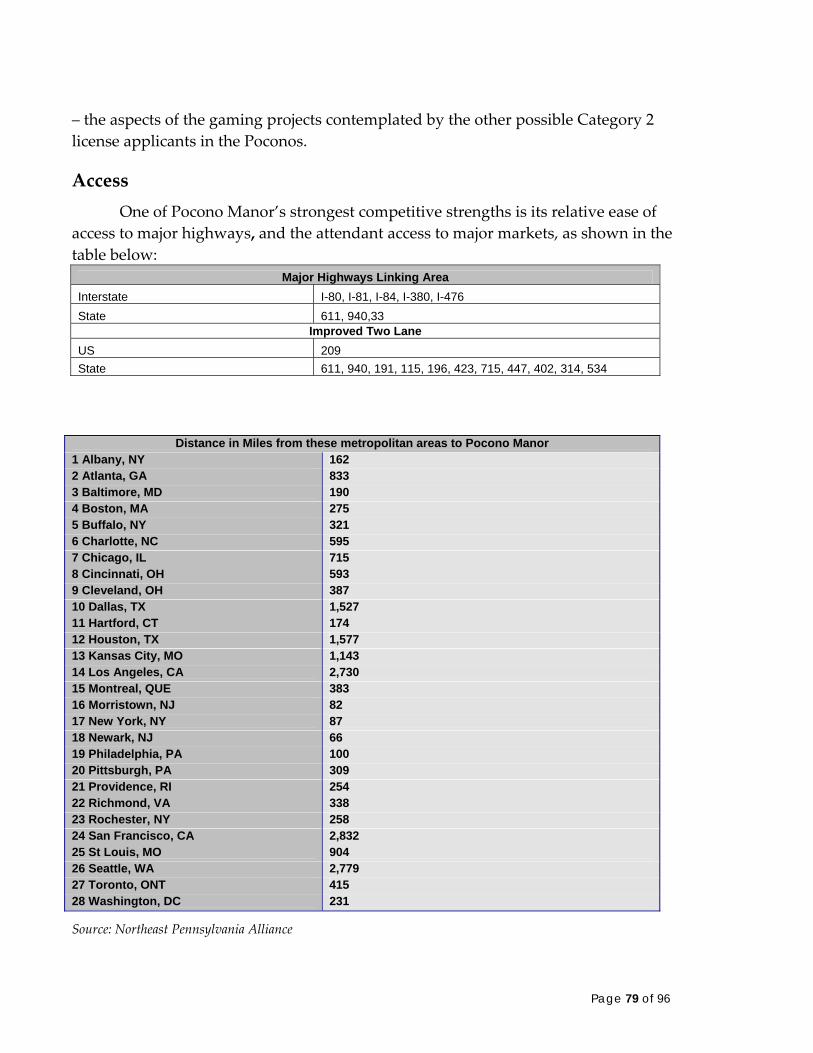
– the aspects of the gaming projects contemplated by the other possible Category 2 license applicants in the Poconos.
Access One of Pocono Manor’s strongest competitive strengths is its relative ease of
access to major highways, and the attendant access to major markets, as shown in the table below:
Major Highways Linking Area Interstate I-80, I-81, I-84, I-380, I-476 State 611, 940,33
Improved Two Lane US 209 State 611, 940, 191, 115, 196, 423, 715, 447, 402, 314, 534
Distance in Miles from these metropolitan areas to Pocono Manor
1 Albany, NY 162 2 Atlanta, GA 833 3 Baltimore, MD 190 4 Boston, MA 275 5 Buffalo, NY 321 6 Charlotte, NC 595 7 Chicago, IL 715 8 Cincinnati, OH 593 9 Cleveland, OH 387 10 Dallas, TX 1,527 11 Hartford, CT 174 12 Houston, TX 1,577 13 Kansas City, MO 1,143 14 Los Angeles, CA 2,730 15 Montreal, QUE 383 16 Morristown, NJ 82 17 New York, NY 87 18 Newark, NJ 66 19 Philadelphia, PA 100 20 Pittsburgh, PA 309 21 Providence, RI 254 22 Richmond, VA 338 23 Rochester, NY 258 24 San Francisco, CA 2,832 25 St Louis, MO 904 26 Seattle, WA 2,779 27 Toronto, ONT 415 28 Washington, DC 231
Source: Northeast Pennsylvania Alliance
Page 79 of 96

We also used estimates from the Pocono Mountains Vacation Bureau to determine driving distances:
Driving Distance to Pocono Manor (in hours)
Albany 4.00 Columbus 8.00 Philadelphia 2.00 Atlantic City 3.00 Dover 3.50 Pittsburgh 6.00
Baltimore 3.00 Erie 6.00 Providence 4.75
Boston 6.00 Harrisburg 2.00 Rochester 4.50
Buffalo 5.50 Hartford 3.00 Syracuse 4.00
Charleston 8.00 Manchester 7.00 Trenton 2.00
Cleveland 7.50 New York City 1.50 Washington 4.00
Source: Northeast Pennsylvania Alliance
Clearly, Pocono Manor is within a reasonable driving distance of some of the strongest demographics within the eastern United States, and that easy access underlies our relatively strong revenue projections.
Air access Air travel will not be a meaningful form of transportation for customers of
Pocono Manor, and we have not factored it into any of our revenue or visitation estimates.
Most regional destinations – including Atlantic City – have learned that charter air travel is generally a high‐expense, low‐margin form of business. Moreover, as gaming proliferates into more and more markets, the gamblers who had traditionally been charter air travelers are finding it easier to stay close to home. As a result, to capture their business, destinations have to offer more rewards, which lowers the margins and makes that segment even less profitable and less desirable.
Here is the five‐year trend in Atlantic City. Note that the totals include both enplaned and deplaned passengers, which means that – in a peak month – about 10,000 gamblers arrive by air in a destination that attracts 33 million visitor trips a year:
Page 80 of 96
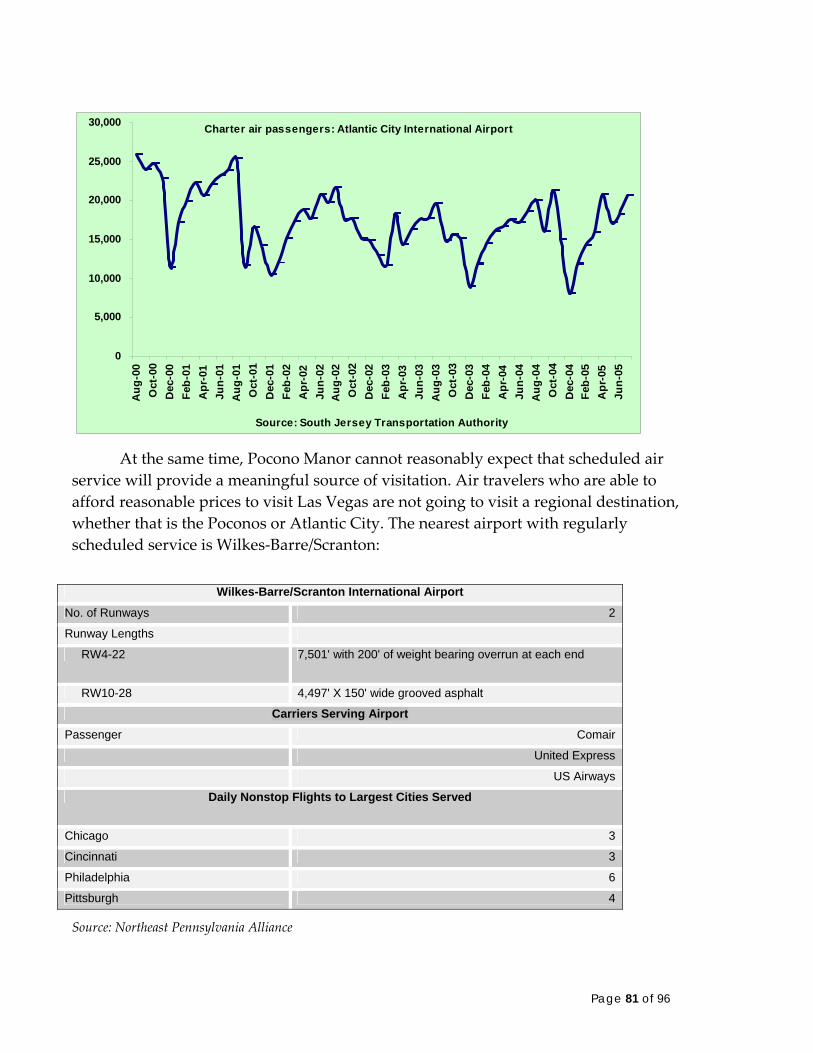
Charter air passengers: Atlantic City International Airport
0
5,000
10,000
15,000
20,000
25,000
30,000A
ug-0
0O
ct-0
0D
ec-0
0Fe
b-01
Apr
-01
Jun-
01A
ug-0
1O
ct-0
1D
ec-0
1Fe
b-02
Apr
-02
Jun-
02A
ug-0
2O
ct-0
2D
ec-0
2Fe
b-03
Apr
-03
Jun-
03A
ug-0
3O
ct-0
3D
ec-0
3Fe
b-04
Apr
-04
Jun-
04A
ug-0
4O
ct-0
4D
ec-0
4Fe
b-05
Apr
-05
Jun-
05
Source: South Jersey Transportation Authority
At the same time, Pocono Manor cannot reasonably expect that scheduled air service will provide a meaningful source of visitation. Air travelers who are able to afford reasonable prices to visit Las Vegas are not going to visit a regional destination, whether that is the Poconos or Atlantic City. The nearest airport with regularly scheduled service is Wilkes‐Barre/Scranton:
Wilkes-Barre/Scranton International Airport
No. of Runways 2
Runway Lengths
RW4-22 7,501' with 200' of weight bearing overrun at each end
RW10-28 4,497' X 150' wide grooved asphalt
Carriers Serving Airport
Passenger Comair
United Express
US Airways
Daily Nonstop Flights to Largest Cities Served
Chicago 3
Cincinnati 3
Philadelphia 6
Pittsburgh 4
Source: Northeast Pennsylvania Alliance
Page 81 of 96
Comparative access: Pocono region This part of the report offers a critical analysis of the relative ease of access
between Pocono Manor and its likely competitors for a potential Category 2 license within the Pocono region.
Competition for license Matzel and Associates is one of three entities that has publicly disclosed its intent
to seek a Category 2 gaming license in the Poconos region of Pennsylvania. The other proposed sites are Mount Airy Lodge in Mount Pocono and Pocono Raceway in Long Pond. Spectrum Gaming Group visited each of the proposed sites and analyzed the critical issue of access and other site features.
The critical issues that we examined are:
The capacity of the relative feeder roadways
The nature of the properties between the nearest highway and the site
Pocono Manor is an operational, full‐service destination resort located principally in Pocono Township, with golf holes and other land also located in Mount Pocono and the Township of Tobyhanna. The property, in our opinion, has the best automobile access of the three proposed Poconos casino sites. The property is accessed via the first northbound exit on Interstate 380, approximately 2.2 miles north of Interstate 80. The proposed site of the casino hotel complex is located approximately 1.4 miles and three minutes from Interstate 380, on land southeast of the intersections of routes 940 and 314. The access roads from Interstate 380 are two‐lane routes 940 and 314 and with little business or other residential traffic. The proposed casino hotel site is one mile west of the existing Pocono Manor hotel and spa.
Matzel and Associates proposes building a bus center that would be the hub for all motor coach service in Monroe County. Such a transportation center would facilitate visitation to Pocono Manor by bus customers, who are an important component to most gaming facilities in the Northeast. We note that Atlantic City casinos received 6.3 million customers by bus for the 12‐month period ending June 2005.
Matzel and Associates further proposes building a rail station that, according to the developer, would be included in proposed rail line from Scranton to Hoboken, N.J. Partial funding for the rail line was included in a $286.5 billion transportation bill approved by Congress in August 2005, but still needs several additional approvals, including a feasibility recommendation by the Federal Transit Administration. The proposed rail line would be developed and operated by NJ Transit.36 Officials familiar
36 The Times‐Tribune, Aug. 8, 2005
Page 82 of 96
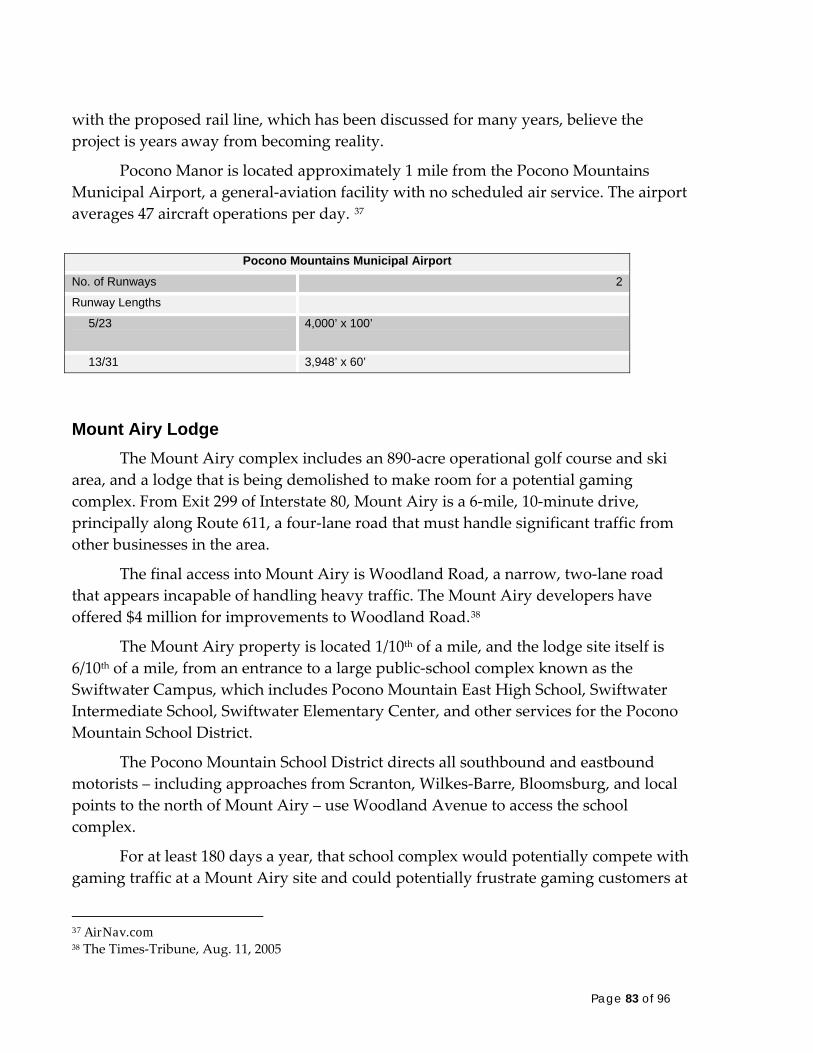
with the proposed rail line, which has been discussed for many years, believe the project is years away from becoming reality.
Pocono Manor is located approximately 1 mile from the Pocono Mountains Municipal Airport, a general‐aviation facility with no scheduled air service. The airport averages 47 aircraft operations per day. 37
Pocono Mountains Municipal Airport
No. of Runways 2
Runway Lengths
5/23 4,000’ x 100’
13/31 3,948’ x 60’
Mount Airy Lodge The Mount Airy complex includes an 890‐acre operational golf course and ski
area, and a lodge that is being demolished to make room for a potential gaming complex. From Exit 299 of Interstate 80, Mount Airy is a 6‐mile, 10‐minute drive, principally along Route 611, a four‐lane road that must handle significant traffic from other businesses in the area.
The final access into Mount Airy is Woodland Road, a narrow, two‐lane road that appears incapable of handling heavy traffic. The Mount Airy developers have offered $4 million for improvements to Woodland Road.38
The Mount Airy property is located 1/10th of a mile, and the lodge site itself is 6/10th of a mile, from an entrance to a large public‐school complex known as the Swiftwater Campus, which includes Pocono Mountain East High School, Swiftwater Intermediate School, Swiftwater Elementary Center, and other services for the Pocono Mountain School District.
The Pocono Mountain School District directs all southbound and eastbound motorists – including approaches from Scranton, Wilkes‐Barre, Bloomsburg, and local points to the north of Mount Airy – use Woodland Avenue to access the school complex.
For at least 180 days a year, that school complex would potentially compete with gaming traffic at a Mount Airy site and could potentially frustrate gaming customers at
37 AirNav.com 38 The Times‐Tribune, Aug. 11, 2005
Page 83 of 96
such times and cause significant traffic problems for the community. When students are required to report to or leave the buildings. We also note that the area also hosts numerous athletic events.
For example, all of the high school’s fall sporting events – with the exception of golf (held at Pocono Manor) and cross‐country – are held at the school’s campus. This academic year, five varsity football games were scheduled for the site on Fridays at 7 p.m.39, which would likely compete against casino traffic.
The Mount Airy developer is contemplating a $300 million investment that includes a 200,000‐square‐foot facility with between 2,400 and 3,000 slot machines, with a possible second phase that includes 500 housing or time‐share units.40
Pocono Raceway Pocono Raceway is an operational automobile racetrack that hosts two top‐level
NASCAR races per year as well as other racing events. The racetrack is located alone in the countryside, 3.7 miles and 5 minutes from Exit 284 of Interstate 80. The principal access road is Route 115, a two‐lane road that passes some residences. Exit 284 is relatively convenient for eastbound I‐80 traffic. For westbound I‐80 traffic, motorists must either :
Drive north on Interstate 380 and begin a contorted 13.8‐mile, 20 minute drive over narrow, bumpy, residential country roads.
Use Exit 299 to begin a 15‐mile, 25‐minute drive on two‐lane country roads Route 715, Sullivan Trail and Long Pond Road.
“Double back” approximately 3.5 miles on Interstate 80 past Pocono Raceway and use Exit 284 as described above.
Those options could potentially deter customers traveling from the densely populated regions to the east, which we would project would be among the most significant feeder markets.
Ease of access is one of the most important features that could determine the success of any gaming destination, particularly since so many potential customers have never been to the region and are unfamiliar with the terrain once they leave the Interstate.
39 Pocono Mountain School District 40 The Times‐Tribune, Aug. 11, 2005
Page 84 of 96
Regional competition At present, 34 gaming facilities – with approximately 90,000 slot‐style gaming
devices – operate in the Northeast (NJ, DE, WV, NY, CT, RI and ME). Northeastern gaming facilities in 2004 generated gross gaming revenue of $9.1 billion, a 9.5 percent increase over 2003. We expect 2005 year‐over‐year growth in the Northeast of between 6 percent and 7 percent. Northeast gaming revenue between 1997 and 2004 grew 58.9 percent. Only one of the six jurisdictions in that time reported a year‐over‐year decline in annual gaming revenue, that being Delaware in 2003 owing to the smoking prohibition enacted in late 2002.
Pocono Manor would face regional competition – including one direct competitor in the Poconos marketplace. The following summarizes the competitive landscape for those properties and markets most relevant to Pocono Manor.
Pennsylvania As noted at the beginning of this report, gaming in Pennsylvania will include up
to 61,000 slot machine at 14 locations and three categories of operator licenses. At present, table games are prohibited at Pennsylvania casinos. We believe the Legislature will give serious consideration to legalizing table games within three years of the commencement of gaming operations. We base this belief on the increasing expansion and resulting competitive and legislative pressures in the Northeast.
The legalization of slot machines in Pennsylvania has caused both the West Virginia and Delaware legislatures to consider allowing table games to be added to the racetrack video lottery terminal operations. The table‐games measure was narrowly defeated last winter in West Virginia and easily defeated in Delaware last spring. Gaming operations in Pennsylvania will result in decreased gaming revenues in both West Virginia and Delaware, prompting legislatures in both states to seek expanded gaming – notably table games – to offset the decreased gaming taxes.
As John Cavacini, president of the West Virginia Racing Association, said: “We need the table games bill to try to offset competition from Pennsylvania and Maryland.”41 The introduction of table games in West Virginia or Delaware, or both, would, in turn, prompt a competitive response from Pennsylvania legislators to legalize table games at the slot‐machine facilities. Additionally, we expect continued efforts in Maryland to legalize slot machines, which if successful would impact Pennsylvania slot revenue, heightening the pressure to add table games.
Elsewhere in Pennsylvania:
41 The State Journal, Feb. 3, 2005
Page 85 of 96
Chester Harrah’s Chester Casino & Racetrack, a joint venture between Harrah’s
Entertainment and three private investors, broke ground on June 6, 2005. The $350 million development will include a 5/8‐mile harness track scheduled to open in June 2006 and a 2,500‐slot casino to open in the fourth quarter of 2006, pending regulatory approvals. Project plans include a 1,500‐seat grandstand, 2,600 parking spaces, a buffet, 300‐seat clubhouse restaurant, lounge, and pub with entertainment venue. No hotel rooms are contemplated at present. Chester is located in the southern suburban Philadelphia.
Philadelphia Park Greenwood Racing, which owns and operates Philadelphia Park in the northern
Philadelphia suburb of Bensalem, plans a new 3,000‐slot facility on its grounds, along with dining facilities in the first phase of development. Greenwood Racing has discussed the expanding the scope of the project through future phases of development. The track is located in demographically attractive Bucks County.
Philadelphia
No sites or developers have yet been selected for the two at‐large casinos designated for the City of Philadelphia. Mayor John Street’s Gaming Advisory Task Force concluded that the city would benefit most by placing slots casinos at the intersection of the Schuylkill Expressway and Route 1, and along North Delaware Avenue on the riverfront. The task force also designated “most preferred” sites the southern riverfront area and East Market Street. The group said there should be no casinos at Penn’s Landing or Eighth and Market streets.
It is impossible to project the scope of a potential projects at this time, but we expect each slot facility to ultimately include the maximum 5,000 slot machines. Several parties have publicly expressed interest in develop a gaming facility in Philadelphia, but as of this date only two have publicly announced intentions to apply for a gaming license:
1.Trump Entertainment Resorts has entered into a five‐year option to lease the 18‐acre site at Interstate 76 and Route 1 commonly known as the Budd Co. site in the Hunting Park Industrial Area. The Trump Philadelphia project would be in partnership with local entrepreneur and celebrity Pat Croce and other investors.
2. Pennsylvania Partnership Group plans to partner with Planet Hollywood for a $380 million project called Riverwalk Casino on a the city‐owned 11‐acre tract known as the “old incinerator site” at Delaware Avenue and Spring Garden Street, just north of the Ben Franklin Bridge. The project would include a 400‐seat
Page 86 of 96
entertainment venue, three upscale restaurants, a food court, a coffee shop and 3,000 parking spaces. Partners include Planet Hollywood International, Bay Harbour Management, and numerous individuals including attorney Bernard Smalley; former City Solicitor Ken Trujillo; attorney Tom Leonard, chairman of Ed Rendellʹs campaign for mayor; Joe Ashdale, Philadelphia Parking Authority chairman; Willie Johnson, chairman of PRWT Services Inc.; Renee Amoore, a Republican active in President Bushʹs campaign; Herman Wooden, president of United Food and Commercial Workers Local 1776; Bill Miller, of Ross Associates; Bill Anderson, talk‐show host on WURD; Walter Lomax Sr., health‐care executive, and two of his sons; Hiram Hicks, music‐industry executive; Mary Lawton, an accounting‐ firm owner; and Sunah Park, former president of the Asian American Bar Association of the Delaware Valley.
It should be noted that Caesars Entertainment, which controls an attractive
riverfront site, is prohibited by a non‐compete condition with its Chester partners from developing a casino in Philadelphia. Another early Philadelphia hopeful, Ameristar Casinos, on Nov. 3, 2005 – citing an unacceptable return on investment due to the state’s high gaming‐tax – would not pursue a license for a 27‐acre site it controlled in the city’s Fishtown section.
Harrisburg area Penn National Gaming owns and operates Penn National Race Course in
Grantville, about 15 miles northeast of Harrisburg and about 100 miles west of Philadelphia. Penn National plans to begin construction of a $240 million gaming facility called Hollywood Casino after receiving a gaming license, with a goal of opening the gaming facility in early 2007.
Lehigh Valley We believe it is highly likely that one of the two at‐large gaming facilities will be
located in the Allentown‐Bethlehem area, commonly known as the Lehigh Valley. Several parties have expressed interest in developing a gaming facility in this area, but only two as of this date have publicly announced their intentions to apply for a gaming license:
1. Las Vegas Sands Corp., which owns and operates The Venetian in Las Vegas, is the majority partner in BethWorks Now, which proposes an $879 million gaming, hotel, retail, dining and museum complex on 135 acres of the former Bethlehem Steel site. The project would include up to 1,000 hotel rooms, 1,200
Page 87 of 96
housing units, an arena, and 800,000 square feet of retail. Newmark & Company Real Estate Inc. and Phillipsburg attorney Michael Perrucci are also partners in the project.
2. Aztar Corp. plans to develop proposing to build a resort in Allentown on land owned by semiconductor maker Agere Systems. The $325 million project would include a 250‐room hotel; 100,000 square feet of casino space, with 3,000 slot machines; 10 to 13 restaurants and lounges; a 5,000‐square‐foot showroom; up to 15,000 square feet of conference center space; and 3,400 parking spaces.
In addition, the Oklahoma‐based Delaware Nation is suing to reclaim 315 acres of ancestral land in Forks Township, Northampton County. A federal judge rejected the tribe’s claim in December 2004, but the tribe has appealed to the 3rd Circuit Court of Appeals in Philadelphia. Should the Delaware Tribe succeed, it would seek to swap the Forks Township land for land elsewhere in the state for the purpose of developing a casino. Legislation has been introduced in Congress that would prohibit or restrict off‐reservation casinos. We believe there is a considerable anti‐off‐reservation sentiment in Congress.
Mohegan Sun at Pocono Downs The Mohegan Tribal Gaming Authority, which owns and operates the highly
successful Mohegan Sun casino resort in Uncasville, Conn., in January closed a $280 million sale with Penn National Gaming to acquire Pocono Downs in Wilkes‐Barre and its 400 acres, plus five off‐track wagering facilities. The property has since been renamed Mohegan Sun at Pocono Downs. The MGTA plans to spend between $140 million and $160 million to develop gaming facility with 2,000 slot machines, three full‐service restaurants, a 300‐seat buffet, 15,000‐square‐foot food court, several bars and lounges an, 18,000‐square‐foot nightclub, a Kids Quest hourly child care center, 20,000 square feet of retail space, and a new parking facility. The facility is expected to open 14 months after license approval. In the meantime, the Authority plans to spend $47 million on an interim gaming facility in the track’s existing grandstand. The interim project will include 1,000 slot machines and a 10,000‐square‐foot food court. The company hopes to commence temporary slot operations in March 2006.
Gettysburg Chances Enterprises, headed by local businessman David LeVan, is proposing
the $200 million Gettysburg Gaming Resort and Spa on a 42‐acre tract at the intersection of routes 15 and 30 in Straban Township, just outside the city limits of Gettysburg. The project would include 2,500 slot machines and a 200‐room hotel. We believe such a
Page 88 of 96
project faces an uphill battle due to the historic sensitivities involved with its proximity to Gettysburg National Military Park.
Pittsburgh Act 71 designates one of the state’s five stand‐alone slots casinos for Pittsburgh.
Several developers have expressed interest in competing for this license. Among them are:
• The Penguins hockey team, which wants money to build a new arena in the Lower Hill District.
• Forest City Enterprises, which has partnered with Harrahʹs Entertainment Inc. of Las Vegas on a proposal to build a casino at Station Square.
• John E. Connelly, the Gateway Clipper Fleet tycoon, who owns North Shore property near the Carnegie Science Center.
• Beaver County developer C.J. Betters, who wants to build a horse racing track in Hays.
• MTR Gaming Group, which has expressed interest in a North Shore site near the 16th Street Bridge.
• Thamer Colins has proposed a $104 million gaming facility on vacant land between the Waterfront shopping Center and the Sandcastle Waterpark in West Homestead.
About 25 minutes southwest of Pittsburgh, in Meadow Lands, Magna Entertainment
owns and operates The Meadows harness racing track. Magna in November 2005 announced the sale of the track to a group headed by PA Meadows LLC, a company jointly owned by William Paulos and William Wortman, controlling shareholders of Millennium Gaming Inc., and a fund managed by Oaktree Capital Management. PA Meadows intends to apply for a Category 1 gaming license; Magna would continue to operate the racing facility under a management agreement for a minimum of five years.
Erie area MTR Gaming Group has decided to build Presque Isle Downs, a $170 million
thoroughbred racetrack and slots on 272 acres in Summit Township. The company plans to open a temporary facility beforehand with 1,800 slot machines. The permanent facility will include 2,000 slot machines and 1,200 parking spaces. MTR Gaming plans construction immediately after receiving its gaming license.
Page 89 of 96

New Jersey Casino gambling in New Jersey is limited by the state Constitution to Atlantic
City. Some legislators, and Acting Gov. Richard Codey, believe that allowing video lottery terminals would be permissible under the Constitution because they are lottery games, not casino games. The Senate Wagering, Tourism and Historic Preservation Committee in June 2005 authorized up to 5,000 VLTs at Meadowlands Racetrack. The bill went no further.
We believe that Gov.‐Elect Jon Corzine is less inclined to support VLTs outside of Atlantic City, but the expected introduction of 10,000 VLTs at two locations in metropolitan New York City in 2006 will increase the pressure on the New Jersey Legislature to protect its horse‐racing industry by offering a similar product. The Legislature will further be under pressure to find revenue sources for as long as the state faces a budget deficit.
Several Atlantic City properties have recently completed, begun or are planning major expansions:
• Borgata Broke ground in December 2004 on a $200 million expansion that includes 600 slots, 36 tables, 51 poker tables, 51 racebook positions, several shops, 3 gourmet restaurants, a food court, 2 nightclubs, and spa rooms. The project is expected to open in the second quarter 2006. In addition, Borgata in the first quarter 2006 is expected to commence a $325 million, Phase II expansion that includes 800 hotel rooms, spa facilities, indoor and outdoor swimming pools, meeting space, and retail space. The project is expected to open in the fourth quarter of 2007.
• Harrahʹs plans a $550 million expansion that includes a 965‐room hotel tower, featuring 13 super‐suites and 183 suite; a 172,000‐square‐foot retail and entertainment complex, including a Red Door spa with 22 treatment rooms, an ultra‐lounge nightclub, an indoor pool and entertainment complex, a new Diamond Lounge, new retail stores, a 650‐seat buffet and a 500‐seat coffee shop. Harrahʹs Atlantic Cityʹs existing buffet will be converted into additional gaming space, adding 400 slot machines and 20 table games. The entertainment and retail center is expected to open by the end of 2006, while the new hotel tower is slated for completion in the second quarter of 2008.
• Caesars: Gordon Group Holdings is developing, and will manage, The Pier at Caesars, a $175M retail, dining and entertainment complex expected to open in early 2006. The pier will have 320,000 square feet of leaseable space, including nearly 100 shops, 9 restaurants with tenants such as Gucci, Hugo Boss, Louis Vuitton, A/X Armani, Bebe, Burberry, Tourneau, Bambino, Steve Madden, Caché, Cosbar, Marshall Rousso, Vilebrequin, Phillips Seafood of Baltimore, and
Page 90 of 96
Stephen Starr’s Buddakan and Continental. The pier will be attached to Caesars by Boardwalk bridge and includes a new Boardwalk façade.
• Resorts: Resorts opened a $125 million hotel expansion in July 2004, with 399 guest rooms, 14,000 square feet of additional gaming space with 800 slots and 10 table games. Nikki Beach of Miami opened a beach club in May (seasonal only). Gallagher’s Steakhouse opened in late 2005. Development of an adjacent 10‐acre parcel is on hold.
• Showboat: House of Blues in July 2005 opened a $65 million, multifaceted internal expansion at Showboat that includes a 2,200‐seat, multilevel concert venue, House of Blues‐branded gaming floor, 25‐table House of Blues‐branded poker room, House of Blues restaurant, House of Blues night club, House of Blues beach bar, private Foundation Room club, House of Blues retail store, and a new, inviting Boardwalk façade.
• Tropicana in November 2004 opened a $280M expansion known as The Quarter, which includes 200,000 square feet of leaseable retail, dining and entertainment space, 40 shops and 9 restaurants, as well as 502 hotel rooms, 2,400 parking spaces and 45,000 square feet of meeting space.
• Trump Taj Mahal plans to start construction of a hotel tower in June 2006; details are yet to be announced.
New York New York has four Indian casinos, two of which are located in western New York, and five racinos. Gaming development in the state has been stunted by an initially high tax rate of 79.8 percent on video gaming machine revenue at racinos and ongoing political, legal, and land‐claim wrangling concerning tribal casinos.
New York metro • MGM Mirage on June 16, 2005, announced plans to proceed with a $170 million
renovation of Aqueduct Race Track in Queens that would include 4,500 video gaming machines. The gaming facility is expected to open in mid‐2006. MGM Mirage would manage the development and gaming operations for the New York Racing Association.
• Yonkers Raceway closed on June 26, 2005, to begin a $185 million expansion and renovation with 5,500 video gaming machines in a dedicated gaming facility. It expects to resume racing in November and commence gaming operations in summer 2006.
Page 91 of 96

Catskills There is currently one gaming facility in the Catskills Mountain region – Mighty
M Gaming at Monticello Raceway. Mighty M, owned and operated by Empire Resorts, operates 1,718 video gaming machines. A recent rollback in the effective tax rate, to as low as 60 percent (excluding 8 percent that must be used for marketing expenses) from 79.8 percent – will allow for more effective marketing and greater capital investment. Empire is discussing a venture to develop an Indian casino with the St. Regis Mohawk tribe; it would be located on Empire land next to Monticello Raceway.
Gov. George Pataki has vacillated on the number of Indian casinos that should be allowed in the Catskills. The October 2001 legislation called for three, but this year he proposed five and most recently has proposed allowing only one. Any such tribal gaming project subject to numerous approvals and we cannot yet project a development timeline.
Long Island The Shinnecock Indians are attempting to develop a $20 million casino in
Southampton. As leverage, the tribe has filed suit to claim 3,600 acres of ancestral land in the Hamptons. This claim, presumably, would be dropped if the tribe were allowed to develop a casino Detroit investor Michael Illitch is financing the tribe’s effort. The tribe in 2003 broke ground on a casino but was ordered to cease by a judge. The Shinnecocks have yet to receive federal recognition as a tribe, but a federal judge in November 2005 described the Shinnecocks as a bona fide tribe. The implications of the judge’s ruling, called “unprecedented” by one expert, are unclear, but it is seen as giving the tribe a boost in their effort to reclaim land and build a casino.
Southern Tier Tioga Downs Racetrack and Casino broke ground in July 2005 on the former
Tioga Downs racetrack site in Nichols. The $22 million project will include 750 video gaming machines with a planned opening in April 2006. Future plans could include a hotel. Tioga Downs is located off of Route 17 between Binghamton and Elmira, approximately three miles from the Pennsylvania border.
Page 92 of 96

Delaware The Video Lottery Competitiveness Act of 2005, would have created three new
gaming districts in and around Wilmington: • A floating casino on the Delaware River near Penns Grove, N.J. • The proposed $400 million Diamond Casino Resort on 50 acres on the Seventh
Street Peninsula in downtown Wilmington. The project would include 400 video lottery terminals, 400 hotel rooms, and retail, dining and entertainment outlets.
• The proposed $200 million Riverfest Slots on the Christina River at South Walnut and A streets. The project, on five acres, would include a 240‐room hotel.
The bill would have given the Director of the Delaware Lottery the authority to license one, two or all three locations. This bill did not advance out of committee, but we expect continued pressure to expand the number of gaming facilities in Delaware.
Delaware Park Located in the southwestern Wilmington suburb of Stanton, Delaware Park is a
10‐year old racino with 2,500 video lottery terminals. The privately owned property has made minimal capital investment but remains highly successful owning to its proximity to the Wilmington, Philadelphia, and southeastern Pennsylvania markets. The property in 2005 opened White Clay Creek Golf Course, a championship layout on the premises. Delaware Park currently attracts 43 percent of its patrons from Pennsylvania, 27 percent from Maryland, 24 percent from Maryland, and 6 percent from New Jersey.
Dover Downs Dover Downs Entertainment operates Dover Downs Slots, a 2,500‐slot racino
with a 232‐room luxury hotel and conference facilities. The company in October 2005 filed for permits to add up to 268 additional hotel rooms. Dover Downs attracts 44 percent of its patrons from Maryland and 35 percent from Delaware.
Harrington Raceway Midway Slots at Harrington Raceway is a 1,581‐slot racino with limited
amenities. It attracts 45 percent of its patrons from Maryland and 36 percent from Delaware.
Page 93 of 96
Connecticut
The Mashantucket Pequot Tribal Nation and the Mohegan Tribe of Connecticut own and operate, respectively, the Foxwoods and Mohegan Sun tribal casinos about 10 miles apart in southeastern Connecticut. The properties together generated an estimated $2.4 billion in 2004 gaming revenue.
• Foxwoods Resort Casino features 350,000 square feet of gaming space, 1,416 hotel rooms, 55,000 square feet of meeting space, multiple entertainment venues, a spa, vast retail offerings, a championship golf course and other resort offerings. Foxwoods recently began a $700 million expansion that will include a 4,000‐seat event center, 825 hotel rooms, a 25,000‐square‐foot spa and other amenities.
• Mohegan Sun has nearly 300,000 square feet of gaming space, 1,200 hotel rooms, a 20,000‐square‐foot spa, 130,000 square feet of themed retail, 30 food and beverage outlets, a 10,000‐seat arena, 350‐ and 300‐seat entertainment venues, and other resort features. The properties are located approximately 10 miles apart.
Maine Penn National Gaming opened Hollywood Slots, a temporary gaming facility in
a former restaurant, on Nov. 4, 2005, in Bangor. The property has 475 slots. Penn is developing a $71 million permanent racino across the street from Bass Park in Bangor. The property will house the maximum 1,500 slots and is scheduled to open in 2007.
Rhode Island The Rhode Island Lottery oversees video lottery terminal operations at two
privately owned facilities. Lincoln Park, a greyhound racetrack located about 4 miles north of Interstate 95 in suburban Providence and Newport Grand in Newport, has 3,002 VLTs and a daily win per unit of $324 for the last 12 months ending September 2005, one of the highest figures in the Northeast. Newport Grand, a former jai alai fronton located in Newport, has 1,070 VLTs and a daily win per unit of $207.
Maryland Slot‐machine legislation has died in the Maryland General Assembly in each of
the last three years, despite strong support from Gov. Robert Ehrlich and Senate President Thomas V. Mike Miller Jr. The governor’s plan put forth in April 2005 would have allowed 15,500 slots at seven locations, including racetracks and stand‐alone locations. The effort was defeated when the House and Senate could not resolve
Page 94 of 96

differences between their bills. We believe it is only a question of “when,” not “if,” Maryland legalizes slot machines. As President Miller told the Maryland Chamber of Commerce in October 2005, “It’s going to happen. It has to happen,” and Gov. Ehrlich at the same function that will “more than likely” again seek to legalize slot machines.”42
Conclusion The location of a category 2 gaming facility in Eastern Pennsylvania creates two
unassailable points regarding its potential as a gaming destination:
It is surrounded on all compass points by potential customers.
It is surrounded on all compass points by present and potential competitors.
Pocono Manor can harness the potential benefit of the first point, and minimize the potential damage from the second by focusing on its essential strategy: Making the necessary capital investment to create a regional destination resort.
As a resort that offers gaming, Pocono Manor would be able to attract a wide variety of customers seeking multiple offerings. It would eschew the convenience‐driven gaming market, which by definition is both the most vulnerable to competition, and is relatively low‐margin.
At the same time, gaming would help make the other attractions more competitive. Rooms, meals, show tickets and other amenities can be priced at more attractive rates, since management can be relatively certain that much of the attendant business will also generate incremental gaming revenue.
Similarly, by offering gaming, management would find it easier to attract conventions and other forms of business because it would have this important attraction –‐ gaming – within its menu of offerings.
Developing a destination, rather than target the convenience market, requires access to significantly greater amounts of affordable capital, and it requires the assurance of ongoing free cash flow to maintain, improve and continually broaden the array of attractions.
The tax rate in Pennsylvania makes it more of a challenge to gain such access, particularly relative to low‐tax competitors, such as the properties in Atlantic City. However, our analysis indicates that the commitment to make a significant capital investment places Pocono Manor in the strongest position to overcome that challenge
42 The Daily Record, Nov. 4, 2005.
Page 95 of 96
and achieve success for its owners, as well as for the region and the rest of Pennsylvania.
In the case of Pocono Manor, the decision is actually not a decision at all. Pocono Manor can only be developed as a destination. As such, it can be competitive, profitable and self‐sustaining.
As a destination, Pocono Manor would also best serve various public‐policy goals, such as maximizing employment, generating a reliable stream of tax revenue and helping to promote and support the Pocono Mountain region’s entire tourism industry.
Page 96 of 96