trld - econorthwest - economic feasibility - 4.2.21
TRANSCRIPT

{01104546;1}ECONorthwest | Portland | Seattle | Los Angeles | Eugene | Boise | econw.com 1
DATE: April 2nd, 2021 TO: Seth Henderson, Summit Development Group FROM: Chris Blakney, James Kim and Erik Bagwell, ECONorthwest SUBJECT: ROSSMAN LAND DEVELOPMENT ASSESSMENT
Executive Summary The Rossman Landfill site, a former landfill that the State Department of Environmental Quality (DEQ) classifies as a brownfield, has been undeveloped since the 1970s when the landfill closed. Contaminates such as methane gas and leachate, a liquid pollutant, have been identified as potential risks to the community that emit from the landfill site. Summit Development Group (SDG) has put together a proposal and designed a mixed-use General Development Plan that includes a mitigation and clean-up plan for the site as approved by the DEQ. Development atop a former landfill however comes with high mitigation and infrastructure costs that are absent in typical, greenfield development projects. To make commercial and residential development financially viable on this site, public investment is required. This report provides an analysis of several factors and aspects of the proposed development that are important considerations for the Oregon City Urban Renewal Board, City officials and community members. These include:
• Mitigation and infrastructure measures needed and proposed to make the site safe for development;
• Market assessment of Oregon City and the project’s market area; • Financial feasibility assessment of the proposed development program; and • Public benefits (i.e. jobs and tax revenues estimates).
Our research and analysis for proposed SDG development project resulted in the following findings:
• Infrastructure and mitigation work. Several measures are in place that are consistent with other local development projects constructed atop former landfills. These needed measures are to ensure that the high concentration of contaminates found on the site are mitigated and that ground is stabilized to accommodate development. The development and operations budget of the proposed SDG program includes engineering and structural support work, off-gas mitigation and monitoring, and ground water contamination prevention.
• Population and economic growth. Over the last 10 years Oregon City was the 11th fastest growing city in Oregon by population, growing 14.5 percent since 2010.1 Such growth has led to increased demand for housing and retail services. The population is projected to grow an additional 5.5 percent over the next five years, adding approximately 15,000 new residents to the area (5,000 new households).2 Median household incomes are also
1 U.S. Census Bureau, Quick Facts: Oregon City, Oregon 2 ESRI Retail Market Potential Report

ECONorthwest 2
projected to rise grow 7.6 percent by 2025. The proposed SDG development is well positioned to meet the growing demand for housing and retail services.
• Financial analysis. The SDG development project with only private financing is not financially viable in today’s market conditions, or the cost to realize is less than the value of the assets at completion. The infrastructure and mitigation costs are substantial, and the current relationship between rents and development costs are such that there is insufficient capital remaining for a developer to cover the full cost of infrastructure improvements required for mitigating the former landfill. To ensure feasibility, the project requires public investment to support the necessary infrastructure and mitigation measures.
• Market implications for development. Fluctuations in the market have a profound impact on development feasibility. While the current market conditions might be favorable and the outlook may appear positive, any upward movement on capitalization rates (i.e. the financial rate of return on the project) could add additional project risk. The residual land values of the development program are negative at the today’s most favorable capitalization rates. Therefore, without public investment, this project’s feasibility depends on market conditions substantially improving.
• Benefits of public investment in brownfield redevelopment. The public benefits of brownfield redevelopment have been broadly studied. These benefits extend from public health and safety, climate impacts and economic development, to property tax revenue growth and tax base expansion. These are just some of the benefits of redeveloping brownfield sites:
• Land utilization. Land is a finite resource that is increasingly scarce. By definition brownfields are sites that are blighted and not maximizing their potential productive use. Brownfield redevelopment returns underutilized land to a higher and better use.
• Property Value and Tax Base Increase. Brownfields do not maximize on-site tax benefit potential and in many cases have a depressing effect on neighboring property values. Brownfield redevelopment reverses this effect.
• Leverage of Public Investment. In addition to private investment proposed for this site, public subsidy in brownfield redevelopment has been shown to leverage considerable other public investment. A 2015 study by the US Environmental Protection Agency found that every federal public dollar spent in brownfield subsidy leveraged $20.13 in additional public investment from state and local sources3.
• Land Efficiency and Vehicle Miles. Due to historical development trends, many brownfields have greater location efficiency, such as the Rossman Landfill site, meaning they have better access to existing markets and infrastructure relative to
3 U.S. Environmental Protection Agency. Overview of EPA’s Brownfield Program. 2020. Retrieved February 26, 2021. https://www.epa.gov/brownfields/overview-epas-brownfields-program

ECONorthwest 3
greenfield sites. The EPA has found that brownfield redevelopment results in a 25 to 33 percent decrease in residential vehicle miles traveled (VMT) compared to greenfield development4.
• Economic impacts. Construction and operations of the proposed SDG development will support a variety of jobs and employment opportunities. We estimate that construction of the project could support approximately 3,061 direct, indirect and induced jobs over the construction period. Once operational, we estimate that businesses occupying space in and around the new development could support approximately 988 direct, indirect and induced jobs. It is likely that some portion of these workers will reside or already reside in Oregon City, which will contribute to the local economy and tax base.
• Property tax revenues. The Rossman Landfill site currently contributes $0 in property tax revenues to the community but may produce undesired costs through air, soil and ground water contamination. Public investment to clean up the site will mitigate these risks while at the same time supply an additional stream of annual tax revenues. We estimate that the SDG project alone, not considering any increase in value and associated property taxes to additional parcels nearby, will provide $3.3 million in annual property tax revenues to the community that otherwise would not exist without public investment.
• Attracting other investment. This development project has the potential to be a catalyst for other investment in Oregon City. While the specific details stemming from investment, development and their tax revenues cannot be quantified at this time, public investments in housing and quality of life have been shown to pay dividends over time to communities as they become more attractive places to live, work and play.
Rehabilitating a Former Landfill The proposed site for the mixed-use downtown community is atop a former landfill. The Rossman Landfill collected about 60 percent of non-hazardous municipal waste in the Portland-Metro region from the 1960s to the 1980s. In 1976, Oregon DEQ detected contamination of shallow groundwater as well as odor and gas problems. Waste collection subsequently terminated in 1983.
Developing on landfills requires mitigation
Landfill gas (LFG) is a natural byproduct of decomposing organic material. It is predominantly composed of carbon dioxide and methane which are difficult to detect because they are
4 U.S. Environmental Protection Agency. Environmental Benefits of Brownfield Redevelopment—A Nationwide Assessment. May 2020.

ECONorthwest 4
colorless and odorless. LFG emissions continue after 20 years in small quantities and may remain for over 50 years.5
Off gassing of LFG can result in health and environmental challenges:
§ Human exposure to high concentrations of LFG can lead to asphyxiation hazards. This is most likely in enclosed spaces.
§ As methane is combustible, accumulation of LFG can lead to explosion and fire hazards.
§ The land can sink or settle as the waste decomposes. The observed effects may not be uniform across a site.
§ Waste decomposition can also produce leachate, a liquid that can contaminate the groundwater. Leachate releases were first identified on the site in 19766.
Proper Engineering and Management will Reduce Health and Safety Risks
Modern landfills are well-engineered and managed with monitoring systems to limit groundwater contamination and buildup of LFG. Stringent requirements for landfill development and monitoring are established under the Resource Conservation and Recovery Act of 1976 (RCRA), regulated by the U.S. Environmental Protection Agency (EPA), and codified under 40 CFR Part 258. In Oregon, the Department of Environmental Quality (DEQ) regulates landfills. DEQ has published Solid Waste Landfill Guidance to specify fundamental design criteria and requirements for environmental monitoring and mitigation.
Mitigation measures for developing on landfills include the construction or installation of the following.
§ A permeable layer of gravel around the landfill to provide a pathway for LFG to escape.
§ A protective membrane beneath buildings to keep the gas from entering.
§ Gas pipes beneath buildings as well as wells to extract collected LFG.
§ Active control and alarm systems with 24/7 auto-dial-phone capabilities on sites with a high risk of off-site gas migration.
§ Concrete piles through and below the waste to provide structural support for buildings.
§ Structural concrete slab above the waste to create a base surface for the building.
§ Leachate treatment and removal system, including a leak detection system, watertight holding tanks, and liners.
5 The Centers for Disease Control and Prevention, Agency for Toxic Substances and Disease Registry. “Landfill Gas Primer – An Overview for Environmental Health Professionals.” Accessed August 20, 2020. https://www.atsdr.cdc.gov/HAC/landfill/html/ch2.html. 6 Oregon Department of Environmental Quality. Accessed February 26, 2021. https://www.deq.state.or.us/lq/ECSI/ecsidetail.asp?seqnbr=674

ECONorthwest 5
The development team is pursuing several mitigations measures
SDG engaged GeoDesign to conduct a geological survey of the Rossman Landfill site. GeoDesign recommended several mitigation measures required for site development.7 Key results include the following:
Structural Support - Landfill trash and uncompacted landfill cap are not able to structurally support the buildings.
• Recompact 12 inches of subgrade/topsoil and support buildings with deep foundations (i.e. piles).
• Provide structural fill 1-inch or smaller free of organic materials to improve the subgrade.
• Install corrosion resistant steel pipe piles or driven grout piles ranging from 12 to 18 inches in diameter. Piles to extend through debris layer to natural soil, typically ranging in the 50’ to 75’ length or depth.
• Extend slab supported by the piles 10 feet beyond the exterior of buildings to prevent landfill settlement from obstructing ADA building access.
• Periodically re-grade paved surfaces.
• Provide 10 feet of surcharge for a six-week minimum duration for any area with artificial or subgrade garbage (95% of the site) to create compaction and limit future settlement.
Gas mitigation and monitoring - As the landfill trash decomposes over time, methane will generate and needs to be mitigated. Typical methane gas mitigation measures include the following.
• Installation of impermeable barriers to prevent gas migration;
• Active or passive gas ventilation systems;
• Gas detection systems; and
• Routine monitoring.
Ground water contamination prevention - The soil at the site is not suitable for stormwater infiltration. The silt and clay cap fill material have a low permeability.
• The finished ground surface should be sloped away from foundations at a minimum of 2 percent gradient for a distance of at least 5 feet to collect surface water runoff at suitable discharge points.
• Roof downspouts should discharge to a solid pipe that carries the collected water to a stormwater collection system.
7 GeoDesign, Inc. Preliminary Report of Geotechnical Engineering Services: Proposed Rivers Edge Development. Project SDG-4-01. March 2, 2020.

ECONorthwest 6
Developing on landfills is safe and is a public benefit
With the proper mitigation and monitoring measures in place, developing on former landfills is safe. In fact, there are many successful examples across Oregon and throughout the U.S. (See appendix for case studies in Oregon and California). Case studies show that developing on former landfills is an opportunity to turn unproductive, often contaminated land into environmentally improved, productive uses that benefit local communities in a variety of ways.
Developing on landfills comes with additional costs that may not be supported by the market
Clearly from the analysis above, returning a landfill site to a productive use that delivers public benefit is a costly endeavor. The per-square-foot hard and soft costs, time costs (mainly related to surcharging), and on-going operational costs of mitigation and monitoring can lead to low or even negative residual land values and make development financially infeasible. This is the main reason why brownfield sites remain vacant for years, if not decades. Brownfield redevelopment is commonly accompanied by some form of public assistance to offset a portion of additional remedial costs.
Oregon City’s economy is transitioning Located just 13 miles south of Portland at the confluence of the Willamette and Clackamas Rivers, historically Oregon City’s economy was dominated by the forestry industry. Today it has become an attractive suburb in the Portland-Metro region with light-industrial and manufacturing clusters and a growing tourism sector. Increased economic opportunity in the region has also increased housing and retail demand due to population growth. Over the last 10 years Oregon City was the 11th fastest growing city in the state by population, growing 14.5 percent since 2010.8
The proposed development is in a strong and growing market area
Access to I-205 offers the site strong local and regional accessibility. Proximity to a growing Oregon City downtown and with the Clackamas Community College campus less than 10-minute drive away, positions the development to take advantage of much of the city’s and the region’s projected economic and population growth in the coming years. Consequently, we expect the majority of residential and commercial demand to originate from within a fifteen-minute drive-time. The destination uses proposed on the site are likely to have much broader regional draw. These uses will typically draw from a thirty-minute drive-time or beyond. As such we define the Primary Market Area (PMA) as within a 30-minute drive time of the site.
8 U.S. Census Bureau, Quick Facts: Oregon City, Oregon

ECONorthwest 7
Exhibit 1. Drive Times from Site. PMA is within a 30-minute drive time.
Growth is projected to continue
ESRI and U.S. Census Bureau data projects that population, demographic, and economic growth will continue for the next five years. The following summarizes the prospective demographic and economic conditions in the PMA:
• Population is expected to grow 5.5 percent over the next five years, adding approximately 15,000 new residents to the area.9 This translates to roughly 5,000 new households.
• Median household income is $78,000 and is expected to grow 7.6 percent by 2025. Incomes are currently on par with the regional metropolitan average.
• Median age is 40 years which is in-line with the state of Oregon (39.7) and modestly higher than Oregon City (37.9).
• 39 percent of the households in the PMA consist of three or more people; 35 percent are two person households, and 25 percent are single person households. This indicates that three-quarters of the market area consists of families with children and two person households who are starting to form families.
9 ESRI Retail Market Potential Report

ECONorthwest 8
Market Rate Rental Residential
Economic growth necessitates more housing development and variety
The 15,000 projected new residents (approximately 5,000 households) to the PMA will need housing over the next five years. Failure to develop adequate supply will put upward pressure on rents and home prices or will drive residents to other areas potentially outside of Oregon City or Clackamas County. Currently, the housing supply in the region is dominated by single family homes, accounting for nearly three quarters of all units. Since 2010, over 85 percent of residential growth in Clackamas County has been the result of net-migration10.
The majority of housing in the Primary Market Area is single-family detached. All three comparable geographies have similar housing mixes. The Primary Market Area has about 24 percent of housing that is duplex, triplex, quadplex, and multifamily.
Exhibit 18. Housing Mix, Primary Market Area, Oregon City, and Clackamas County, 2014-2018
Source: US Census Bureau, 2014-18 ACS Table B25024
However, there is growing housing demand from one and two person households who are less likely to invest in single-family homes and often prefer to rent. Nearly one in three households rent in the PMA.
10 Portland State University Population Research Center
73%
72%
75%
4%
7%
4%
7%
7%
4%
17%
14%
16%
0% 20% 40% 60% 80% 100%
PrimaryMarket Area
Oregon City
ClackamasCounty
Single-Family Detached Single-Family AttachedDuplex, Triplex, Quadplex Multifamily (5+ units)

ECONorthwest 9
The majority of housing in the Primary Market Area is owner-occupied, single-family homes. More housing variety is needed to satisfy population growth and household preferences.
Exhibit. Housing Tenure by Unit Type, Primary Market Area, Oregon City, and Clackamas County, 2014-2018
Source: US Census Bureau, 2014-18 ACS
Increasing the variety of housing supplied will attract a more diverse mix of residents and will enable younger working professionals to remain in the area and change housing types as they age.
Submarket trends are supportive of higher density development
While still small in relation to the total housing stock, the Oregon City submarket has been gradually developing a strong rental residential market. The U.S. Census bureau estimates that 31 percent of all housing inventory in thew PMA are now rentals. Well-performing schools alongside growth in high wage jobs in the region and comparatively lower rents and home prices have accelerated in-migration. CoStar data of the PMA suggest that the residential rental market has and continues to perform positively even into 2020.
Deliveries. The submarket has added 1,500 multifamily rental units since 2010, with most new product consisting of type V or wood frame.
Rent Growth. Rents on units developed since 2010 have grown 27.1 percent (3 annually).
Median rent. As of Q3 2020, median monthly rents on new construction multifamily units were at $1.76 per square foot ($1,822 per month).
Vacancy. Since 2010, vacancy rates across all rental units in the PMA have averaged 4 percent. As of Q3 2020, the vacancy rate was at 3.8 percent.
These market factors in combination with projected demographic and economic trends will continue to drive growth.
95%
25%
2%
7%
1%
19%
2%49%
0%
10%
20%
30%
40%
50%
60%
70%
80%
90%
100%
Owner Renter
Single-Family Detached Single-Family Attached
Duplex, Triplex, Quadplex Multifamily (5+ units)

ECONorthwest 10
Commercial Retail As the population continues to grow in the region, new and existing residents in the PMA will continue spending a portion of their earnings. Additional consumer spending necessitates the development of new commercial retail opportunities. To satisfy demand, the proposed Rossman Land Development includes approximately 500,000 square feet of new commercial retail and entertainment uses. Many of the proposed uses at the Rossman Land Development are considered destination uses that draw commercial activity from outside the city or even the region. From a local economic development perspective, the attraction of commerce from outside the region amplifies potential positive economic impacts through net-new economic activity and retention of local spending that could be “leaking” to other areas.
Consumer Spending and Market Potential
Households residing within the PMA currently spend approximately $1.8 billion on commercial retail categories that align with many of the use categories that the development intends to attract. This is equal to $17,000 in annual consumer spending per household. By 2025 demand for these same goods and services is expected to grow by $317 million (17.5 percent).
Exhibit 2: Entertainment and Retail Consumer Spending and Demand Forecast by Retail Category, Fifteen-Minute Trade Area
Source: ESRI
Forecasted demand suggests that the proposed Rossman Land Development would be well positioned to capture a share of projected market growth in consumer spending within the PMA.
Recent Commercial Retail Market Growth and Trends
The vicinity of the subject site has exhibited development and household growth in recent years. Since 2010, much of the commercial retail development has come in the form of freestanding retail or low-rise multiple tenancy attached retail, which align with the commercial retail types proposed for the subject site. The combination of the proposed retail types and projected population growth should augment commercial retail developments produced since 2010.
Rent and vacancy trend data are indicative of the general direction and stability of the market and inform our understanding of achievable pricing. CoStar data suggest the following market trends:
Consumer Spending Forecast Demand ProjectedRetail Category 2020 2025 New DemandEntertainment and Recreation $407,000,000 $479,000,000 $72,000,000Food and Beverage (at home) $665,000,000 $781,000,000 $116,000,000Food and Beverages (away from home) $469,000,000 $551,000,000 $82,000,000Apparel and Related Services $269,000,000 $316,000,000 $47,000,000Total $1,810,000,000 $2,127,000,000 $317,000,000

ECONorthwest 11
• Vacancy. For the past seven years, the vacancy rate on commercial in the PMA has been below 4.5 percent and as of Q3 2020, the vacancy rate was 4.4 percent on new commercial retail space developed since 2010.
• Rent Growth. Commercial retail rents in the PMA have grown 77 percent (10.9 percent annually) since 2014 for new construction retail space built since 2010.
• Current Rent. As of Q3 2020, per square foot triple-net (NNN) rents on new construction product built since 2010 were at $27.51 per square foot.
The data from the analysis in the sections above suggest that market conditions in the PMA are supportive of new commercial retail and multifamily development.
Feasibility Study Summit Development Group (SDG) asked ECONorthwest to develop an Excel-based pro forma model to test development feasibility of the proposed Rossman Land Development in the context of observed market fundamentals.
Methodology
A pro forma is a financial model that developers use to evaluate whether a development is financially feasible. Pro forma analyses require inputs regarding a physical building configuration: square footage, mix of uses (residential and commercial retail for example), and parking configurations.
We employed a return on cost approach to estimate the residual land value of the proposed full build-out of the properties. A residual land value model calculates the developer’s land budget after they have paid for other development related inputs, e.g. site preparation costs (including brownfield remediation), building costs, parking, etc.
This approach has a key advantage over a cash flow model for analyzing a hypothetical development: it does not require the creation of assumptions about the sources and uses of funds for each development, i.e. where the funds are coming from, with what interest rates, for how long of a term, etc.
In a residual land value model, the project’s value, from which the project costs are subtracted, is based on the net operating income (NOI) of the stabilized project. The NOI is the income (rents) less any operational costs from vacancies, operations, and operating reserves. The expected NOI from the project is then divided by either a capitalization rate or a return on cost percentage – both are ratios or percentages that are estimated by analyzing the recent sale prices of comparable properties compared to their NOIs.
Generally, if the result of a residual land value calculation is positive then the project is feasible subject to the current use of the property, other more valuable alternative uses, or the land-owners speculative value. If the residual land value is negative, the proposed project/use does not generate enough income to pay for land and is not feasible without additional subsidy.

ECONorthwest 12
Model Inputs
In addition to using the development plan provided by SDG, we collected other pro forma inputs through Letters of Intent (LOIs), interviews with developers and local contractors. We further vetted the construction cost numbers and comparable rents with SDG. We refined the inputs based on these interviews and also verified the range of feasible rents by working with local brokers and using the real estate data analytics platform, CoStar. For a more detailed table of assumptions, see Table 1.
Table 1. Development Plan Area Estimates from LRS Architects
Source: Development Plan, prepared by LRS Architects
Estimates for the site development costs came from a variety of sources. ECONorthwest maintains an up-to-date database of construction hard costs and soft costs. We obtain per
North District East District Central District South District Total Developable AreaSite area (SF) 744,368 710,731 459,821 549,692 2,464,612 Site area (acres) 17.09 16.32 10.56 12.62 56.6
FootprintMixed-Use Residential A 64,800 64,800 Mixed-Use Residential B 68,040 68,040 Commercial (retail) 47,598 155,804 119,128 134,557 457,087 Theater 86,829 86,829 Total Building Footprint 267,267 155,804 119,128 134,557 676,756 Surface and on-street parking 58,385 324,770 156,244 157,042 696,441 Surface and on-street parking stalls 292 1,056 581 594 2,523 Implied stall size (gross) 200 308 269 264 Pavillion and Other Impervious 313,366 126,996 120,407 148,841 709,610 Landscape 105,617 103,173 119,128 134,557 462,475 Landscape coverage 14% 15% 26% 24% 19%Total Footprint 744,635 710,743 514,907 574,997 2,545,282 Site area check (267) (12) (55,086) (25,305) (80,670)
GBA (by use)MU Residential A 216,000 216,000 MU Residential A Residential 194,361 194,361 MU Residential A Lobby 10,749 10,749 MU Residential A Retail 10,890 10,890 MU Residential B 220,382 220,382 MU Residential B Residential 205,922 205,922 MU Residential B Lobby 7,200 7,200 MU Residential B Retail 7,260 7,260 Commercial (retail) 47,598 155,804 140,779 162,326 506,507 Gas Station - - Water Park - - Hotel - - Theater 81,829 81,829 Theater Retail 5,000 5,000
Total Residential 400,283 400,283 Total Residential Lobby 17,949 17,949 Total Retail 70,748 155,804 140,779 162,326 529,657 Total GBA 570,809 155,804 140,779 162,326 1,029,718

ECONorthwest 13
square foot cost estimates for various construction and building types through quarterly interviews with developers and contractors. As discussed in the Project and Site Overview section, developing atop a former landfill requires additional mitigation and monitoring costs that are otherwise nonexistent in typical greenfield development. To account for these additional costs, SDG provided its contractor’s cost estimates for site prep and infrastructure, including landscape and hardscape costs, which we then incorporated into the development budget. Table 2 below summarizes the per square foot costs assumptions used for this analysis.
Table 2. Preliminary Construction Cost Assumptions
Source: ECONorthwest and Summit Development Group, February 2021
Project Income
In addition to the construction cost range, we observed a range of asking rents. We worked with local brokers to identify comparable commercial retail tenants and rents in the suburban-Portland region that align with the tenant profile of the Rossman Land Development. The comparable properties produced a wide range of rents. We then used these to determine the blended average NNN 11 rent for the entire development based on the proposed square footage
11 A triple net lease (triple-Net or NNN) is a lease agreement on a property whereby the tenant or lessee promises to pay all the expenses of the property including real estate taxes, building insurance, and maintenance.
Construction Cost AssumptionsVariable Low High Assumption Unit of Measure
Hard Costs: VerticalResidential 195 220 210$ Per square foot
Retail 160 215 175$ Per square foot
Hard Costs: HorizontalEnvironmental Rem. 16$ Per square foot of site area
Other Impervious 12$ Per square foot of impervious space other than building
Landscaping 6$ Per square foot of unbuilt space
Parking CostsSurface Parking 15$ Per square footPodium Parking 100$ Per square foot
Parking SizeSurface Parking 260 280 317 Square foot per stallPodium Parking 398 352 Square foot per stall
Soft Costs
A&E (plus permits, financing, insurance) 25%Percent of hard costs (excluing site prep)
Developer Fee 3.0% Percent of hard and soft costs
Contingency Fee 5.0% Percent of hard and soft costs
Tenant Improvement CostsRetail 70$ Per square foot

ECONorthwest 14
for each commercial tenant. We also identified suitable newly constructed multifamily properties in the suburban-Portland market. We used these comparables to determine average unit sizes and per square foot rents. Table 3 summarizes income assumptions for commercial retail and multifamily uses.
Table 3. Commercial Retail and Multifamily Leasable Square Feet and Rent by District
In addition to commercial rents, SDG has indicated that three of the prospective uses have either already agreed or are in negotiations to purchase portions of the site. For a few of these land sales, SDG provided signed Letters of Intent (LOIs). They indicate that parcels greater than seven acres will sell for $18 to $24 per square foot, while smaller parcels (one acre) will sell for $42 to $50 per square foot. To account for land sales in the model, we assumed the midpoint of these ranges for those parcels still in negotiations.
Findings and Implications
Analysis Findings
The results of our analysis indicate that development is closer to feasible (residual land values across all uses are close to zero), in scenarios with either: (1) a public investment covering a portion of the public infrastructure cost needed to develop on a brownfield site; or (2) if the market dramatically improves and capitalization rates (the rate of return on the project) on multifamily and commercial retail uses are favorable.
Residual land values are positive on the residential portions of the development and only small portions of the retail. Several of the commercial retail districts have negative residual land values. This is not unusual. In mixed-use development, retail is often subsidized by residential uses. In turn, as retail uses increase, it can help increase rents or capture market share on other uses particularly for mixed-use multifamily residential. In scenarios where exit the capitalization rate (the rate of return on the project) is favorable (4.5 or less on residential and less than 5 on commercial retail12), the development is close to achieving a positive net residual land value. With public investment, the feasibility of the project becomes less dependent on
12 Capitalization rates were derived from the CBRE U.S. Cap Rate Survey Special Report Q3 2020 for the Portland Class A Multifamily Suburban Rates (4.5% – 5%) and the Portland Class A Grocery-Anchored Center Rates (4.5% – 6%)
District Leasable sfBlended Rent
(NNN) Leasable sfAverage Unit
SizeAverage Rent
(per sf)Building A 205,110 601 $3.06Building B 213,122 589 $3.06
East 112,775 $34.00 - - - Central 140,779 $24.38 - - -
South 127,967 $32.00 - - -
Multifamily
North 70,748 $35.66
Commercial Retail
ECONorthwest 15
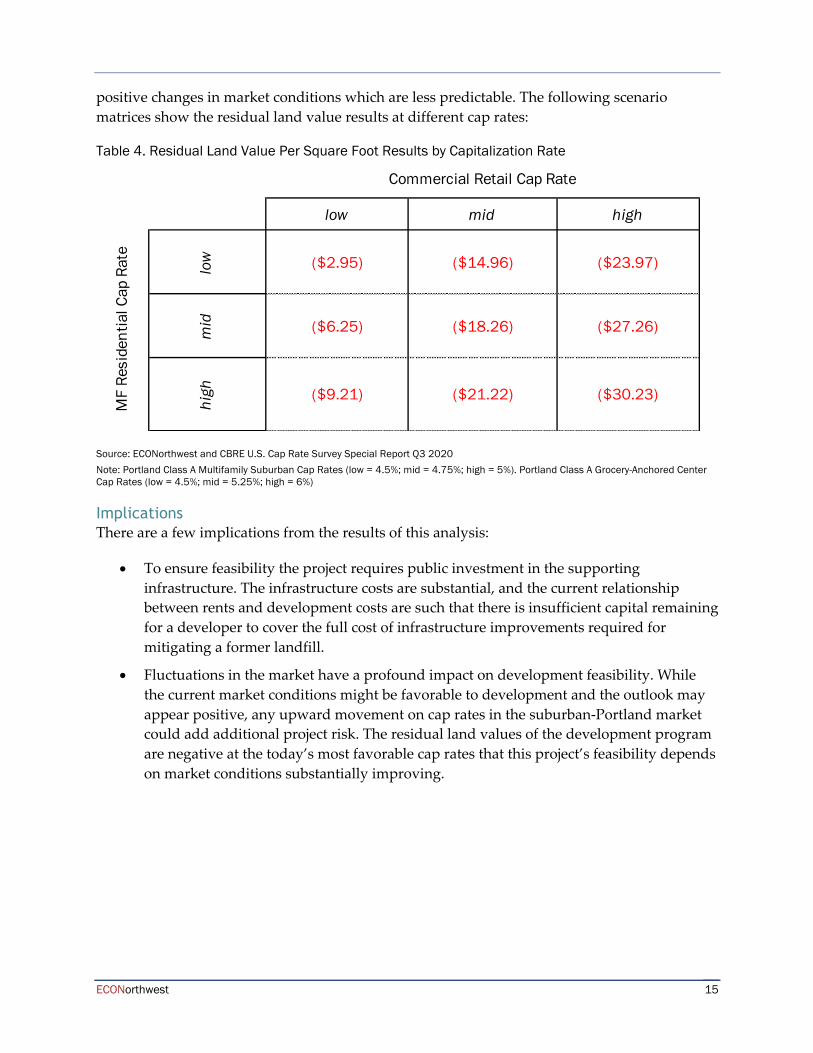
positive changes in market conditions which are less predictable. The following scenario matrices show the residual land value results at different cap rates:
Table 4. Residual Land Value Per Square Foot Results by Capitalization Rate
Source: ECONorthwest and CBRE U.S. Cap Rate Survey Special Report Q3 2020 Note: Portland Class A Multifamily Suburban Cap Rates (low = 4.5%; mid = 4.75%; high = 5%). Portland Class A Grocery-Anchored Center Cap Rates (low = 4.5%; mid = 5.25%; high = 6%)
Implications There are a few implications from the results of this analysis:
• To ensure feasibility the project requires public investment in the supporting infrastructure. The infrastructure costs are substantial, and the current relationship between rents and development costs are such that there is insufficient capital remaining for a developer to cover the full cost of infrastructure improvements required for mitigating a former landfill.
• Fluctuations in the market have a profound impact on development feasibility. While the current market conditions might be favorable to development and the outlook may appear positive, any upward movement on cap rates in the suburban-Portland market could add additional project risk. The residual land values of the development program are negative at the today’s most favorable cap rates that this project’s feasibility depends on market conditions substantially improving.
low mid highlow ($2.95) ($14.96) ($23.97)
mid ($6.25) ($18.26) ($27.26)
high ($9.21) ($21.22) ($30.23)
MF
Resi
dent
ial C
ap R
ate
Commercial Retail Cap Rate
ECONorthwest 16
Public Investment and Benefits
The role of Public Investment in Development Feasibility
The challenge with developing atop any former brownfield site are the costs associated with environmental remediation. If the costs are too high, contaminated land will remain hazardous and undeveloped indefinitely without some public involvement. Public investment thus is required to attract private investment to redevelop such sites. In Oregon, a common tool for providing areawide or site-specific investment is Tax Increment Financing (TIF). TIF revenues are generated by the increase in total assessed value in an urban renewal area or district (URA), from the time the URA is first established. When investments in the district are made, property values increase in the district, and the increase in total property taxes is used to pay off bonds (taken out to pay for specific projects/investments in the area) and/or fund future projects. TIF is an attractive tool for these investments because it creates a nexus between the sources and uses of investment.
When a public investment is made for infrastructure, project subsidy, or public amenities, it is important for the jurisdiction to understand the benefits created by such investments. In the context of TIF, combined public and private investment to clean up a contaminated site drives future property values for the site and in the surrounding area. For example, one recent study found a 5 percent to 11.5 percent increase to neighboring property values following brownfield redevelopment13. Increases in property values can lead to increased property tax revenues. For designated URAs, such as the Oregon City URA (that includes the former Rossman land fill site), a portion of increased property tax revenues pay off the bonds issued to finance the infrastructure work needed to revitalize the contaminated site. In many instances, the net-benefit to the district is greater than the initial investment required to catalyze development. Without such public and leveraged private investment, it’s possible that property tax revenues might rise slower, causing the community to miss out on both the opportunity to clean up contaminated land as well as the higher future property tax revenues needed to pay for it.
Benefits of Brownfield Redevelopment
The public benefits of brownfield redevelopment have been broadly studied. These benefits extend from public health and safety, to climate impacts and economic development. Some common benefits include:
Land utilization. Land is a finite resource that is increasingly scarce. By definition brownfields are sites that are blighted and not maximizing their potential productive use. Brownfield redevelopment returns underutilized land to a higher and better use.
13 Haninger, Ma, Timmins. “The Value of Brownfield Remediation”. Association of Environmental and Resource Economists. 4-01. March 2017.

ECONorthwest 17
Property Value and Tax Base Increase. As detailed previously, brownfields do not maximize on-site tax benefit potential and in many cases have a depressing effect on neighboring property values. Brownfield redevelopment reverses this effect.
Leverage of Public Investment. Public subsidy in brownfield redevelopment has been shown to leverage considerable public investment. A 2015 study by the US Environmental Protection Agency found that every public dollar in brownfield subsidy leveraged $20.13 in public investment14.
Land Efficiency and Vehicle Miles. Due to historical development trends, many brownfields have greater location efficiency, meaning they have better access to existing markets and infrastructure relative to greenfield sites. The EPA has found that brownfield redevelopment results in a 25 to 33 percent decrease in residential vehicle miles traveled (VMT) compared to greenfield development15.
Other Public Benefits
This analysis has shown that public investment in infrastructure is needed to ensure development on brownfield sites. However, there are significant, additional benefits that stem from the increased economic activity that redevelopment of the site can produce (i.e., access to jobs, housing, and shopping opportunities). These are important factors that shape and influence the vibrancy of a community.
Overview of Economic Contributions
Depending on the activity being analyzed, economic contribution can be classified by changes in economic value (benefits and costs) or economic activity (changes in spending levels). The most common approach measures the short-run economic contributions associated with a project’s or multiple projects’ operations and capital spending, as well as spending by employees and construction workers. This captures the effects (in terms of dollars and jobs) to the local and regional businesses as the money is spent on local good and services. We will use specific terminology to discuss the various economic effects stemming from the development of the Rossman Land Development.
The three terms of interest are as follows.
• Direct Effects are those associated with an initial change in spending from a project, typically represented by new construction spending or expansion of operations spending. They also include the direct output of the activities associated with the private sector investment and public subsidy to support the project, which is estimated using an expenditure approach that sums labor and non-labor operating expenses.
14 U.S. Environmental Protection Agency. Overview of EPA’s Brownfield Program. 2020. Retrieved February 26, 2021. https://www.epa.gov/brownfields/overview-epas-brownfields-program 15 U.S. Environmental Protection Agency. Environmental Benefits of Brownfield Redevelopment—A Nationwide Assessment. May 2020.

ECONorthwest 18
• Indirect Effects are the goods and services purchased to support new construction and operations. Because these expenditures represent interactions among businesses, these indirect effects are often referred to as “supply-chain” impacts.
• Induced Effects are the purchases of goods and services from new labor income. The direct and indirect increases in employment and income enhance the overall purchasing power in the economy, thereby inducing further consumption. These induced effects are often referred to as consumption-driven impacts.
Results of Economic Contribution Analysis
ECONorthwest used the 2018 version of IMPLAN, the most recent version available, and built an economic input-output model for Clackamas County. The underlying program data were provided to ECONorthwest from SDG. Other development assumptions were derived from interviews with local developers and contractors.
The development’s effects were measured across the following areas: staff payroll, goods and services expenditures, capital expenditures. We assume that all spending used for this analysis is new spending to the local economy since the URA’s inception and did not crowd out any other economic activity in the area.
Economic effects of redeveloping the site
The total development cost estimate excluding soft costs for the Rossman Land Development is equal to $304.9 million.16 This includes environmental remediation, hardscape and landscape, hard costs, and parking. Such investment could support up to $153.9 million in direct labor income (equal to $70,100 per job in wages and benefits). That labor income, in turn, could support 2,196 jobs in the construction industry. Factoring in the indirect and induced economic effects, the proposed development could support an additional 865 jobs at businesses that supply the construction industry and at local restaurants and retailers (where workers will spend some of their earnings). Table 5 below summarizes the construction impact of the development program.
Table 5. Economic effect from construction
Source: ECONW estimates based on program data provided by SDG, ECONW cost estimates and IMPLAN software.
Annual economic effect from operations
Given that the proposed uses are not yet in operation, we relied on a couple of reliable sources to estimate the number of direct employees. The Institute of Transportation Engineers (ITE) and the U.S. Department of Energy (DOE) publish estimates for building area per employee by
16 All figures from the economic effects of site redevelopment are in 2020 dollar values.
Impact Employment Labor Income Output
Direct 2,196 153,948,175 304,898,719Indirect 347 23,883,291 63,866,714Induced 518 25,211,801 76,071,009
Total Effect 3,061 203,043,267 444,836,442

ECONorthwest 19
business type. For a few types not listed in their data, we calculated the per square foot jobs and compared our estimates to industry reports. We estimate that the proposed development could support approximately 770 direct operations jobs across the uses.
Table 6. Total annual effect of during operations
Source: ECONW estimates based on program data provided by SDG, ECONW cost estimates and IMPLAN software.
When indirect and induced multipliers are taken into account, the businesses operating within the development could support $77.1 million in annual gross economic activity. This new revenue coming into the region supports a total of $33.8 million in labor income and a total 988 jobs from operations, the additional local business purchases and consumption spending from employees.
Broadening the tax base
A crucial benefit of development for any community is the opportunity to broaden the tax base. Development brings increased economic activity to an area, which enables a community to collect more tax revenues from a broader set of economic activities. For example, the proposed development would incur construction excise taxes equal to approximately $366,000 that will go directly to the local government’s general fund. Development of this scale often leads to more development in the surrounding community. This will lead to additional construction excise tax revenues, attracting more private investment, more residents, and more workers to the area, which will generate more economic activity and thus potentially more tax revenues to the City and County beyond just property tax revenues.
Contribution to local services
The Rossman Landfill site currently contributes $0 in property tax revenues to the community but may produce undesired costs through soil and ground water contamination or the risk of methane gas release into the air. Public investment to clean up the site will mitigate these risks while at the same time supply an additional stream of annual tax revenues to the community that otherwise would not exist without public investment.
Assuming no other taxes accrue to the community beyond property taxes paid directly by the proposed development and assuming that property taxes grow by 1 percent per year, we estimate that the project will provide $3.3 million in annual property tax revenues (See Table 7 below for the property tax calculation).
Impact Employment Labor Income Output
Direct 770 23,521,473 45,888,043Indirect 129 5,997,320 18,188,728Induced 89 4,316,558 13,023,128
Total Effect 988 33,835,351 77,099,899

ECONorthwest 20
Table 7. Estimated Property Tax Revenues
*Improvement Value is the sum of total hard costs and the $59.8 million in site prep and mitigation costs
Of the $3.3 million in annual property tax contributions, nearly half of these revenues will go towards local K-12 education and community colleges. Roughly one quarter will go to the County and City governments and the remaining quarter will going towards Fire and other services.17 Similarly, portions of the estimated 2,196 construction works who will build the proposed development and the 770 workers who will operate the businesses who own or lease commercial space on the site will contribute to the local community as well.
Some of these workers will choose to reside in Oregon City or may already live there. They will pay rent or purchase a home in the community, further increasing property tax revenues. They will pay incomes taxes, a portion of which will go to the City general fund. With these incomes, workers will shop and purchase food from local businesses, contributing to even more economic activity, further increasing tax revenues. Higher consumer demand will drive new business investment and development, which again will increase property and construction excise tax revenues over time. As Assessed Values in Oregon City increase over time, the increased property tax revenues will pay of the bonds used to make unproductive land productive for the community enjoy.
17 Clackamas County. Where Your Tax Dollars Go. Available at: https://www.clackamas.us/at/taxingdistrictexplanation.html
Improvement Value* 315,610,184$ Changed Property Ratio 58%Property Tax Rate 1.81%Annual Property Tax 3,331,383$

ECONorthwest 21
Appendix: Landfill Redevelopment Case Studies
Case study 1: Oregon City Home Depot Site
In 2002, Home Depot opened a store on a 17-acre site on the northern portion of the Rossman Landfill. Prior to the commercial development, DEQ’s concerns included the following:
§ Fire or explosion hazards due to potential LFG buildup in confined spaces.
§ Potential human exposure to LFG emissions.
§ Groundwater contamination from settlement of the refuse and construction activities.
§ Potential disturbance to unknown wastes that may be in the landfill.
Home Depot enlisted Landau Associates and Parisi & Parisi to prepare the environmental engineering design report that summarized the key environmental design, construction, and monitoring provisions that would address DEQ’s concerns.18 Environmental mitigation measures included the following19:
§ Up to 10 feet of imported fill placed over the existing soil cover to achieve recommended site grades.
§ Additional 5 feet of fill (surcharge load) placed to compress the onsite materials and reduce post-construction settlement. Surcharging did not affect groundwater.
§ 1,230 steel piles (2-feet diameter) were installed across the site.
§ LFG control and monitoring system was installed, including a gas barrier beneath the building, a gas extraction system, and 23 monitoring wells. Groundwater is monitored semiannually, and surface waters in Clackamette Lake and Abernethy Creek are also periodically monitored.
Home Depot continues to operate on the site and has been successful in mitigating any potential health and safety challenges posed by the landfill.
Case Study 2: Bridgeport Village, Tigard, Oregon
The Bridgeport Village is another local, successful case of commercial development on a former landfill site. The 28-acre development consists of an office park, an upscale shopping center and a 4-story parking garage. Until 2004 the site was owned by Washington County which subsequently transferred it over for development. When it opened in 2005 it was the 10th largest shopping center in the nation.
The site was formerly occupied by Durham Pit/Quarry, which was operated by Washington County from 1950s to 1970s and then backfilled in the 1980s and 1990s. The site is known to have high subsurface methane concentrations and elevated concentrations of oil and
18 Daily Journal of Commerce. “Home Depot Builds atop an old Oregon Landfill”, available at: https://www.djc.com/news/en/11135649.html 19 Oregon Department of Air Quality Report ECSI – Environment Cleanup Site Information

ECONorthwest 22
benzo(a)pyrene. The unexpected finding of methane gas and oil contamination delayed the development by about a year and increased the cost of the project by about $5 million.20
GeoDesign conducted Bridgeport Village’s remediation study and recommended the following mitigation measures21:
• Partial removal of organics to facilitate installation of soil cement pad.
• Active sub-slab vents under buildings to extract methane gas.
• Active horizontal vents and vertical gas extraction wells at the site perimeter.
• Active vertical gas extraction wells near hot spots within the site.
• Sealed building penetrations.
• Isolation of utility corridors.
In response the developer took the following measures:
• Poured a concrete slab above the site to provide structural support.
• Located a passive sub-slab venting system and a low permeability gas membrane beneath each building slab to control the flow of methane gas.
• Installed an active gas extraction system at various depths around and on the site to remove methane gas.
• Attached interior gas sensors on buildings.
• Established low permeability membrane collars or trench plugs for every utility in each building or that crosses a site boundary. The collar and plugs limit the spread of contamination by providing a seal around the utility pipes.
• Instituted ongoing monitoring of methane levels.
Bridgeport Village remains an example of developing atop a former landfill that continues to successfully mitigate and monitor the health and environmental challenges inherent to landfills.
Case Study 3: City Place, Santa Clara, CA
The Related Companies, the developer of NYC’s Hudson Yards, started constructing in 2020 one of the largest commercial developments in California. The development is a mixed-use complex with office, retail, hotel, and 1,680 residential units, including affordable housing. The
20 Metro Report. Oregon Landfill Legacy. Available at: https://www.oregonmetro.gov/sites/default/files/2014/04/17/03152004_landfill_history.pdf
21 GeoDesign Inc. Methane Remedial Investigation and Focused Feasibility Study. Former Durham Quarry. Proposed Bridgeport Village Development. September 2003. Available at: https://www.deq.state.or.us/Webdocs/Controls/Output/PdfHandler.ashx?p=4b2ab251-858a-4b49-8ca9-a82b8100fa21pdf&s=DurhamQuarry_RIFS_092403.pdf

ECONorthwest 23
239-acre site currently has a golf course and a BMX track. Construction is expected to be completed in 2023.
183 acres of the development site is on a former landfill. The landfill began its operations in the 1960s and closed in 1993. Permitted materials included construction debris and non-hazardous municipal waste. The landfill was capped with 1 to 7 feet of clay and 1 to 34 feet of artificial fill consisting of mixed sands, gravels, and silts.22 To address safety concerns related to combustible methane gas and groundwater contamination caused by the decomposing waste, the City and the Developer are taking the following measures23:
§ Installing sub-slab landfill gas protection systems.
§ Construction of an enormous platform over the landfill.
§ Placing 12 inches of clay barrier and 12 inches of concrete barrier over 30 central acres of the site.
§ Placing piles up to 150 feet into the ground.
§ Replacing existing gas collection and removal systems.
§ Monitoring landfill gas during (and after) project construction.
§ Protecting and repairing existing leachate recovery systems.
§ Prohibiting enclosed basements.
§ Limiting residential development to a parcel where no municipal waste was placed and over open-air podium level garages or ground-floor, commercial space.
§ The City is covering some portion of the infrastructure work cost needed to redevelop the site.24
22 City of Santa Clara. Project Listing. Available at: https://www.santaclaraca.gov/Home/Components/BusinessDirectory/BusinessDirectory/216/2495 23 City of Santa Clara. Environmental Impact Analysis. Available at: https://www.santaclaraca.gov/home/showdocument?id=15544 24 San Jose Spotlight. Santa Clara to Talk Traffic Plan Funding for Massive Related Development. Available at: https://sanjosespotlight.com/santa-clara-to-talk-traffic-plan-funding-for-massive-related-development/