logistics report 2015 - freight transport · pdf filethe logistics report 2015 freight...
TRANSCRIPT

Logistics Report 2015
DELIVERING SAFE, EFFICIENT, SUSTAINABLE LOGISTICS

FTA is one of the UK’s largest trade associations and represents over 14,500 members relying on or providing transport integration both domestically and internationally, to or from the UK. Our members include hauliers, freight forwarders, rail, sea and air freight operators, through to customers – producers, manufacturers, wholesalers and retailers. They cover all modes of transport – road, rail, air and sea. FTA members operate over 200,000 commercial goods vehicles on the roads in the UK – more than half the UK fleet. FTA members also consign around 90 per cent of goods moved by rail and around 70 per cent of goods moved by air and sea.
You can find more information at www.fta.co.uk, follow us on twitter.com/newsfromfta and join us on facebook.com/ftafb

Foreword
Welcome to the Logistics Report 2015, FTA’s assessment of the main influences and events affecting logistics in the last year.
At such a crossroads for our national finances and society, the Logistics Report provides a timely and essential analysis of the short and long-term health of a major enabler of our economy and lifestyle: logistics.
To achieve this, we have drawn on wide-ranging sources of data, from in-house and external experts, to provide a unique appraisal of the impact of politics, people and commerce on the way that goods are moved across the world and around the country.
The direct participation of FTA members in the development of our responses and research ensures that our analysis is well-grounded in the reality of day-to-day logistics operations. Our Freight Councils help us understand the implications of Government policies for the movement of goods and our members’ participation in our regular and ad hoc survey work allows us to benefit from their invaluable insights.
The Logistics Report 2015 describes a mixed picture of the global economy, with growth expectations dampened in many parts of the world. At home, members tell us that business confidence is lower, beyond the short-term, as uncertainty over future economic policies and the impact of the Euro Zone are, once more, causes of concern. The new Government will have to make significant decisions – and quickly – over our infrastructure and transport policies; FTA is ready to inform that process.
Our message to Government is: ignore the needs of logistics at your peril. From the factory floor to the kitchen table, it is logistics that will deliver sustainable growth.
David Wells Chief ExecutiveFreight Transport Association


Contents
Foreword 3
Introduction 6
Logistics dashboard 14
Chapter 1 An evolving future 18
Chapter 2 Changing lanes 36
Chapter 3 Into the city 52
Chapter 4 Upholding standards 64
Chapter 5 Strengthening through numbers 78
Evidence base 92

Introduction


8
The Logistics Report 2015 © Freight Transport Association
Economic and business performance
The Logistics Report 2015 shows a mixed outlook for the global economy, with world events, more sluggish growth and falling demand for oil and other commodities reducing expectations. Many of the world’s major economies were slowing down in 2014, with the notable exception of the US. Reports of the lowest annual GDP growth for China in 25 years, and the signalling of quantitative easing in the Euro Zone, both pointed to a significant drop-off in the global recovery.
At home, there was lower business confidence beyond the immediate planning horizon, as uncertainty over future economic policies and the domestic impact of the Euro Zone and worldwide political crises tempered optimism. But, overall, 2014 was a good year for the national finances with growth increasing year-on-year, accompanied by strong indications that the recovery that began in 2013 was spreading more widely through the economy as a whole. The UK annual GDP growth rate in 2014 was 2.8 per cent and is forecast to be around 2.9 per cent in 2015.
But there were some less positive signs. For example exports remained subdued, mainly as a result of continuing economic weakness in the Euro Zone. This was exacerbated by the falling value of the Euro against Sterling, making British exports more expensive.
The good news for logistics is that oil prices are now predicted to remain low for some time, reducing the impact of UK fuel duty which remains the highest in the EU. The introduction by Government of the HGV Road User Levy in 2014 was aimed at addressing some of the competitive imbalance this causes for UK operators.
Economic activity indicators for logistics improved in 2014. According to FTA’s Logistics Industry Survey 2014/2015, activity in the sector generally increased although the degree of activity was below expectation.
Sea freight import and export volumes grew, as consumer demand improved but air freight volumes were mixed. While the rest of the economy was in recovery, the number of operator licences continued to fall although the hgv market recovered in 2014 and economic expectations for 2015 are optimistic. In addition, the number of vans in use rose by 2 per cent in 2013 (compared to 2012).
Following reductions last year, use of contract hire and contract distribution is expected to increase in 2015. It is not clear at this stage whether this is the result of a lack of confidence in the economy or because of short-term issues recruiting drivers.
Sixty per cent of members surveyed expected the coming year to be better than 2014 (compared to 50 per cent in last year’s survey).
However, respondents reported that UK competitiveness deteriorated relative to the EU and globally (compared to 2013). This echoes exporters’ concerns over the strength of Sterling against the Euro and the condition of our major export markets. Seven out of 10 of our top countries for exports are in the Euro Zone.
Total operating costs for a 44 tonne articulated truck fell by 5.1 per cent in 2014, comparing favourably against a 1.6 per cent increase in the RPI inflation rate in the year to December 2014. This is a result of rises in some input costs being offset by a reduction in the price of fuel. However, hgv operating costs continue to outstrip increases in haulage rates.
While oil prices fell during 2014, fuel duty dampened the impact of such reductions on the bulk and pump price because the duty is specified in absolute terms (ie in pence per litre) rather than ad valorem (according to value). The fact that oil is traded in US Dollars and that Sterling is weaker has also lessened the effect of the lower price.
Introduction

9
Introduction
The Logistics Report 2015 © Freight Transport Association
Connectivity
The report found that the role of investment in infrastructure in securing competitive advantage was now better understood and politicians have recognised the strength of the arguments for long-term planning. However, according to the World Economic Forum, the UK ranks 27th for the quality of its overall infrastructure. There is an urgent need for infrastructure improvement and business needs to be convinced of the durability of the promises that have been made and the deliverability of the projects planned.
Government legislated to create a more efficient, accountable road operator with a longer-term investment strategy and announced £15 billion infrastructure spending plans. Investment included delivering: a network of ‘smart motorways’ and ‘expressways’; and improvements to support the ‘Northern Powerhouse’ (including announcing a new study into a trans-Pennine tunnel). But Government was warned by industry that these projects needed to actually be delivered and in
a timely way. A decision on hub airport capacity in the south east of England was also urgently needed.
In the year, we also became ever more aware that our transport network needs to be resilient, to withstand the shocks generated by the natural world and the new, global economic order. Extreme weather conditions wrought havoc on transport infrastructure, notably causing major disruption at Gatwick Airport and the Port of Immingham and the severing of the rail link to the west of England when the rail track was washed away at Dawlish. Government launched a review to investigate resilience failures and identify ways to reduce network vulnerability.
The latest figures show that the reliability of urban road networks continues to deteriorate and, as in previous FTA Logistics Industry Surveys, rail is still seen as more reliable.
The average speed on local ‘A’ roads during the weekday morning peak in the year ending September 2014 was 24.1mph – a 0.7 per cent decrease on the previous year.
There was concern over the impact of economic migrants at the Port of Calais but for international connectivity the story was not all bad. The European Commission predicted a doubling of Channel Tunnel rail freight in the next five years, as Eurotunnel announced it would reduce the current level of track access charges imposed on rail freight operators by up to 50 per cent.
Rail freight can also expect to benefit from new national planning guidelines which, it is hoped, will encourage private investment in strategic rail freight interchanges.
Respondents to the FTA Logistics Industry Survey who use UK seaports overwhelmingly indicated that congestion had become worse in 2014. Of particular concern were the capacity of access roads and the availability of suitable roads for inland haulage of containers. This was not just a domestic phenomenon, varying factors worldwide led to similar delays being experienced by shippers elsewhere. Shippers in the US and Europe are experiencing delays of between 5 and 10 days in getting their goods from ports.
Urban access
Delivering in our growing towns and cities has become one of the great challenges for logistics and is set to become even more so in the future. Freight movements have to be efficient to keep down the cost of living and to enable businesses to be competitive. Logistics must deliver more frequently and within more restricted time windows as customer demands change. And whilst
2.62 milliontonnes of air freight handled
1.7%Down on 2012
68.5 billionvan km
3.2%Up on 2012
25.2 billionhgv km
0.8%Up on 2012
139 billion tonne km of goods moved by hgv
7.3%Down on 2012
8.24 millionteus of containers handled by UK ports
3.3%Up on 2012
22.14 billiontonne km goods moved by rail
1.2%Down on 2013
6.41 billiontonne km of goods moved by domestic intermodal rail
3.4%Up on 2013

10
Introduction
The Logistics Report 2015 © Freight Transport Association
Why is the ‘goods moved’ figure falling?
According to Road Freight Statistics GB: 2011 to 2013 the amount of goods moved by GB-registered hgvs operating in the UK decreased by 7 per cent to 139 billion tonne kilometres between 2012 and 2013 after rising for two years. Over the same period, the amount of goods lifted decreased by 7 per cent to 1,475 million tonnes and vehicle kilometres decreased by 7 per cent to 17.2 billion vehicle kilometres (10.7 billion vehicle miles). This is the same as travelling to the moon and back over 22,000 times! In contrast, there was steady growth in the UK economy in 2013 after a difficult 2012 where there was little improvement in output.
Hgv tonne kilometres 2000–2013
Goods moved by hgvs decreased in 2013
120
125
130
135
140
145
150
155
160
20132012201120102009200820072006200520042003200220012000
Bn t
onne
km
Source: Table RFS0107 tonne kilometres by vehicle type, annual 2000–2013 Road Freight Statistics 2011–2013
According to the Department for Transport (DfT), the trend in the amount of goods moved by road has broadly followed the manufacturing output and transport and storage output components of GDP. But in 2013 there was a 2 per cent rise in GDP over the previous year compared to a 7 per cent fall in the amount of goods moved.
There are two possible explanations for this trend. Firstly, this may be due to the change in the methodology used to calculate tonne km by DfT. Alternatively, the reason may lie in the calculation of GDP and its relationship to population growth. If total output increases at the same rate as the population, then there is likely to be no resultant rise in material ‘well-being’.
The economy may now be bigger in size than it was in 2008 but the growth in Britain’s population means output is still around 6 per cent below its pre-crisis peak. In addition, disposable income levels have tracked GDP per capita quite closely but have been relatively flat since 2009 and the population’s net disposable income has been falling steadily since 2013.1 This may mean that the less consumption there is, the fewer consumer goods there are to move and hence the drop in road freight activity.
1 http://www.telegraph.co.uk/finance/economics/11159277/What-does-GDP-really-tell-us-about-economic-growth.html

11
Introduction
The Logistics Report 2015 © Freight Transport Association
doing this it must cope with the need for ever improving safety on increasingly congested roads, and the desire for improved air quality in our urban areas.
In 2014, improving air quality and keeping streets safer for vulnerable road users continued to dominate the urban agenda both in the UK and in other advanced economies. The UK faced legal action over its failure to act on pollution levels in many cities and local authorities increasingly looked to low emissions zones as a potential solution.
Action was taken to improve the safety of vulnerable road users, with the Construction Logistics and Cyclist Safety (CLOCS) project continuing its work in London and its associated standard for vehicle equipment and driver training gaining uptake amongst contractors and suppliers in that sector. The decision was also taken in 2014 to increase the safety requirements for hgvs operating in London.
The staging of the Commonwealth Games in Glasgow and the Tour de France underlined that logistics works best when engaged at the planning phase for major events. Where logistics was involved and kept informed, for example during the Yorkshire stages of the Tour, things worked well. Some other world class events failed to live up to these standards at the planning stage and the consequence was additional cost and uncertainty for businesses.
The march of e-commerce continued. In 2014, the annual average weekly spend online was £718.7 million; an increase of 11.8 per cent compared with 2013. In five years the amount spent has more than doubled.
The rise of e-commerce also appears to be changing the type of vehicles purchased with a dramatic rise in the number of new van registrations and, since 2009, the number of vans registered has increased by 73 per cent (to end 2014). The nature of the distribution centre and the demands placed upon it are also clearly changing and will continue to do so, with many activities that would traditionally have been carried out in a shop now carried out in these hubs.
Safety and carbon
There was a continuing effort to improve logistics not just from a narrow business efficiency point of view but also as regards safety and environmental impact. The number of collisions involving hgvs fell by nearly 3 per cent in 2013 and there was concerted action by logistics to ‘green’ the hgv fleet, both at operator level and at the vehicle design stage.
There were also revived hopes of a global deal on carbon; as a result of sustained action to reduce logistics’ CO2, emissions from the transport sector have decreased by 3 per cent and road transport emissions have decreased by 1.5 per cent since 1990. Emissions from road transport followed an increasing trend until 2007, but fell by 11.6 per cent between 2007 and 2012. This reflects improved efficiency of the vehicle fleet, and reduced vehicle km travelled (partly as a result of the recession).
A number of initiatives are underway to explore how use of lower carbon fuels can be promoted through improving the commercial case for alternative fuels and their availability to help logistics continue to reduce its carbon emissions; in particular funding has been allocated for gas refuelling infrastructure for hgvs.
Skills and people
The nation’s economic recovery is reflected in the employment market and some businesses are reporting increased challenges in attracting suitable candidates. Logistics is not alone in experiencing this phenomenon and, like other areas of industry, it must work hard to secure and retain the best people for the jobs that need to be filled; this is an ongoing challenge that will require solutions from employers and Government.
Transport and storage currently employs around 8 per cent of the UK workforce.The number of hgv drivers claiming unemployment related benefits fell by 55 per cent in 2014.
10 September 2014 was a critical date for logistics, one that businesses had been working towards for more than five years. The date marked the end of the first cycle of periodic training for the large goods vehicle (lgv) Driver Certificate of Professional Competence (Driver CPC) – 1,609,791 periodic training hours were uploaded in August 2014.
Two-thirds of transport managers now anticipate a shortage of lgv drivers, most blame the shortfall on the retirement of drivers opting not to complete the Driver CPC. ‘Driver roadside facilities’ was ranked as the greatest barrier to driver recruitment, closely followed by medical requirements and hours of work.
It is estimated that the shortfall in hgv drivers is between 50,000 and 60,000.
What made the issue particularly acute in 2014 was the impact of wider developments in the commercial world, with continuing changes in the way that consumers order goods and expect them to be delivered. The Christmas
12
Introduction
The Logistics Report 2015 © Freight Transport Association
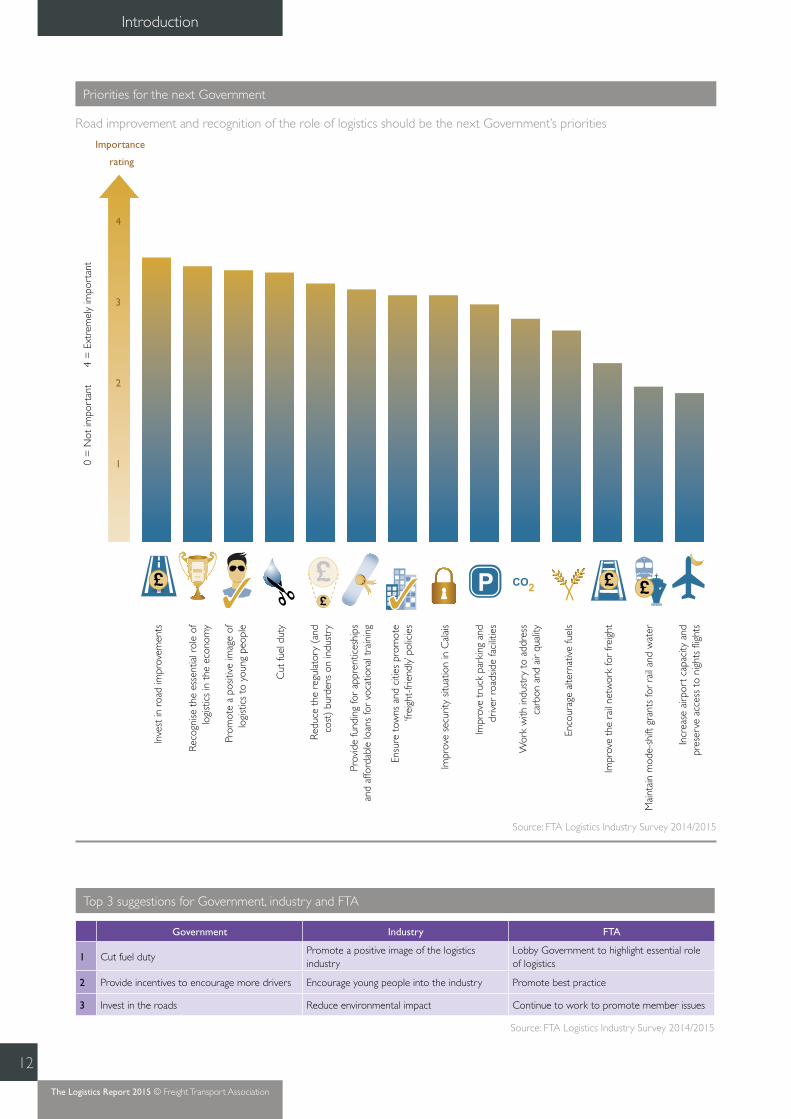
Priorities for the next Government
Road improvement and recognition of the role of logistics should be the next Government’s priorities
Inve
st in
roa
d im
prov
emen
ts
Reco
gnise
the
ess
entia
l rol
e of
logi
stic
s in
the
eco
nom
y
Prom
ote
a po
sitiv
e im
age
oflo
gist
ics
to y
oung
peo
ple
Cut
fuel
dut
y
Redu
ce t
he r
egul
ator
y (a
ndco
st)
burd
ens
on in
dust
ry
Pro v
ide
fund
ing
for
appr
entic
eshi
ps a
nd a
fford
able
loan
s fo
r vo
catio
nal t
rain
ing
Ensu
re t
owns
and
citi
es p
rom
ote
‘frei
ght-
frie
ndly
’ pol
icie
s
Impr
ove
secu
rity
situa
tion
in C
alai
s
Impr
ove
truc
k pa
rkin
g an
ddr
iver
roa
dsid
e fa
cilit
ies
Wor
k w
ith in
dust
ry t
o ad
dres
sca
rbon
and
air
qual
ity
Enco
urag
e al
tern
ativ
e fu
els
Impr
ove
the
rail
netw
ork
for
freig
ht
Mai
ntai
n m
ode-
shift
gra
nts
for
rail
and
wat
er
Incr
ease
airp
ort
capa
city
and
pres
erve
acc
ess
to n
ight
s fli
ghts
1
2
3
4
Importance
rating
CO2
0 =
Not
impo
rtan
t
4 =
Ext
rem
ely
impo
rtan
t
Source: FTA Logistics Industry Survey 2014/2015
Top 3 suggestions for Government, industry and FTA
Government Industry FTA
1 Cut fuel dutyPromote a positive image of the logistics industry
Lobby Government to highlight essential role of logistics
2 Provide incentives to encourage more drivers Encourage young people into the industry Promote best practice
3 Invest in the roads Reduce environmental impact Continue to work to promote member issues
Source: FTA Logistics Industry Survey 2014/2015

13
Introduction
The Logistics Report 2015 © Freight Transport Association
The logistics dashboard
The logistics dashboard brings together a range of over 50 indicators (LDIs) that give different perspectives on logistics and the performance of the wider economy. The ongoing improvement in the UK economy is reflected in the 2015 edition of the logistics dashboard, which captures the impact of eight successive quarters of growth in the UK compared to a sluggish Euro Zone.
The indicators cover the following areas: road transport industry, safety, efficiency, traffic flows and economic indicators. Headline figures show:
❚ new hgv registrations were down 26 per cent in 2014, reflecting a surge in demand in December 2013 ahead of the introduction of the Euro VI standard
❚ road transport operator profit margins remained around 3 per cent in 2014, unchanged from the previous year
❚ the price of oil had generally remained over $100 per barrel (bbl) in recent years but fell dramatically in the last three months of 2014 to $57bbl at the end December, which was almost half the $111bbl seen at the end of 2013. This, in turn, has filtered through to bulk and pump fuel prices and reduced annual vehicle operating costs for the first time since 2008
❚ growth in the UK economy and Sterling’s gains against the Euro have probably encouraged an increase in trade with western Europe. The number of powered vehicles and unaccompanied trailers rose by 9 per cent and 8 per cent respectively in 2014 compared to 2013. Intermodal rail freight increased by 3 per cent in 2014 compared to 2013, whilst the volume of rail freight that used the Channel Tunnel significantly increased
❚ in terms of compliance, there was a decrease in detection of incidences of overloading and drivers’ hours infringements, but a small increase in roadworthiness prohibitions in 2013. Hgv annual test failure rates decreased marginally, whilst van failure rates increased slightly. Safety shows a mixed picture with workplace accidents reported down by 8 per cent but road casualties linked to hgvs more or less unchanged year-on-year
shopping retail activity ‘bulge’ had a material impact on logistics. The cost of making sure that the deliveries were made was significant, with logistics companies deploying more staff and increasing hourly rates during December to ensure the customer promise was fulfilled.
Policy priorities for the next Government
Respondents to the FTA Logistics Industry Survey 2014/2015 rated priorities for the next Government. Investment in road improvements, recognising the vital role of logistics in the economy and cutting fuel duty were the highest perceived priorities. The responses reflect similar political concerns to those expressed a year ago when fuel duty and infrastructure spending were felt to be the standout risks for respondents to the FTA Logistics Industry Survey 2013/2014.
Respondents were also asked to express what they thought was the one thing the Government, industry and FTA could do to assist the logistics industry in 2015. The top three suggestions for each entity are outlined in the table opposite.
Logistics dashboard


16
The Logistics Report 2015 © Freight Transport Association
Logistics dashboardThe logistics dashboard brings together a range of over 50 indicators (LDIs) that give different perspectives on logistics and the performance of the wider economy.
LDI 2009 2010 2011 2012 2013 2014Most recent year-on-year
change
Page ref
ROAD TRANSPORT INDUSTRY
1 Reported profit margin of Top 100 road hauliers 1% 4% 4% 1% 3% 3% 34
2 Number of goods vehicle operator licences 91,200 87,747 84,072 80,894 77,732 23
3 Population of hgvs licensed 397,160 389,761 383,941 378,775 385,795 23
4 Population of vans licensed 3,241,047 3,258,445 3,293,451 3,320,431 3,388,077 23
5 Population of hgv trailers (based on number tested) 230,966 227,057 224,714 220,283 222,737 23
6 Hgv registrations 34,746 34,458 42,944 45,702 56,218 41,469
7 Van registrations 186,386 222,915 260,153 239,641 271,073 321,686
8 Number of hgv drivers in employment (thousands) 310 285 299 290 259 285
9 Claimant count (hgv drivers for December) 10,665 6,550 5,870 5,050 2,875 1,300 82
10 Hgvs laid up (SORN) 64,109 60,709 61,979 60,735 71,877 73,542 23
SAFETY
11 Hgv motor vehicle test pass rate initial (>3.5 tonnes gvw) 72.6% 74.5% 75.3% 77.6% 78.4%
12 Van test pass rate initial (Class 7) 50.0% 50.5% 50.2% 50.3% 49.7%
13 Hgv roadside encounter prohibition rate percentage – mechanical checks (UK drivers only) 31.1% 26.2% 28.4% 29.5% 31.3%
14 Hgv roadside encounter failure rate percentage – drivers’ hours checks (UK drivers only) 14.3% 16.1% 19.7% 19.4% 13.0%
15 Hgv roadside encounter failure rate percentage – weight checks (UK drivers only) 37.5% 58.0% 60.6% 59.7% 58.2%
16 RIDDOR reportable workplace accidents for transport 19,222 17,255 16,313 11,660 10,764
17 Road casualties linked to hgvs (number killed or seriously injured) 1,439 1,379 1,334 1,348 1,354
EFFICIENCY
18 Percentage of hgvs empty running 28.3% 28.7% 30.2% 28.5% 28.6%
19 Percentage of inland freight moved by rail (billion net tonne kilometres) 9.0% 9.0% not available not available
20 Lading factor percentage for hgvs (>3.5 tonnes gvw) 57.0% 59.0% 62.0% 63.0% 63.0%
21 Hgv fuel consumption (mpg) (articulated vehicles) 7.7 7.6 7.9 7.8 7.8
22 Use of alternative fuels in hgvs 1.0 mt of oil equivalent
1.2 mt of oil equivalent
1.1 mt of oil equivalent
1.0 mt of oil equivalent
1.1 mt of oil equivalent
23 Average hgv payload capacity (tonnes) 6.9 7.4 7.5 8.1 8.1
TRAFFIC FLOWS
24 Containers handled by major UK ports (thousand TEUs) 7,373 8,222 8,141 7,980 8,244
25 Freight handled by air (tonnes) 2,047,861 2,324,822 2,297,601 2,302,329 2,262,386
26 Goods moved by hgvs (>3.5 tonnes gvw) (billion tonne kilometres) 125 139 145 150 139
27 Van kilometres (billion vehicle kilometres) 65.5 66.1 66.6 66.4 68.5
28 Cabotage within the UK (million tonne kilometres) 1,231 1,272 1,028 1,048 1,053

17
Logistics dashboard
The Logistics Report 2015 © Freight Transport Association
TRAFFIC FLOWS (continued)
29 Goods moved by rail (billion tonne kilometres) 19.17 18.58 20.97 21.47 22.40 22.14
30 Goods moved by domestic intermodal rail (billion tonne kilometres) 5.30 5.58 6.17 6.36 6.20 6.41 30
31 Channel Tunnel rail freight volumes (tonnes) 1,181,089 1,128,079 1,324,673 1,227,139 1,363,834 1,648,047
32 Number of rail freight train movements 278,472 265,559 273,897 275,827 288,371
33 Rail freight performance measure (percentage of freight trains arriving on time at their final destination) 74.5% 74.0% 74.8% 75.3% 73.6% 78.3%
34 Percentage penetration of cross-Channel market by UK hgvs 19.7% 21.1% 19.9% 18.7% 16.0% 15.8%
35 Hgv movements to mainland Europe (unaccompanied trailers only) 610,915 673,236 660,397 619,699 652,060 701,528
36 Hgv movements to mainland Europe (all powered vehicles) 1,764,087 1,794,376 1,811,521 1,810,652 2,037,229 2,230,241
ECONOMIC INDICATORS
UK economic activity
37 GDP (Q4 annual percentage change) -1.5% 2.2% 1.5% 0.4% 2.4% 3.0%
38 Average weekly online retail sales (£ million) £340.76 £407.31 £480.89 £554.47 £639.61 £716.77
UK exports
39 Volume of goods exported to the EU (annual percentage change) -13.1% +10.3% +7.0% -7.6% -0.9% +1.6% 25
40 Volume of goods exported to the rest of the world (annual percentage change) -9.8% +15.4% +11.4% +5.0% -0.4% -1.6%
UK imports
41 Volume of goods imported from the EU (annual percentage change) -12.5% +11.9% +3.2% +3.1% +6.0% +4.1%
42 Volume of goods imported from the rest of the world (annual percentage change) -10.4% +16.4% +0.1% +0.1% -2.9% +0.6%
UK inflation and currency
43 Retail Prices Index (annual inflation in December) 2.4% 4.8% 4.8% 3.1% 2.7% 1.6% 82
44 Consumer Prices Index (annual inflation in December) 2.9% 3.7% 4.2% 2.7% 2.0% 0.5%
45 £/$ exchange rate (average for December) $1.6242 $1.5588 $1.5614 $1.6148 $1.6384 $1.5642
46 £/€ exchange rate (average for December) €1.1115 €1.1791 €1.1849 €1.2304 €1.1956 €1.2685
Costs
47 Wage settlements (annual change in basic pay) +0.1% +2.1% +2.6% +3.0% 2.2% 2.4% 81
48 Total hgv operating costs (annual change for 44t gvw artic) +5.4% +7.0% +4.0% +0.7% +0.9% -5.1%
Fuel
49 Bulk diesel (average pence per litre in December ex VAT) 89.99 103.30 112.05 110.61 109.62 94.18 30
50 Gas oil (average pence per litre in December ex VAT) 44.05 55.11 64.92 63.47 63.36 47.95 30
51 Rotterdam French Diesel (average per tonne in December) $624.50 $797.65 $948.10 $955.63 $962.92 $606.15
52 Brent blend (dated) (average per barrel in December) $74.52 $91.78 $108.19 $109.56 $110.67 $62.86
53 Jet fuel (Rotterdam kerosene) (average per tonne in December) $663.11 $831.09 $987.35 $1,007.91 $1,009.06 $644.54
54 Rotterdam gas oil (average per tonne in December) $610.95 $761.87 $926.87 $932.58 $943.20 $581.39
LDI 2009 2010 2011 2012 2013 2014Most recent year-on-year
change
Page ref
Note: LDI no 19 – although Road Freight Statistics have been updated, the Department for Transport (DfT) has not yet updated the table in TSGB from where this figure has been sourced.

An evolving future

Chapter 1

20
The Logistics Report 2015 © Freight Transport Association
GLOBAL ECONOMY
Global recovery appears to stall while the US continues to flourish
As 2014 drew to a close it became increasingly clear that many of the world’s major economies were slowing down, with the notable exception of the US. Reports of the lowest annual GDP growth for China in 25 years, and the signalling of quantitative easing in the Euro Zone, both pointed to a significant drop-off in the global recovery.
At the same time, there has been a major decline in demand for oil, coupled with increased supply mainly from shale oil producers in the US. There has also been a general reduction in the requirement for other commodities, such as copper. As a consequence, countries like Russia and Australia, whose economies rely heavily on export of their natural resources, seem likely to see further stifled economic growth until such time as demand recovers. Given that several commentators including BP and Bloomberg have already stated that low oil prices are likely to persist for several years, the near-term economic prospects for countries relying on exports of such goods are unclear.
China’s economy resumed its slowdown in the final half of 2014, led by weak investment in construction activity. Annual GDP growth was 7.4 per cent in 2014 as a result of poorer retail sales and a property market suffering from over capacity. China’s large, opaque financial sector and its saturated property market both represent significant risks to its economic growth. It is estimated that GDP will fall to around 7 per cent in 2015.1,2
1 http://www.goldmansachs.com/our-thinking/outlook/20152 Economic Outlook No 96 – 25 November 2014 – OECD Annual Projections
By contrast, the US economy remains firm and is expected to enjoy steady expansion in 2015/16. CBI3, OECD and Goldman Sachs4 all predict that GDP growth will pick up from 2.3 per cent in 2014 to around 3.1 per cent in 2015/16. According to CBI, confidence among US consumers continues to rise as the jobs market improves, together with a pick-up in wage growth; this is expected to support consumer spending and house construction. US monetary policy should also keep supporting economic expansion, with Federal Reserve officials suggesting that the central bank’s main goal is to achieve full employment and that inflation and wage growth will be allowed to run ahead of target to ensure that the recovery beds down.
In the Euro Zone, the recovery has failed to take hold, with inflation tracking close to zero and the prospect that falling oil prices may even lead to deflation (with inflation falling back to a post-crisis low of 0.3 per cent). GDP in the Euro Zone grew by 0.3 per cent in the fourth quarter of 2014 buoyed by a surprisingly resurgent German economy. The unemployment rate remained static at 11.5 per cent in the final quarter of 2014 with the Purchasing Managers Index (PMI) and CBI predicting subdued growth (0.2 per cent) in the same quarter. Whilst falling prices in general sound like a ‘good thing’, the danger is that if they continue to fall consumers will stop spending in anticipation of even cheaper future prices. Eventually, such a cycle can lead to producers going out of business and job losses as a consequence. This is essentially what happened in Japan in the 1990s and even today the country is still struggling to recover from the phenomenon. CBI has revised down its forecast for Euro Zone growth from 0.9 per cent to 0.8 per cent in 2014 and from 1.4 per cent to 1.2 per cent for 2015. Similarly, OECD predicts growth of 1.1 per cent for 2015.
3 CBI International Economic Outlook December 20144 http://www.goldmansachs.com/our-thinking/outlook/2015
An evolving future
The outlook for the global economy is mixed, with world events, more sluggish growth and falling demand for oil and other commodities reducing expectations. At home, there is lower business confidence beyond the immediate planning horizon, as uncertainty over future economic policies and the domestic impact of the Euro Zone and worldwide political crises temper optimism.

21
An evolving future
The Logistics Report 2015 © Freight Transport Association
In January 2015, the European Central Bank (ECB) launched its long-awaited bid to revitalise the Euro Zone economy and counter deflation with a e60bn-a-month bond-buying programme that was far larger than investors had expected. The ECB’s move brings it closer into line with the US Federal Reserve and the Bank of England, which began buying Government debt following the 2008 global financial crisis.
The overall global outlook for 2015 therefore appears less positive than a year ago (figure 1.1).
“Making logistics even more efficient would mean the UK would become a more attractive place to invest and do business, as well as improving our economy and standard of living. Logistics continues to work hard to minimise the negative impacts of what it does. More could be done but achieving that requires well-informed, targeted and better support from Government.”
David Wells Chief Executive, FTA
FIGURE 1.1 • Global economic outlook for 2015
Economies reliant on export of natural resources experience weak growth
China (People’s Republic)
Australia
Canada
USA
France
GermanyIreland
ItalyJapan
Mexico
Spain
United Kingdom
Greece
Russia
Brazil
South Africa
India
7.0
0.1
China (People’s Republic)
2.2
2.5
Australia
2.0
Canada
3.2
USA
1.3
France
1.8
Germany2.5
Ireland
0.8Italy
Japan
2.7
Mexico
1.6
Spain
2.9
United Kingdom
0.8
Greece
–3.8
Russia
Brazil
2.1
South Africa
6.3
India
Note: Weather symbols indicate the projected performance for 2015 of each nation’s economy
Source: NIESR, February 2015

22
An evolving future
UK ECONOMY
Impressive economic performance but future outlook less positive
Overall, 2014 was a good year for the UK economy with growth increasing year-on-year accompanied by strong indications that the recovery that began in 2013 was spreading more widely through the economy as a whole. The annual GDP growth rate of 2.8 per cent5 was a marked improvement on the 1.7 per cent seen in 2013 and, significantly, the improvement was more broad-based with areas of the economy such as construction showing significant growth. At the same time unemployment continued to fall at a healthy pace, down to 5.7 per cent for October to December 2014 compared to 7.2 per cent for October to December 2013; in fact, the number employed is now approaching what is considered ‘full employment’.
In previous periods of recovery, inflation has tended to accelerate. However, the current recovery is notable for the fact that inflation has actually fallen. The December 2014 Consumer Price Index (CPI) inflation figure of 0.5 per cent (0 per cent by March 2015) equalled the lowest level on record and signalled that interest rate rises
5 ONS, Quarterly National Accounts, Quarter 4, March 2015
are less likely to occur than previously thought during 2015. Low inflation also helped to offset the modest wage growth seen throughout last year (1.8 per cent for the period September to November 2014). The falling inflation rate has been assisted in no small part by recent falls in the oil price, which has translated into lower prices at the pump. However, house prices have bucked the inflation trend, recording an annual rise of over 8 per cent and perhaps reflecting improved confidence ‘on the street’ that better times are ahead.
While there has been a lot of good news for the UK, there remain some causes for concern. For example, in the last year exports have remained subdued, mainly as a result of continuing economic weakness in the Euro
“A few countries, only a few, are driving growth ... One is the USA, where growth is solid, anchored and where we foresee 2015 will be also a good year. And the UK,
where clearly growth is improving, the deficit has been reduced, and where the unemployment is going down.Certainly from a global perspective this is exactly the
sort of result that we would like to see.”
Christine Lagarde Managing Director of the International Monetary Fund
(quoted in Financial Times 15 January 2015)
The Logistics Report 2015 © Freight Transport Association
23
An evolving future
Zone. This has been exacerbated by the falling value of the Euro against Sterling, making British exports more expensive. At the beginning of 2014, the pound bought around e1.20 but by the end of the year this had gone up to around e1.30. Elsewhere in the world, market impacts such as the slowdown in China are also affecting the UK economy. Finally, issues specific to the UK, such as continuing low productivity and lack of improvement in real terms in the fiscal balance, are also causes for concern.
It is these factors that have led to a UK growth forecast for 2015 of around 2.9 per cent. However, the good news for logistics is that oil prices are now predicted to remain low for some time, dampening the impact of UK fuel duty which remains the highest in the EU.
UK LOGISTICS MARKET
Short-term business confidence improves but uncertainty persists around the mid to long-term
Economic activity indicators for logistics improved in 2014. According to FTA’s Logistics Industry Survey 2014/2015, activity in the sector generally increased but the degree of activity was below expectation. Sea freight import and export volumes grew as consumer demand improved but air freight volumes were mixed. Although the number of operator licences continued to fall, the hgv market recovered in 2014 and economic expectations for 2015 are optimistic.
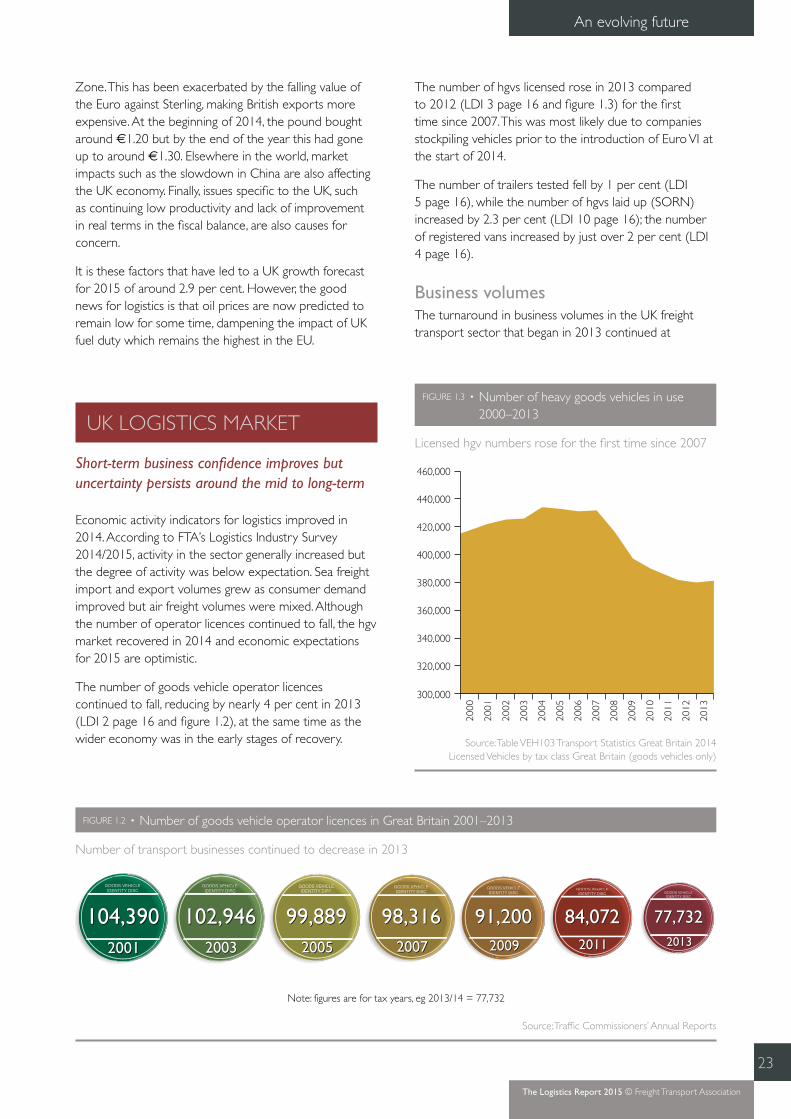
The number of goods vehicle operator licences continued to fall, reducing by nearly 4 per cent in 2013 (LDI 2 page 16 and figure 1.2), at the same time as the wider economy was in the early stages of recovery.
The number of hgvs licensed rose in 2013 compared to 2012 (LDI 3 page 16 and figure 1.3) for the first time since 2007. This was most likely due to companies stockpiling vehicles prior to the introduction of Euro VI at the start of 2014.
The number of trailers tested fell by 1 per cent (LDI 5 page 16), while the number of hgvs laid up (SORN) increased by 2.3 per cent (LDI 10 page 16); the number of registered vans increased by just over 2 per cent (LDI 4 page 16).
Business volumesThe turnaround in business volumes in the UK freight transport sector that began in 2013 continued at
FIGURE 1.2 • Number of goods vehicle operator licences in Great Britain 2001–2013
Number of transport businesses continued to decrease in 2013
EEELELEGOODS VEHICLEIDENTITY DISC
84,0722011
84,0722011
EEELELEGOODS VEHICLEIDENTITY DISC
77,7322013
77,7322013
EEELELEGOODS VEHICLEIDENTITY DISC
91,2002009
91,2002009
EEELELEGOODS VEHICLEIDENTITY DISC
98,3162007
98,3162007
EEELELEGOODS VEHICLEIDENTITY DISC
99,8892005
99,8892005
EEELELEGOODS VEHICLEIDENTITY DISC
102,9462003
102,946 2003
EEELELEGOODS VEHICLEIDENTITY DISC
104,3902001
104,3902001
Note: figures are for tax years, eg 2013/14 = 77,732
Source: Traffic Commissioners’ Annual Reports
FIGURE 1.3 • Number of heavy goods vehicles in use 2000–2013
Licensed hgv numbers rose for the first time since 2007
300,000
320,000
340,000
360,000
380,000
400,000
420,000
440,000
460,000
2012
2013
2010
2009
2008
2007
2006
2005
2004
2003
2002
2001
2000
2011
Source: Table VEH103 Transport Statistics Great Britain 2014Licensed Vehicles by tax class Great Britain (goods vehicles only)
The Logistics Report 2015 © Freight Transport Association

24
An evolving future
roughly the same pace into 2014. However, activity did not meet expectations as measured at the end of 2013 (figure 1.4). The activity figures were broadly in line with improved economic conditions witnessed in 2014 but the continued weakness in exports, especially to Europe, and a slowdown in the global economic recovery underline the fact that improvement in activity failed to reach expectations.
FTA conducted its annual Logistics Industry Survey in the final quarter of 2014; the majority of member respondents reported that activity within the domestic road freight sector had not met expectations for 2014. There was also weakening optimism for 2015, with 48 per cent of members surveyed expecting increased activity during this period but a similar percentage expecting activity to remain the same as 2014.
Across the top five sectors there was an increase in business expectation for 2015 compared to 2014 (figure 1.5). Most notable was construction, fuelled by the buoyant housing market, road improvements and other transport projects such as Crossrail. The largest
change came from recycling and waste disposal, reflecting continued growth in the recycling and waste disposal industry.6
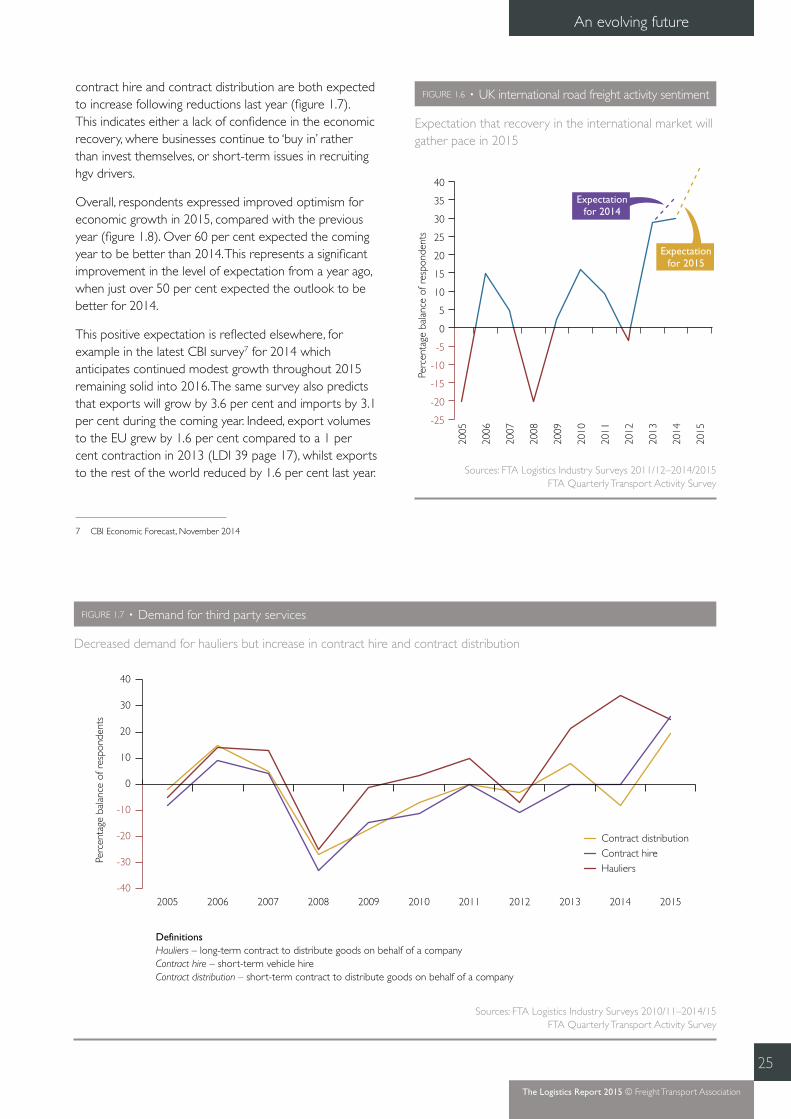
A similar picture was evident in the international road freight market, with expectation for 2014 exceeding actual activity (figure1.6). The continued sluggish rate of recovery in the EU affected UK exports; as a result, international freight activity did not live up to the expectations reported at the end of 2013.
Despite this, improvement was anticipated during the coming year – there remained optimism that reduced oil prices and increased fiscal stimulation in the EU would translate into improved international freight activity.
In the FTA Logistics Industry Survey 2013/2014 respondents reported that they expected to decrease their use of third party services. This trend was reversed according to the Logistics Industry Survey 2014/2015. The use of hauliers is expected to decrease but the use of
6 http://www.mrw.co.uk/news/opportunities-highlighted-in-growing-waste-sector/8661848.article
FIGURE 1.4 • UK domestic road freight activity sentiment
Expectation that there will be an increase in domestic activity in 2015
-40
-30
-20
-10
0
10
20
30
40
50
60
70
2013
2014
2012
2011
2010
2009
2008
2007
2006
2005
2015
Expectationfor 2015
Expectationfor 2014
Perc
enta
ge b
alan
ce o
f res
pond
ents
Note: Percentage balance of respondents is the net balance of positive and negative responses expressed as a percentage of totalresponses
Sources: FTA Logistics Industry Surveys 2011/2012–2014/2015FTA Quarterly Transport Activity Survey
FIGURE 1.5 • Business expectation for top 5 sectors for 2015 compared to 2014
Activity growth in top 5 sectors is still broadly positive
DIS
TRIB
UTI
O
N • HAULAGE
MA
NU
FA
CTURING
CO
NST
RUCTION
PUBL
IC A
UTHORITY
REC
YCLI
NG
• W
ASTE DISPOSAL
Note: Top sectors are defined by the number of respondents
60.47%
85.00%
46.43%
18.75%
53.85%
Percentage balance of respondents
Source: FTA Logistics Industry Survey 2014/2015
The Logistics Report 2015 © Freight Transport Association
25
An evolving future
FIGURE 1.6 • UK international road freight activity sentiment
Expectation that recovery in the international market will gather pace in 2015
Perc
enta
ge b
alan
ce o
f res
pond
ents
-25
-20
-15
-10
-5
0
5
10
15
20
25
30
35
40
2015
2014
2013
2012
2011
2010
2009
2008
2007
2006
2005
Expectationfor 2014
Expectationfor 2015
Sources: FTA Logistics Industry Surveys 2011/12–2014/2015 FTA Quarterly Transport Activity Survey
FIGURE 1.7 • Demand for third party services
Decreased demand for hauliers but increase in contract hire and contract distribution
-40
-30
-20
-10
0
10
20
30
40
Contract distributionContract hireHauliers
20152014201320122011201020092008200720062005
Perc
enta
ge b
alan
ce o
f res
pond
ents
DefinitionsHauliers – long-term contract to distribute goods on behalf of a companyContract hire – short-term vehicle hireContract distribution – short-term contract to distribute goods on behalf of a company
Sources: FTA Logistics Industry Surveys 2010/11–2014/15 FTA Quarterly Transport Activity Survey
contract hire and contract distribution are both expected to increase following reductions last year (figure 1.7). This indicates either a lack of confidence in the economic recovery, where businesses continue to ‘buy in’ rather than invest themselves, or short-term issues in recruiting hgv drivers.
Overall, respondents expressed improved optimism for economic growth in 2015, compared with the previous year (figure 1.8). Over 60 per cent expected the coming year to be better than 2014. This represents a significant improvement in the level of expectation from a year ago, when just over 50 per cent expected the outlook to be better for 2014.
This positive expectation is reflected elsewhere, for example in the latest CBI survey7 for 2014 which anticipates continued modest growth throughout 2015 remaining solid into 2016. The same survey also predicts that exports will grow by 3.6 per cent and imports by 3.1 per cent during the coming year. Indeed, export volumes to the EU grew by 1.6 per cent compared to a 1 per cent contraction in 2013 (LDI 39 page 17), whilst exports to the rest of the world reduced by 1.6 per cent last year.
7 CBI Economic Forecast, November 2014
The Logistics Report 2015 © Freight Transport Association

26
An evolving future
FIGURE 1.8 • Economic expectations for 2015
Improved optimism for 2015
Worse than 2014
Better than 2014
About the same as 2014
Source: FTA Logistics Industry Survey 2014/2015
Levels of UK competitiveness were also measured in the FTA Logistics Industry Survey 2014/2015. Respondents reported that competiveness had deteriorated both relative to the EU and globally when compared to 2013 (figure 1.9). This possibly reflects the weakened export picture seen in 2014, coupled with the strengthening of Sterling against the Euro.
Sea and air freightImports and exports have shown general improvement in both air and sea freight modes but the geographical picture is mixed. Air freight shows continuing underperformance compared to sea, with transportation prices winning out over customer sensitivity to speed of delivery. Air freight volumes were mixed during 2014, with some routes stagnating, Southern Africa deteriorating and growth mainly confined to the Far East and the Americas (figure 1.10). This may be a reflection of the stalled global recovery witnessed last year feeding into increased sensitivity to air freight costs.
Respondents to the FTA Logistics Industry Survey 2014/2015 who are involved in international shipping reported the strongest trade lane growth in North America (figure 1.11). South America continued the recovery which began in 2013. Africa and the Middle
“Our position as a global maritime centre will face increasing competition particularly from the Far
East. To secure our future and develop our sector we must be imaginative, innovative and inspire the next generation of entrepreneurs, embrace world-
beating new developments and encourage tomorrow’s maritime leaders.”
The Rt Hon John Hayes MP Shipping and Ports Minister, Department for Transport
FIGURE 1.9 • Level of competitiveness with EU and globally
Deterioration in perceived competitiveness of UK compared to other countries
1.0
1.1
1.2
1.3
1.4
1.5
1.6
1.7
201420132012201120102009
Level of competitiveness globally
Level of competitiveness with EU
Ave
rage
rat
ing
0 = Not at all competitive 4 = Extremely competitive
Source: FTA Logistics Industry Survey 2014/2015
The Logistics Report 2015 © Freight Transport Association

27
An evolving future
FIGURE 1.10 • Air freight shipping market sentiment in 2014
Air freight volumes less robust in 2014
Source: FTA Logistics Industry Survey 2014/2015
N Atlantic
S America S Africa
Australia
Far Eastinc Japan
W Europe
Middle East
No growth
Key
Imports
Exports
Increase
Decrease
Note: The size of the arrow boxes indicates degree of growth
The Logistics Report 2015 © Freight Transport Association

28
An evolving future
East both showed a deterioration in shipping market sentiment with imports for both regions showing flat growth. However, strength in Far East lanes continued, reflecting the greater resilience to the global economic slowdown to date of economies in these regions. Overall there were improvements in most lanes, including the
Mediterranean, where export growth moved back from negative to positive.
At the end of December 2014, the top country for UK exports was the US and the top trading partner for imports was Germany; this is the same as in 2013. Tables 1.1 and 1.2 show a 10-year comparison of the UK’s top 10 trading partners.
FIGURE 1.11 • Deep sea shipping market sentiment in 2014
Healthy growth in most shipping lanes
N America
S America
Africa
Australia
Far East
Scandinavia
E EuropeW Europe
MediterraneanMiddle East
Indiansubcontinent
No growth
Key
Imports
Exports
Increase
Decrease
Note: The size of the arrow boxes indicates degree of growth
Source: FTA Logistics Industry Survey 2014/2015
The Logistics Report 2015 © Freight Transport Association

29
An evolving future
TABLE 1.1 • UK top 10 trading partners – imports
Rank 2004 2014 10-year movement
Source: HM Revenue and Customs, Overseas Trade Statistics (December 2014)
1 Germany£35,606 million
Germany£59,365 million
2 USA£22,542 million
China£33,891 million
3 France£19,794 million
USA£32,863 million
4 Netherlands£18,010 million
Netherlands£31,068 million
5 Belgium£12,719 million
France£24,906 million
6 Italy£12,055 million
Belgium£20,585 million
7 China£10,628 million
Italy£16,633 million
8 Irish Republic£10,108 million
Norway£14,958 million
9 Norway£8,803 million
Spain£13,031 million
10 Spain£8,780 million
Irish Republic£11,695 million
TABLE 1.2 • UK top 10 trading partners – exports
Rank 2004 2014 10-year movement
Source: HM Revenue and Customs, Overseas Trade Statistics (December 2014)
1 USA£28,480 million
USA£38,858 million
2 Germany£21,540 million
Germany£31,432 million
3 France£18,452 million
Netherlands£22,553 million
4 Irish Republic£14,049 million
Switzerland£21,313 million
NEWENTRY
5 Netherlands£11,957 million
France£19,627 million
6 Belgium£10,190 million
Irish Republic£18,124 million
7 Spain£9,044 million
China£15,934 million
NEWENTRY
8 Italy£8,351 million
Belgium£12,597 million
9 Sweden£4,329 million
Spain£8,774 million
10 Japan£3,784 million
Italy£8,708million
The Logistics Report 2015 © Freight Transport Association

30
An evolving future
Rail freightGrowth of freight flows to international markets outside the EU is evidenced by continuing improvement in domestic intermodal services; these are strongly linked to deep sea container shipping outside the EU. These services showed a 3 per cent increase in 2014 compared to 2013 (see LDI 30 page 17), reflecting the steady growth of the UK economy. Bulk rail services fell by almost 7 per cent in 2014 compared to 2013 (figure 1.12). This is due to a decrease in the amount of coal moved and reflecting the downturn in the power generation sector during 2014.
Fuel prices Bulk fuel prices at the end of 2014 were all significantly down from a year earlier (table 1.3) due to the recent dramatic reduction in the price of crude oil. The price of a barrel of crude oil at the end of December 2014 was $57 which is almost half the $111 seen at the end of 2013. At an average of 94.2 pence per litre (ppl) for the month, bulk diesel prices in December 2014 were 14.1 per cent lower than a year before (LDI 49 page 17), and bulk gas oil prices were 24.3 per cent lower (LDI 50 page 17).
The outlook for 2015 is that fuel prices will continue to remain low, with reports that crude oil will remain cheap for several years to come.8 The main reasons cited for this are continuing weakness in demand and short to
8 http://www.bbc.co.uk/news/business-30913321
medium-term over supply mainly due to the rise in shale oil production in the US.
For bulk domestic diesel, the expectation is that the price will remain broadly unchanged throughout 2015 (figure 1.13). This reflects the emerging consensus that crude prices will stay low and that there will be no sharp upturn in demand in the UK.
FIGURE 1.12 • Rail freight moved by market segment 2003 to 2014
Intermodal rail freight continues to grow, whilst bulk rail freight falls back
Billio
n to
nne
kilo
met
res
0
2
4
6
8
10
12
14
16
18
2014
2013
2012
2011
2010
2009
2008
2007
2006
2005
2004
2003
Bulk or semi bulkDomestic intermodal
Source: Office of Rail and Road (ORR)
The Logistics Report 2015 © Freight Transport Association

31
An evolving future
There is a clear relationship between the price of crude oil and the bulk price of diesel but while there were year-on-year reductions of 14 per cent for bulk diesel prices, at the same time, the price of Brent Crude halved. This reduction in the barrel of oil is not directly manifested in bulk prices. The reason for this is twofold: fuel duty and the Sterling-Dollar exchange rate. Fuel duty at 57.95ppl dampens the impact of reductions in the cost of a barrel of oil on the bulk and pump price, reflecting the fact that fuel duty is specified in absolute terms (ie in pence per litre) rather than ad valorem (according to value). Additionally, because oil is traded in Dollars, the weaker Pound has reduced the effect of the drop in oil for UK consumers (£1 bought $1.56 in December 2014 compared to $1.64 in 2013).
In the case of road freight, fuel now represents around a third of total hgv operating costs for a 44 tonne articulated truck, down from around 40 per cent a year
TABLE 1.3 • Change in principal transport fuel costs in 2014
All fuel product prices significantly down
Product Application December 2013 price December 2014 price % change
Diesel Hgvs, vans 109.62ppl 94.18ppl -14.08
Gas oil Rail freight 63.36ppl 47.95ppl -24.32
Marine bunker fuel* Deep sea shipping 1,415 (index) 923 (index) -34.77
Jet kerosene Air freight $1,009.06/tonne $644.54/tonne -36.12
* Bunkerworld Index
FIGURE 1.13 • Bulk diesel prices and expectations for 2015
Fall in world oil prices dampens expectations of diesel prices
80
85
90
95
100
105
110
115
120
Jan
16
Oct
15
Jul 1
5
Apr
15
Jan
15
Oct
14
Jul 1
4
Apr
14
Jan
14
Oct
13
Jul 1
3
Apr
13
Jan
13
Oct
12
Jul 1
2
Apr
12
Jan
12
Oct
11
Jul 1
1
Apr
11
Jan
11
Oct
10
Jul 1
0
Apr
10
Jan
10
Oct
09
Jul 0
9
Apr
09
Jan
09
Penc
e pe
r lit
re (
ppl)
ex V
AT
Source: EnergyQuote JHA
“It’s really no coincidence that the combined power of lower oil prices, a 1p cut in duty in 2011 and its
continuing freeze by the Coalition Government, has put an extra £10bn of consumer spending power
into the economy. The UK being the fastest growing economy in the G8 is also the empirical proof for all
to see. The new Government, whatever its political makeup, would be foolhardy to ignore this hugely impactful fiscal stimulus and must pledge to lower
duty, and fully back an independent inquiry into fairer pricing at the pumps. Our campaigning continues for
the foreseeable future as Westminster sources tell us that the possibility of increasing fuel duty is back on
the agenda.”
Howard Cox Co-Founder of the FairFuelUK.com Campaign
The Logistics Report 2015 © Freight Transport Association

32
An evolving future
ago. In 2014, the fuel costs of operating a typical fleet of 10 x 44 tonne articulated trucks in the UK was £437,620.
Operating costsAccording to FTA’s Manager’s Guide to Distribution Costs, total operating costs for a 44 tonne articulated truck fell by 5.1 per cent in 2014 (figure 1.14). This compares favourably against a 1.6 per cent increase in the RPI inflation rate in the year to December 2014 and is a result of rises in some input costs being offset by a reduction in the price of fuel. Although hgv operating cost movement decreased in 2014, in the long-term it still remains higher than the haulage rate trend (which increased by 1.6 per cent) but the gap is narrowing.
The FTA Logistics Industry Survey 2014/2015 found that changes in input costs in 2014 compared to 2013 saw moderate increases, with the exception of fuel (figure1.15). The fuel duty freeze helped to reduce the impact of fuel price volatility, in tandem with significant falls in the price of a barrel of oil during the latter half of 2014. Other costs, such as repair and maintenance and insurance, also saw moderate increases, perhaps due to continued weak inflation throughout the economy.
Freight costsIn the FTA Logistics Industry Survey 2014/2015, respondents were asked whether freight costs for road, air, rail and sea modes had increased or decreased (figure
FIGURE 1.14 • Trends in operating costs and haulage rates 2005–2014
Hgv operating costs fall in 2014 due to drop in oil prices
100
104
108
112
116
120
124
128
132
136
140
144
RPIHaulage ratesHgv operating costs
2014201320122011201020092008200720062005
Inde
x Ja
n 20
05 =
100
Source: FTA Manager’s Guide to Distribution Costs
FIGURE 1.15 • Changes in input costs in 2014 compared to 2013
Reduction in fuel price due to decrease in crude oil price
-0.5
0
0.5
1
1.5
2
–2 =
dec
reas
ed a
lot,
2 =
incr
ease
d a
lot
Insurancecosts
Vehicleassetcosts
Repair andmaintenance
coss
Fuelprices
Wage rates
Source: FTA Logistics Industry Survey 2014/2015
FIGURE 1.16 • Changes in freight rate costs in 2014 compared to 2013
Slight increases seen across the board
-0.5
0.0
0.5
1.0
1.5
2.0
Roadfreightrates
(domestic)
Roadfreightrates
(international)
Railfreightrates
Seafreightrates
Airfreightrates
–2 =
dec
reas
ed a
lot,
2 =
incr
ease
d a
lot
Source: FTA Logistics Industry Survey 2014/2015
The Logistics Report 2015 © Freight Transport Association

33
An evolving future
1.16). Across all modes, the balance of opinion was that costs had increased, albeit by a marginal rate. Responses indicated that costs have increased the most for domestic road freight, followed by air. However, since the recent dramatic fall in oil prices we can expect fuel savings to be passed on to freight users and so it seems unlikely in the year ahead that freight costs will experience any significant increases.
Investment intentions In recent years the recession has had a profound impact on investment intentions, with stagnant business volumes and a poor export market leading to a reduction in investment plans. 2014 was an unusual year ; the economy
continued to grow albeit tentatively, unemployment fell to a level that almost equates to full employment and the price of a barrel of oil plummeted by the end of the year. However, there is still caution with regard to commitment to invest.
Credit terms remained broadly unchanged in 2014 compared to 2013, with 76 per cent indicating that there was ‘no change’ in credit from suppliers and a similar percentage (75 per cent) stating that there was ‘no change’ in credit from their own business to their suppliers. Around 15 per cent stated that credit from suppliers had ‘increased slightly’ with only 1 per cent stating that it had ‘increased a lot’.
FIGURE 1.17 • Commercial vehicle registrations 2000–2014
Hgv registrations fall in 2014, distorted by the Euro VI introduction at the beginning of last year
30,000
35,000
40,000
45,000
50,000
55,000
60,000
Hgv
reg
istr
atio
ns
180,000
200,000
220,000
240,000
260,000
280,000
300,000
320,000
340,000
360,000
Van
regi
stra
tions
201420132012201120102009200820072006200520042003200220012000
Note: In recent years the truck and coach licensing category names have changed. Hgv (heavy goods vehicle) is now lgv (large goods vehicle). For consistency in the document the term hgv is used
Source: SMMT
FIGURE 1.18 • Fleet investment intentions
Operators expect to purchase more vans and trailers in 2015 than in 2014
2014 (expected)
2014 (actual)
2015 (expected)
0 5 10 15 20 25 30 35 40 45
Percentage balance of respondents (%)
HGV FLEET
VAN FLEET
TRAILER FLEET
Source: FTA Logistics Industry Survey 2014/15
The Logistics Report 2015 © Freight Transport Association

34
An evolving future
Operating margins remained narrow in 2014 at 3 per cent, unchanged from 2013 (LDI 1 page 16) which is lower than the 4 per cent reported for 2010 and 2011.
The more positive UK economic picture is reflected in the levels of van registrations, which showed significant increases on the previous year. However, hgvs reversed the sharp upward movement of the previous year. It is important to note that 2013 figures are likely to have been distorted by operators bringing forward hgv purchases, prior to the introduction of Euro VI9 at the start of 2014 (figure 1.17).
Fleet investment intentions also saw continued improvement according to the FTA Logistics Industry Survey 2014/2015 (figure1.18). The balance of respondents for hgv, van and trailer fleets all showed that for 2014, investment increased. With the exception of the hgv fleet, expected levels for 2015 are higher, indicating that there is an anticipated requirement for increased capacity, in line with an expectation of increased business volumes for the coming year.
Respondents to FTA Logistics Industry Survey 2014/2015 indicated that other forms of large-scale investment plans for 2015 are downscaled from 2014, which in turn were downscaled from 2013 (figure 1.19). This indicates that while the business outlook is continuing to improve, there is still uncertainty around the mid to long-term.
9 The Euro VI exhaust emissions standard for new registrations came into effect on 1 January 2014
FIGURE 1.19 • Large scale business investment plans in 2014 and 2015
Uncertainty around long-term recovery reflected in fewer businesses committing to longer term investment
5
10
15
20
25
Acq
uire
d an
othe
rbu
sines
s
Relo
cate
d bu
sines
spr
emise
s
Rent
ed a
dditi
onal
dist
ribut
ion
prem
ises
Purc
hase
d ad
ditio
nal
dist
ribut
ion
prem
ises
Perc
enta
ge o
f res
pond
ents
2014 2015
0
Source: FTA Logistics Industry Survey 2014/2015
The Logistics Report 2015 © Freight Transport Association
35
An evolving future
Insight • Oil price and fuel duty
James Hookham Deputy Chief Executive, FTA
Global oil prices fell sharply in the second half of 2014 and continued to remain low at the beginning of 2015. This halving of the cost of a barrel of oil has been passed on ‘to an extent’ to industry and is saving businesses substantial costs; in January 2014 fuel represented 38 per cent of the total cost of running a 44 tonne truck, the annualised cost for fuel for such a vehicle was £52,000, this had dropped to an average of approximately £44,000 by January 2015 – a reduction of 16 per cent.
Lower fuel prices help equalise the cost of fuel distribution, deliveries and freight services in remote areas. So in theory the falling cost of oil is great news for the freight industry. However, other costs often cancel those savings out. Fuel duty of 57.95 pence per litre (ppl) is dampening the 50 per cent fall in bulk prices for hauliers. In addition, with oil traded in Dollars the weaker Pound reduces the effect of the drop in oil for UK consumers.
The freeze on fuel duty in the March 2015 Budget provided some much needed economic relief – not only to the logistics sector, which faces continuing difficult trading conditions, but also to the wider motoring public. As the UK economy continues on its path to recovery, a cut in fuel duty would provide just the kind of stability needed to give businesses the confidence to invest in their futures, to the benefit of the wider economy, customers and their employees and could deliver significant benefits including jobs, boosting GDP, and in some circumstances, deliver a net increase in tax revenue: a reduction in fuel duties (of 3ppl), would make an important contribution to this objective.
Challenges for 2015
Logistics is an essential enabler for other sectors of the economy, the goods that the UK produces and consumes reach their destinations efficiently because the country has an effective logistics system. Sometimes this is achieved in spite of barriers and burdens that are created through restrictions and taxation.
The global economic recovery is looking fragile, as a result of weaker growth in some emerging economies, civil unrest in parts of the world and concern over the future performance of the Euro Zone; this means that in spite of positive developments for the national finances, such as increased GDP, high employment and lower fuel costs, storm clouds are gathering. FTA surveys have found that members are less confident about prospects beyond the short-term.
The period since the recession has been difficult for business and logistics is no exception. It is an area of industry that faces the double challenge of low margins and an expectation of outstanding flexibility in the supply of the service levels the customer expects. The challenges inherent in the day-to-day task of delivering goods are increased by a lack of general understanding of what logistics does and, sometimes, decision-making that acts to impede the best use of resources. If logistics is made more expensive, as a result of additional costs or delays in transport networks, then this will affect the cost of living. But the converse is also true, reducing delays and removing additional costs can work in all our interests.
Fuel duty is a case in point – while increases may act as a disincentive for private motorists, the same is not the case for the commercial operators upon whom the economy depends. FTA supports initiatives to get private motorists out of their cars and onto public transport but Government should understand that the same principles do not apply to commercial vehicles – in our towns and cities logistics has no choice but to use the roads.
Government can help by:
❚ recognising the logistics sector’s ‘essential’ status – minimise regulatory and cost burdens on the industry; attach appropriate value and priority to freight operations
❚ reducing fuel duty for commercial vehicles beginning with an immediate 3 pence per litre cut in diesel duty; reinstatement of the reduced duty rate for biofuel; and, commitment to retain the fuel duty differential for road fuel gases. This would have the effect of reducing costs for UK plc whilst freeing up logistics operators to invest in newer, cleaner vehicles
The Logistics Report 2015 © Freight Transport Association

Changing lanes

Chapter 2

38
The Logistics Report 2015 © Freight Transport Association
The financial crisis precipitated some rethinking about the importance of infrastructure among the main political parties and a range of schemes and initiatives has been announced, from the Coalition Government’s National Infrastructure Plan and Roads Reform programme to further iteration of Labour’s National Infrastructure Commission through the review led by Sir John Armitt CBE.1
The UK remains woefully behind its European and global competitors. The latest competitiveness report from the World Economic Forum2 shows that out of the 144 countries included in the figures, the UK ranks 27th for the quality of its overall infrastructure; this is below the position of its economic rivals. Worse still, the competitive position of the road network has deteriorated compared
1 The Armitt Review: An independent review of long-term infrastructure planning commissioned for Labour’s policy review, September 2013 and letter from Sir John Armitt to Rt Hon Ed Balls MP, July 2014
2 The Global Competitiveness Report 2014–2015, World Economic Forum, 2014
with previous rankings, falling two places to 30th against international comparators. The rail network and ports fare a little better, at 16th. This picture is a cause for concern for logistics, especially in light of the continued delay over a decision on hub airport capacity, while other economies have invested in new runways and secured routes to emerging destinations.
During the 2010–2015 Parliament, spending on infrastructure increased from £45 billion a year in 2010–2013 to £50 billion a year in 2014–2015. New mechanisms were also put in place to target investment,
Changing lanes
The role of investment in infrastructure in securing competitive advantage is now better understood than before and politicians have recognised the strength of the arguments for long-term planning. But our transport networks need to be resilient, to withstand the shocks generated by the natural world and the new, global economic order.
“Failing to make it [infrastructure] a priority, or instead opting for quick electoral wins will see the UK’s competitiveness and resilience reduce and ultimately infrastructure will revert to its traditional ‘Cinderella status’.”
Nigel Baveystock Director General, Institution of Civil Engineers

39
Changing lanes
The Logistics Report 2015 © Freight Transport Association
together with the creation of a National Infrastructure Plan and publication of a Roads Investment Strategy.
Crucially, there has been recognition across the main political parties that investment in infrastructure is essential to growth and to our becoming the sort of economic powerhouse that we want to be. More significantly and positively still, there has been recognition that investment in one modal network should not automatically preclude or prejudice another. Both rail and road investment need to take place to secure economic advantage.
All these infrastructure schemes bring with them risks of unreliability – practical issues surrounding how these projects impact on logistics and the extent to which the disruption can be averted or at least mitigated – not just on the road network but also on the railways.
Announcements from the Coalition Government about infrastructure investment appear to indicate that the correct elements are being put in place to meet the UK’s infrastructure requirements. However, organisations such as the Confederation of British Industry (CBI)3, Engineering Employers’ Federation (EEF)4 and Institution of Civil Engineers (ICE)5 as well as FTA have warned that the confidence imbued by Government announcements on infrastructure is quickly eroded by “hard truths about the time and complexity of delivery”6 and political uncertainty on key schemes, such as airport expansion.
Creating a UK economy that is rebalanced towards investment and exports requires infrastructure to be at the top of the political agenda. According to the 2014 CBI/URS Infrastructure Survey7, 99 per cent of firms said that the quality or cost of infrastructure has a significant impact on their investment decisions. However, the survey indicates that there is still a lot of work to do, with 57 per cent of companies expecting transport infrastructure to worsen in the next five years.
3 Taking the Long View: a new approach to infrastructure, CBI, November 2014
4 A UK Infrastructure Authority: streamlining the infrastructure debate, EEF, July 2014
5 Manifesto for Infrastructure 2015, Institution of Civil Engineers, 2015
6 Taking the Long View: a new approach to infrastructure, CBI, November 2014
7 Taking the Long View: a new approach to infrastructure, Confederation of British Industry (CBI)/URS, November 2014
ROADS REFORM
Legislating to create a more efficient, accountable road operator with a longer-term investment strategy
The Coalition Government’s Roads Reform agenda moved ahead in 2014 with the publication of the Infrastructure Bill. The legislation it contains is central to changing the way that the strategic road network is delivered, managed and run, aiming to establish a roads operator/provider that can work fast and efficiently, provide better customer service and ensure value for money from investment.
“Knowing where we should be heading is the easy part. We need to see a rebalancing of our economy towards investment and exports. Getting there in practice however is going to be much harder, and requires us to take some tough, long-term decisions. This means the coming election is not just about the next five years – it is about the next 50.”
Katja Hall Deputy Director-General, CBI
“I don’t see better roads as an alternative to investment in rail or airports or ports. They are part
of the same thing: building a transport network that is reliable and fast.”
Rt Hon Patrick McLoughlin MP Secretary of State for Transport, December 2014

40
Changing lanes
The Logistics Report 2015 © Freight Transport Association
The Government is introducing a number of changes.
❚ Turning the Highways Agency into a government-owned strategic highways company – Highways England
❚ Putting in place a governance system for the new strategic highways company, which holds it to account whilst giving it the freedom to operate on a day-to-day basis
❚ Introducing a new, long-term ‘Roads Investment Strategy’, setting out a clear vision and a stable, long-term plan and performance expectations
❚ Setting up an independent watchdog – Transport Focus – and monitor – Office of Rail and Road – to represent the interests of road users, and to monitor the new strategic highways company
❚ Underpinning the reforms through legislation with the aim of providing a stable foundation for investment
Roads Investment StrategyAnnounced in December 2014, the Roads Investment Strategy (RIS) is a key part of the Government’s Roads Reform agenda and performs the roads equivalent of the SOFA (Statement of Funds Available) which already exists for the railways. It fulfils the requirements of the Infrastructure Act 2015 for the 2015/16–2019/20 period. Because it will become statutory in nature, road users will be provided with the greater certainty of funding that industry has been calling for. However, the funding outlined in the RIS was not ‘new money’ as it largely reflected increased commitments set out in the spending review the previous year. Significantly, there were no proposals for any new tolling.
The RIS outlines plans for 1,300 new lane miles on motorways and trunk roads in order to tackle congestion and fix some of the most notorious and longstanding problem areas on the UK road network. Launching the Roads Investment Strategy, the Transport Secretary, Rt Hon Patrick McLoughlin MP described it as “the biggest, boldest and most far-reaching roads programme for decades,” adding “It will dramatically improve our road network and unlock Britain’s economic potential.”
Road schemes identified in the RISThe £15 billion plan aims to triple levels of spending by the end of the decade to increase the capacity and improve the condition of England’s roads. The Roads Investment Strategy sets out a vision for the Strategic Road Network (SRN) and aims to deliver far greater consistency across it. As a result, investment will be focused on delivering: a network of ‘smart motorways’ and ‘expressways’; improvements to support the ‘Northern Powerhouse’ (including announcing a new study into a trans-Pennine tunnel); supporting growth and housing; better connections between key routes (eg Oxford to Cambridge) and to other end points (eg Mersey Port); and better safety and congestion outcomes (including a new study into the south west quadrant of M25).
New projects included:
❚ south west: a commitment of £2 billion to dual the entire A303 and A358 to the south west, including a tunnel at Stonehenge
❚ north east: setting aside £290 million to complete the dualling of the A1 all the way from London to Ellingham
❚ north west and Yorkshire: completing the smart motorway along the entire length of the M62 from Manchester to Leeds, together with improvements to trans-Pennine capacity from Manchester to Sheffield
“I would like to make a statement about our plan to invest £15 billion in England’s strategic road network. It is a new, 5-year, funded plan … we need it because the strategic roads network is the backbone of our economy and our way of life. Whether you drive or cycle or travel by bus and coach it matters. When you buy goods from the shops or travel to work it matters.”
Rt Hon Patrick McLoughlin MP Secretary of State for Transport, 1 December 2014

41
Changing lanes
The Logistics Report 2015 © Freight Transport Association
❚ north west: committing to improve links to the Port of Liverpool, as part of a plan of 12 projects designed to improve access to major international gateways
❚ south east: funding £350 million of improvements to the A27 along the south coast, tackling severe congestion at Arundel, Worthing and Lewes – consulting with the local community on options
❚ east of England: investing £300 million to upgrade east-west connection to Norfolk, by dualling sections of the A47 and improving its connections to the A1 and A11, building on the recently completed full dualling of the A11 from London to Norwich
❚ London and the south east: improving one-third of the junctions on the M25
❚ midlands: improving the M42 to the east of Birmingham
Devolution and the rise of the city regionsThe big devolution story of 2014 was, of course, the Scottish referendum on independence which took place in September. This initiated widespread debate over the high level political stakes and, to a lesser extent, appreciation of the practical implications of separation. In the event, the ‘no’ vote led to the deliberations of the Smith Commission to investigate what shape further devolution of powers to the Scottish Government/Parliament might take and ultimately legislation. In practice, the package of new laws that seems likely to emerge from this process addresses many of logistics’ concerns.
Draft legislation to give more powers to the Scottish Parliament was published at the end of 2014. The transport elements of the draft legislation appear to be in line with the proposals made by the Smith Commission in November. FTA made its recommendations to the Commission, highlighting five key objectives of maintaining safe, efficient and sustainable logistics throughout the UK8: free and open borders; fair competition for freight; quality and value for money services from motoring services agencies; consistent, fair and effective approach from safety regulators/agencies; and, high quality transport infrastructure networks. The Commission was also urged to “carefully consider the consequential impacts of its proposals on Scotland’s supply chains and logistics activities and aim to avoid the potential for new costs or market distortions to arise that would disrupt current economies of scale or borderless transport patterns.” The draft legislation provides the following.
8 FTA submission to Smith Commission, 2014 (http://www.smith-commission.scot/wp-content/uploads/2015/01/B00056.pdf)
❚ All aspects of fuel duty and excise duties will remain reserved to Westminster
❚ Power will be devolved to the Scottish Government to allow public sector operators to bid for rail franchises funded and specified by Scottish ministers but the regulatory framework for rail freight remains overseen by the Office of Rail and Road at a GB level
❚ Remaining powers to change speed limits will be devolved to the Scottish Parliament (hgv speed limits were already devolved and are now different in Scotland from England and Wales)
❚ Powers over all road traffic signs in Scotland will also be devolved although road traffic signage is governed by European and UN level conventions
❚ The functions of the British Transport Police (BTP) in Scotland will be a devolved matter (SNP policy is to merge BTP with Police Scotland)
Outside of transport there are changes to income tax and welfare powers and devolution of aggregates taxation but Corporation Tax will remain reserved.
City regions, and improving transport links with and between them, also assumed a high profile in transport politics in the year. This theme is explored in more detail in the next chapter.

42
Changing lanes
The Logistics Report 2015 © Freight Transport Association
INFRASTRUCTURE RESILIENCE
Investigating resilience failures and identifying ways to reduce network vulnerability
Efficient logistics requires that the principal transport arteries, be that strategic roads, key rail freight routes or ports and airports, all work effectively, whatever the weather. Unfortunately, serious and costly delays arise as a result of problems on local roads which are essential for access to distribution facilities and customers. The ability of the 180,000 miles of local roads network to cope with flooding, ice and snow have been found wanting as local authorities’ budgets come under increasing pressure, whilst severe weather serves to compound existing issues with the condition of the road surface on these roads.
Following the winter of 2013/2014 when transport networks were under severe strain as a result of extreme weather events the Richard Brown Transport Resilience Review took place. The review was tasked with seeking practical measures to improve the resilience of transport infrastructure to severe weather. In particular the review considered impacts such as major disruption at Gatwick Airport and the Port of Immingham and the severing of the rail link to the west of England when the rail track was washed away at Dawlish. The report noted
that “we were particularly struck that the disruption at both Gatwick Airport and the Port of Immingham was substantially increased by the unanticipated flooding of IT servers and electricity substations.” The final report9 also considered the effects of winter weather on local roads and estuarial crossings, making a number of recommendations that the Government has accepted and will need to put actions in place to address.
Many of the recommendations focused on the need for improved communications between transport organisations and between infrastructure providers and users. A further recommendation concerned ways of reducing the need to close estuarial crossings, for example the Dartford Crossing, in the case of high winds where this was because of the concern that high-sided vehicles using the infrastructure may blow over. Discussions have been taking place on proposals for increased restrictions on high-sided vehicles in these circumstances. However, from a logistics perspective the perennial issue of a lack of suitable alternative routes remains a cause of concern.
Roads that are in poor condition also add to damage and maintenance costs for vehicles. Analysis of insurance
9 Transport Resilience Review: A review of the resilience of the transport network to extreme weather events, July 2014

43
Changing lanes
The Logistics Report 2015 © Freight Transport Association
data10 shows that councils in some of the areas worst hit by the winter storms of 2013/2014, such as Kent, the West Country and the area around the River Thames, saw claims for pothole damage rise by 23 per cent. Across the UK it was reported that more than 26,000 compensation claims had been made in the past financial year (2013/14), an increase of 13 per cent on the previous year. The same report claimed that official figures showed that councils in England, Wales and Scotland had paid out more than £5 million in compensation for potholes or other road damage in the past two financial years.
Managing improvements and repairsThe role of the Infrastructure Act in promoting longer-term certainty over infrastructure investment was welcomed by those engaged in logistics as a sign that the stop-start approach that has previously characterised investment in transport networks in particular may be close to being addressed. In addition to the benefits of greater confidence over infrastructure provision in the future and its effect on inward investment, the new arrangements have potential to address the House of Commons’ Public Accounts Committee’s concerns that “piecemeal stop-and-go” investment in England’s (strategic) road system was making cost-effective maintenance difficult.11 There is uncertainty over the actions of a new Government and industry is seeking reassurance that important road, rail and airport decisions will not be delayed.
Perversely, the works necessary to improve infrastructure are themselves a cause for disquiet. They present challenges both in terms of effective communications with road users to understand the timing and scale of roadworks and because the works themselves typically disproportionately affect night time traffic. Freight is affected by closures, long diversions and capacity restrictions on the Strategic Road Network and on the rail network. The High Speed 2 development is a significant cause for concern in terms of its impact on existing rail freight facilities and services during the construction phase. The disruption resulting from engineering overruns on the rail network, such as the chaos at King’s Cross over Christmas and New Year 2014, causes problems for business as a mover of goods as well as people; measures to prevent such overruns in future, such as additional restrictions on access during engineering works, may further exacerbate impacts on freight services.
10 Britain’s pothole problem worsens, press release from LV=, 7 November 2014
11 http://www.parliament.uk/business/committees/committees-a-z/commons-select/public-accounts-committee/news/report-strategic-infrastructure-roads/
RELIABILITY OF FREIGHT
Urban road networks continue to deteriorate and rail is still seen as more reliable
The improved economic picture in 2013 is evident in the upturn in traffic volumes for hgvs and vans. According to latest data, hgv traffic increased by 1.3 per cent in 2013 compared with 2012, while van traffic increased by 3.2 per cent. Despite this slight increase hgv traffic is still 14 per cent below its 2007 pre-recession peak (figure 2.1).
The perceived rate of deterioration in reliability on the road network due to congestion has increased to pre-recession levels (figure 2.2). This is, in part, an indication of the impact of the increase in domestic road freight activity levels with the rate of deterioration in reliability falling on both the motorways as well as urban roads. A reduction in congestion on the UK road network is crucial for road freight operators – a further reason why FTA voiced its support for the Roads Investment Strategy as good news for the logistics industry.
Data from the Department for Transport for road congestion on locally managed ‘A’ roads in England indicated that the average speed during the weekday morning peak in the year ending September 2014 was 24.1mph. This is a 0.7 per cent decrease on the previous year.
FIGURE 2.1 • Road traffic (billion vehicle miles) 2000–2013
Hgv traffic shows slight improvement in 2013
0
5
10
15
20
25
30
35
40
45
Hgvs
Vans
Billio
n ve
hicl
e m
iles
2013
2012
2011
2010
2009
2008
2007
2006
2005
2004
2003
2002
2001
2000
Source: Transport Statistics Great Britain 2014 Table TRA0101 (TSGB0701)

44
Changing lanes
The Logistics Report 2015 © Freight Transport Association
In the final quarter of 2014, average speeds on the local ‘A’ roads in England were slower across October, November and December, with decreases of 2.3 per cent, 2.8 per cent and 2.6 per cent respectively, compared to the same months in 2013.
A combination of increases in levels of traffic on the ‘A’ road network and intermittent periods of high rainfall levels are likely to have contributed to the fall in speeds observed between March 2012 and December 2014.
In terms of reliability 78.3 per cent of journeys on the Highways England network were ‘on time’ in the year ending September 2014 (figure 2.3).
In July 2014 Government announced that an increased hgv national speed limit on single and dual carriageways in England and Wales would come into force in 2015. This was a move generally supported by logistics as beneficial for road safety as it would result in the differential between hgvs and other vehicles being reduced, as well as allowing road capacity to be used more effectively and safely and promoting more efficient movement of goods.
FIGURE 2.2 • Reliability of the road network
Continued deterioration in reliability on the road network
201420132012201120102009200820072006-70
-60
-50
-40
-30
-20
-10
0
Overall Urban/city roads Motorway/trunk roads
Per
cent
bal
ance
of r
espo
nden
ts
Sources: FTA Logistics Industry Surveys 2010/11–2014/15FTA Quarterly Transport Activity Survey
FIGURE 2.3 • Percentage of journeys on Highways England motorways and ‘A’ roads deemed on time: April 2010 to September 2014
A slight improvement in ‘on time’ journeys compared to 2013
65
70
75
80
85
90
Perc
enta
ge o
f jou
rney
s on
tim
e
Notes: 1 ‘Journeys’ are defined as travel between adjacent junctions on the network2 An ‘on time journey’ is defined as one completed within a set reference time, drawn from historic data on that section of road 3 Reference times are updated for the April data each year. Further information on the impact of updating reference times can be
found in the latest statistical release4 Data to December 2012 were revised in March 2013 as a result of the implementation of planned methodology changes
Sept
embe
r 20
14A
ugus
t 20
14Ju
ly 2
014
June
201
4M
ay 2
014
Apr
il 20
14M
arch
201
4Fe
brua
ry 2
014
Janu
ary
2014
Dec
embe
r 20
13N
ovem
ber
2013
Oct
ober
201
3Se
ptem
ber
2013
Aug
ust
2013
July
201
3Ju
ne 2
013
May
201
3A
pril
2013
Mar
ch 2
013
Febr
uary
201
3Ja
nuar
y 20
13D
ecem
ber
2012
Nov
embe
r 20
12O
ctob
er 2
012
Sept
embe
r 20
12A
ugus
t 20
12Ju
ly 2
012
June
201
2M
ay 2
012
Apr
il 20
12M
arch
201
2Fe
brua
ry 2
012
Janu
ary
2012
Dec
embe
r 20
11N
ovem
ber
2011
Oct
ober
201
1Se
ptem
ber
2011
Aug
ust
2011
July
201
1Ju
ne 2
011
May
201
1A
pril
2011
Mar
ch 2
011
Febr
uary
201
1Ja
nuar
y 20
11D
ecem
ber
2010
Nov
embe
r 20
10O
ctob
er 2
010
Sept
embe
r 20
10A
ugus
t 20
10Ju
ly 2
010
June
201
0M
ay 2
010
Apr
il 20
10
In year ending
In month
Source: Department for Transport Road Congestion Statistics Table CGN 0104
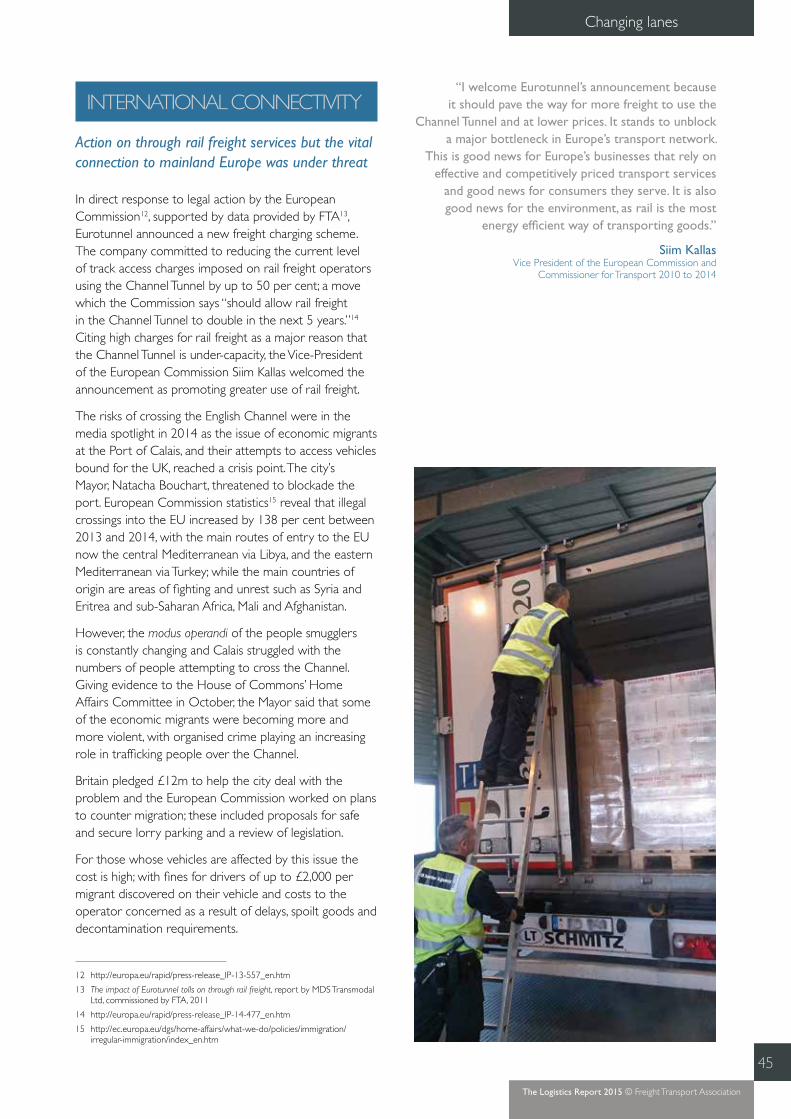
45
Changing lanes
The Logistics Report 2015 © Freight Transport Association
INTERNATIONAL CONNECTIVITY
Action on through rail freight services but the vital connection to mainland Europe was under threat
In direct response to legal action by the European Commission12, supported by data provided by FTA13, Eurotunnel announced a new freight charging scheme. The company committed to reducing the current level of track access charges imposed on rail freight operators using the Channel Tunnel by up to 50 per cent; a move which the Commission says “should allow rail freight in the Channel Tunnel to double in the next 5 years.”14 Citing high charges for rail freight as a major reason that the Channel Tunnel is under-capacity, the Vice-President of the European Commission Siim Kallas welcomed the announcement as promoting greater use of rail freight.
The risks of crossing the English Channel were in the media spotlight in 2014 as the issue of economic migrants at the Port of Calais, and their attempts to access vehicles bound for the UK, reached a crisis point. The city’s Mayor, Natacha Bouchart, threatened to blockade the port. European Commission statistics15 reveal that illegal crossings into the EU increased by 138 per cent between 2013 and 2014, with the main routes of entry to the EU now the central Mediterranean via Libya, and the eastern Mediterranean via Turkey; while the main countries of origin are areas of fighting and unrest such as Syria and Eritrea and sub-Saharan Africa, Mali and Afghanistan.
However, the modus operandi of the people smugglers is constantly changing and Calais struggled with the numbers of people attempting to cross the Channel. Giving evidence to the House of Commons’ Home Affairs Committee in October, the Mayor said that some of the economic migrants were becoming more and more violent, with organised crime playing an increasing role in trafficking people over the Channel.
Britain pledged £12m to help the city deal with the problem and the European Commission worked on plans to counter migration; these included proposals for safe and secure lorry parking and a review of legislation.
For those whose vehicles are affected by this issue the cost is high; with fines for drivers of up to £2,000 per migrant discovered on their vehicle and costs to the operator concerned as a result of delays, spoilt goods and decontamination requirements.
12 http://europa.eu/rapid/press-release_IP-13-557_en.htm
13 The impact of Eurotunnel tolls on through rail freight, report by MDS Transmodal Ltd, commissioned by FTA, 2011
14 http://europa.eu/rapid/press-release_IP-14-477_en.htm
15 http://ec.europa.eu/dgs/home-affairs/what-we-do/policies/immigration/irregular-immigration/index_en.htm
“I welcome Eurotunnel’s announcement because it should pave the way for more freight to use the
Channel Tunnel and at lower prices. It stands to unblock a major bottleneck in Europe’s transport network.
This is good news for Europe’s businesses that rely on effective and competitively priced transport services
and good news for consumers they serve. It is also good news for the environment, as rail is the most
energy efficient way of transporting goods.”
Siim Kallas Vice President of the European Commission and
Commissioner for Transport 2010 to 2014

46
Changing lanes
The Logistics Report 2015 © Freight Transport Association
FACILITATING GROWTH IN
RAIL FREIGHT
Ensuring that investment and regulation works with logistics, not against it
The UK Government’s National Networks National Policy Statement for England (NNNPS) was published in December. The publication followed a year-long consultation and sets the policy against which the Secretary of State for Transport will make decisions on applications for development consent for nationally significant infrastructure projects on the road and rail networks and strategic rail freight interchanges. The Statement was generally welcomed by business, with its recognition of the importance of strategic rail freight interchanges to delivering the growth potential of rail freight.
Plans for the construction of High Speed 2 faced intense political and public scrutiny during the year. But they also proved to be of concern to logistics interests. Various rail freight interests have petitioned in respect of the High Speed 2 Bill to ensure that issues for rail freight are properly addressed, including provision for freight to use the new high speed line for traffic such as parcels, and released capacity on the ‘classic’ network once the line is built. High Speed 2’s promoters and
supporters claim freight will benefit from capacity that will be released on the existing network once the high speed line is built. However, there may be pressure from towns along the southern West Coast Main Line for more connecting services to London, because of concerns that they may become economic backwaters as they are not on HS2; this could put any released capacity ‘at threat’. Clarification was also sought on the regulatory process, around franchising and track access agreements, involving the Office of Rail and Road (ORR) and Department for Transport for the allocation of suitable, usable, released capacity.
The Office for Rail and Road was itself subject to criticism in the past over its handling of increases to track access charges for freight and its approach to ‘captive’ rail freight customers. In 2014 the challenge was therefore to improve communications and understanding between rail freight customers and the industry’s regulator and its infrastructure provider.
The importance of measures to allow more customers to access rail freight services is underlined by perceptions of road and rail reliability. In the FTA Logistics Industry Survey 2014/15 it was found that the rail network generally maintained its reliability advantage over the road network (figure 2.4) with both intermodal and bulk services improving in 2014 compared to 2013, in contrast to the perceived rate of deterioration in the road network.
FIGURE 2.4 • Road and rail network reliability
Rail retains network reliability attractiveness over road
-80
-60
-40
-20
0
20
40
Overall road networkIntermodalBulk or semi-bulk
Perc
enta
ge b
alan
ce o
f res
pond
ents
201420132012201120102009200820072006200520042003
Sources: FTA Logistics Industry Surveys 2010/11–2014/15 FTA Quarterly Transport Activity Survey

47
Changing lanes
The Logistics Report 2015 © Freight Transport Association
AIR FREIGHT
A decision on a hub airport is urgently needed to protect economically vital air freight services
Burgeoning middle and high income populations in the emerging economies, especially South America and the Near and Far East, are changing trade patterns and the demand for goods. Analysis prepared for the Airports Commission16 argues that UK aviation will not evolve in isolation from these themes and is likely to be driven by two developments.
❚ A rise in inbound travel from emerging market economies and an associated rise in competition from airlines serving them. The growth of the middle class in countries (predominantly in south east Asia) is likely to lead to more point-to-point long haul traffic
❚ New aircraft that are coming into operation, notably the Boeing 787 and the Airbus A350. These are 20 per cent more fuel-efficient than the models they replace and quieter. They are also expected to make it easier for lower-cost carriers to enter the long haul market
The concern is that if the UK fails to expand hub airport capacity it could be sidelined as these developments gather pace which would be bad for the economy. Commenting on the research, Howard Davies, Chair of the Commission said: “with additional runway capacity around London, these trends suggest more direct routes will be available to economically significant destinations, and an increase in the frequency of service on existing routes. Passengers and freight operators would benefit from the time saved from taking a more convenient or more direct route. There would be more airline competition, too, which would be likely to reduce costs.”17
The Commission continued its task of examining the need for additional UK airport capacity and recommending to Government how this can be met in the short, medium and long-term in 2014. In September it announced that the proposed inner Thames estuary airport, the so-called ‘Boris Island’ advocated by the Mayor of London, was not to be one of the shortlisted options. This left the option of a second runway at Gatwick or a third runway at Heathrow, with the final decision to be announced after the General Election in 2015.
16 Expanding Airport Capacity: Competition and Connectivity – The case of Gatwick and Heathrow, International Transport Forum and SEO Economic Research, 2014
17 Let London’s airports achieve potential, Financial Times, 17 December, 2014
In research commissioned for FTA and Transport for London18 six key comparisons were made comparing the Gatwick and Heathrow expansions with ‘No expansion’ (table 2.1).
The report showed that of the three options, the Heathrow expansion provided the greatest significant economic benefits, in terms of cost reduction, job
18 Implications for the Air Freight Sector of Different Airport Capacity Options, prepared for the Freight Transport Association and Transport for London, final report, York Aviation, 2015
“There are potentially serious implications for air freight operations, with knock on implications for the
broader freight industry and freight users arising from a failure to expand capacity or in going for the
wrong option.”
Chris Welsh Director of Global and European Policy, FTA

48
Changing lanes
The Logistics Report 2015 © Freight Transport Association
creation and minimisation of extra costs associated with increased freight transit times. For the six key freight comparisons, the Heathrow expansion was on average 43 per cent more economically beneficial than ‘No expansion’, whereas Gatwick was only on average 15 per cent more beneficial than ‘No expansion’.
The Government’s decision to leave the current night flights regime for Heathrow, Gatwick and Stansted airports in place until 2017 was intended to ensure regulatory stability during the Airports Commission’s deliberations. Logistics had reiterated the importance of night flights to UK economic competitiveness.
Port and airport congestion dataThe FTA Logistics Industry Survey 2014/2015 asked users of the country’s seaports and airports to rate the improvement or deterioration in congestion. Respondents who use seaports overwhelmingly indicated that congestion had become worse in 2014 (figure 2.5). Of particular concern were the capacity of access roads and the availability of suitable roads for inland haulage of containers. The former issue reflects a general consensus within the industry that the road network as a whole is in desperate need of improvement and investment.
Respondents who utilise airports provided a different response. It was felt that there was neither improvement nor deterioration in UK international airport congestion, whilst there was a modest easing for regional airports. This probably reflects the continued weakness in UK exports, particularly for high value items which are more likely to be moved by air.
TABLE 2.1 • Comparison of ‘No expansion’ to London airports with Gatwick second runway and Heathrow third runway
Projections to 2050No
expansionGatwick
second runwayHeathrow
third runwayGatwick second
runway % difference Heathrow third runway
% difference
Truck elsewhere (m tonnes) 2.1 1.7 1.2 19.05% 42.86%
Cost of trucking elsewhere (£m) 41.6 36.1 23.5 13.22% 43.51%
Freight user time costs (£m) 378 321 213 15.08% 43.65%
Lost GVA to wider economy (£m) 978 836 551 14.52% 43.66%
Lost GVA to sector’s economy (£m) 637 544 359 14.60% 43.64%
Jobs not created 6,800 5,800 3,800 14.71% 44.12%
GVA – Gross Value Added measures the contribution to the economy of each individual product, industry or sector in the UK
FIGURE 2.5 • UK port congestion in 2014
Deterioration in all aspects of port congestion
-0.5
-0.4
-0.3
-0.2
-0.1
0.0Pe
rcen
tage
bal
ance
of r
espo
nses
negative value indicates deterioration
Capacityof rail access links to ports
Availability of road inland haulage for containers
Availability of rail inland haulage for containers
Capacityof access
roads to ports
Capacityof theports
Source: FTA Logistics Industry Survey 2014/2015

49
Changing lanes
The Logistics Report 2015 © Freight Transport Association
SEA FREIGHT
Bigger ships start to make waves
In the year that saw the 100th anniversary of the first ship crossing the Panama Canal a new generation of vast ships were making their presence felt. The canal that once set the standard for ship size is itself now being expanded to fit ships that are too big for it; these vessels, a quarter of a mile long, wider than a motorway and capable of carrying up to 18,000 containers are changing the world of shipping.
Improvement in the global economy continued to be patchy in 2014 and in the key ocean trades there were still less than optimal load factors. In spite of this, congestion worsened in a number of ports around the world affecting supply chains due to a range of factors including: coping with and accommodating the new generation of mega-container vessels; bunching of vessels at ports of origin and destination (a factor exacerbated by the reduction in vessels as a result of the formation of new alliances): and the increasing problem of adherence to sailing schedules resulting in significant delays and sub-optimal performance of the maritime container supply chain.
The problems were most acute in the US west coast ports of Los Angeles and Long Beach, key transhipment ports in Asia such as Hong Kong and Singapore and ports in Europe such as Rotterdam. With shippers in the US and Europe often experiencing delays of five to 10 days, this prompted the US Federal Maritime Commission to convene a series of seminars to discuss the problem and identify actions that will improve the situation.
In the US, ports in general are not able to receive the very largest of the new container ships and this factor also seemed to be a significant contributing factor to cargo delays in northern Europe as well. A further factor was that in several US west coast ports, the terminus for the very large Asia-US trans-Pacific trade, drawn out negotiations on a new labour agreement between terminal operators and longshore labour skewed normal load factors considerably.
UK shippers also experienced delays at ports with acute problems in obtaining inland transport deliveries (figure 2.5). This appeared to be attributable to a range of issues, including inland transport haulage shortages, problems with container availability and driver shortages and insufficient investment in inland transport logistics operations.
Following an FTA-convened meeting between the key parties in the maritime supply chain an action plan was

50
Changing lanes
The Logistics Report 2015 © Freight Transport Association
developed. Better communication and planning between the commercial players will be essential but Government also has a role to play in ensuring the maintenance and improvement of road and rail connections to ports, and provision of necessary rail interchanges through the planning process, as well as in addressing issues such as the driver shortage that impact the flexibility of logistics.
Shipping has also been affected by the Chinese authorities’ rejection of the P319 in June 2014; the world’s top 16 container shipping lines quickly reconfigured their strategic partnerships in four major alliances which now dominate the world’s main liner trades, with knock on effects for many small liner markets. Global container alliances appear to be here to stay. They are arguably necessary in the current global economic context as this is the only means by which container lines can achieve global coverage to compete in the modern global economy.20 Even if such alliances are not necessary for
19 The P3 was a proposed global network alliance between Maersk Line, CMA-CGM and Mediterranean Shipping Company (MSC). After scrutiny by the Federal Maritime Commission and European Commission, it was ultimately rejected in June 2014 by the Chinese Ministry of Commerce which had concerns about the concentration of market power and the effect on competition
20 http://worldmaritimenews.com/archives/139116/drewry-mega-alliances-will-help-container-industry-recover/
the lines’ survival as suggested above, they are preferable to the alternative, namely consolidation of the container shipping industry, most likely through greater merger and acquisition leading to far fewer industry participants than at present.
While shippers are broadly supportive of traditional consortia and vessel sharing agreements, many are concerned that the new breed of alliances go well beyond vessel sharing in terms of their scale, the sharing of information and data on capacity, costs and pricing in the context of conference and rate discussion agreements, such as the Transpacific Stabilization Agreement and Intra-Asia discussion agreement. For example, UK shippers transhipping goods via Singapore and Hong Kong from and to intra-Asia points of origin may unknowingly be subject to rate agreements covering non-European transhipment ocean legs.
The arrival of these mega-alliances, and resulting reduction in sailings combined with the potential for bunching of vessels, seems likely to compound the problems experienced with port congestion around the world, including the UK. This underlines the need for action in those areas that Government can influence, such as infrastructure investment and skills.
Insight • Giving road users a say in how roads are managed is crucial
Karen Dee Director of Policy, FTA
2014 saw perhaps the biggest revolution in roads policy for more than a decade. The Government’s roads reform agenda, made a reality by the Infrastructure Act, promises to deliver just the kind of increased certainty of funding that FTA has been calling for. For the first time, the ‘roads budget’ will be fixed for a five-year period and, because it is underpinned by legislation, it is much less likely to become the victim of changing Government priorities. This should ensure that the taxpayer gets better value for money by establishing a longer-term plan for the improvements that need to be delivered.
But the most crucial change will be the way in which road users’ views will be taken into account. Transport Focus21 has been tasked with ensuring that all those using strategic roads can influence what Highways England22 delivers, how and when.
The Strategic Road Network (SRN) represents only 2 per cent of roads, but it carries 66 per cent of the freight. And at night lorries are in the majority. Logistics operators need to know that the roadworks due to start at 8pm, actually start at 8pm and not at 6pm because the contractor thought it was a good idea. They need to know that the planned route schedule which allows a single driver to make all the customer drops needed within drivers’ hours rules will not require two drivers in two vehicles in future, simply because the roads are too congested. FTA is working with Transport Focus to ensure that the freight view is heard – so far, the indications are good.
21 Passenger Focus was given a new role to act as a Road User ‘champion’ and was renamed Transport Focus from 1 April 2015
22 The Highways Agency became a Government-owned company on 1 April 2015 and was renamed Highways England

51
Changing lanes
The Logistics Report 2015 © Freight Transport Association
Challenges for 2015
The lack of investment in infrastructure over recent decades has set the UK economy back, both in terms of world standing and the country’s ability to compete in a global economy. World Economic Forum rankings (see page 38) show how far the UK has fallen behind its competitors and even some less advanced economies. Even though investment in infrastructure has formed an important element of recent spending announcements, businesses are still to be convinced that much-needed and often complex schemes will not be delayed or eliminated at the stroke of a pen; this affects confidence and inward investment.
FTA has called on Government to invest more in the country’s transport infrastructure, and to ensure that the planning system operates in a way which encourages business to do the same. Such investment must include all of the modes available in the UK. Smarter use of road infrastructure, improved rail lines and access points, and better links for ports around the UK would help make the best use of the country as a whole. Additional hub airport capacity is also essential, to ensure the UK can compete in the global economy for the movement of high value goods.
Congestion on the road network is a waste of time and increases costs and emissions. It also creates uncertainty in movements which means operators have to deploy more vehicles and run them less efficiently. In order to tackle pinch points, it is essential that Government honours current commitments on the roll-out of hard shoulder running programmes and a targeted infrastructure improvement programme, as outlined in FTA’s own Trade Routes publication. FTA urges Government to ensure that in congested spaces on the national network, or in our cities, priority is given to journeys – such as freight journeys – which deliver the biggest economic benefit and which have the fewest alternative options.
The future economic outlook may be mixed but industry consensus is forming around the need for sound investment and early decisions to help support the long-term recovery and lay the foundations for future fundamental improvements in competitiveness.
Government can help by:
❚ investing in national transport infrastructure – improving road pinch points, making smarter use of existing motorways and improving rail networks and port access
❚ encouraging and enabling private sector investment in transport – such as rail freight interchanges, ports and high quality lorry parking facilities
❚ committing to a plan for increased hub aviation capacity and preserving current access to night flights – thus defending the UK’s competitive position in global air freight services

Into the city

Chapter 3
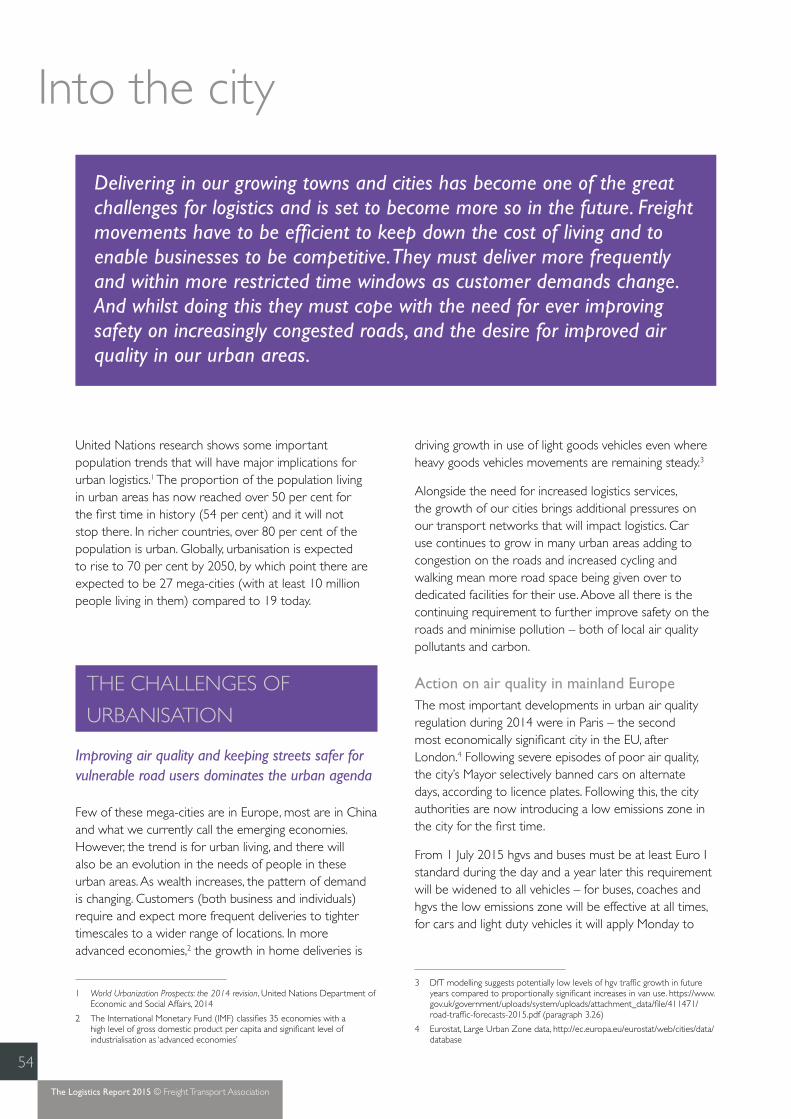
54
The Logistics Report 2015 © Freight Transport Association
United Nations research shows some important population trends that will have major implications for urban logistics.1 The proportion of the population living in urban areas has now reached over 50 per cent for the first time in history (54 per cent) and it will not stop there. In richer countries, over 80 per cent of the population is urban. Globally, urbanisation is expected to rise to 70 per cent by 2050, by which point there are expected to be 27 mega-cities (with at least 10 million people living in them) compared to 19 today.
THE CHALLENGES OF
URBANISATION
Improving air quality and keeping streets safer for vulnerable road users dominates the urban agenda
Few of these mega-cities are in Europe, most are in China and what we currently call the emerging economies. However, the trend is for urban living, and there will also be an evolution in the needs of people in these urban areas. As wealth increases, the pattern of demand is changing. Customers (both business and individuals) require and expect more frequent deliveries to tighter timescales to a wider range of locations. In more advanced economies,2 the growth in home deliveries is
1 World Urbanization Prospects: the 2014 revision, United Nations Department of Economic and Social Affairs, 2014
2 The International Monetary Fund (IMF) classifies 35 economies with a high level of gross domestic product per capita and significant level of industrialisation as ‘advanced economies’
driving growth in use of light goods vehicles even where heavy goods vehicles movements are remaining steady.3
Alongside the need for increased logistics services, the growth of our cities brings additional pressures on our transport networks that will impact logistics. Car use continues to grow in many urban areas adding to congestion on the roads and increased cycling and walking mean more road space being given over to dedicated facilities for their use. Above all there is the continuing requirement to further improve safety on the roads and minimise pollution – both of local air quality pollutants and carbon.
Action on air quality in mainland EuropeThe most important developments in urban air quality regulation during 2014 were in Paris – the second most economically significant city in the EU, after London.4 Following severe episodes of poor air quality, the city’s Mayor selectively banned cars on alternate days, according to licence plates. Following this, the city authorities are now introducing a low emissions zone in the city for the first time.
From 1 July 2015 hgvs and buses must be at least Euro I standard during the day and a year later this requirement will be widened to all vehicles – for buses, coaches and hgvs the low emissions zone will be effective at all times, for cars and light duty vehicles it will apply Monday to
3 DfT modelling suggests potentially low levels of hgv traffic growth in future years compared to proportionally significant increases in van use. https://www.gov.uk/government/uploads/system/uploads/attachment_data/file/411471/road-traffic-forecasts-2015.pdf (paragraph 3.26)
4 Eurostat, Large Urban Zone data, http://ec.europa.eu/eurostat/web/cities/data/database
Into the city
Delivering in our growing towns and cities has become one of the great challenges for logistics and is set to become more so in the future. Freight movements have to be efficient to keep down the cost of living and to enable businesses to be competitive. They must deliver more frequently and within more restricted time windows as customer demands change. And whilst doing this they must cope with the need for ever improving safety on increasingly congested roads, and the desire for improved air quality in our urban areas.

55
Into the city
The Logistics Report 2015 © Freight Transport Association
Friday. Between 2017 and 2020, Euro II, III and IV will gradually be required, and the authorities may also consider the creation of ‘limited traffic zones’ (effectively pedestrian zones) in parts of the city.
Many existing low emissions zones in Italy and Germany also upgraded their requirements to Euro III or IV in 2014. The Port of Rotterdam announced it was introducing a Euro VI hgv requirement but has also allowed an exemption for lorries less than seven years old, thus will only achieve actual Euro VI status in 2020. It is also not enforced on non-Dutch hgvs.
2014 also saw more access restrictions to selected (often historic) city centre districts – primarily in Italy, Spain and Poland. Typically, these affect small central areas and allow for deliveries to be made by hgvs – it is car movements and lorry through-traffic that is often targeted.
Various EU projects such as ‘Last Mile Logistics’ (LAMILO) have continued to try to help develop more efficient urban logistics. Recent examples include a public sector run consolidation centre pilot in Brussels that is managing retailers’ goods for consolidated delivery, using low emission vehicles and demonstrating how both private and public sector organisations can work together towards efficient and sustainable urban logistics. There is also a pilot in two locations in the Netherlands testing a potential solution to the issue of customers not being home to receive deliveries. Local consolidation centres have been established from where arrangements are made to deliver goods at a time convenient to the consumer as well as offering a service to collect valuable, recyclable waste on the return journey. An EU-funded urbanaccessregulations.eu website has also been launched to try to draw together all the restrictions that operators face when dealing with city centre deliveries.
Another EU project, BESTFACT, is currently working to make information about urban freight practices more widely available to all organisations that may be interested. The project runs until 2015 and examples and cases have already been made available by means of the website and the various workshops held. The recently established Volvo Research and Educational Foundations (VREF) Centre of Excellence – Sustainable Urban Freight Systems brings together universities, cities and companies from over 20 countries to work together and share ideas about how to improve urban freight.

56
Into the city
The Logistics Report 2015 © Freight Transport Association
UK URBAN LOGISTICS
Improving safety and air quality standards remain high on the agenda
While there is little growth in the population of the top urban areas in 2020 or 2025 (with the exception of London5), as a progressively more urbanised society, the UK and its cities are already facing the challenges shared by other global conurbations. In five years’ time London will have increased its population by 2 per cent and by 3 per cent in 10 years’ time (figure 3.1). Political emphasis is now being placed on galvanising other UK cities to achieve the levels of economic success manifested in London.
5 World Urbanization Prospects: the 2014 revision, United Nations Department of Economic and Social Affairs, 2014
The concept of the Northern Powerhouse continued to develop across the north of England’s city regions with general agreement that there are many good reasons for a joint approach to infrastructure funding to connect the major cities and improve economic output. While the model was driven by the Coalition Government there has generally been cross-party support for the benefits of working together on infrastructure, skills and housing.
One North formulated a plan6 in response to the challenge set out by Sir David Higgins in his original report HS2 Plus (March 2014) and the Chancellor in his ‘Northern Powerhouse’ speech on 23 June and was launched by an alliance of Manchester, Liverpool, Leeds, Newcastle and Sheffield Councils with additional support from other key cities and regions including Hull, Bradford, Wakefield and York – who have all helped shape the findings of the grouping’s reports. The authorities were successfully persuaded to undertake a more thorough investigation of the regions’ logistics needs which resulted in a freight study being commissioned as a separate work stream, to add to that already being looked at for transport and ports connectivity. The work has already identified that connecting east and west coast ports with northern towns and cities is a first principle in freight efficiency. Crucially better transport links and better logistics is being perceived as at the heart of economic growth.
Debate continues over urban safety and logisticsThe main trend in UK urban logistics in 2014 was the continued debate over safety of urban operations – especially in London. The Construction Logistics and Cyclist Safety (CLOCS) project continued its work and its associated standard for vehicle equipment and driver training gained uptake amongst contractors and suppliers in the sector. The decision was also made by Transport for London (TfL) to adjust its Fleet Operator Recognition Scheme (FORS): firstly to increase its requirements to match those of the CLOCS standard;
6 One North: A Proposition for an Interconnected North, One North, 2014
FIGURE 3.1 • Top UK cities by percentage of total population
London is projected to experience the greatest population growth
16.2%
1.4%
3.9%
1.2%
1.2%
1.9%
1.1%4.1%
3%
1.9%
1%
Leeds
Portsmouth
Sheffield
Nottingham
Newcastle-upon-Tyne
Manchester
London
Liverpool
Glasgow
Bristol
Birmingham
Leeds
Portsmouth
Sheffield
Nottingham
Newcastle-upon-Tyne
Manchester
London
Liverpool
Glasgow
Bristol
Birmingham
Source: World Urbanization Prospects: the 2014 revision, United Nations Department of Economic and Social Affairs, 2014
“Only when we improve the infrastructure support around the conurbations of the north-east and west will jobs and people follow. If jobseekers can be directed north, much of London’s infrastructure will last another few decades without any extra expense. Boris Johnson will never agree, but his cycle highways in the sky and underground ring roads are all designed to cope with London attracting millions more people. What if they headed up the M1 to a new life?”
The Observer, Sunday 9 November 2014

57
Into the city
The Logistics Report 2015 © Freight Transport Association
and secondly to hand over the running of the scheme to a private concession with the aim of increasing take-up across the UK. This latter development has resulted in the introduction of a fee for the first time for both membership of the scheme and for the necessary audits.
London has also taken a legal approach. The TfL/Department for Transport (DfT) Industrial HGV Taskforce has run a programme of increased enforcement against targeted non-compliant operators of industrial hgvs – in other words tippers, concrete mixers etc.
Going beyond this, the decision was taken in 2014 to increase the safety requirements for operating in London, a first for any UK city. The Safer Lorry Scheme (SLS) will, from September 2015, require almost all hgvs operating in Greater London to have sideguards and class V and VI mirrors – certain exemptions have remained where it would be impractical or illegal based on other regulations for the vehicles to have such devices fitted.
A related trend that has also impacted logistics, and will continue to do so in the years ahead, is the reallocation of road space for use by cyclists and pedestrians. If it can be done well this has the potential to improve cyclist safety and encourage people out of their cars – freeing up space for essential road users such as freight. But if executed badly it could delay freight movements, reducing the number of deliveries which can be made by one vehicle in one day. Given tight drivers’ hours rules and the cost of vehicles and fuel this has implications for residents’ cost of living and the prices local businesses have to pay for the delivery of the goods they need.
Clearing the airIn July, the UK Government said that air quality in some of the UK’s biggest cities was unlikely to meet EU standards
before 2030. Member states were required to meet targets on pollutants from diesel vehicles by 2010. But the European Court of Justice heard that London, Leeds and Birmingham could still be above these goals in 2030; this was part of the evidence in a civil case brought by air quality activist group Client Earth. It has already been successful in the UK Supreme Court, winning a judgement that the Government was breaching its legal duty on nitrogen dioxide (NO2).
Substantial improvements have been made to hgv emissions of nitrogen dioxide and particulate matter since the first introduction of the Euro standards. Subsequent emission standards have provided far lower greenhouse gas emission allowances and, given the limited lifespan of commercial vehicles, it is likely that only a small proportion of the articulated vehicles which were on the road in 2008 are still around today.
Table 3.1 shows the reduction in nitrogen oxide (NOx) and particulates (PM) emissions since the introduction of the Euro I standard in 1993 and up to Euro VI which was introduced at the end of 2013.
TABLE 3.1 • Engine design improvements deliver a 98 per cent reduction in key air quality pollutants
EmissionStandard
NOx(grams/KWh)
PM(grams/KWh)
Euro I (1993) 8.00 0.36
Euro II (1996) 7.00 0.15
Euro III (2001) 5.00 0.10
Euro IV (2006) 3.50 0.02
Euro V (2009) 2.00 0.02
Euro VI (2013) 0.46 0.01
Further pedestrianisation in some UK city centres, such as Leeds, added to the complexity of final deliveries in 2014, whilst cycle lanes being implemented have the potential to disrupt both deliveries and the flow of vehicles into city centres. This has been of most concern in London where the proposed Cycle Superhighways will create fairly substantial redistribution of road space in favour of the cyclist. The proposals highlight the potential for conflict in the allocation of road space and the possible impact on journey times and vehicle utilisation, as well as limitations that would be imposed on deliveries. Other cities across the UK were awarded money to improve cycling infrastructure in the immediate future and it is likely that the same disruption will have to be managed across the UK in future.

58
Into the city
The Logistics Report 2015 © Freight Transport Association
Local councils around the UK have continued to pursue improved air quality through plans suited to the local conditions. Cities such as Brighton have introduced low emissions zones focused on buses, as they are the major source of pollution. Others have backed improvements to public transport to get people out of cars, improved road layouts to reduce congestion in key hotspots and support environmental efficiency schemes amongst hgv operators. London has progressed its plans for a central London Euro VI Ultra-Low Emission Zone (ULEZ) for 2020. When it comes in it will be among the first Euro VI low emissions zones in the EU.
Work has continued to improve the use of the off-peak period for deliveries. Doing so could have benefits for vulnerable road user safety, emissions and congestion. London’s Re-timing Deliveries Consortium7 has linked major retailers with key London boroughs to work together to get deliveries made out of the peak. Whilst there are complications in London from the existence of the London Lorry Control Scheme, which restricts night-time hgv movements, progress is being made in creating business viable switches to less busy times of day.
Other developments have included: the further roll out of alternative fuel infrastructure enabling use of energy sources such as natural gas for hgvs; and, the continuing use of consolidation centres for specific retail and construction deliveries to minimise movements.
7 The Re-timing Deliveries Consortium is chaired by FTA and includes TfL, London boroughs, retailers and members of the freight industry
THE LOGISTICS OF WORLD
CLASS EVENTS
Logistics works best when engaged at the planning phase for major events
Some of these techniques were put into practice to enable deliveries and servicing during the Glasgow Commonwealth Games. The Commonwealth Games successfully showcased the City of Glasgow and Scotland more widely with a series of cultural as well as sporting achievements. However, a number of lessons can be drawn from the Games as to how logistics can work in future with the authorities on such events.
As the Games approached there was concern at the lack of information to allow logistics companies to plan for deliveries: details of the Games Route Network; postcoded list of delivery restrictions; Local Area Traffic Management and Parking Plans around venues; and, venue security delivery guidance, were all awaited. This information was finally made available very late, compared to the equivalent for the London Olympics. Unlike the 2012 Olympics, there was no dedicated freight team for the Glasgow Games and teams of consultants tasked with providing general travel advice for business had to try to deal with freight industry issues as well; with the Olympics, daily, bespoke freight bulletins had been invaluable in ensuring the smooth operation of logistics. A
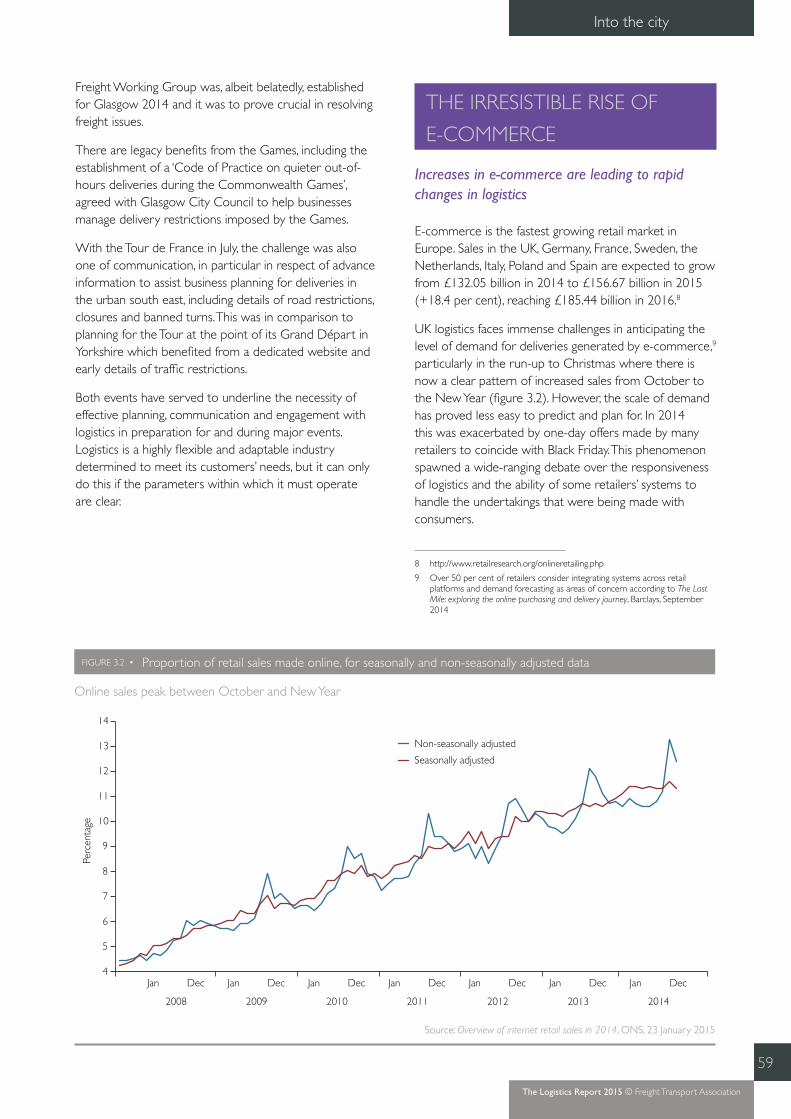
59
Into the city
The Logistics Report 2015 © Freight Transport Association
Freight Working Group was, albeit belatedly, established for Glasgow 2014 and it was to prove crucial in resolving freight issues.
There are legacy benefits from the Games, including the establishment of a ‘Code of Practice on quieter out-of-hours deliveries during the Commonwealth Games’, agreed with Glasgow City Council to help businesses manage delivery restrictions imposed by the Games.
With the Tour de France in July, the challenge was also one of communication, in particular in respect of advance information to assist business planning for deliveries in the urban south east, including details of road restrictions, closures and banned turns. This was in comparison to planning for the Tour at the point of its Grand Départ in Yorkshire which benefited from a dedicated website and early details of traffic restrictions.
Both events have served to underline the necessity of effective planning, communication and engagement with logistics in preparation for and during major events. Logistics is a highly flexible and adaptable industry determined to meet its customers’ needs, but it can only do this if the parameters within which it must operate are clear.
THE IRRESISTIBLE RISE OF
E-COMMERCE
Increases in e-commerce are leading to rapid changes in logistics
E-commerce is the fastest growing retail market in Europe. Sales in the UK, Germany, France, Sweden, the Netherlands, Italy, Poland and Spain are expected to grow from £132.05 billion in 2014 to £156.67 billion in 2015 (+18.4 per cent), reaching £185.44 billion in 2016.8
UK logistics faces immense challenges in anticipating the level of demand for deliveries generated by e-commerce,9 particularly in the run-up to Christmas where there is now a clear pattern of increased sales from October to the New Year (figure 3.2). However, the scale of demand has proved less easy to predict and plan for. In 2014 this was exacerbated by one-day offers made by many retailers to coincide with Black Friday. This phenomenon spawned a wide-ranging debate over the responsiveness of logistics and the ability of some retailers’ systems to handle the undertakings that were being made with consumers.
8 http://www.retailresearch.org/onlineretailing.php
9 Over 50 per cent of retailers consider integrating systems across retail platforms and demand forecasting as areas of concern according to The Last Mile: exploring the online purchasing and delivery journey, Barclays, September 2014
FIGURE 3.2 • Proportion of retail sales made online, for seasonally and non-seasonally adjusted data
Online sales peak between October and New Year
Jan Dec Jan Dec Jan Dec Jan Dec Jan Dec Jan Dec Jan Dec
2008 2009 2010 2011 2012 2013 2014
Non-seasonally adjusted
Seasonally adjusted
4
5
6
7
8
9
10
11
12
13
14
Perc
enta
ge
Source: Overview of internet retail sales in 2014, ONS, 23 January 2015

60
Into the city
The Logistics Report 2015 © Freight Transport Association
Some aspects of this challenge were considered by Andy Street, Managing Director of John Lewis in an interview with the BBC:10 “My personal hope is that this is the high water mark for Black Friday … I don’t think we can put the genie back in the bottle – I think absolutely those discounts, particularly those discounts in the electrical sector, are going to be a feature. But do we need to stoke that fire anymore? I personally hope not.” Contemplating the possibility of charging consumers for deliveries he added: “Because we are in the early stages of this market, in the early stages of any new emerging market, it’s a rush for growth. The market will become more sophisticated and there will be an opportunity that if you really want guarantee, you will be asked to pay a little bit for it.” The implications of these developments are considered further in chapter 5, page 78.
In 2014, the annual average weekly spend online was £718.7 million; an increase of 11.8 per cent compared with 2013. In five years the amount spent has more than doubled.11 The largest growth area online in 2014 was textiles, clothing and footwear, where spending rose by 17.2 per cent. There was a reduction of 1.5 per cent for other stores, although within this sales of household goods recovered.
As a proportion of all retail spending, internet sales constituted 11.2 per cent, compared to 10.4 per cent in 2013. However, ONS has noted that the pattern of growth is changing. The proportion of non-store retailing “seems to be coming to a plateau when examined over the last two years.” It remains the largest contributor to internet sales but it has increased by 4.5 per cent in the period, compared to an overall rise in all internet sales of 20.4 per cent.
The volume of physical (as opposed to digital) online deliveries is also anticipated to change in coming years
10 BBC News, 5 January 2015, http://www.bbc.co.uk/news/30679293
11 Overview of internet retail sales in 2014, ONS, 23 January 2015
(table 3.2) with a significant increase in the number needed to be made.
TABLE 3.2 • Volume of physical packages delivered by size
Letterbox size
Small parcel
Larger delivery*
Number of packages 2013 (m) 185.4 344.6 360
Number of packages 2018 (m) 268.4 479.6 507.2
Growth rate 2013–18 44.8% 39.2% 40.9%
*Larger deliveries are defined as greater than standard UK shoebox size.
Source: The Last Mile: exploring the online purchasing and delivery journey, Barclays, September 2014
Another trend that has been anticipated by analysts is the likelihood of relative growth in internet shopping in rural areas.12,13 The fastest growth over the next five years is projected to be in typically rural areas, with lower growth in highly populated regions which have previously seen the steepest increases in e-commerce.
Reflecting on property investment in 2014, the Financial Times reported that e-commerce is “fuelling a boom in logistics property investment in Europe, as retailers try to keep pace with changing consumer demands”14 with investments dominated by out-of-town, “supersized fulfilment centres larger than 500,000 sq ft” where products are picked, as well as “small parcel delivery centres in dense urban environments.” It reported figures from industry analysts, showing how “investors pumped e19.8bn into [European] properties such as warehousing and distribution hubs in 2014, a seven-year high and a 34 per cent jump year-on-year as companies scramble to adapt to evolving supply chains and developers position themselves to profit from the thriving sector…the UK led the way, with investment in the sector jumping 65 per cent to e7.9bn.” However, the UK was not alone, with investment increasing in mainland Europe as well.
According to The Last Mile report, products ordered online generated just over a billion deliveries in 2013, this is expected to grow by 28.8 per cent to 1.35 billion by 2018. In the run-up to Christmas 2014 the reality of this growth hit consumers hard as many internet retailers struggled to handle the volume of orders and demand for deliveries. Minds were focused on the challenge of fulfilling the service promise to consumers while managing peaks and troughs in demand and resourcing them appropriately.
12 The Last Mile: exploring the online purchasing and delivery journey, Barclays, September 2014
13 As internet providers increase provision of high speed internet connections this may make online shopping a more attractive option, especially in areas less well served by ‘bricks and mortar’ stores
14 Distribution demands drive investment in logistics properties, Financial Times, 9 February 2015
“Shoppers face an anxious wait over whether Christmas gifts bought on the web will arrive after delivery networks buckled under the weight of orders.
The spending binge around Black Friday and this week’s Manic Monday overwhelmed some of the country’s biggest internet retailers, forcing them to tear up their delivery promises.
…An estimated £810 million was spent online on Black Friday which was 50 per cent higher than expected and effectively broke the delivery systems.”
Daily Mail, 10 December 2014

61
Into the city
The Logistics Report 2015 © Freight Transport Association
Many more delivery options are now available to customers. In 2013, 22 per cent of logistics providers were able to offer their customers five or more delivery options, compared to only 16 per cent in 2008. Figure 3.3 shows the principal concerns of logistics providers about online deliveries with customers not being in to receive deliveries, controlling costs and managing peak times of particular concern. For the future, logistics providers are looking to improved tracking and communication of delivery times to customers as important areas for development to secure competitive advantage (figure 3.4).
Figure 1.17 (page 33), shows the sharp decline of 35.5 per cent in the number of hgvs registered in 2014 compared to 2013, by contrast the number of van
registrations increased by 19 per cent over the same period. According to the Department for Transport15 there is evidence that vans are being used as substitutes for hgvs for the following reasons.
❚ The wages paid to drivers make doing business using vans cheaper: a van driver may typically earn £15,000 a year, compared to £25,000 for an hgv driver
❚ The rise in home deliveries has encouraged the use of vans as they are more suited to the task
❚ Van operations and drivers are less regulated than hgvs
15 https://www.gov.uk/government/uploads/system/uploads/attachment_data/file/395722/understanding-the-drivers-road_travel.pdf
FIGURE 3.3 • Percentage of logistics firms mentioning that certain factors cause them problems
Consumers being at home for deliveries, managing costs and peaks in demand are the top issues
Consumers notbeing in to
receive delivery
Managingcosts
Managingpeak times
(eg Christmas)
Issues causedby poor
packaging
Handlingconsumercomplaints
Managingretailer
expectations
Wrongitems from
retailers
Systems andtechnology
issues
Insufficientwarehouse
capacity
Keepingtrack of
deliveries
63.2 56.9 55.2 29.6 20.1 15.1 14.5 12.4 11 6.4
Source: The Last Mile: exploring the online purchasing and delivery journey, Barclays, 2014

62
Into the city
The Logistics Report 2015 © Freight Transport Association
It is worth noting that substituting vans for hgvs may not be very efficient since vans are relatively poorly utilised, with 39 per cent less than one-quarter full and an average payload of around 300kg.16
A number of scenarios have been considered about the way that e-commerce will evolve. The rising popularity of click and collect services has led some observers to predict that direct deliveries, to consumers’ addresses, will fall. For reasons of convenience it also seems likely that store or locker collection services may also increase. As customers seek ever more convenient shopping opportunities, the pressure on retailers to deliver on a Sunday and on the ‘next day’ also seems likely to grow.
16 https://www.tfl.gov.uk/cdn/static/cms/documents/technical-note-05-what-are-the-main-trends-and-developments-affecting-van-traffic.pdf
The nature of the distribution centre and the demands placed upon it are clearly changing and will continue to do so, with many activities that would traditionally have been carried out in a shop now carried out in these hubs. There is also a potential mismatch between what consumers are demanding and what retailers wish to, or are able to, supply – all of which will have an impact on the upstream supply chain and will pose a challenge to logistics to provide answers, through technology and smarter practices.
Shifting patterns of consumer behaviour and the increase in online deliveries will also overlay the environmental and urban safety challenges identified earlier in this chapter.
FIGURE 3.4 • Percentage of logistics firms saying that certain areas are of interest for future development
Improved tracking is the main priority
Improvedtracking
60.5
Improved SMSand email alerts
44.0
Sundaydelivery
35.7
Improvedredeliveryoptions
30.4
Delivery to safeplace option
30.2
Delivery tolocker banks
28.7
More premiumredeliveryoptions
19.2
Allowingcustomers tobook specific
times
17.2
Greaterintegration withclick & collect
16.4
Source: The Last Mile: exploring the online purchasing and delivery journey, Barclays, 2014

63
Into the city
The Logistics Report 2015 © Freight Transport Association
Insight • The future of urban logistics – the cleaner, safer hgv?
Christopher Snelling Head of Urban Logistics Policy, FTA
Towns and cities continue to grow. More people means more freight to eat, drink, wear, use and recycle. In the city, mode shift to rail or water will only ever be a useful but niche opportunity, and switching road freight to vans would not be feasible or desirable (a medium sized hgv would be replaced by 10 vans – with increased emissions, congestion, cost and injuries to vulnerable road users).
All aspects of road use will have to improve if we are to achieve the ambitions we have on safety and pollution. The good news is that the hgv can play its part in securing that better future. Cleaner Euro VI engined lorries are rolling out across the UK fleet now and will form the bulk of vehicles used in city logistics in only a few years. Operators are also working to utilise alternative power sources to further reduce greenhouse gas emissions. Revisions to mirrors and sideguards will continue the progress that has been made towards making hgvs safer on the roads. Sensor systems are now getting to the point where they can be a massive aid in preventing collisions. Beyond this, the design of the front of cabs can change to increase the safety of others.
New options exist – but frequently they are more expensive than the old way of doing things. The operators leading the way need the support of Government through incentives to speed up these new developments so they become mass market solutions as quickly as possible.
Challenges for 2015
In defining urban transport policies, FTA would urge Government, at all levels, to recognise that while initiatives to get private motorists out of their cars and onto public transport are supported, the same principles do not apply to commercial vehicles: in our towns and cities logistics has no choice but to use the road. Logistics is working to maximise use of modes with a lower environmental footprint and is also ‘greening’ road freight, as it is – and will remain – the dominant method of freight movement.
There are benefits from load efficient freight, ie using the largest suitable vehicle to produce the lowest environmental footprint per tonne of freight moved. FTA would like to see greater acknowledgement by Government of the progress already made on local air quality emissions from new hgvs and a focus on ensuring that other sectors match this.
Regardless of mode, safety is the paramount concern within the logistics sector – this includes the safety of the vehicle, of the driver and of other road users. The UK prides itself on having the safest commercial road fleet in Europe, operated by the safest drivers, often placing itself at a competitive disadvantage with other European nations in order to meet and maintain those high standards.
The safety of vulnerable road users continues to improve, but more needs to be done to ensure this process accelerates. In particular, cycling safety should be a priority issue as the number of cyclists continues to grow. Road safety is a complex area and Government should analyse exact causes of incidents and pursue targeted measures focused on each relevant group. Simplistic blanket measures should be avoided.
FTA believes that Government should support logistics’ efforts to further improve the safety of its operations and also target increased enforcement at the small minority of operators who do not conform to existing requirements. The Government should also provide all road users – drivers, riders and pedestrians – with more training or advice to promote a safer culture, particularly on urban streets at peak traffic times.
FTA also urges Government to ensure that in congested spaces in our towns and cities, priority is given to journeys – such as freight journeys – which deliver the biggest economic benefit and for which there are the fewest alternative options.
Government can help by:
❚ encouraging towns and cities to develop transport plans which deliver economically vibrant, safe and attractive places – improve road layout and use; provide better public transport and cycling options; facilitate efficient and safe freight deliveries

Upholding standards

Chapter 4

66
The Logistics Report 2015 © Freight Transport Association
Successive FTA Logistics Industry Surveys have demonstrated how important safety and environmental concerns are to logistics. The FTA Logistics Industry Survey 2014/2015 asked members to rank company board priorities for the coming year (figure 4.1). Again, as in previous years, site and road safety topped the list with only marginal differences between the two rankings.
SAFETY
The number of collisions involving hgvs continues to fall
Reducing accidents on the road remains a top priority for logistics companies’ boards (figure 4.1). Figure 4.2 shows that the number of collisions in which hgvs were involved
continued to fall in 2013, by nearly 3 per cent. This is due in no small part to industry’s prioritisation of road safety.
The accident rate of hgvs compares favourably with cars, (figures 4.3 and 4.4): in 2013 there were 416 accidents, of all severities, per billion vehicle miles for hgvs which is almost half that for cars, at 774 accidents per billion vehicle miles. This means that a road user is nearly twice as likely to be involved in an accident with a car as with an hgv. There are more cars on the road but a direct comparison can be made with hgvs as the accident rate is normalised by the number of miles travelled. Furthermore, in 2013 the rate of fatal accidents per billion vehicle miles for hgvs fell by 8.5 per cent, in the same period the rate of fatal accidents for cars increased by 1.5 per cent compared to 2012.
Contributors to hgv accidentsWhen examining the road environment conditions as contributors in 347 accidents involving hgvs in 2013, it
Upholding standards
There is increasing recognition of the need to be pragmatic about the means used to deliver the goods: a welcome move away from the modal tribalism that has been a feature of the transport debate in recent years. But not at any price: logistics needs to ensure a balance between cost, service levels and the effect of its activity on society and the environment.
FIGURE 4.1 • Board priorities linked to transport and logistics in 2014
Safety concerns are top priority for businesses
0.0 0.5 1.0 1.5 2.0
Community outreach programmes
Reducing noise pollution
Ethical trading
Reducing air pollution
Reducing carbon dioxide
Staff security
Reducing accidents on the road
Site safety
0 = Not a priority 2 = High priority
Source: FTA Logistics Industry Survey 2014/15

67
Upholding standards
The Logistics Report 2015 © Freight Transport Association
can be seen that accidents when the road was slippery due to weather accounted for 53.89 per cent of these accidents; 28.82 per cent of these accidents were contributed to by the road layout, for example a bend, hill, or a narrow road. Figure 4.5 shows how 2010 was a particularly bad year for slippery roads compared to subsequent years. This may have been partially due to the heavy snowfall at the beginning of the year (the worst for
50 years) and early further heavy snowfalls in November and December as well.
SAFER AND GREENER LORRIES
BY DESIGN
Measures to enhance fuel economy and safety were hotly debated
Operators of hgvs are spending hundreds of thousands of pounds training drivers to improve their awareness of vulnerable road users and retrofitting existing vehicles to try to improve visibility from the cab – and industry is working together to improve standards especially in urban areas (chapter 3 page 52). But beyond this, wider discussions are underway regarding the improvement of fundamental aspects of the hgv itself.
Most modern lorries have squat, flat-fronted driver cabs with relatively large blind spots and no crumple zones; this is because length restrictions have led manufacturers to design short cabs to maximise load capacity at the rear. Many contend that the best way to truly eliminate blind spots in hgvs is to design them out, and changes to truck design were the subject of lengthy negotiations in Europe during 2014.
Revisions to the EU Weights and Dimensions Directive 96/53, proposed by the European Commission and
FIGURE 4.2 • Number of accidents and casualties involving hgvs
Casualties of all severities as a result of accidents involving hgvs continue to decline
0
5,000
10,000
15,000
20,000
25,000
2013
2012
2011
2010
2009
2008
2007
2006
2005
2004
2003
2002
2001
2000
No of accidents
No of casualties
Source: Table RAS40005 Reported Road Casualties Great Britain 2013
FIGURE 4.3 • Hgv accident rate per billion vehicle miles
Accident rate involving hgvs has halved in a decade
0
100
200
300
400
500
600
700
800
900
1,000
Acc
iden
t in
volv
emen
t ra
te b
y se
verit
y of
inci
dent All severities
Fatal or seriousFatal accidents
2013
2012
2011
2010
2009
2008
2007
2006
2005
2004
2003
2002
2001
2000
Source: RAS20001 Reported Road Casualties Great Britain 2013
FIGURE 4.4 • Cars accident rate per billion vehicle miles
Accident rate involving cars continues to decline
0
200
400
600
800
1,000
1,200
1,400
1,600All severitiesFatal or seriousFatal accidents
2013
2012
2011
2010
2009
2008
2007
2006
2005
2004
2003
2002
2001
2000
Acc
iden
t in
volv
emen
t ra
te b
y se
verit
y of
inci
dent
Source: RAS20001 Reported Road Casualties Great Britain 2013

68
Upholding standards
The Logistics Report 2015 © Freight Transport Association
agreed by the European Parliament and Council of Ministers, were to allow new cab designs with improved sight lines and direct visibility, reducing blind spots. They were also aimed at allowing new aerodynamic devices which would improve fuel consumption – reduce carbon emissions and other emissions that are damaging to local air quality – as well as cutting costs.
On this subject vehicle operators and safety campaigners lobbied together. In January, FTA, the European Cyclists’ Federation, the Federation of European Pedestrian Associations, the Mayor of London and others signed
a declaration calling on the European Parliament to support Commission proposals to review the lorry dimensions rules.
The European institutions eventually agreed on legislation that would provide for manufacturers to build cabs with rounded fronts, larger windows, and greater under-run protection and crumple zones.
Under pressure from certain commercial vehicle manufacturers, some governments sought to delay the requirement to build to these new designs. They argued
FIGURE 4.5 • Road environment contributor to hgv accidents
Slippery roads are an important environmental contributor to accidents
0
50
100
150
200
250
300
2013
2012
2011
2010
Animal or objectin carriageway
Road layout (eg bend, hill,narrow road)
Temporary roadlayout (eg contraflow)
Slippery road(due to weather)
Deposit on road(eg oil, mud,chippings)
Poor or defectiveroad surface
54.94%
51.55%
53.59%
44.61%
Environmental contributor
Num
ber
of a
ccid
ents
Source: RAS50005 Reported Road Casualties Great Britain 2013

69
Upholding standards
The Logistics Report 2015 © Freight Transport Association
that particular firms that had already begun introducing their new truck models for the next decade would be disadvantaged. These arguments held sway and in the event these changes are now only expected to come into effect around 2021, which some environmental and safety campaign groups consider far too far away.
Technology trials2014 was also the year in which the Secretary of State for Business, Innovation and Skills announced measures to facilitate the introduction of driverless vehicles (cars only) on UK roads from January 2015. The Rt Hon Dr Vince Cable MP announced a £10 million competition where cities can bid to become a test location for driverless vehicles. Ministers also launched a review into road regulation to “establish how the UK can remain at the forefront of driverless car technology” and ensure regulation is appropriate for testing driverless cars in the UK. As yet these UK trials do not extend to trucks.
Autonomous trucks are not new in agricultural, mining or military applications but they are now moving closer to regular use on public roads. The potential benefits of such autonomous vehicles are varied and include: the potential to reduce or eliminate fatalities and serious injuries on the roads; cutting emissions from road transport; increasing road capacity; facilitating social inclusion and accessibility of road transport; and, supporting economic growth. However, they raise a number of questions as well, including how the legislative framework will operate; how autonomous, semi-autonomous and manual vehicles will share the road safely; insurance and liability implications; and certification and testing.
In 2012, the European Commission-backed Project SARTRE (Safe Road Trains for the Environment) saw trials of autonomous vehicles on public roads for the first time. This was an investigation into the feasibility of platooning. A single lead driver in a lorry used vehicle-to-vehicle technology to control the speed, steering and braking of the trucks running closely together behind to form a ‘road train’. This technology has shown that fuel savings can be achieved thanks to the reduced aerodynamic drag, with a report prepared for the UK Government showing
that platooning could achieve a 20 per cent fuel saving at motorway speeds.1 The EU has also launched Project Companion, a three-year research project that aims to identify means of applying the platooning concept in practice in daily transport operations.
The US has passed legislation to allow full trials of the technology although it has only been taken up by a handful of states. Regularised use of such vehicles across Europe will require the legislation governing motor vehicles to catch up. Article 8 of the Vienna Convention states that “Every driver shall at all times be able to control his vehicle or to guide his animals.”2 The convention is in the process of being amended to allow a car to drive itself so long as the system can be overridden or switched off by the driver. This is not understood to be a barrier to the development of use of driverless vehicles in the UK since although the country is a signatory to the convention it has not been ratified.3 However, as MPs on the Transport Select Committee identified,4 Government will need to resolve the issue of civil and criminal liability for accidents with such vehicles and the outcome could determine their popularity in commercial applications.
In the Netherlands, a temporary exemption allowed a test involving lorries to take place in early 2015 but a large-scale trial there also awaits changes in the law. France has extended its exemption rules to allow ‘large-scale’ testing of self-driving cars and trucks, with testing expected to start later in 2015.
A lot of media interest has been sparked by products that promise delivery innovations, such as delivery drones (unmanned aerial vehicles capable of delivering packages). These have generated a lot of interest both for remote
1 Review of Low Carbon Technologies for Heavy Goods Vehicles, prepared for Department for Transport by Ricardo, 2009
2 Vienna Convention on Road Traffic: www.unece.org/fileadmin/DAM/trans/conventn/Conv_road_traffic_EN.pdf
3 The Pathway to Driverless Cars: summary report and action plan, Department for Transport, February 2015
4 Motoring of the Future, House of Commons Transport Committee, March 2015
“It may even be that autonomous trucks bring about the kind of surge in economic growth that followed the coming of the railways, with the resulting cut in costs of shifting goods from A to B, and this may well encourage governments to make it happen sooner – even if it won’t make truck drivers too happy.”
Autonomous vehicles: how safe are trucks without human drivers? Mark Piesing The Independent, 9 January 2014
“Self-driving vehicles offer great opportunities to make our mobility easier, safer and cleaner. It’s important that we learn by doing; knowledge institutes, businesses and
the government can really contribute to development in this way. Today we are showing that it is our ambition to also be amongst the best logistic countries in the world
in the future.”
Melanie Schultz van Haegen-Maas Geesteranus Minister of Infrastructure and the Environment, Netherlands,
February 2015

70
Upholding standards
The Logistics Report 2015 © Freight Transport Association
and urban applications. Clearly, a number of safety and legal implications need to be addressed, particularly the avoidance of conflict with civilian or military airspace, as well as insurance and liability concerns. However, as discussed in the previous chapter, customer decisions are largely driven by price rather than customer service (chapter 3 page 52) and this would suggest that the methods used to promote new delivery options to consumers will need to focus on the benefits rather than the technical wizardry involved.5
The role of enforcement and legislationOpportunities to improve targeting of non-compliant road operators and therefore road safety exist through the sharing of data with industry and between agencies. For example, new reporting arrangements for the Operator Compliance Risk Score6 should enable operators to develop a better understanding of their compliance history. The use of Remote Enforcement Office (REO)7 technology by the Driver and Vehicle Standards Agency (DVSA) should also enable agencies to better focus finite resources on poor performing operators.
In general, moves by Government to introduce new technologies and reduce bureaucracy are welcomed by business as a means of reducing administration costs and working more efficiently. But simplification should not come at any price, especially where safety and compliance may be affected. As part of its Red Tape Challenge the Government agreed to the removal of the counterpart to the driving licence, the piece of paper that gives details of points and convictions. The planned electronic system for cataloguing and retrieving this
5 The Last Mile: exploring the online purchasing and delivery journey, Barclays, September 2014
6 The Driver and Vehicle Standards Agency (DVSA) uses the Operator Compliance Risk Score (OCRS) to decide which vehicles should be inspected. It is used to calculate the risk of an operator not following the rules on roadworthiness (the condition of its vehicles) and traffic, eg drivers’ hours, weighing checks
7 “REO is a more efficient method of enforcement which takes into account the whole picture of an operator…REO uses enriched data to recognise the overall compliance culture of the operator…freeing up valuable enforcement resource to concentrate on the serious and serially non-compliant.” Moving on, DVSA, October 2014
information is one that whilst working well at individual driver level overlooks the statutory duty on vehicle operators to check the eligibility of drivers before they take to the road in an hgv. Government was persuaded to delay the withdrawal of the paper counterpart until the middle of 2015 to allow more time for a suitable replacement for vehicle operators to be devised.
Measures to promote safer logistics were not confined to road transport. In particular, 2014 saw the culmination of a number of years of negotiation over aspects of safety in maritime container transport. Two measures were agreed in international forums. One concerned the way in which containers are packed, to ensure they are secure and do not present a danger to anyone handling them, for example crane or lorry drivers.8 The other was to do with the weighing of containers to prevent overloading of ships, handling equipment, container stacks and vehicles and consequential risks to people and the environment.9
The International Maritime Organization (IMO) was persuaded to adopt a ‘calculation’ method for verifying the weights of individual containers. This promised to make a huge saving in time and costs for shippers of manufactured goods in complying with this new requirement. The final ratification of the amendments to the convention will be made by the IMO Maritime Safety Committee in 2015.
Maritime transport also came under the spotlight in 2014 for its carbon emissions with a number of initiatives under active development at worldwide and EU level.
8 International Maritime Organization/International Labour Organization/UN Economic Commission for Europe Guidelines for Packing of Cargo Transport Units (the CTU Code)
9 Amendments to the International Maritime Organization SOLAS (Safety of Life at Sea) Convention concerning verification of container weights
“We have a problem, folks – all this internet shopping is leading to a massive increase in white van traffic dropping this stuff off – 45% it’s going to go up in London in the next seven years … we need a solution … is it, as I hope, going to be drones? I want to be controlling an app that enables my shopping not only to be click and collect … I want my own personal drone to come and drop it wherever I choose.”
Boris Johnson Mayor of London The Guardian, Friday 28 November 2014
Source: CNIIMF Ltd, St. Petersburg

71
Upholding standards
The Logistics Report 2015 © Freight Transport Association
CONTROLLING CARBON
Revived hopes of a global deal on carbon and sustained action to reduce logistics’ CO2 emissions
The relative priority of carbon emissions reduction in the political sphere has often been difficult to gauge in recent months; at the wider policy level, dealing with the economic downturn has dominated the domestic agenda and, in terms of day-to-day transport use, the decline in journeys as a result of the recession served to take some of the edge away from the carbon debate. But a wider phenomenon was also playing a part, as a consequence of greater maturity in understanding of the challenges and issues affecting carbon reduction; a great deal of work was taking place on the part of businesses, academia and policy makers to address the barriers to a lower carbon economy – and within that, the part to be played by logistics.
At UN level, international negotiators at the Lima climate change talks agreed on a plan to fight global warming that would for the first time commit all countries, rather than just the richest, to cutting their greenhouse gas emissions. The world is now considered to have moved on from questioning whether climate change exists to how it can
be tackled. The ‘Lima Call for Climate Action’ was hailed as an important first step towards a climate change deal due to be finalised in Paris in 2015, although there was acknowledgement that many of the contentious issues had not yet been addressed. There was concern that the measures agreed were too weak to limit warming to the internationally agreed limit of 2°C above pre-industrial levels, or to protect poor countries from climate change.
For the UK, the Department for Energy and Climate Change (DECC) set out its ambitions for securing a global climate change deal in Paris: “Success in Paris will mean safer and healthier lives for people across the world and for future generations. It will also create economic opportunities … UK businesses are already at the forefront of the green economy revolution. A deal would lead to further investment opportunities at home and abroad and increase the size of the low-carbon goods and services sector worldwide.”10
The UN also established a High-level Advisory Group on Sustainable Transport to address the significant increases in greenhouse gas emissions that are anticipated to be
10 Paris 2015: Securing our prosperity through a global climate change agreement, Department of Energy and Climate Change, 2014

72
Upholding standards
The Logistics Report 2015 © Freight Transport Association
caused by a projected surge in the number of vehicles around the world. The group, composed of 12 experts, is charged with promoting sustainable transport systems to further growth and development while protecting the environment and limiting the impact on climate change. It has also become clear that the maritime and aviation sectors will be expected to play a greater role in reducing carbon emissions.
Maritime carbon emissionsAn IMO study11 shows that international shipping’s carbon emissions reduced from 2.8 per cent to 2.2 per cent of global carbon emissions between 2007 and 2012. However, the ‘business as usual’ scenarios continue to indicate that those emissions are likely to grow by between 50 per cent and 250 per cent in the period to 2050, depending on future economic and energy developments. Future progress on emissions by IMO is expected to be dependent on the outcome of the Paris Climate Change Conference in December 2015.
Ongoing work to introduce standardised carbon systems and methodologies for reporting freight transport emissions from air transport and deep sea shipping will help logistics report Scope 3 emissions12 within supply chains.
The IMO is developing a data collection system for carbon emissions from shipping, although consensus has only been reached so far on a very simplified system based on fuel consumption alone. There are divergent views, with countries such as the UK, Denmark, Germany, Japan plus the European Commission viewing a system which makes no attempt to capture data, such as cargo carried, transport work or distance travelled, as being unfit for purpose since it will be unable to assess the energy efficiency of ships. Meanwhile, others, such as China, the International Chamber of Shipping, Intertanko and the World Shipping Council would prefer a system with minimal data requirements and a focus on fuel consumption only. However, most countries are supportive of a system that would cover ships over 5,000 gross tons.
In the absence of a global agreement on shipping emissions, the EU institutions have agreed new EU-wide rules for monitoring, reporting and verification of CO2 emissions from ships set for introduction in 2018. The regulation, once formally adopted, will enter into force on 1 July 2015 and will cover all large ships that use EU ports, irrespective of where the ships are registered; such vessels account for around 55 per cent of the number
11 Third IMO GHG study, International Maritime Organization, 2014
12 Scope 3 emissions are indirect emissions from transport providers from carrying goods; the calculation of these is important if shippers are to be able to report and calculate their carbon emissions
of ships calling into EU ports and represent around 90 per cent of the related emissions. From 1 January 2018, shipowners will have to monitor and report the verified amount of CO2 emitted by their large ships on voyages to, from and between EU ports. Owners will also be required to provide other information to determine the ships’ energy efficiency: CO2 emitted; distance travelled; time spent at sea; and, cargo carried. These data will allow greater transparency in the measurement of the maritime carbon footprint to give shippers a better understanding of carbon emissions in the supply chain. It therefore echoes many of the voluntary schemes already adopted by industry and will be influential as the IMO develops a global data collection system.
The EU scheme will need to be reviewed in the event that an international agreement is reached to reduce greenhouse gas emissions from maritime transport.
Aviation carbon emissionsThe International Civil Aviation Organization (ICAO), the main international aviation regulatory agency, is under a global obligation to develop a market based measure for aviation to reduce carbon by 2016. At a global New York Climate Change Summit in September 2014, ICAO and the Air Transport Action Group (ATAG) announced joint action to reduce emissions. The International Air Transport Association’s (IATA) Global Air Cargo Advisory Group’s Task Force has also developed a carbon methodology for aviation as a model

73
Upholding standards
The Logistics Report 2015 © Freight Transport Association
to encourage consistent reporting across the sector; this will also enable shippers seeking to report and reduce their carbon emissions to calculate them for Scope 3 requirements.
EU approach to logistics carbon emissionsThe EU has finally published a long-awaited strategy for reducing heavy duty vehicle (hdv) CO2 emissions (buses, coaches and hgvs). This identified the need for an hdv carbon monitoring system. A computer simulation tool, VECTO, was developed to measure carbon emissions; originally the Commission hoped to make progress on legislation in 2015 but at a stakeholder workshop in January 2015, it was reported that at least a further 12 months is required for hgvs, focusing on long haul, regional delivery and urban delivery cycles. The Commission is now beginning to prepare the legislation proposals to require carbon emissions from new hgvs, buses and coaches to be certified, reported and monitored as is already done for cars and vans, but a robust baseline reflecting today’s level of carbon emissions from hdvs needs to be established. It is expected that legislative proposals will be ready by mid-2016. Eventually, mandatory limits could be introduced for average emissions from newly-registered hdvs.
There are concerns that a certification scheme could be overly simplistic due to the considerable variety of models and sizes of trucks available. The wide range of weights and loads that will be carried will also affect the per tonne carbon efficiency of new hdvs. The Commission has been urged to consider a whole package of measures, not just a certification scheme, to help operators contribute to reducing carbon emissions.
Meanwhile, France has introduced its own provisions for carbon reporting of transport services which entered its
first full year of application in 2014. Under the Grenelle de l’environnement, a consultative effort between government and public groups to map out a route to greenhouse gas reductions, the country aims to achieve a 20 per cent greenhouse gas emissions reduction from the transport sector by 2020. The methodology used for the calculation is based on the European standard for calculating and declaring energy and greenhouse gas emissions by transport services.
UK logistics carbon emissionsThe overall contribution of the transport sector to UK greenhouse gas emissions in 2012 (the latest year for which data are available) was 20.5 per cent; with emissions from the transport sector decreasing by 3 per cent and road transport emissions decreasing by 1.5 per cent since 1990. Emissions from road transport followed an increasing trend until 2007, but fell by 11.6 per cent between 2007 and 2012. This reflects improved efficiency of the vehicle fleet, and reduced vehicle km travelled (partly as a result of the recession).
Data from the Logistics Carbon Reduction Scheme (LCRS), managed by FTA, shows how carbon emissions have reduced over time. LCRS members are making significantly better progress in reducing emissions when compared to industry as a whole and companies participating in the voluntary scheme are likely to be more engaged in improving fuel efficiency and reducing carbon within their fleet operations (figure 4.6).13
13 The overall carbon reduction from LCRS members is good despite there being some minor variances to trend (fluctuation in the data received from such a wide range of members is inevitable over a long period as more companies join and begin submitting data). Changes in Government-approved conversion factors can also affect trends

74
Upholding standards
The Logistics Report 2015 © Freight Transport Association
The increase in economic activity as the UK exits recession and consequential increase in the demand for the movement of goods has brought the trend slightly upwards in later years. Inevitably the law of diminishing returns applies too as operational actions to reduce carbon emissions are fully utilised. Increased traffic levels and congestion (chapter 2 page 36) may also play a role. LCRS data has also shown a trend towards lower average vehicle kms per member, this is likely to be due to the introduction of double deck/high cube single decks, better routeing and scheduling, driver training and load consolidation, although the economic downturn since 2009 has also had an effect.14
Companies are now making more widespread use of technology to improve the efficiency of their operations and reduce carbon emissions. When asked “Are you utilising vehicle telematics to further support your operation?” 79.2 per cent of companies participating in an FTA survey said yes.15 The benefits cited included: asset security, fuel savings and driver visibility. A number also said the technology was useful for refuting spurious insurance claims.
The same survey also asked whether OBD (on-board diagnostics) were fully understood by drivers and technicians. Worryingly, 41.7 per cent of respondents felt that they were not. This underlines the increasing complexity of the modern goods vehicle fleet and the challenge of ensuring that the efficiency of assets can be optimised in day-to-day applications.
14 Logistics Carbon Review Incorporating the Fifth Annual Report of the Logistics Carbon Reduction Scheme, FTA, 2015
15 FTA Quarterly Transport Activity Survey (QTAS), October 2014
The Committee on Climate Change has commissioned the Centre for Sustainable Road Freight16 to undertake analysis of the potential for demand-side fuel savings in the hgv sector. This work will contribute towards the Committee’s recommendations to Government for the fifth carbon budget (2028–2032). The Committee has previously developed trajectories for reducing emissions from road freight with the focus mainly on technology but also some consideration of demand-side measures. When considering technologies such as stop-start systems, improved aerodynamics and vehicle light-weighting (by fitting fewer or lighter components), the Committee reports that hgv efficiency could be improved by around 30 per cent by 2030 compared to today’s levels.
Alternative fuelsA number of initiatives are underway to explore how use of lower carbon fuels can be promoted through improving the commercial case for alternative fuels and their availability. The Department for Transport’s Low Emission Hgv Task Force published recommendations on the use of methane and biomethane in hgvs. An increase in the utilisation of gas hgvs would also help improve air quality in towns and cities. The recommendations include: reviewing the range of fiscal incentives for gas and biomethane; supporting the establishment of a strategic network of gas refuelling infrastructure; ensuring biomethane supplies are secured for the transport sector; considering the use of incentives that could improve the business case for gas hgvs; and, recognition of biomethane as a transport fuel in carbon reporting.
New EU rules17 were also adopted to ensure the establishment of alternative refuelling points across Europe with common standards for their design and use, including a common plug for recharging electric vehicles. This includes establishing gas refuelling stations along major national roads at certain points. Member states must set and make public their targets and present their national policy frameworks by the end of 2016.
The first report detailing provisional results of Government’s Low Carbon Truck Trial, with the provision of £11.3 million to make up an overall £23 million demonstration project to pump prime procurement of low emission hgv technologies and supporting infrastructure, was published in spring 2014. One hundred and seventy five trucks were in use in January 2014 covering over 4 million kilometres to date. The average substitution ratio was 46 per cent from dual fuel
16 The Centre for Sustainable Road Freight (SRF) is a collaboration between Cambridge and Heriot-Watt Universities and organisations in the freight and logistics sectors, including FTA, with a major five-year grant from EPSRC (Engineering and Physical Sciences Research Council)
17 http://europa.eu/rapid/press-release_IP-14-1053_en.htm
FIGURE 4.6 • Kg of CO2e per vehicle km for freight industry vs LCRS members 2005–2013
LCRS members are making better progress in reducing emissions
2005 2006 2007 2008 2009 2010 2011 2012 2013
Kg C
O2e
per
veh
icle
km
Freight industry
LCRS participants0.50
0.60
0.70
0.80
0.90
1.00
0
Source: Road Freight Statistics RFS0101

75
Upholding standards
The Logistics Report 2015 © Freight Transport Association
gas vehicles but is likely to increase as more refuelling infrastructure becomes available. The first monitoring of carbon savings from gas dual fuel vehicles was up to 9 per cent on a tank to wheel basis and up to 6 per cent on a well to wheel basis. Low savings are considered to be as a result of high efficiency losses as manufacturers work to improve systems plus lack of available infrastructure meaning operators have to revert to diesel.18
Hgv funding was included in Government’s overall £500 million ultra-low emission vehicle package 2015-2020, before that hgvs were not being supported through the scheme and while the proportion of funding for freight was relatively small, it is hoped it might increase in future. The announcement identified £4 million of funding for gas refuelling infrastructure for trucks and continuation of funding for ultra-low emission vans.19
Energy auditsIn summer 2014, UK legislation was introduced for the Energy Savings Opportunity Scheme (ESOS) which
18 Low Carbon Truck and Refuelling Infrastructure Demonstration Trial Evaluation, Atkins and Cenex for the Department for Transport, 2014
19 Investing in ultra low emission vehicles in the UK, 2015 to 2020, report by OLEV (Office for Low Emission Vehicles), Department for Transport, 2014
requires large companies to undertake energy audits every four years. This is in accordance with the EU Energy Efficiency Directive. ESOS is designed to reduce the UK’s energy usage and encourage energy saving practices, with the first audits conducted by 5 December 2015. As at 31 December 2014, all companies with either 250 or more employees or those with less than 250 employees but an annual turnover exceeding e50 million (approximately £40 million) and a balance sheet exceeding $43 million (approximately £34 million) became in scope of ESOS. Companies are required to: measure total energy consumption across transport, buildings and industrial activities; conduct energy audits to identify cost-effective energy efficiency recommendations; and, report compliance to the Environment Agency.20 The LCRS has been identified in best practice as a way to help companies comply with their freight transport requirements.
20 Scottish Environment Agency (SEPA), Natural Resources Wales (NRW) and the Northern Ireland Environment Agency will be the compliance bodies for companies in Scotland, Wales and Northern Ireland
76
Upholding standards
The Logistics Report 2015 © Freight Transport Association
Insight • A call to align carbon reduction schemes
Rachael Dillon Climate Change Policy Manager, FTA
Just before Christmas 2009, the FTA President, supported by the Logistics Carbon Reduction Scheme’s (LCRS) 12 founding members, wrote to the Secretary of State for Transport to outline our initiative to record, report and reduce carbon emissions from freight. Since then, LCRS has gone from strength to strength and has played a vital role in providing evidence to Government that industry can voluntarily reduce carbon emissions without the need for regulation. Five years on, the scheme has over 100 members accounting for more than 75,000 commercial vehicles, which outperform the rest of the industry in carbon reduction: the case for self-regulation is as powerful as ever.
LCRS is also highlighted in Government best practice guidance as a scheme that can help companies in scope of the Energy Savings Opportunity Scheme (ESOS) compile the necessary freight transport data for energy audits. Under ESOS, which enables the UK to comply with the EU Energy Efficiency Directive, all non-SMEs must conduct energy audits covering transport and buildings every four years, with the first taking place by 5 December 2015.
It is only right that companies improve energy efficiency but FTA remains concerned that ESOS could end up being a costly and burdensome exercise for thousands of businesses. Many companies affected by ESOS are also participating in the Carbon Reduction Commitment and are even under the scope of mandatory greenhouse gas reporting obligations. Even though data can be shared across reporting requirements, a myriad of policies could lead to increased complication and cost. FTA calls on Government to align schemes where possible and to enable companies to comply with the least administrative and financial cost.

77
Upholding standards
The Logistics Report 2015 © Freight Transport Association
Challenges for 2015
There is increasing awareness of the impact we have on our environment – both locally and globally. Logistics is working hard to ‘green’ road freight and maximise use of modes with lower environmental footprints.
However, there are many barriers to a larger scale modal shift. Financial constraints play a large part in this: freight access charges can be prohibitively high, given road freight’s inherent cost efficiency. Frequency of services and convenient access to the network is also key. FTA urges Government to help stimulate growth in rail freight by developing and protecting capacity for freight trains; ensuring 24/7 network access; and, ‘green-lighting’ appropriate port and rail freight interchange developments. Grant regimes for both sea and rail freight should be maintained and enhanced.
But 82 per cent of goods are moved by road and this predominance will remain. Measures are being taken to progressively reduce the environmental footprint of road freight, in line with other sectors in society, including the Logistics Carbon Reduction Scheme (see Insight opposite). Operators are also upgrading hgv fleets to new Euro VI emissions standards, with beneficial effects for local air quality, whilst also developing the use of alternative energy sources such as natural gas and electric. However, Government support is required to support the market in alternatively-fuelled vehicles, to the point where technological development and economies of scale will make them fully competitive with diesel. Support is also required to help provide a national refuelling infrastructure for gas vehicles.
Our demand for goods does not begin and end at the UK’s borders. As a result, many overseas vehicles enter the country and while our domestic fleet may adhere to some of the toughest safety regulations, in terms of both driver training and hours and the roadworthiness of the vehicle itself, those from other European nations may not. Government should continue to improve roadworthiness targeting and work with its European counterparts to ensure the same roadworthiness standards are applied – and enforced – across the EU, rather than leaving UK authorities to deal with infringements.
Government can help by:
❚ ensuring regulatory systems are fit for 21st century logistics – administration and payment systems focused on business needs; paper-free digital processes
❚ partnering with industry to develop a programme which addresses both the carbon and air quality challenges
❚ supporting the uptake of environment-friendly freight – invest in alternative fuel vehicles and refuelling infrastructure; maintain grants and increase access for rail freight

Strengthening through numbers

Chapter 5

80
The Logistics Report 2015 © Freight Transport Association
The perennial problem of the poor image of logistics was highlighted in the FTA Logistics Industry Survey 2014/2015. As in previous years, respondents were asked about their perception of public understanding of logistics. There was a marginal improvement in the perception of both Government and public understating of logistics, albeit with levels of public understanding estimated to be lower than Government’s (figure 5.1).
This points to a wider image problem for logistics in relation to the general public, for example affecting the appeal of jobs in logistics for school leavers and also in terms of policy makers, with real concern at
the vulnerability of logistics activity to adverse changes in Government policy. In terms of recruitment and development of staff, many of the issues are ones that should rightly be addressed by businesses themselves but there is also a role for Government to play. Logistics is not alone in experiencing a skills shortage. Current education and skills provision and the buoyant labour market are ill-matched with the needs of key sectors of the economy that are vital for economic growth: including logistics.
An analysis of key industry surveys conducted in 2014 provides clarity on the roles of the various players and potential solutions to the structural skills shortage faced by logistics. The data suggest that if the skills shortage is not addressed, the impacts of the lack of key personnel will be felt in the wider economy, in terms of: increased workload for existing staff; inability to deliver the goods when and at the price the customer expects; loss of business; and a lack of dynamism and innovation as businesses struggle to get the job done.
THE LOGISTICS INDUSTRY
Logistics is a major employer serving a vital economic function
The transport and storage sector currently employs around 8 per cent of the UK workforce, but will need approximately 1.2 million additional workers by 2022 to meet its needs.1
1 UKCES, Understanding Skills and Performance Challenges in the Logistics Sector, Evidence Report 86, Gwenn Winters, Skills for Logistics, 2014
Strengthening through numbers
The nation’s economic recovery is reflected in the employment market and some businesses are reporting increased challenges in attracting suitable candidates. Logistics is not alone in experiencing this phenomenon and like other areas of industry it must work hard to secure and retain the best people for the jobs that need to be filled; this is an ongoing challenge that will require solutions from employers and Government.
FIGURE 5.1 • Industry perception of public understanding of the role of logistics in the economy
Public understanding of logistics slightly improved but continues to be perceived as poor
0.0
0.5
1.0
1.5
2.0
2.5
3.0
3.5
4.0
Publicunderstanding
Governmentunderstanding
0 =
No
unde
rsta
ndin
g4
= A
ver
y go
od u
nder
stan
ding
Rating 2014
Rating 2013
Rating 2012
Rating 2011
Rating 2010
Rating 2009
Sources: FTA Logistics Industry Surveys 2009/10–2014/15

81
Strengthening through numbers
The Logistics Report 2015 © Freight Transport Association
Large goods vehicle2 (lgv) drivers account for 12 per cent of logistics employees and 1 per cent of employees over the entire UK economy (table 5.1).
StaffingThe FTA Logistics Industry Survey 2014/2015 asked respondents to state whether or not they were anticipating staffing issues in 2015. Of those who said ‘yes’ the majority said it was due to a shortage of drivers.
2 In recent years, the truck driver licensing category names have changed to reflect EU legislation. Hgv (heavy goods vehicle) is now lgv (large goods vehicle). For consistency the term large goods vehicle (lgv) is used in this chapter
The responses were weighted by fleet size and separated by sector. The survey found that 55 per cent stated they anticipated problems, with ‘waste and recycling’ indicating a significant problem (figure 5.2).
The recycling and waste disposal sector is anticipating staffing issues in 2015, echoing the healthy business expectation for this sector in the coming year (figure 1.5, page 24).
Labour costsIn 2014, basic pay for transport staff rose by 2.4 per cent (LDI 47 page 17) which is 0.8 per cent higher than the
TABLE 5.1 • Broad definition of employment in logistics
Logistics occupationsEmployment Total
Logistics sector All other sectors Number %
Purchasing managers and directors 4,000 40,000 44,000 2%
Managers and directors in transport and logistics 35,000 35,000 70,000 3%
Managers and directors in storage and warehousing 27,000 60,000 87,000 4%
Importers and exporters 4,000 2,000 6,000 0%
Transport and distribution clerks and assistants 21,000 38,000 59,000 3%
Lgv drivers 171,000 102,000 273,000* 12%
Van drivers 84,000 110,000 194,000 9%
Fork-lift truck drivers 35,000 59,000 94,000 4%
Postal workers, mail sorters, messengers and couriers 142,000 38,000 180,000 8%
Elementary storage occupations 172,000 224,000 396,000 18%
Other occupations 802,000 802,000 37%
Total 1,497,000 708,000 2,205,000 100%
*By mid-2014 this figure increased by 4.4 per cent to 285,000
Source: Skills for Logistics analysis of ONS Annual Population Survey (2012) cited in UKCES Report 2014
FIGURE 5.2 • Anticipated staff shortages weighted by number of lgvs
Waste and recycling sector reports a significant problem with driver shortages
0
1,000
2,000
3,000
4,000
5,000
6,000
7,000
8,000
9,000
10,000
Who
lesa
le
Util
ities
Ship
ping
line
/ca
rrie
r
Reta
il
Recy
clin
g,w
aste
disp
osal
Publ
icau
thor
ity
Parc
els/
inte
grat
or
Man
ufac
turin
g
Dist
ribut
ion,
haul
age
Con
stru
ctio
n
Agr
icul
ture
Num
ber
of r
espo
nses
x n
umbe
r of
lgvs
Not anticipating problems
Anticipating problems
Source: FTA Logistics Industry Survey 2014/2015

82
Strengthening through numbers
The Logistics Report 2015 © Freight Transport Association
RPI inflation rate of 1.6 per cent for the same period (LDI 43 page 17). This is also well ahead of average earnings annual growth of 1.7 per cent for the three months to December 2014 (excluding bonuses).
In the FTA Logistics Industry Survey 2013/2014, respondents indicated that they expected to raise salaries in 2014 as they had in 2013 (which itself followed several years of no increase). According to the FTA Logistics Industry Survey 2014/2015, the trend of increased salaries is expected to continue in 2015 (figure 5.3), with a very moderate rise in both basic and gross pay increases year-on-year.
The growth in pay levels is also expected to be accompanied by an increase in the number of transport related staff (figure 5.4). At the same time, standing down of staff is expected to decrease, compared to the previous year, indicative of anticipation that business will further improve in 2015. This is also reflected in the number of hgv drivers claiming unemployment related benefits (LDI 9 page 16), which dropped from 2,875 in December 2013 to 1,300 in December 2014 (a fall of 55 per cent).
However, with economic growth and greater consumer confidence has come a more buoyant labour market. In terms of the overall economy this is, of course, welcome. But it also means a return to the anxiety over skills shortages last experienced before the recession.
As in previous Logistics Reports, focusing on two key, specialist roles in logistics – transport managers and drivers – enables a better understanding of the challenges faced. The second FTA Transport Manager Survey3 reflects themes of a strengthening economy and increasing competition for talent. Results appear to show a slowdown in churn within logistics as key staff, like transport managers, seem to be remaining in their current roles for longer. However, investigation of the age profiles of drivers and transport managers reveals the same demographic ‘time bomb’ and a lack of younger recruits coming forward to fill key roles.
3 Transport Manager Survey 2014, FTA, 2014
FIGURE 5.3 • Percentage of respondents changing staff pay
Majority of respondents increased pay in 2014
Gross 2015Gross 2014Basic 2015Basic 20140
10
20
30
40
50
60
70
80
Perc
enta
ge o
f res
pond
ents
(%
)
Freeze
Reduce by 1%–5%
Increase by 6%–10%
Increase by 1%–5%
Reduce by 6%-10%
Reduce by 10%+
Increase by 10%+
Note: gross pay is the total of basic pay, overtime,productivity payments and other pay
Source: FTA Logistics Industry Survey 2014/2015

83
Strengthening through numbers
The Logistics Report 2015 © Freight Transport Association
DRIVER SHORTAGE
Context to the driver shortage and the events that focused minds
10 September 2014 was a critical date for logistics, one that businesses had been working towards for more than five years. The date marked the end of the first cycle of periodic training for the lgv Driver Certificate of Professional Competence (Driver CPC). Originating from an EU directive, Driver CPC legislation requires that drivers new to professional driving obtain the qualification, while existing drivers are deemed to have ‘acquired rights’ but must complete 35 hours of training in each five-year period in order to keep their Driver CPC.
The number of periodic training hours uploaded to the Driver and Vehicle Standards Agency (DVSA) database peaked in the two months before the deadline, with 1,609,791 hours uploaded in August alone.4
In June 2014, FTA conducted its Transport Manager Survey5 and found that 96 per cent of transport managers reported that all of their drivers had completed training ahead of the Driver CPC deadline of 10 September 2014. However, two-thirds of transport managers anticipated a shortage of lgv drivers and, of those who expected a driver shortage, most blamed the shortfall on the retirement of drivers who have opted not to complete the Driver CPC (figure 5.5).
4 Driver CPC periodic training, driver qualification cards and course approvals, DVSA (available at www.gov.uk)
5 Transport Manager Survey 2014, FTA, 2014
FIGURE 5.4 • HR priorities for transport related staff 2014–2015
Carriers expect to employ more staff in 2015
Amount of training
Amount of overtime
Standing staff down
Use of temporary staff
Use of agency drivers
Number of staff
Number of redundancies
Percentage balance of respondents
2015
2014
-30 -20 -10 0 10 20 30 40 50 60
Source: FTA Logistics Industry Surveys 2014/2015

84
Strengthening through numbers
The Logistics Report 2015 © Freight Transport Association
The perception appears to be that the effect of the Driver CPC compounded pre-existing problems with recruitment of new drivers and the high age profile of the existing driver pool. In isolation the problem of driver shortage would be headline worthy. However, what made the issue particularly acute in 2014 was the impact of wider developments in the commercial world, with continuing changes in the way that consumers order goods and expect them to be delivered. The Christmas shopping retail activity ‘bulge’ had a significant impact on logistics. The Black Friday phenomenon in particular had the effect of bringing sales forward, resulting in an ever increasing squeeze on logistics operator costs and margins as, in order to cope with the spectacular level of demand for deliveries, businesses had to target more and more resource to get the job done.
The outcome was that, in the main, logistics delivered the goods – there were some delays but most deliveries were made. However, in spite of the media coverage of customers fighting in shops and longer waiting times for parcels to arrive, perhaps the biggest story was the cost of making sure that the deliveries were made. With logistics companies deploying more staff and increasing hourly rates during December, there are ongoing concerns about the viability of handling major peaks in demand within typically low-margin businesses. The skills shortage, and especially the lack of lgv drivers, has compounded these problems.
With even the Secretary of State for Transport saying “I’d advise everybody to get their shopping done”6 last Christmas, concern over a shortage of truck drivers led to extensive debate and investigation of the issues; detailed data has been compiled allowing a clearer appreciation of the issues and possible solutions.
REACHING THE ‘DRIVER
SHORTAGE NUMBER’
Analysis of the data reveals a worrying picture
Employment of truck drivers compared to general employment7
In August 2014, according to the ONS Labour Force Survey, there were 285,000 people employed as lgv
6 Rt Hon Patrick McLoughlin MP, interviewed in Conservative Home, 13 November 2014
7 ONS Labour Force Survey Employment status by occupation, tables EMP04 and EMP16 Q2 2001–Q2 2014
FIGURE 5.5 • Reasons for anticipated shortage of lgv drivers in the run up to Driver CPC deadline (September 2014)
Transport managers attribute the shortfall to Driver CPC
0
10
20
30
40
50
Other Due toanticipated upturnin the economy
Due to drivers retiring
rather thancompleting Driver CPC
60
Perc
enta
ge o
f res
pons
es
Source: FTA Transport Manager Survey 2014

85
Strengthening through numbers
The Logistics Report 2015 © Freight Transport Association
drivers, compared with 326,000 professional drivers 10 years earlier (a reduction of 12.5 per cent). At the same time trends in general employment indicate that there were a total of over 30.5 million jobs in August 2014 compared to 28.4 million 10 years earlier, which is an increase of 7.5 per cent.
While total employment numbers have increased over the last 14 years (despite the recession) there has been a significant fall in the number of lgv drivers. The number of lgv jobs did increase dramatically over the period from 2013–2014 (up by 10 per cent), but this was in line with a swift reduction in general unemployment due to improved economic conditions (figure 5.6).
Data from the Labour Force Survey underestimate the number of lgv drivers in employment (285,000 (figure 5.6)) when compared to the 326,000 individuals who hold full lgv Driver Qualification Cards (table 5.2). The underestimation of lgv drivers in employment is further pronounced when the number of licensed goods vehicles is taken into account (currently 385,800 (figure 5.11)). This number far outstrips the official number of lgv drivers in employment and does not reflect the industry in practice. Vehicle usage optimisation, drivers’ hours and double manning make it more likely that there should be 1.3 drivers to each lgv and not the other way round.
Lgv drivers claimant countThe numbers of lgv drivers claiming jobseekers allowance has dropped by 88 per cent from a high of 11,845 to 1,365 since the January peak in 2010, which indicates that fewer professional drivers are seeking work8. The claimant count for lgv drivers is at its lowest for 10 years, falling by 57 per cent in 2015 compared to 2014 (figure 5.7). The claimant count for lgv driver jobs is now below pre-recession levels, which indicates that there is no slack in unemployment levels left to boost driver numbers from this point onwards.
A profession dominated by older driversData on age from the Labour Force Survey (2014)9 reveal that over 62 per cent of lgv drivers are 45 years or older (this is vastly different to the economy-wide demographics where the population aged 45 years or older in employment is around 35 per cent10 (figure 5.8). Only 1 per cent of employed drivers are under 25 years of age. There are discrepancies in the numbers of lgv drivers in employment between the Labour Force Survey and the database of full lgv DQCs in issue but the age profile for both are very similar (figure 5.9).
8 http://ons.gov.uk/ons/rel/lms/labour-market-statistics/february-2015/sty-labour-market-statistics--february-2015.html
9 Quarterly Labour Force Survey, July – September, 2014
10 Excluding the 65+ (ie retirement age) this figure is for the age range 45 – 64
FIGURE 5.6 • Lgv drivers in employment compared to general employment
There has been a significant fall in the number of lgv drivers
0.80
0.85
0.90
0.95
1.00
1.05
1.10
1.15
Normalised lgv
Normalised total employed
Q2
2014
Q2
2013
Q2
2012
Q2
2011
Q2
2010
Q2
2009
Q2
2008
Q2
2007
Q2
2006
Q2
2005
Q2
2004
Q2
2003
Q2
2002
Q2
2001
Num
ber
of jo
bs (
norm
alise
d to
Q2
2001
)
Note: Job numbers normalised to Q2 2001
27,643,000
30,500,000305,629
285,000
Source: ONS Labour Force Survey Employment status by occupation, tables EMP04 and EMP16 Q2 2001- Q2 2014
FIGURE 5.7 • Claimant count for lgv drivers
The claimant count is at its lowest for 10 years
0
2,000
4,000
6,000
8,000
10,000
12,000
Janu
ary
2015
Janu
ary
2014
Janu
ary
2013
Janu
ary
2012
Janu
ary
2011
Janu
ary
2010
Janu
ary
2009
Janu
ary
2008
Janu
ary
2007
Janu
ary
2006
Janu
ary
2005
Cla
iman
t co
urt
Source: Labour Market Statistics, February 2015

86
Strengthening through numbers
The Logistics Report 2015 © Freight Transport Association
Data from FTA’s Quarterly Transport Activity Survey January 2015, found a similar profile for driver age, with 72 per cent of lgv drivers at or over 45 years of age (figure 5.10).
Driver shortage number11
There is no definitive number for the current driver shortage but different methods arrive at similar conclusions. The first looks at growth in the labour market and the second compares the number of driver qualification cards (DQC) in issue to the number of licensed goods vehicles. This gives a range between 52,720 (using official Labour Force Survey Statistics) and 59,973 (the number of lgvs licensed in GB and the number of DQCs in issue).
From 2001 to 2013 there was a fall of 8.6 per cent in the number of licensed lgvs (figure 5.11). Around the same time the number of drivers in employment fell by 15 per cent (figure 5.6), falling at nearly twice the rate as the number of lgvs licensed.
Table 5.2 shows data from the Driver and Vehicle Licensing Agency (DVLA) as at end of September 2014 for DQCs in issue.
11 ONS Labour Force Survey Employment status by occupation, tables EMP04 and EMP16 2001–2014
FIGURE 5.8 • Age demographics for professional drivers compared to general population
Around 62 per cent of drivers are 45 or over
0
5
10
15
20
25
30
35
40
45
50
65+
60–64
45–59
35–44
25–34
16–24
General populationLGV driver
Perc
enta
ge o
f tot
al (
%)
Source: Quarterly Labour Force Survey, July–September, 2014
FIGURE 5.10 • Age profile for professional drivers (QTAS January 2015)
QTAS data reflects an older age profile
Over 60
55–60
45–55
Under 45
28%
39%
9%
24%
Source: FTA’s Quarterly Transport Activity Survey (QTAS), January 2015
FIGURE 5.9 • Comparison of age range for employed lgv drivers and DQCs in issue
Many professional drivers are over the age of 45
0
10
20
30
40
50
60
DQCs in issue (lgv full)Lgv drivers employed
65+60–6445–5935–4425–3416–24
Perc
enta
ge o
f tot
al (
%)
Source: Quarterly Labour Force Survey, July–September, 2014 DVLA, September 2014

87
Strengthening through numbers
The Logistics Report 2015 © Freight Transport Association
New entrants, lgv test pass rate and future demand Initial qualificationThe figures for drivers acquiring the Driver CPC through the initial qualification (which represents new entrants to the industry who did not hold a category C licence prior to 10 September 2009) are in table 5.3.
Lgv test pass rateThe pass rate for lgv drivers taking their tests may impact on the number of drivers in employment. Although the pass rate has gradually improved since 2008, only around half of test takers pass (table 5.4).12
Future demand for driversAccording to the All-Party Parliamentary Group (APPG) report Barriers to Youth Employment in the Freight Transport Sector (January 2015), quoting Skills for Logistics, it is estimated that:
“A fifth of the current lgv workforce will reach retirement age in the next 10 years. That’s approximately 75,000 drivers and this does not include those that will have licences revoked or curtailed or even those that will leave the professions for other job opportunities outside of driving. But the number gaining a licence is decreasing year-on-year. The data show a 45 per cent fall in the number
12 https://www.gov.uk/government/statistical-data-sets/drt05-practical-large-goods-vehicles-lgv-test-pass-rates
obtaining an lgv licence in a 5-year period, and it appears that only 20 per cent are acquiring their initial Driver CPC. This therefore does not come close to replacing those that are anticipated to leave the profession”.
TABLE 5.2 • DQCs in issue by age category September 2014
Age Lgv fullLgv full and
pcv fullLgv full andpcv prov
18–24 5,244 280 2,338
25–34 37,324 5,987 16,707
35–44 64,306 14,475 22,928
45–59 175,198 31,100 13,005
60–64 30,336 6,939 1,392
65+ 13,419 4,648 390
Total 325,827 63,429 56,760
Note: This dataset excludes category C1 and D1 licences which DVLA does not class as a vocational class. It is understood these drivers number around 100,000
Source: DVLA, September 2014
FIGURE 5.11 • Number of licensed lgvs (2001–2013)
Number of lgvs licensed fell during the recession
350,000
360,000
370,000
380,000
390,000
400,000
410,000
420,000
430,000
440,000
2013
2012
2011
2010
2009
2008
2007
2006
2005
2004
2003
2002
2001
Source: Department for Transport: VEH0103 Licences vehicles by tax class, Great Britain, annually
TABLE 5.3 • Initial qualification
Financial year DCPC initial qualification
April 08–March 09 3,948
April 09–March 10 7,524
April 10–March 11 12,104
April 11–March 12 14,003
April 12–March 13 16,511
April 13–March 14 21,054
April 14–January 15 24,722
Total 99,866
Source: DVSA, February 2015
https://www.gov.uk/government/statistics/driver-certificate- of-professional-competence-cpc-statistics
TABLE 5.4 • Practical lgv test, Great Britain: 2008 to September 2014
Year Tests Passes % pass rate
2008 69,386 33,708 48.6%
2009 50,626 25,680 50.7%
2010 41,174 21,267 51.7%
2011 47,069 24,639 52.3%
2012 46,744 24,634 52.7%
2013 47,511 25,679 54.0%
2014 (to Sept) 37,401 20,556 55.0%
Note: Expect around 50,000 tests to be undertaken in 2014 with just over half passing
Source: DfT 2014 Practical large goods vehicles (LGV) test pass rates (DRT05)

88
Strengthening through numbers
The Logistics Report 2015 © Freight Transport Association
Skills for Logistics and the Chartered Institute for Logistics and Transport (CILT) predict that there will be a need for 150,000 drivers by 2020.13
Problems recruiting professional driversAccording to FTA’s Quarterly Transport Activity Survey, January 2015, FTA members reported difficulties in recruiting drivers in the final quarter of 2014. In Q2 2009 only around 20 per cent of respondents stated they had problems recruiting lgv drivers – this rose to 80 per cent in Q3 and Q4 2014 (figure 5.12).
Furthermore, 60 per cent stated that they anticipated a shortage of lgv drivers in Q1 2015 and 68 per cent stated that they were experiencing problems contracting lgv drivers through agencies.
BARRIERS AND SOLUTIONS
Resolving the driver shortage through action
‘Driver roadside facilities’ was ranked as the greatest barrier to driver recruitment, closely followed by medical requirements and hours of work (figure 5.13). It was commented in the survey results that better roadside
13 http://100days.local.gov.uk/thoughts-on-100-days/chartered-institute-of-logistics-and-transport/
facilities would have a positive effect on efforts to encourage women to join the industry.
Respondents indicated that increasing the availability and funding for apprenticeships was the most important measure to address the problem of recruitment and deployment (figure 5.14).
FIGURE 5.12 • Problems in recruiting professional drivers
Driver recruitment is now a major issue
0
10
20
30
40
50
60
70
80
90
100
Q4
14
Q3
14
Q2
14
Q1
14
Q4
13
Q3
13
Q2
13
Q1
13
Q4
12
Q3
12
Q2
12
Q1
12
Q4
11
Q3
11
Q2
11
Q1
11
Q4
10
Q3
10
Q2
10
Q1
10
Q4
09
Q3
09
Q2
09
Q1
09
Perc
enta
ge o
f res
pond
ends
rep
ortin
gpr
oble
ms
in r
ecru
iting
driv
ers
Source: FTA’s Quarterly Transport Activity Survey, January 2015
FIGURE 5.13 • Barriers to driver recruitment
Roadside facilities greatest barrier to recruiting more drivers
0 1 2 3 4 5 6 7 8
Driver pay rates andemployment terms
Driver CPC deadline andDQC award process
Image of industry
Young driver insurancepremiums
Vocational drivingage limits
Hours of work
Driver medicalrequirements
Driver roadside facilities
1 = smallest barrier 8 = greatest barrier
Source: FTA Transport Manager Survey 2014
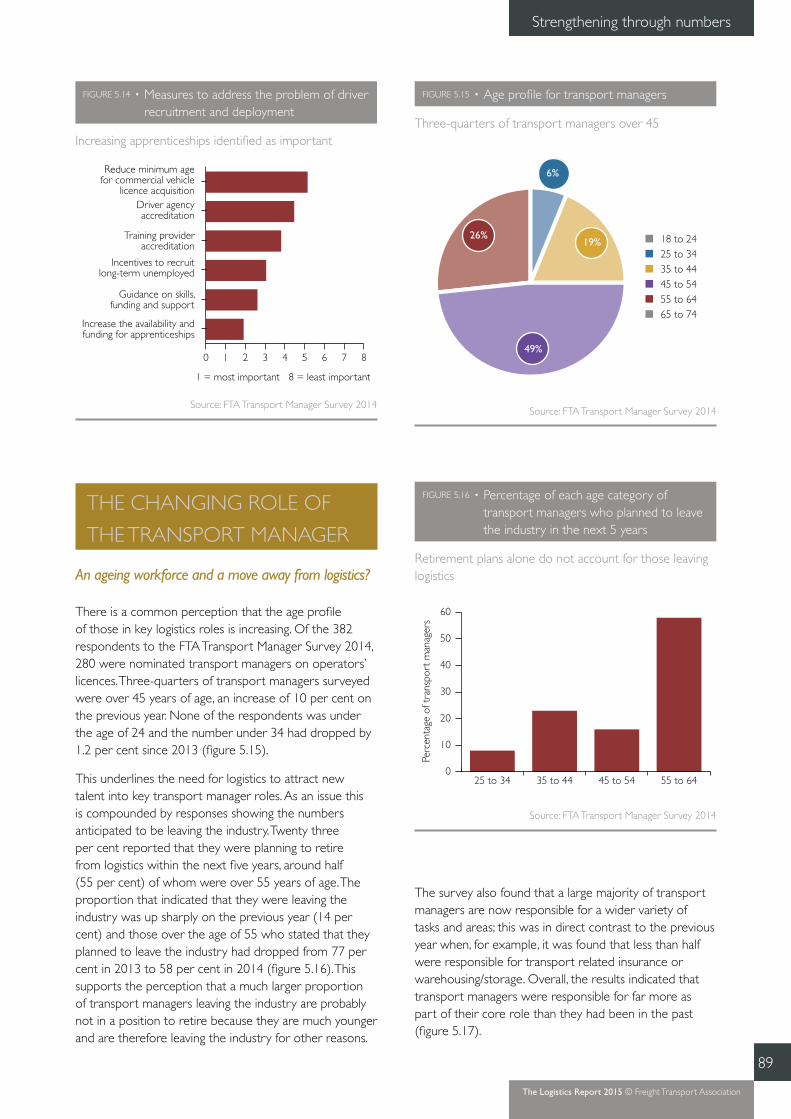
89
Strengthening through numbers
The Logistics Report 2015 © Freight Transport Association
THE CHANGING ROLE OF
THE TRANSPORT MANAGER
An ageing workforce and a move away from logistics?
There is a common perception that the age profile of those in key logistics roles is increasing. Of the 382 respondents to the FTA Transport Manager Survey 2014, 280 were nominated transport managers on operators’ licences. Three-quarters of transport managers surveyed were over 45 years of age, an increase of 10 per cent on the previous year. None of the respondents was under the age of 24 and the number under 34 had dropped by 1.2 per cent since 2013 (figure 5.15).
This underlines the need for logistics to attract new talent into key transport manager roles. As an issue this is compounded by responses showing the numbers anticipated to be leaving the industry. Twenty three per cent reported that they were planning to retire from logistics within the next five years, around half (55 per cent) of whom were over 55 years of age. The proportion that indicated that they were leaving the industry was up sharply on the previous year (14 per cent) and those over the age of 55 who stated that they planned to leave the industry had dropped from 77 per cent in 2013 to 58 per cent in 2014 (figure 5.16). This supports the perception that a much larger proportion of transport managers leaving the industry are probably not in a position to retire because they are much younger and are therefore leaving the industry for other reasons.
FIGURE 5.15: [ALREADY SET FOR TRANSPORT MANAGER SURVEY]
The survey also found that a large majority of transport managers are now responsible for a wider variety of tasks and areas; this was in direct contrast to the previous year when, for example, it was found that less than half were responsible for transport related insurance or warehousing/storage. Overall, the results indicated that transport managers were responsible for far more as part of their core role than they had been in the past (figure 5.17).
FIGURE 5.14 • Measures to address the problem of driver recruitment and deployment
Increasing apprenticeships identified as important
0 1 2 3 4 5 6 7 8
Increase the availability andfunding for apprenticeships
Guidance on skills,funding and support
Incentives to recruitlong-term unemployed
Training provideraccreditation
Driver agencyaccreditation
Reduce minimum agefor commercial vehicle
licence acquisition
1 = most important 8 = least important
Source: FTA Transport Manager Survey 2014
FIGURE 5.15 • Age profile for transport managers
Three-quarters of transport managers over 45
65 to 7455 to 6445 to 5435 to 4425 to 3418 to 24
49%
6%
19%26%
Source: FTA Transport Manager Survey 2014
FIGURE 5.16 • Percentage of each age category of transport managers who planned to leave the industry in the next 5 years
Retirement plans alone do not account for those leaving logistics
0
10
20
30
40
50
60
55 to 6445 to 5435 to 4425 to 34
Perc
enta
ge o
f tra
nspo
rt m
anag
ers
Source: FTA Transport Manager Survey 2014

90
Strengthening through numbers
The Logistics Report 2015 © Freight Transport Association
Recognition and status of transport managersThe extent to which the transport manager role was respected showed positive improvement on 2013, in particular in respect of the responses on company and industry perspectives which had previously been marginally negative (table 5.5). The same was true of the understanding of legal responsibilities, where the understanding of colleagues and line manager were both significantly improved on the previous year (table 5.6).
Respondents also rated the extent to which they felt the role of transport manager was understood by friends, family and the general public. The results were little changed from last year and still reflected a feeling that the general public does not understand the transport manager role very well.
FIGURE 5.17 • Core role responsibilities
The breadth of the transport manager role appears to be increasing
70 75 80 85 90 95 100
Warehousing/storage
Transport related insurance
Purchasing of consumables
Tyres
Fuel/lubricants
Rental or lease of vehicles/trailers
Recovery
New vehicles/trailers
Agency drivers
Vehicle maintenance and repair
Training of drivers
Hiring of drivers
Drivers’ hours compliance
Training of other staff
Percentage of responses
Source: FTA 2014 Transport Manager Survey 2014
TABLE 5.5 • Respect for role of transport manager
Extent to which role of transport manager
respected by:
Net percentage balance of
respondents (2013)
Net percentage balance of
respondents (2014)
Work colleagues +21% +25%
Line manager +16% +43%
Company –5% +15%
Industry –1% +13%
TABLE 5.6 • Understanding of legal responsibilities
Extent to which role legal responsibilities
understood by:
Net percentage balance of
respondents (2013)
Net percentage balance of
respondents (2014)
Work colleagues -28% +1%
Line manager +18% +32%
Note: The results represent a ‘net balance’, ie the difference between the response ratings and the percentage of respondents choosing ‘very respected’ and ‘not at all respected’ (or ‘very understood’ or ‘not at all understood’). The ‘net balance’ with its appropriate sign, indicates the direction of response for how well the role is respected or understood. A positive sign indicates that the role is well respected or understood with a negative sign indicating that it is not.

91
Strengthening through numbers
The Logistics Report 2015 © Freight Transport Association
Insight • FTA and Investors in People
David Wells Chief Executive, FTA
FTA has now climbed to the top of the Investors in People (IIP) ladder and has been awarded Champion status. Using the IIP framework has enabled us to maintain a highly engaged workforce during both good times and the more challenging years during the recession. Skills shortage in sectors like ours is a major problem for businesses – the war for talent is getting much tougher. Therefore it is essential to support, motivate and develop your employees so that 1) you retain them 2) you reap the returns of investing in developing their skills and 3) you have a happy, productive, well-rewarded workforce which will generate a much more appealing employee value proposition when you do need to attract new talent to your organisation as it grows. It is important for your employee brand to be attractive and to stand out from the crowd. Investors in People has helped us to focus on the engine of our success – our people. Most organisations have similar goals and strive to continually grow, be profitable and sustainable. This can only be achieved if you have high quality people practices, a capable leadership team and a strategy that has your people at the centre of it. FTA is going from strength to strength, being an IIP Champion means that we can share our practices and help other organisations benefit from the experiences we have had.
Challenges for 2015
The shortage of hgv drivers is the most acute skills issue facing logistics. A number of potential solutions have been identified including: improved funding and support for licence acquisition training; improvement in the standard of driver facilities at service areas and distribution centres; working with the insurance industry to secure better arrangements for younger drivers; addressing public perceptions of the logistics industry and presenting it as a responsible place to work; and, reducing administrative delays to getting drivers on the road.
Safety is not only a concern when a vehicle is in motion. For truck drivers having a safe place to stop and rest to comply with drivers’ hours rules is vital. But across the country there is a lack of secure truck stops, which means drivers have no alternative but to use lay-bys and side streets.
FTA believes that Government should ensure adequate provision of truck stops which are properly maintained and properly resourced with security systems, shower blocks and toilets. By working with local government to establish shared use park-and-ride schemes, close to the major road network, public nuisance can be reduced and drivers will be able to take to the road properly rested and refreshed. This will also assist in improving the image of logistics as well as broadening the appeal of driving to a more diverse range of applicants.
There is also a rising tide of truck theft across the country and drivers who are unable to access secure parking facilities are at risk from organised criminal gangs intent on stealing trucks, trailers and their loads. These gangs often turn to violence, putting drivers’ lives in danger. FTA urges Government to make the National Crime Agency responsible for tackling truck crime. This will ensure that each police force applies the same criteria to recording and dealing with such crimes and will enable the sharing of data which can be used to bring criminals to justice.
Government can help by:
❚ its own actions and policy making attaching appropriate value and priority to freight operations
❚ working with industry to provide improved funding and support for licence acquisition and training
❚ removing barriers to getting drivers on the road – for example by speeding up driver medical assessments and hgv driving tests

Evidence base


The Logistics Report 2015 draws its evidence from the following sources
❚ The latest annual FTA Logistics Industry Survey 2014/15
❚ The FTA Quarterly Transport Activity Survey (QTAS)
❚ FTA Manager’s Guide to Distribution Costs
❚ FTA Transport Manager Survey 2014
❚ FTA Logistics Carbon Review Incorporating the Fifth Annual Report of the Logistics Carbon Reduction Scheme 2015
❚ RepGraph: Solving the Driver Crisis 2015
❚ York Aviation: Implications for the Air Freight Sector of Different Airport Capacity Options, 2015
❚ Official statistical publications are referenced throughout the report
FTA Logistics Industry Survey 2014/15
The Logistics Industry Survey 2014/15 – FTA’s annual poll of members’ experiences of the freight market and trading environment – provides insights into current and future levels of business sentiment1. The survey was conducted in November and December 2014 and there were 285 respondents in the sample, spanning over 10 sectors in the UK.
Questions in the industry survey centred on economic and political issues that affected the logistics sector in 2014 and expectations for 2015. Overall results indicate that the business environment for the logistics sector reflected growth in the UK economy in 2014 though below expected levels. Expectations for 2015 are generally optimistic.
FTA Quarterly Transport Activity Survey (QTAS)
FTA’s Quarterly Transport Activity Survey (QTAS) is a quarterly survey of business sentiment within the logistics sector, based typically on a sample size of around 110 FTA members. The survey results help to produce an indicator of current and future business conditions in the logistics sector and external factors influencing efficiency.
FTA Manager’s Guide to Distribution Costs (MGDC)
This is an annual publication, with 3 quarterly updates used by the logistics industry to benchmark costs in 4 key areas – wages, vehicle operating costs, warehouse costs and haulage trends.
FTA Transport Manager Survey 2014
The second annual Transport Manager Survey which provides data that demonstrates the diverse nature of the transport manager role.
FTA Logistics Carbon Review Incorporating the Fifth Annual Report of the Logistics Carbon Reduction Scheme 2015
The fifth annual report of the Logistics Carbon Reduction Scheme (LCRS).
1 Business sentiment measures the ‘mood’ of respondents as positive or negative and is measured using a percentage ‘balance’ of responses – calculated by subtracting all negative responses to a question from all positive responses
94
The Logistics Report 2015 © Freight Transport Association
Evidence base

95
Evidence base
The Logistics Report 2015 © Freight Transport Association
RepGraph: Solving the Driver Crisis 2015
FTA commissioned an independent study of available official statistics by RepGraph Ltd. The report summarised the findings and the data sources.
York Aviation: Implications for the Air Freight Sector of Different Airport Capacity Options, 2015
A report prepared for FTA and Transport for London on the short-listed options for expansion of runway capacity in the south east of England.

Tel: 01892 526171 Fax: 01892 534985 Web: www.fta.co.uk
Freight Transport Association Limited
Delivering safe, efficient, sustainable logistics
Hermes House | St John’s Road | Tunbridge Wells | Kent TN4 9UZ
Registered in England Number 391957 05.15/SW
ISBN: 978 1 905849 43 7