leading the way with innovation - li-ningir.lining.com/en/ir/presentations/pre140324.pdf ·...
TRANSCRIPT

2013 Annual Results Investor Presentation
Leading the Way with Innovation
DISCLAIMER
2
This presentation incorporates information contained in the annual results announcement (the “Results Announcement”) for the period ended 31 December 2013 of Li Ning Company Limited (the “Company”). This presentation should be read in conjunction with the Results Announcement and is qualified in its entirety by the more detailed information and financial information contained in the Results Announcement.
Other than the information contained in the Results Announcement, you shall not reproduce or distribute this presentation, in whole or in part, and you shall not disclose any of the contents of this presentation or use any information herein for any purpose without the Company’s prior written consent. You hereby agree to the foregoing by accepting delivery of this presentation.
The contents of this presentation have not been reviewed or approved by any regulatory authority in Hong Kong or elsewhere. The contents of this presentation are not investment, legal or tax advice. You are advised to exercise caution in perusing the contents of this presentation. If you are in any doubt about any of the contents of this presentation, you should obtain independent professional advice.
Disclaimer
3
Agenda
2013 Key Highlights and Strategic Vision
Strategy and Transformation Plan Update
Progress on Turnaround
Building China’s Leading Brand
Impacts on Financial Results
Financial Highlights
Open Forum

5
Industry Challenges & Opportunities
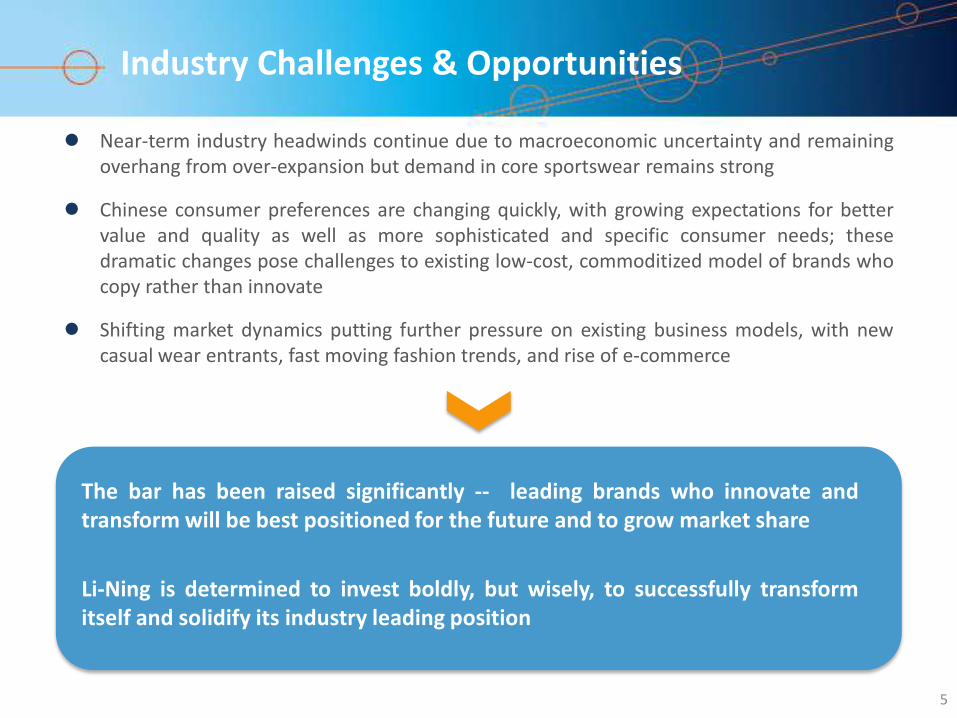
The bar has been raised significantly -- leading brands who innovate and transform will be best positioned for the future and to grow market share
Li-Ning is determined to invest boldly, but wisely, to successfully transform itself and solidify its industry leading position
Near-term industry headwinds continue due to macroeconomic uncertainty and remaining overhang from over-expansion but demand in core sportswear remains strong
Chinese consumer preferences are changing quickly, with growing expectations for better value and quality as well as more sophisticated and specific consumer needs; these dramatic changes pose challenges to existing low-cost, commoditized model of brands who copy rather than innovate
Shifting market dynamics putting further pressure on existing business models, with new casual wear entrants, fast moving fashion trends, and rise of e-commerce
6
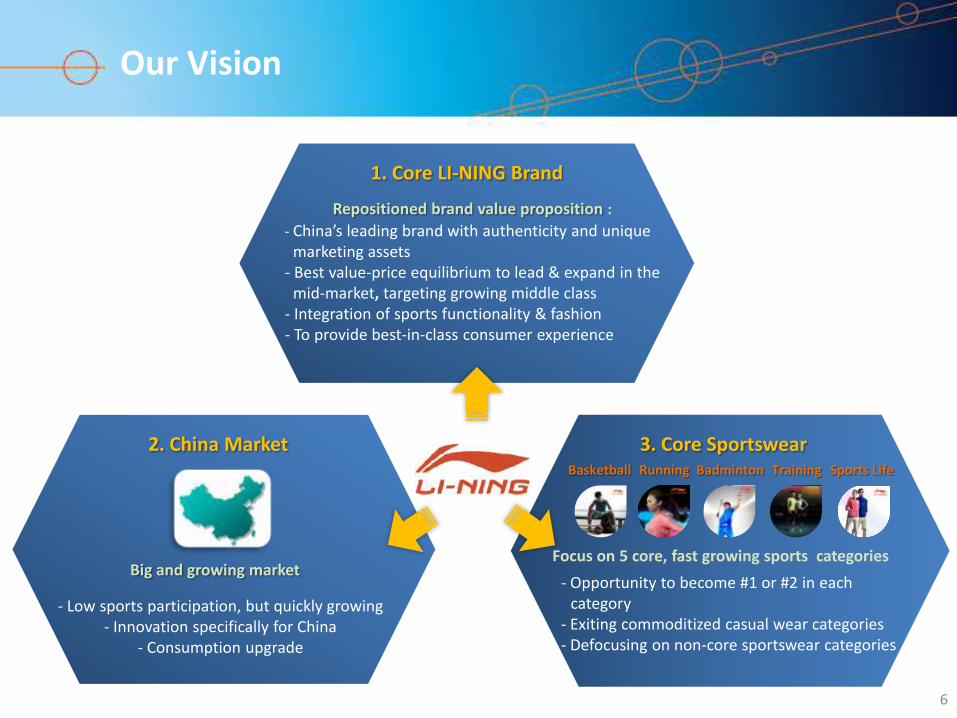
Our Vision
1. Core LI-NING Brand
Repositioned brand value proposition :
Big and growing market
3. Core Sportswear Basketball Running Training Sports Life Badminton
2. China Market
Focus on 5 core, fast growing sports categories
- Opportunity to become #1 or #2 in each category
- Exiting commoditized casual wear categories - Defocusing on non-core sportswear categories
- Low sports participation, but quickly growing - Innovation specifically for China
- Consumption upgrade
- China’s leading brand with authenticity and unique marketing assets
- Best value-price equilibrium to lead & expand in the mid-market, targeting growing middle class
- Integration of sports functionality & fashion - To provide best-in-class consumer experience
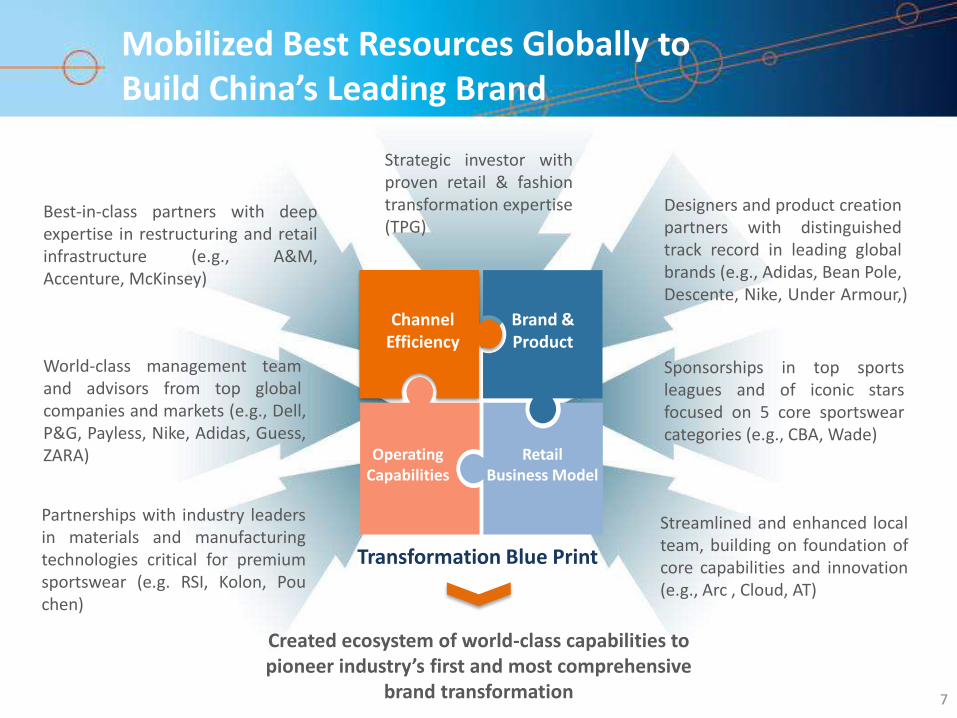
World-class management team and advisors from top global companies and markets (e.g., Dell, P&G, Payless, Nike, Adidas, Guess, ZARA)
Sponsorships in top sports leagues and of iconic stars focused on 5 core sportswear categories (e.g., CBA, Wade)
Streamlined and enhanced local team, building on foundation of core capabilities and innovation (e.g., Arc , Cloud, AT)
Partnerships with industry leaders in materials and manufacturing technologies critical for premium sportswear (e.g. RSI, Kolon, Pou chen)
Designers and product creation partners with distinguished track record in leading global brands (e.g., Adidas, Bean Pole, Descente, Nike, Under Armour,)
Best-in-class partners with deep expertise in restructuring and retail infrastructure (e.g., A&M, Accenture, McKinsey)
Created ecosystem of world-class capabilities to pioneer industry’s first and most comprehensive
brand transformation
Mobilized Best Resources Globally to Build China’s Leading Brand
7
Strategic investor with proven retail & fashion transformation expertise (TPG)
Channel Efficiency
Operating Capabilities
Brand & Product
Retail Business Model
Transformation Blue Print

8
Differentiated Products Offer Price-Value Proposition
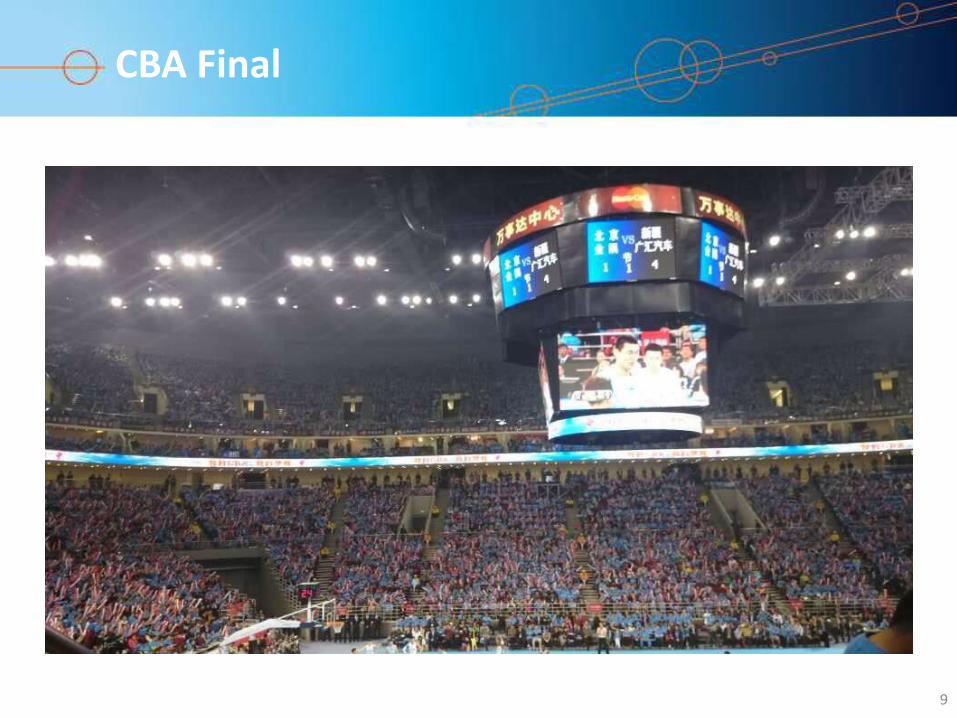
CBA Final
9

10K Running
10

10K Running
11

10K Running
12

We are mid-way of the transformation journey.
First phase turnaround is nearly complete with encouraging core trends, but a little more time is needed to resolve issues with the last group of weak channel partners and final batch of old inventory.
Success of the new strategy has been demonstrated through new product performance and various strategic initiatives; but, final phase is expected to take 18-24 more months of investment to build out new operational platform and complete the transformation, which includes the shift towards more direct-retail and self-owned shops.
Financially, cost structure and operating cash flow have improved significantly, but balanced by bold investments in transforming the brand and operations; hence, it will take time for financial results to fully reflect the benefits of our work today.
We firmly believe in our current transformation direction; we also believe that building a leading brand in China, one of the world’s most promising markets, rather than maximizing short-term financial results, is the best way to maximize stakeholder value over time.
We have made great progress over the past 18 months in realizing this vision.
2013 Key Highlights
13
15
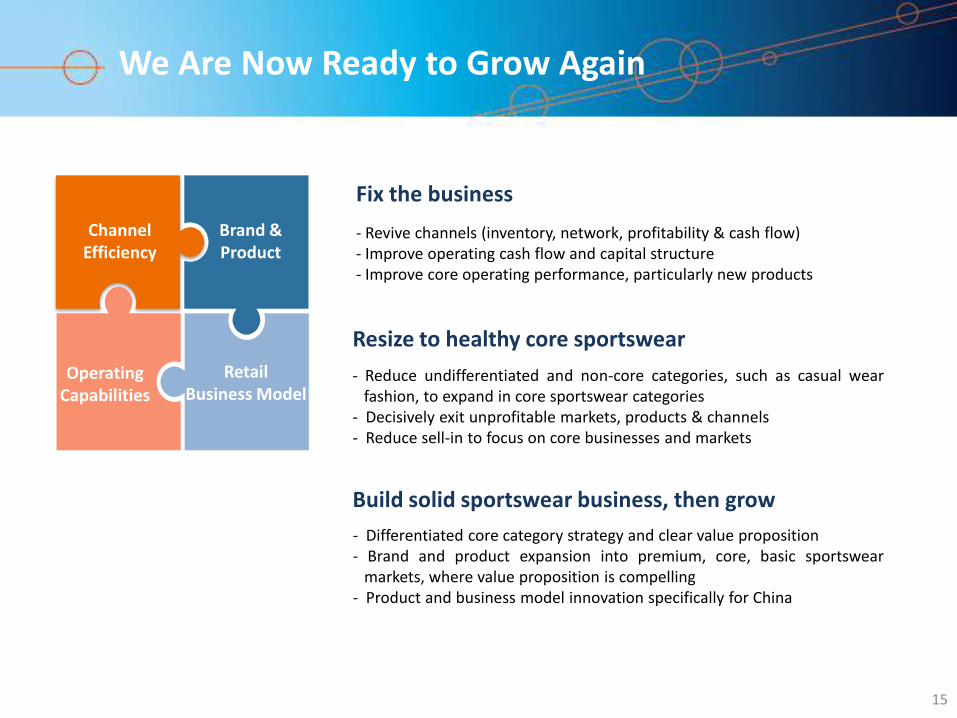
We Are Now Ready to Grow Again
Fix the business
- Revive channels (inventory, network, profitability & cash flow) - Improve operating cash flow and capital structure - Improve core operating performance, particularly new products
Resize to healthy core sportswear
- Reduce undifferentiated and non-core categories, such as casual wear fashion, to expand in core sportswear categories
- Decisively exit unprofitable markets, products & channels - Reduce sell-in to focus on core businesses and markets
Build solid sportswear business, then grow
- Differentiated core category strategy and clear value proposition - Brand and product expansion into premium, core, basic sportswear
markets, where value proposition is compelling - Product and business model innovation specifically for China
Channel Efficiency
Operating Capabilities
Brand & Product
Retail Business Model
16
Agenda
2013 Key Highlights and Strategic Vision
Strategy and Transformation Plan Update
Progress on Turnaround
Building China’s Leading Brand
Impacts on Financial Results
Financial Highlights
Open Forum

17
Channel Efficiency
Operating Capabilities
Brand & Product
Retail Business Model
Near-Term Turnaround
Channel Efficiency
Operating
Capabilities
Brand & Product
Retail Business Model

18
Channel inventory clearance and
buyback
Network rationalization
Adjustments in channel policies
Merchandising and product initiatives
Operational support
A/R restructuring
Key Initiatives Results
Distribution Channel Channel Revival Plan
Turnaround is on track and successful, but there remain a group of weak channel partners who still face challenges and lack resources for growth.
Group will need to invest more to continue restructuring the weak and supporting the strong, while building the new business.
Signed up over 90% of distributors; less than 10% managed out
Executed new operating model; improved store mix by increasing number of self-owned / regular stores with higher new product mix and by closing stores with low efficiency
Healthier cost structure, operating cash flow and inventory
Improved profitability and cash flow at majority of channel partners
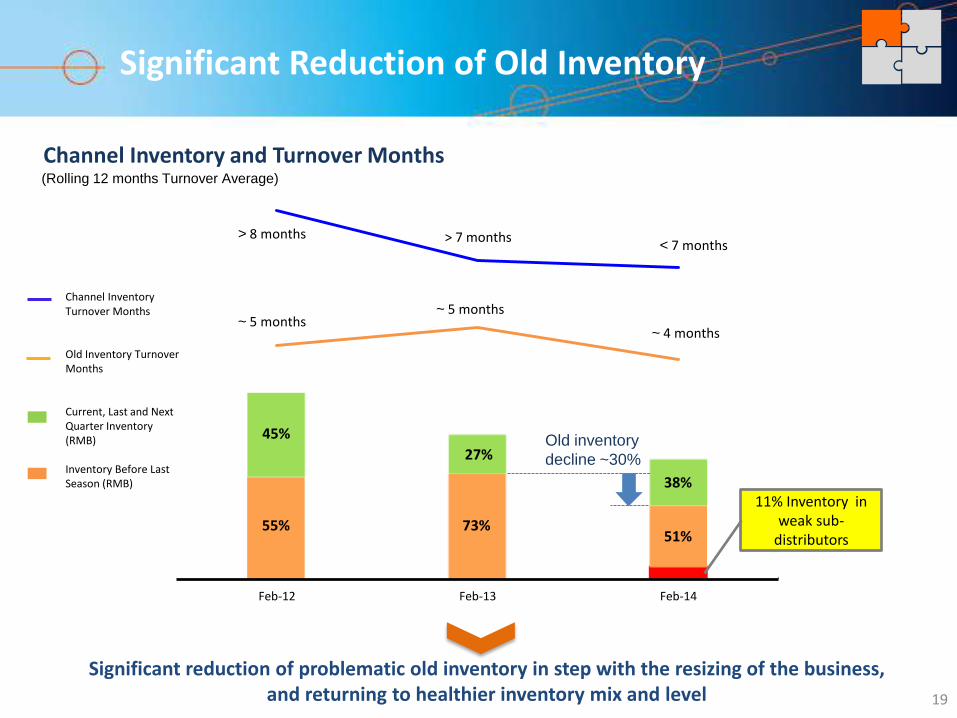
Significant Reduction of Old Inventory
Feb-12 Feb-13 Feb-14
19
Significant reduction of problematic old inventory in step with the resizing of the business, and returning to healthier inventory mix and level
11% Inventory in weak sub-
distributors
Channel Inventory and Turnover Months
Channel Inventory Turnover Months Old Inventory Turnover Months Current, Last and Next Quarter Inventory (RMB) Inventory Before Last Season (RMB)
Old inventory
decline ~30%
> 8 months
~ 5 months
45%
55%
27%
73% 51%
38%
(Rolling 12 months Turnover Average)
~ 4 months
~ 5 months
> 7 months < 7 months
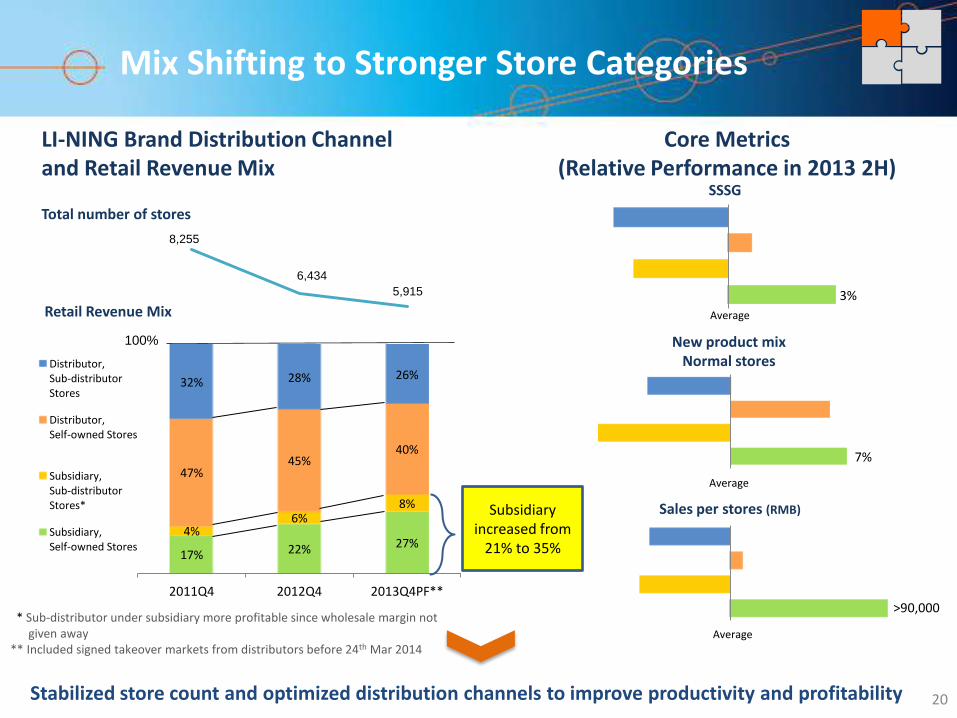
Mix Shifting to Stronger Store Categories
17% 22% 27% 4%
6% 8%
47% 45%
40%
32% 28% 26%
2011Q4 2012Q4 2013Q4PF**
Distributor, Sub-distributor Stores
Distributor, Self-owned Stores
Subsidiary, Sub-distributor Stores*
Subsidiary, Self-owned Stores
3%
SSSG
7%
New product mix Normal stores
Sales per stores (RMB)
Total number of stores
Retail Revenue Mix
LI-NING Brand Distribution Channel and Retail Revenue Mix
Core Metrics (Relative Performance in 2013 2H)
100%
Average
20
* Sub-distributor under subsidiary more profitable since wholesale margin not given away ** Included signed takeover markets from distributors before 24th Mar 2014
Stabilized store count and optimized distribution channels to improve productivity and profitability
Average
Average
Subsidiary increased from
21% to 35%
8,255
6,434
5,915
>90,000

98
89
FY2012 FY2013
-1,378
26
FY2012 FY2013
21
Significant Improvements in Cash and Profit
A/R Turnover Days EBITDA
Operating Cash Flow
(RMB million)
(RMB million)
-932
-14
FY2012 FY2013
Progress in turnaround initiatives lead to improvements in core financials
-870
222
FY2012 FY2013
Net Cash Position (RMB million)

22
Bad debt provision net
change
Lotto impairment
Sports Marketing Investment
Significant Savings Achieved to Invest in Transformation
- 2,009
4,282
2,910
-1,270
+400
-128
-611
+ 637
Cost Savings Investment in Growth & Transformation (RMB million)
2013 Total Operating &
Investment Cost (excluded COGS)
2012 Total Operating &
Investment Cost (excluded COGS)
Operating cost
reduction
Fixing and Building the
Platform
Self-own Retail
Expansion
+141
+96
CBA
Wade
Etc.
Operations cost reduction funded in full investments in platform and growth
Marketing savings
Organization restructuring
Lower channel subsidies
Other SG&A savings
Key Talents
Channel revival
IT & infrastructure

23
Agenda
2013 Key Highlights and Strategic Vision
Strategy and Transformation Plan Update
Progress on Turnaround
Building China’s Leading Brand
Impacts on Financial Results
Financial Highlights
Open Forum

24
Building the Platform
Channel Efficiency
Operating Capabilities
Brand & Product
Retail Business Model
25
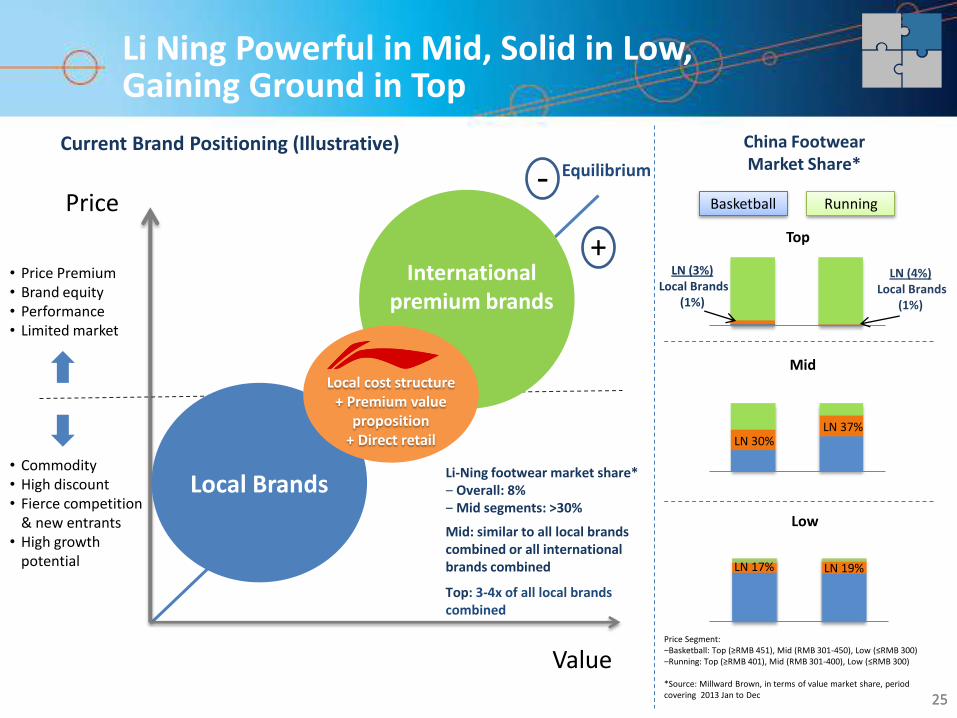
Li Ning Powerful in Mid, Solid in Low, Gaining Ground in Top
25
Price
Value
Equilibrium
International premium brands
Local Brands
China Footwear Market Share*
Top
Mid
Low
LN 30% LN 37%
LN 17% LN 19%
Local cost structure + Premium value
proposition + Direct retail
-
+
Basketball Running
Li-Ning footwear market share* ‒ Overall: 8% ‒ Mid segments: >30%
Mid: similar to all local brands combined or all international brands combined
Top: 3-4x of all local brands combined
LN (3%) Local Brands
(1%)
LN (4%) Local Brands
(1%)
Price Segment: ‒Basketball: Top (≥RMB 451), Mid (RMB 301-450), Low (≤RMB 300) ‒Running: Top (≥RMB 401), Mid (RMB 301-400), Low (≤RMB 300) *Source: Millward Brown, in terms of value market share, period covering 2013 Jan to Dec
• Price Premium • Brand equity • Performance • Limited market
• Commodity • High discount • Fierce competition
& new entrants • High growth
potential
Current Brand Positioning (Illustrative)

Chinese consumers’ physical fit, preferences, and functionality requirement
Strengthening Our Unique Strategic Advantages
26
Leading brand with authenticity, premium positioning, and unique marketing assets
Product innovation and design specifically for China’s youth
Operations model adopting key elements of direct-retail and fast-fashion
Move away from wholesale, which prevents direct communication with consumers through differentiated retail experience
Move to fast-fashion direct-retail model similar to leading Asia markets, e.g., Korea, with superior cost and productivity advantages
Shops merchandised according to local demand and season patterns using data and IT systems
Direct to core category consumers
WoW2 Chinese year of the Horse
Smart Moving tailor made for wider Chinese
feet
LN share the top of mind brand mention with leading global brands
Rated by China Brand Power Index 2013 as the No.1 brand in sports apparel for 3 consecutive years (No. 2 in sports shoes)*
Highest most-frequent-purchase-rate at 16% (vs. Nike at 13%, Anta at 14%)**
High brand loyalty with leading position for “the only brand to consider buying.”**
Brand image of "Pride for Chinese", "stable and reliable" and differentiated from local brands for being "inspirational".**
5 different category specific strategies:
Retail experience and brand positioning
Product value proposition and design
Go to market and marketing plans
*Source: Ministry of Industry and Information Technology of PRC **Source: Millward Brown, 2013 sports U&A study
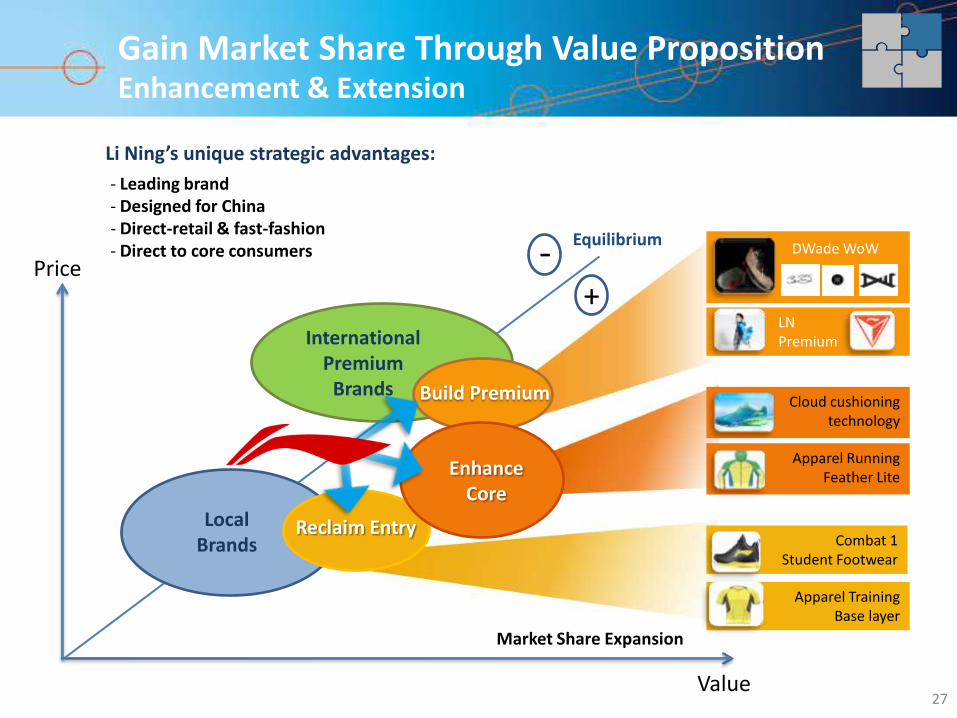
27
Li Ning’s unique strategic advantages:
- Leading brand - Designed for China - Direct-retail & fast-fashion - Direct to core consumers
Equilibrium
LN Premium
DWade WoW
Cloud cushioning technology
Apparel Running Feather Lite
Price
Value
+ -
Market Share Expansion
International Premium
Brands
Local Brands
Enhance Core
Build Premium
Reclaim Entry Combat 1
Student Footwear
Apparel Training Base layer
Gain Market Share Through Value Proposition Enhancement & Extension

Brand and Product Extension Working Basketball Shoes Example
28
Categories Target
Consumers Value Proposition
Sales Performance
Competitors
Premium (Enter New Business)
• DWade fans • Semi-pro or
serious amateur players
• Sneaker collectors
WoW2 (Wade Signature) – top professional shoes with industry-leading features • Designed by and for Dwade, for NBA competition • Unique full leather upper & carbon fibre foot plate • 50+ unique upper designs • Best mix of style with top notch Wade design and China elements • 30% cheaper than Nike signature
• Sold out within hours in every US launch
• Average sell-in rate in China is 2X higher for WoW2
Signature collection of Top International
Brands at much higher price points
Core (Enhance Existing
Business)
• CBA fans • Serious
amateur players
• Basketball subculture enthusiasts
BB Cloud – Pro-quality on-court performance shoes • Top-end shoe for CBA athletes in competitive games • Unique patented tooling material for optimised cushioning
& energy return • Dynamic & stylish design with breathable ultra shell tpu upper • 30%-40% cheaper than premium brands with similar value
• Best selling large volume in-line product in Q1 2014
• Sell-out rates 45% in first 7 weeks
Minimum direct competition due to
high value for money & lack of
compelling offering at this price point
Entry (Claim Back
Old Business)
• Students with frequent playing
• Basketball enthusiasts on budget
Combat – On & off court shoes for recreational players & young consumers • Basic, but fully functional on-court basketball shoe for
multi purpose (indoor & outdoor courts) • Cushioning, comfort & design • More functional and stylish at price point competitive to local brands
• Best selling large volume in-line product in 2013 Q1
• Sell-out rates 70% in first 12 weeks
Local sportswear brands, but usually
with minimum functionality and
style DNA
Li Ning 2013/2014 basketball season Hero Products; only brand to succeed at 3 price tiers
RMB 499
RMB 299
RMB 999

29
Focusing on 5 Core Categories Requires 5 Different Strategies and Initiatives
Core Target Consumers Business Drivers and Go To Market Approach Key Growth Initiatives
Bas
ketb
all
• Association with top leagues and stars • On-court performance, style, brand, and value • Word of mouth and credibility among sneakers and fans • Grass-roots street and digital basketball events
• Wade signature line & CBA fan pack • Campus apparels collection • Entry price on-court student shoes • Digital platform, fan clubs, & category shops
Ru
nn
ing
• Technical and targeted performance features (high- end); stylish design, comfort, and value (mid to entry) • Brand, media awareness, and KOL endorsement • Running events, Grass-roots community activities
• Innovation in core platforms • R&D partners for leading-edge products • Entry price and specialized niche products • Professional shoes and female collection
Trai
nin
g
• Functionality, fit, style, comfort, and brand power • Endorsement by coaches & athletes, celebrities & KOL, and upscale trend setters • Location seeding (gym, sports park etc.)
• Innovation in new material technologies • Female collection led by Seoul studio • Local Chinese exercise categories (i.e. group dance, modern martial art)
Spo
rts
Life
• Asian fashion trends, fit, comfort, and value • POP stars, youth idols, entertainment PR • Sports inspired design DNA and functional materials • Youth events (i.e. music, movies, entertainment shows)
• Li-Ning Premium from Seoul studio • Celebrity spokesperson • Youth Sports Apparel • Heritage collection
Bad
min
ton
• On-court product performance and brand recognition • National team endorsement & sports events exposure • Retail distribution, promotions, and service • On-court media and coaches endorsement
• Best-in-class racket technology • High performance professional shoes • Retail & R&D extension into mid & entry
Cool campus sports enthusiasts & players
Working sports lovers & committed runners
Disciplined practitioners
Trendy, stylish youths with sports inspiration
Committed amateur sports enthusiasts

* Fast response product includes only styles that have 13 weeks of sell through
(% of Sell In )
(3 months Sell Out Rates %)
(A+/ QR/ QS) Product
Non (A+/ QR/ QS) Product
A+/QR/QS Revenue Contribution
A+/QR/QS* Product Performance
1H2012 2H2012
30
2H2013 1H2013
Selling Period Trade Fair
1.Prescriptive Order
3. Quick Strike (QS)
2. Quick Replenishment (QR) of Hero SKU
Innovative Merchandising and Go-To-Market Model Driving Sales Performance
3Q13 4Q13
+10%
+5%

31
New Products Sell-Out Rates (end of the season, %)
After 3 months After 6 months
39%
65%
After 3 months After 5 months After 3 months After 6 months After 3 months After 6 months
Q1 Q4* Q3 Q2
5%
1H
2H
New Product Sales Growth Rate (% YoY)
2012 2013
27% 1H
2H
Sales per month per Store Productivity Growth (% YoY)
2012 2013
YoY drop from 12Q3 to 13Q2 due to carefully planned resizing of sell-in and retail network;
but, strong turnaround in 13H1
Sharp increase in per store new product sales due to improving sell-in and sell-
through performance
Products and Merchandising Strong Performance for New Products
2011 2012 2013 2011 2012 2013 2011 2012 2013 2011 2012 2013
*March data not available yet, 5 months sell-through data used for Q4
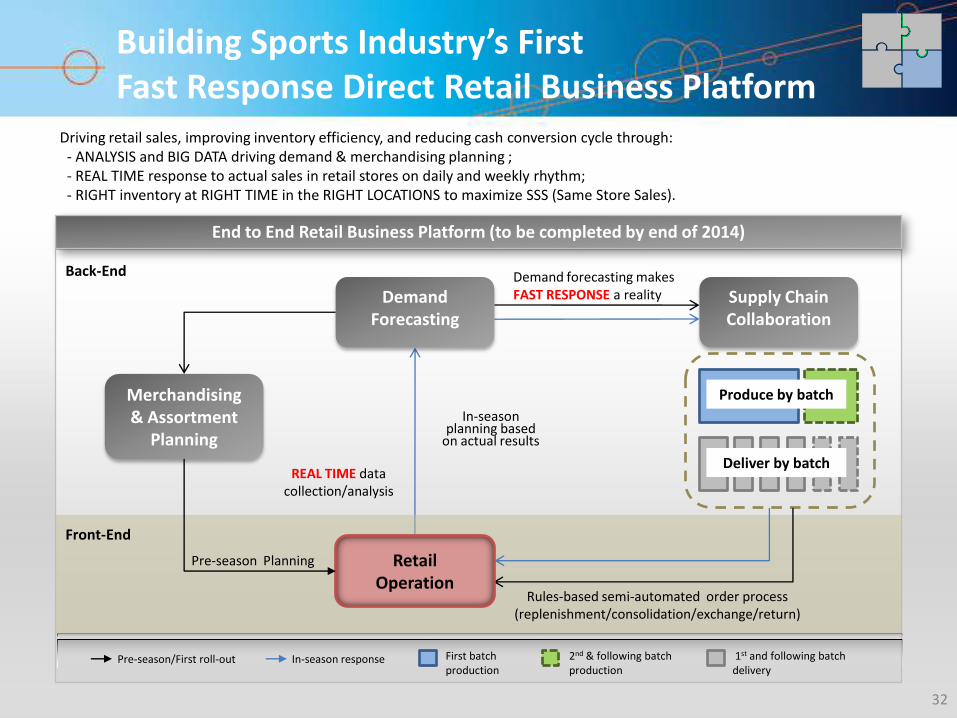
Driving retail sales, improving inventory efficiency, and reducing cash conversion cycle through: - ANALYSIS and BIG DATA driving demand & merchandising planning ; - REAL TIME response to actual sales in retail stores on daily and weekly rhythm; - RIGHT inventory at RIGHT TIME in the RIGHT LOCATIONS to maximize SSS (Same Store Sales).
32
End to End Retail Business Platform (to be completed by end of 2014)
In-season response Pre-season/First roll-out First batch production
2nd & following batch production
1st and following batch delivery
Demand Forecasting
Merchandising & Assortment
Planning
Supply Chain Collaboration
In-season planning based
on actual results
Demand forecasting makes FAST RESPONSE a reality
REAL TIME data collection/analysis
Produce by batch
Deliver by batch
Rules-based semi-automated order process (replenishment/consolidation/exchange/return)
Retail Operation
Pre-season Planning
Back-End
Front-End
Building Sports Industry’s First Fast Response Direct Retail Business Platform

33
Agenda
2013 Key Highlights and Strategic Vision
Strategy and Transformation Plan Update
Progress on Turnaround
Building China’s Leading Brand
Impacts on Financial Results
Financial Highlights
Open Forum
34
Turnaround has impacted 2013 results, but will have much less impact in 2014
Revival costs and resizing of sell-in and network have dragged on 2012 and 2013 P&L, but the magnitude has declined quickly and steadily over the last two years.
Despite severe financial impact, carefully orchestrated reduction of sell-in and network was necessary to 1) “right-size” business to its healthy core, 2) destock old inventory, and 3) protect cash flow
Negative financial impact from turnaround is expected to be limited in 2014 as recovery in high margin new products continues, but risk remains with 10% - 20% of weak channel partners (particularly sub-distributors) and 10% of old inventory that are difficult and expensive to dispose
Now, with our timely investment in growth, we believe we will start seeing improved financial returns
Upfront investments in key sportswear assets (e.g., CBA, Wade) have enhanced brand power and fueled growth in strategic categories, but will take 1 to 2 more years to fully realize their returns
Self-owned stores, particularly that of subsidiaries, have been performing strong, but they require investment up front in network expansion and store refit, to ensure good retail experience & productivity
Distributors’ profits and cash flow have improved and reached stability for operations, but paying down past AR drains the cash they need for growth; hence, may need external funding support to increase working capital and expand network
Although the group’s net cash position is much stronger, market uncertainties could pose challenges to the continued progression of the Group’s transformation
Fruition of Investment Will Take Time


(RMB million)
36
(RMB million) FY2013
FY2012 (Restated*) Better/(Worse)
For the 12 months ended 31 December
Revenue 5,824 6,676 (13%)
Gross Profit 2,594 2,514 3%
Distribution costs -2,674 -2,612 (2%)
Administrative expenses -236 -1,670 86%
Other income and other gains – net 147 169 (13%)
Operating (Loss) /Profit -169 -1,599 89%
EBITDA 26 -1,378 N/A
(Loss)/Profit Attributable to Equity Holders -392 -1,980 80%
Basic Losses/ Earnings per share (RMB cents) -29.9 -172.6 83%
Annual dividend (RMB cents) - - -
* Note: Under IFRS 11, proportional consolidation of joint ventures is no longer allowed. The Group accounted for its investment in Li-Ning Aigle Ventures using equity method of accounting at the beginning of the earliest period presented.
Summary of Income Statement

37
FY2013 FY2012
(Restated*) Better/(Worse)
For the 12 months ended 31 December
Gross Profit Margin 44.5% 37.7% 6.8p.p.
Operating Profit Margin -2.9% -23.9% 21.0p.p.
EBITDA Margin 0.4% -20.6% 21.0p.p.
Margin of (Loss) /Profit Attributable to Equity
Holders -6.7% -29.6% 22.9p.p.
R&D Expenses (as % of revenue) 3.0% 2.9% (0.1p.p.)
A&P Expenses (as % of revenue) 24.2% 19.6% (4.6p.p.)
Staff Costs (as % of revenue) 11.5% 10.9% (0.6p.p.)
Profit Margins And Expense Ratios
*Excluding the acquisition expenditures
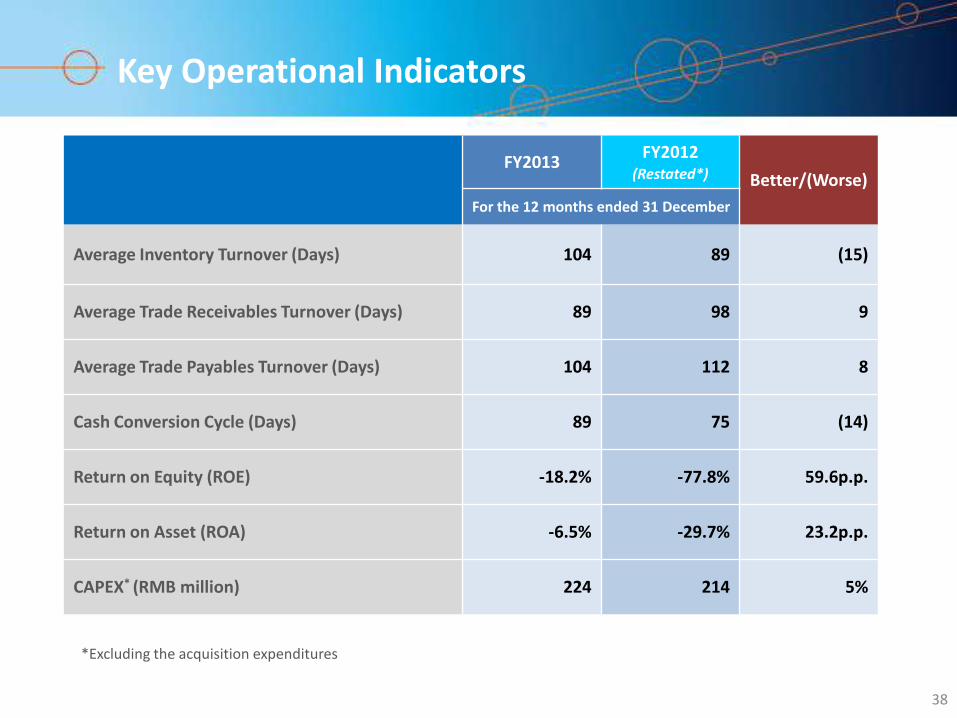
38
FY2013 FY2012
(Restated*) Better/(Worse)
For the 12 months ended 31 December
Average Inventory Turnover (Days) 104 89 (15)
Average Trade Receivables Turnover (Days) 89 98 9
Average Trade Payables Turnover (Days) 104 112 8
Cash Conversion Cycle (Days) 89 75 (14)
Return on Equity (ROE) -18.2% -77.8% 59.6p.p.
Return on Asset (ROA) -6.5% -29.7% 23.2p.p.
CAPEX* (RMB million) 224 214 5%
Key Operational Indicators
(RMB million)
39
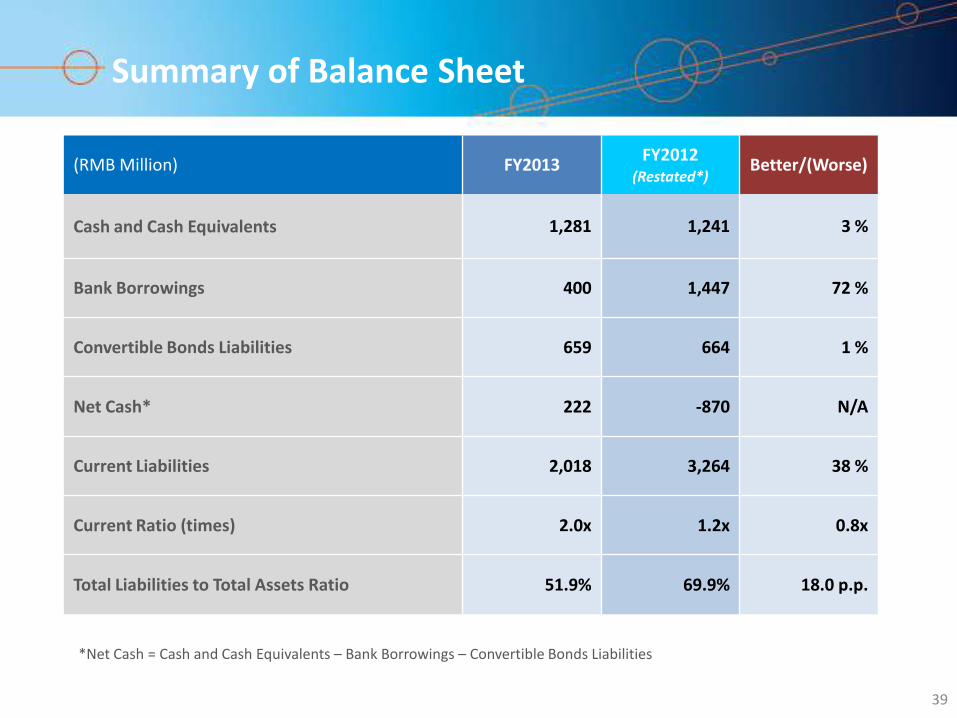
*Net Cash = Cash and Cash Equivalents – Bank Borrowings – Convertible Bonds Liabilities
(RMB Million) FY2013 FY2012
(Restated*) Better/(Worse)
Cash and Cash Equivalents 1,281 1,241 3 %
Bank Borrowings 400 1,447 72 %
Convertible Bonds Liabilities 659 664 1 %
Net Cash* 222 -870 N/A
Current Liabilities 2,018 3,264 38 %
Current Ratio (times) 2.0x 1.2x 0.8x
Total Liabilities to Total Assets Ratio 51.9% 69.9% 18.0 p.p.
Summary of Balance Sheet

40
• Readjusting market strategy.
• Amended the license agreement to lower finance costs.
• Continued to adopt "sponsorship of sports stars and sports events" as its core marketing and promotion strategy.
• Worldwide professional athletes and >85% of China National Table Tennis team members opted for the Double Happiness branded covering.
• Launched an "e" series, specifically for e-commerce channels in 2013.
• Stable progress was achieved, including increased sales in existing stores.
• Remain one of the leading brands in outdoor and leisure sectors in malls and airports of major cities.
• Continued the steady growth momentum
• Newly developed apparel and shoes maintained market competitiveness in product design and pricing.
Other Brands
Our Other Brands