interannual-to-decadal variability of antarctic ice shelf elevations from multi-mission satellite...
TRANSCRIPT

Interannual-to-decadal variability of Antarctic ice shelf elevations from
multi-mission satellite radar altimetry
Fernando Paolo; Helen Amanda Fricker Scripps Institution of Oceanography, UCSD
Laurence Padman Earth & Space Research

2
Large scale studies on ice shelves
Pritchard et al., 2012Zwally et al., 2005 Shepherd et al., 2010
9 years50 km
DurationSpat. Res.
14 yearsOne value per ice shelf
5 years30 km
ICESat 2003-2008ERS-1/2 1992-2001 ERS-2/Envisat 1994-2008
This study ! ERS-1 + ERS-2 + Envisat, 1992-2012

3
The need for multi-mission RA
Long vs short records in detecting climate trends
Our goal: identify interannual to decadal variability on the ice shelf at spatial scales ~20-30 km
Fricker and Padman, 2012
How long? At least decadal observations(20+ years)
Interannual and decadal variability underexplored
*

4
Penetration depth (backscatter)
Penetration depth:
! Water ! "(mm)! Wet snow ! O(cm)! Dry snow ! O(m)
! And varies with time
Radar penetrates into firn layer
(A)
(B)

5
CONSTRUCTING TIME SERIES OF dhSimilar (but not the same) method as Davis & Segura (2001), Zwally et al. (2005), Khvorostovsky (2011).

6
Averaging in time and space
less crossovers per bin → larger error bars
improved signal-to-noise ratio and no gaps
1 vs 3-month averages
20-30 km bins
3 x

7
Averaging time seriesAt every individual grid-cell we have several time series
2) Then we frequency-weighted average the aligned time series
1) To align we use average of the offset for overlap period only
outliers
*

8
Backscatter correction (2 approaches)
Wingham et al., 1998; Davis & Ferguson, 2004; Zwally et al., 2005
→

9
Backscatter correction (2 approaches)
Wingham et al., 1998; Davis & Ferguson, 2004; Zwally et al., 2005
(1) absolute values (2) differences (derivative)
backscatter change diff backscatter change
diff
elev
atio
n ch
ange
elev
atio
n ch
ange
→

10
Correlation between dh and dAGC
(1)
(2)
ROSSFRIS

11
Backscatter correction (approach 3)
What if the correlation is not constant → R(t)?

12
Backscatter correction (approach 3)
What if the correlation is not constant → R(t)?
Correlation
Sensitivity

13
NOW SOME RESULTS

14
20-year trend in elevation change(original grid)
High spatial and temporal variability

15
Note: 2001 was chosen to avoid a big calving event
20-year trend in elevation change(original grid)
High spatial and temporal variability

16
High interannual variability

17
Coherent changes?Tracking coherent events around the Antarctic margin
?

18
DO WE KNOW WHAT WE ARE MEASURING?

19
Envisat vs ICESat
Subsampling RAaccording ICESatcampaigns
SubsamplingRA accordingICESat coverage
Observations by both satellites at the same location at the same time!

20
Envisat vs ICESat
Subsampling RAaccording ICESatcampaigns
Envisat ICESat
SubsamplingRA accordingICESat coverage
Observations by both satellites at the same location at the same time!

6-year trends in elevation change

22
Area-averaged time series (1)
Envisat with no backscatter correction
ROSS Ice Shelf

23
Area-averaged time series (2)
Envisat with backscatter correction (approach 1)
ROSS Ice Shelf

24
Area-averaged time series (3)
Envisat with backscatter correction (approach 2)
ROSS Ice Shelf

25
Area-averaged time series (4)
ICESat with no inter-campaign biases applied
ROSS Ice Shelf

26
Area-averaged time series (5)
ICESat with inter-campaign biases applied (Urban)
ROSS Ice Shelf

27
Area-averaged time series (6)
ICESat with inter-campaign biases applied (Zwally)
ROSS Ice Shelf
28
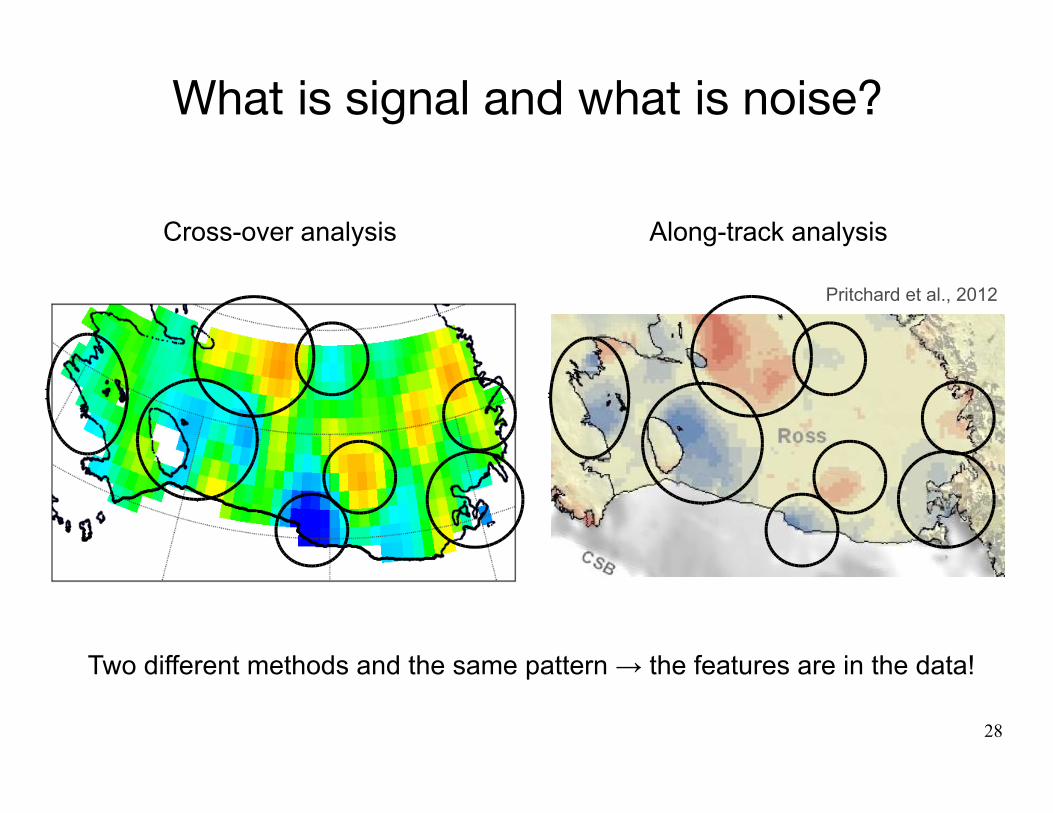
What is signal and what is noise?
Pritchard et al., 2012
Two different methods and the same pattern ! the features are in the data!
Cross-over analysis Along-track analysis

29
Summary
! Continuous long (~20 year) time series of ice shelf elevation constructed from multi-mission RA
! Reveals large variability both in time and space that can be misinterpreted as trends in single-mission satellite analyses
! (Future work) Use elevation variability to identify oceanic and atmospheric forcings affecting ice-shelf mass balance
! Issues! Relative error (precision) vs absolute error (penetration)! Different backscatter and biases yield different results! Why don't Envisat and ICESat agree for 2004-2010? What
are they measuring differently?

30
We thank
! NASA NESSF Fellowship
! Jay Zwally & Jairo Santana (NASA/GSFC)
! Curt Davis (UM) & Duncan Wingham (UCL)
! NASA grants NNX06AD40G and NNX10AG19G
! ESA for ERS-1, ERS-2 and Envisat altimeters
! San Diego Super Computer Center
! Python and Open Source

31
Antarctic ice shelf mask
A reliable and complete ice shelf mask is a problem
So we (Geir Moholdt) created our own using all data available: MOA (Scambos et al. 2007), ASAID (Bindschadler et al. 2011), InSAR (Rignot et al. 2011), ICESat (Fricker/Brunt et al. 2006-10)
*

32
Challenges of multi-mission integration
! Differences between missions:
- RA systems, orbit configurations, time spans...
! Radar interaction with time variable surface properties! Spatial and temporal dependent corrections:
- Ocean tides (for high lat)
- Atm pressure (IBE)
- Surface density (firn densification)
- Penetration depth (backscatter)

33
How to reduce the noise?
! Due to hydrostatic equilibrium the altimeter only see 10% of the grounded ice signal (in elevation change)
! So to increase signal-to-noise ratio → requires lots of averaging both in time and space
*

34
The uncertainty
! How well do we know the error?
! What do error bars in the time series actually represent?
! What about the uncertainty in penetration depth?
O(m/cm)
After all the averaging a mean error is: ± 5-20 cm over 20-30 km

35
High spatial and temporal variability
Note: 2001 was chosen to avoid a big calving event
20-year trend in elevation change(original grid)