influence of local and remote sst on north atlantic...
TRANSCRIPT

Influence of local and remote SST on North Atlantic tropicalcyclone potential intensity
Suzana J. Camargo • Mingfang Ting •
Yochanan Kushnir
Received: 28 December 2011 / Accepted: 17 September 2012 / Published online: 6 October 2012
� Springer-Verlag Berlin Heidelberg 2012
Abstract We examine the role of local and remote sea
surface temperature (SST) on the tropical cyclone potential
intensity in the North Atlantic using a suite of model
simulations, while separating the impact of anthropogenic
(external) forcing and the internal influence of Atlantic
Multidecadal Variability. To enable the separation by SST
region of influence we use an ensemble of global atmo-
spheric climate model simulations forced with historical,
1856–2006 full global SSTs, and compare the results to
two other simulations with historical SSTs confined to the
tropical Atlantic and to the tropical Indian Ocean and
Pacific. The effects of anthropogenic plus other external
forcing and that of internal variability are separated by
using a linear, ‘‘signal-to-noise’’ maximizing EOF analysis
and by projecting the three model ensemble outputs onto
the respective external forcing and internal variability time
series. Consistent with previous results indicating a tam-
pering influence of global tropical warming on the Atlantic
hurricane potential intensity, our results show that non-
local SST tends to reduce potential intensity associated
with locally forced warming through changing the upper
level atmospheric temperatures. Our results further indicate
that the late twentieth Century increase in North Atlantic
potential intensity, may not have been dominated by
anthropogenic influence but rather by internal variability.
Keywords Sea surface temperature � Potential intensity �Hurricanes � Local and remote effects
1 Introduction
Understanding and predicting variability and change in
tropical cyclone activity (intensity and frequency) is a topic
of great societal concern due to the potentially catastrophic
impacts of these storms. As an example, the infamous
Hurricane Katrina of 2005 appears to be the most costly
natural disaster to strike the United States ever, and the
deadliest since 1928 (Graumann et al. 2005), with total
estimated damage exceeding 100 billion dollars and the
death toll of more than 1,300. It also resulted in a dis-
placement of 250,000 people, a higher number than the
Dust Bowl years of the 1930s (Graumann et al. 2005).
The relationship between ocean temperature and tropical
cyclone activity (frequency and intensity) has long been
noted in the literature. Warm local sea surface temperatures
(SSTs) are a necessary condition for the formation and
intensification of tropical cyclones (e.g. Palmen 1948; Gray
1968; 1979; Emanuel 1987). It is not entirely clear, how-
ever, how increasing SSTs in a warming world would
influence tropical cyclone activity.
One measure of the relationship between SST and
tropical cyclone activity is the potential intensity (PI;
Emanuel 1986, 1988; Holland 1997), which is a theoretical
concept that evaluates maximum intensity that a tropical
cyclone could reach given the available thermodynamic
energy for tropical cyclone intensification in the environ-
ment, including the underlying ocean. Although PI is
strongly related to SST, it is also affected by the properties
of the atmosphere. While there are caveats associated with
PI theory (Smith et al. 2008; Montgomery et al. 2009) due
to some of the simplifications made in its development, an
alternative theory or measure of maximum theoretical
intensity has not been fully developed. For instance, in a
simplified axisymmetric framework, improvements of the
S. J. Camargo (&) � M. Ting � Y. Kushnir
Lamont-Doherty Earth Observatory, Columbia University,
Palisades, NY 10964, USA
e-mail: [email protected]
123
Clim Dyn (2013) 40:1515–1529
DOI 10.1007/s00382-012-1536-4

model cannot be expressed in terms of environmental
conditions only and therefore the latter cannot be used to
predict a theoretical limit for the intensity for a given
environment (Bryan and Rotunno 2009). That said, PI
theory has been well validated with observations. For
example, Wing et al. (2007) showed that observed inter-
annual variations of maximum tropical cyclone intensity
are consistent with PI predictions.
Theoretical studies predict an increase in tropical
cyclone intensity in a warming world due to the increasing
SSTs and the thermodynamic state of the atmosphere
(Emanuel 1987; Holland 1997). However, Vecchi and
Soden (2007) showed that there are regions where the PI
decreases in model projections of the 21st century even
though the tropical oceans warm everywhere. Vecchi and
Soden (2007) argued that non-local SST could modify PI
through their influence on upper atmospheric temperatures.
Furthermore, Vecchi et al. (2008) discussed the funda-
mental importance of the remote SST contribution to the
power dissipation index (PDI, Emanuel 2005) and indi-
cated that it is the relative warming of the local SST with
respect to the tropic-wide warming that determines the PDI
trend. Extrapolating PDI projections based on relative and
total SST leads to very different results for the 21st century
than when considering only local effects. For the tropical
Atlantic this happens because the local SSTs do not exhibit
a substantial trend in the 21st century relative to the entire
tropics (Vecchi et al. 2008; Villarini and Vecchi 2012).
Swanson (2008) argued further that there is no straight-
forward link between warmer SSTs in the so-called
Atlantic main development region (MDR) and more
intense tropical cyclones. More recently, Ramsay and
Sobel (2011) used a single-column model to investigate the
effects of the relative and absolute SST on the PI and
concluded that the PI is more sensitive to relative SST than
to absolute SST and they attributed this sensitivity pri-
marily to larger changes in the air-sea disequilibrium as
SST changes.
Sobel and Camargo (2012) analyzed various tropical
environmental variables in the twenty-first century and
examined their remaining ‘‘seasonal change’’ once the
annual change is subtracted. Similar to other environmental
variables, for the twenty-first century, seasonal PI increases
in the summer hemisphere and decreases in the winter
hemisphere compared to the present, following the SST
seasonal changes. Since the annual mean is marked by
relative warming in the Northern Hemisphere compared to
the Southern Hemisphere, the twenty-first century pro-
jected seasonal PI opposes the annual mean change in
January-March (JFM) and enhances the annual mean
change in July–August (JAS).
The North Atlantic, including the MDR, is a region of
intense decadal and longer time scale variability. The
relationship between hurricane activity and internal modes
of variability such as Atlantic Multidecadal Variability
(AMV, also known as Atlantic Multidecadal Oscillation—
AMO, e.g., Kushnir 1994; Enfield et al. 2001) has been the
subject of various studies. The AMV is generally repre-
sented by the anomaly in SST averaged over the entire
North Atlantic basin (Enfield et al. 2001) and as such
assuming a tight connection between tropical and extra-
tropical North Atlantic SST variability. Goldenberg et al.
(2001) showed that there exists a positive relationship
between the Atlantic hurricane activity and multi-decadal
tropical Atlantic SSTs in the tropical storms MDR and that
the latter is part of the basin pattern. This association was
also stressed in Zhang and Delworth (2006). In contrast,
Mann and Emanuel (2006) attributed the variability in the
Atlantic tropical cyclone decadal variability during the late
nineteenth and twentieth centuries primarily to the impact
of anthropogenic forcing on MDR SSTs, including a
regional cooling due to aerosol forcing between *1950
and *1970. Ting et al. (2009) and DelSole et al. (2011)
however, showed that while anthropogenic forcing plays an
important role in the warming of tropical Atlantic SST, the
natural, AMV related changes are separately distinguish-
able there. Others have shown a relation between the
so-called Atlantic Meridional Mode (Servain 1991)—a
phenomenon correlated with AMV—and interannual
time scale variability in Atlantic tropical cyclone activity
(Vimont and Kossin 2007; Kossin and Vimont 2007;
Kossin et al. 2010).
The recent warming of North Atlantic SSTs (Fig. 1) and
the documented importance of natural and anthropogenic
forcing in this warming, call for an attempt to quantita-
tively distinguish between the roles of anthropogenic
forcing and internal variability contributions to the PI trend
in the region. The distinction between natural anthropo-
genic forcing in the climate system is fundamental for
decadal predictability studies (Solomon et al. 2011).
Moreover, it is also important in this context to determine
the role of local and remote SST changes in determining PI
changes.
To address these goals we use a set of long simulations
of an atmospheric global climate model, forced with pre-
scribed historical SSTs and examine the differences in PI
between these simulations in the North Atlantic domain. In
order to separate the role of the local (i.e., tropical Atlantic)
SST from the remote SST forcing, we use primarily three
different ensembles: in the first ensemble, the atmospheric
model is forced with historical, time-varying global SSTs.
The second ensemble is forced with SSTs varying only in
the tropical Atlantic between 30�S and 30�N while else-
where SSTs are kept at their climatological, monthly
varying values. In the third ensemble only the tropical
Atlantic SST has climatological values, while the tropical
1516 S. J. Camargo et al.
123

Indian and Pacific region SST varies. The varying SSTs are
identical among these three cases, i.e. the tropical Atlantic
SSTs in the simulation forced with that region only are the
same SSTs as in the case of the global forced simulation,
etc. By comparing the PI in these three sets of simulations,
one can determine the role of the remote and local SST
variability in the PI variability. These comparisons are not
only done in the context of global warming, as in Vecchi
and Soden (2007), but we also consider the role of local
and external forcing in the case of the AMV. The latter
roles are determined in a regression method as in Ting et al.
(2009) and are explained in more details below.
In summary, our study will analyze the roles of relative
and absolute SST in the PI of the tropical North Atlantic
and their separate contribution in natural, AMV-related and
anthropogenic changes.
A caveat to keep in mind is that we focus here on PI
variations in the tropical Atlantic basin as a whole and in
the Atlantic MDR, i.e. the ambient PI, the potential
intensity theory is actually defined by the local thermody-
namics conditions that surround a storm. The importance of
the local storm PI variability instead of basin wide PI
variability, is that on interannual to decadal time-scales, the
local PI is sensitive to hurricane track variability in addi-
tion to changes in the ambient PI (Wing et al. 2007).
Furthermore, Kossin and Camargo (2009) showed that
while the local storm environmental conditions have the
same variability and secular trends as that of the tropical
mean environment, when we consider track variability the
regional trend signal in PI is significantly reduced.
The paper is divided as follows. In Sect. 2 we describe
the model simulations and data used in our analysis. The
model PI in the Atlantic is compared with reanalysis PI
over the same region in Sect. 3. The main results on forced
and natural variability of PI are presented in the next sec-
tion followed by the Summary.
2 Data and model simulations
We analyze various simulations of the NCAR Community
Climate Model, version 3 (CCM3) run at T42 resolution
with 18 vertical levels (Kiehl et al. 1998). The model was
run with prescribed historical SST (globally or in individ-
ual ocean basins) from 1856 to the present. These simu-
lations have been used in various studies focusing on
SST-climate relationship (Seager et al. 2005, 2008; Seager
2007 and Kushnir et al. 2010). In addition, we included
here a new simulation, to complement these previous ones
(see below). We consider three different experiments, two
with 16 and one with 8 ensemble members, with each
member starting from a slightly different initial atmo-
spheric state (see Seager et al. 2005 for further explana-
tion). Each experiment was forced with time-varying,
1.9
2
2.1
2.2
2.3
2.4
2.5
2.6
2.7
RS
ST
(C
)
58
59
60
61
62
63
64
65
66
PI (
m/s
)
1950 1960 1970 1980 1990 200027
27.2
27.4
27.6
27.8
28
Year
SS
T (
C)
Mean JJASON North Atlantic MDR: SST, Relative SST and PI
SSTRel SSTPI
Fig. 1 Tropical North Atlantic
MDR averaged SST (solid line),
relative SST (dotted line) and
tropical cyclone potential
intensity (PI) (dashed line)
computed using NCEP/NCAR
reanalysis for the period
1950–2006. A 5-year running
mean is applied to the annual
value of June to November
average hurricane season. The
relative SST is defined as the
difference of the SST and the
zonal mean SST (30�S–30�N)
(Vecchi and Soden 2007). SST
and relative SST are in �C and
PI is shown in m/s
Influence of local and remote SST 1517
123

historical, monthly SSTs, using a merge between the Kaplan
SST analysis (Kaplan et al. 1998) and the Hadley Center
HadISST (Rayner et al. 2003). More details on the merging of
these two products are given in Seager et al. (2005).
The three sets of CCM3 ensemble use SSTs prescribed
in three different parts of the global ocean, following the
concepts first introduced in Lau and Nath (1994). The first
ensemble was forced with SSTs prescribed globally and is
referred to as the Global Ocean Global Atmosphere
(GOGA) ensemble. The second ensemble was forced with
time-varying SSTs prescribed only in the tropical Atlantic
domain (30�S–30�N) while a repeated, climatological
annual SST cycle was prescribed everywhere else; this
ensemble is referred to as the Tropical Atlantic Global
Atmosphere (TAGA) ensemble. The third and new
ensemble was forced with time-varying SSTs in the trop-
ical (30�S–30�N) Indian and Pacific Oceans, between
Africa and South America, with climatological SST pre-
scribed everywhere else; this ensemble is referred to as
Indian Ocean Pacific Ocean Global Atmosphere (IOPOG-
A) ensemble.
To further understand our results, a set of idealized
simulations, with fixed patterns of SST anomalies, different
from one another, were also used with the same CCM3
model. Here the prescribed fixed SST anomalies corre-
sponded to the leading patterns of SST variability in the
Atlantic during 1901–2004 as derived in a rotated EOF
analysis by Schubert et al. (2009), where these simulations
are further discussed. Specifically, the prescribed SST
fields in these integrations corresponded to a climatological
ocean to which an anomaly pattern corresponding to the
warm or cold phase of the AMV was added. These inte-
grations extended through 50 repeated annual cycles.
The PI was calculated using the formulation developed
by Emanuel in a series of papers (Emanuel 1988, 1995;
Bister and Emanuel 1998, 2002a, b) applied to the CCM3
model output. A brief description of the method for PI
calculation can be found in the appendix of Camargo et al.
(2007). We first calculate the PI for each of the ensemble
members and then average to obtain the PI for the
ensemble mean of each case. We also calculated the PI
using the atmospheric data from the NCEP/NCAR
Reanalysis (Kalnay et al. 1996; Kistler et al. 2001), ERA-
40 Reanalysis (Uppala et al. 2005) and ERA-Interim
Reanalysis (ERA-Interim 2011), but with the same SSTs
and horizontal resolution as in the GOGA simulations. The
reason for using the GOGA run SST dataset and horizontal
resolution of the NCEP/NCAR Reanalysis was to exclude a
possible source of differences among the PI fields calcu-
lated from the various reanalysis datasets. It is important to
note that these reanalysis datasets cover different time
intervals, the NCEP/NCAR from 1948 to 2010, the ERA40
from September 1957 to August 2002, and the ERA-
Interim Reanalysis from 1989 to 2009. The figures com-
paring anomalies between reanalysis and model fields are
calculated with respect to the climatologies during the time
interval common to all of them, i.e., for the years
1989–2001.
The indices for the AMV and externally forced anthro-
pogenic change used in the present analysis were obtained
as in Ting et al. (2009). The methodology for deriving
these indices is based on the linear method of the so-called
Signal-to-Noise Maximizing EOF analysis, where IPCC
fourth Assessment models are used to determine the forced
signal and the AMV time series is calculated as a residual
(see Ting et al. 2009). These indices are extended here for
the period 1900–2006.
3 Results
3.1 Potential intensity in the model and reanalysis
We first compare the PI calculated from CCM3 model
GOGA simulation and that from the 3 reanalysis products
for the common period of 1989–2001. Figure 2 shows
the annual maximum climatological patterns of PI for the
GOGA ensemble mean and the 3 reanalyses, i.e. the
maximum value of the climatological PI in each grid point.
The general patterns of the PI, with maxima over the Indian
Ocean and western tropical Pacific, are very similar for
CCM3 and all three reanalysis. While the PI values of the
GOGA ensemble mean simulation are somewhat higher
than both the NCEP and ERA-40 reanalysis, they are
similar to the ERA-Interim reanalysis. Furthermore, while
in all three reanalysis there is a minimum of PI at the
eastern equatorial Pacific, this minimum is much less
pronounced for GOGA.
Because we are mainly interested in the North Atlantic,
we compare in Fig. 3 the three reanalysis and the GOGA
ensemble mean in that basin. Plotted are the mean PI
values in June–November (JJASON, the Atlantic hurricane
season). The GOGA PI pattern is very similar to those of
the reanalysis, with closer agreement to the ERA-Interim
reanalysis compared to the other two datasets. Maximum
climatological PI values of over 70 m/s are found in the
Caribbean, Gulf of Mexico and the MDR, which includes
the Caribbean and Atlantic Ocean between 9�N and 21.5�N
(Goldenberg et al. 2001). As latitude increases, PI
decreases, with the steepest gradient occurring in the
eastern part of the basin.
The interannual variability of the PI in the MDR is
shown in Fig. 4. The figure displays the anomalous PI
averaged over the MDR during the JJASON hurricane
season, between 1860 and 2006 (panel (a)), as depicted by
the GOGA ensemble mean and by the corresponding
1518 S. J. Camargo et al.
123

reanalysis (the years of overlap between the model and
reanalysis are plotted also separately in panel (b)). The
correlations between the reanalysis and the ensemble mean
PI for GOGA over the Atlantic MDR are shown in Table 1.
The GOGA ensemble mean exhibits a significant (at the 5 %
level) correlation with all three reanalyses during the respec-
tive (and differing) overlap years. The highest correlation
(0.92) is between GOGA and ERA-Interim and ERA40, for
the years 1989–2006 and 1989–2001, respectively.
3.2 Comparison of GOGA, TAGA and IOPOGA
simulations
By comparing the PI calculated from the GOGA, TAGA
and IOPOGA experiments, we can readily separate the
contribution to PI due to atmospheric response to tropical
Atlantic SST and that due to atmospheric response to the
SST in the tropical Indian and Pacific region, i.e. the
remote SST contribution. Figure 5a, c, e show the PI cli-
matology in the tropical Atlantic during the peak hurricane
season August–October (ASO), for the GOGA, TAGA and
IOPOGA ensembles, respectively. The differences between
the GOGA and TAGA runs (GOGA–TAGA), GOGA and
IOPOGA, TAGA and IOPOGA during ASO are shown in
Fig. 5b, d, e, respectively. In general, the climatological PI
values are smaller in the GOGA than in the TAGA simu-
lation (Fig. 5b), showing that remote SST forcing causes a
reduction in tropical Atlantic PI values. The largest dif-
ferences in GOGA and TAGA PI are found in the tropical
North Atlantic east of the Caribbean and the tropical South
Atlantic in the Northeast coast of Brazil. There are a few
grid points in the Caribbean that show slight increases in PI
in TAGA compared to GOGA in ASO. On the other hand,
the difference of GOGA and IOPOGA PI climatologies is
Fig. 2 Annual maximum of climatological PI (m/s) for a ensemble mean GOGA, b NCEP reanalysis, c ERA-40 reanalysis, d ERA-Interim
reanalysis (common period 1989–2001)
Influence of local and remote SST 1519
123

noisier, with positive and negative values spread across the
Atlantic, so that when integrated for the whole basin, the
difference in the GOGA and IOPOGA climatologies is small.
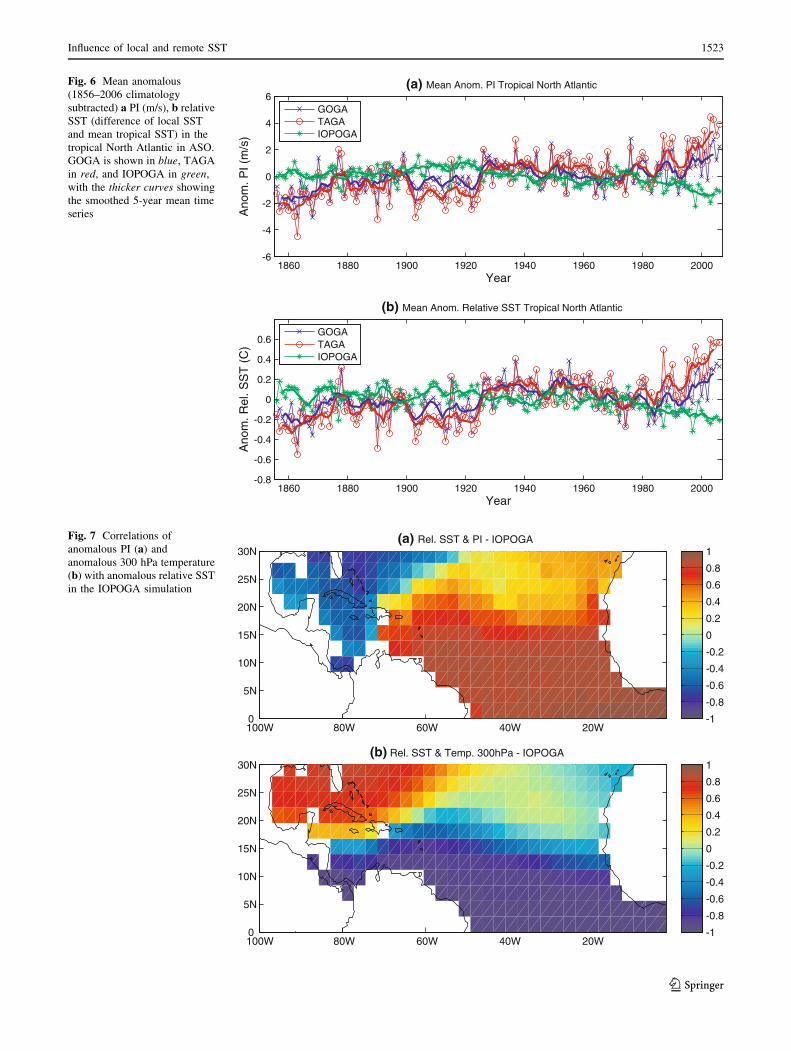
The influence of remote SST variability is also evident
in Fig. 6a, which shows the anomalous (with respect to the
1856–2006 climatology) ASO PI for the GOGA, TAGA
and IOPOGA simulations averaged in the tropical North
Atlantic (0–30�N). The figure clearly shows that both
GOGA and TAGA exhibit a positive trend as well as
multidecadal variability during this period, with the TAGA
PI trend and amplitude of variability larger than that in
GOGA. In contrast, the IOPOGA simulation has a negative
trend and little multidecadal variability. The different
temporal variation between GOGA, TAGA and the IOP-
OGA is consistent with the relative SST of the tropical
North Atlantic with respect to the tropical-wide mean SST,
as shown in Fig. 6b. The close relation between the PI and
relative SST confirms the results of Vecchi and Soden
(2007), which considered relative SST as a very good
proxy for PI. When the local SST warms (cools) more than
the tropical mean, i.e., the relative SST increases (decrea-
ses), and PI increases (decreases).
Previous studies (Sobel et al. 2002; Tang and Neelin
1994) pointed out that the remote SST could influence
the Atlantic PI through responses of the free-tropospheric
temperature to remote SST changes. A warming of SST
in remote tropical locations relative to the local SST
leads to a larger warming of the upper tropospheric
temperature relative to the local effect alone and con-
sequently to the stabilization of the local atmosphere.
The latter leads to a decrease in the local PI. Figure 7
shows the correlations of anomalous PI and 300 hPa
Fig. 3 June–November (JJASON) PI (m/s) over the North Atlantic for the common period 1989–2001 for the a ensemble mean GOGA, b NCEP
reanalysis, c ERA-40 reanalysis, d Interim ECMWF reanalysis
1520 S. J. Camargo et al.
123

temperature over the tropical Atlantic region with the
relative SST index (green line in Fig. 6b) using IOP-
OGA. Note that in the IOPOGA ensemble, the anomaly
in relative SST is simply the negative of anomalous SST
averaged in the IOPOGA prescribed region. Over most of
the tropical Atlantic, the 300 hPa temperature (Fig. 7b)
is largely negatively correlated with the relative SST,
consistent with the observed, gradual rise of SST in the
IOPOGA region warming the upper tropospheric tem-
perature in the tropical Atlantic. Consistently, the tropi-
cal Atlantic PI exhibits the opposite phase correlation
(Fig. 7a) indicative of a PI decrease over most of the
tropical Atlantic. The only exception is the Gulf of
Mexico and the Caribbean region, where remote SST
warming induced a cooling of the upper tropospheric
temperatures and enhancement of PI. The calculation in
Fig. 7 explains the difference between TAGA and IOPOGA
PI shown in Fig. 5f.
In addition to the upward trend seen in both GOGA and
TAGA Tropical North Atlantic PIs, the time series (Fig. 6)
also exhibit a multi-decadal oscillation. This is particularly
clear in the early part of the record, where higher PI values
are seen between 1870 and 1895 compared to lower values
in between 1990 and 1920. The same behavior is obtained
if the averaging is conducted over the MDR region only
(not shown). In the next subsection, we separate between
the century-long upward PI trends and the multidecadal
variability in the model simulation, relating the latter to the
AMV, and examine the influence of local versus remote
SST in both cases.
3.3 AMV and Climate Change Influences
on Atlantic PI
In order to distinguish between the pattern of PI change
that is arguably attributable to the monotonous increase of
1860 1880 1900 1920 1940 1960 1980 2000
-6
-4
-2
0
2
4
6
Year
Ano
m. P
I (m
/s)
(a)
GOGAERA-40NCEPERA-Int
1950 1955 1960 1965 1970 1975 1980 1985 1990 1995 2000 2005
-6
-4
-2
0
2
4
6
Year
Ano
m. P
I (m
/s)
(b)
GOGAERA-40NCEPERA-Int
Fig. 4 Mean anomalous PI
(m/s) in the North Atlantic
MDR per JJASON season in the
GOGA ensemble mean and
reanalysis: 1856–2006 (toppanel), zooming on the period
1950–2006 (bottom panel)
Table 1 Correlations of
ensemble PI in the North
Atlantic MDR in GOGA and the
3 reanalysis for ASO and
JJASON in different time-
periods
Years NCEP ERA40 ERA-Interim
ASO JJASON ASO JJASON ASO JJASON
1950–2006 0.65 0.71
1958–2001 0.57 0.68 0.48 0.61
1989–2001 0.70 0.79 0.80 0.92 0.83 0.91
1989–2006 0.70 0.78 0.86 0.92
Influence of local and remote SST 1521
123

external radiative forcing (hereafter CC for ‘‘climate
change’’) and the pattern that is due to the internal climate
variability associated with AMV, we first derived Atlantic
SST CC and AMV indices as in Ting et al. (2009) for the
years 1900–2006 and for the JJASON seasonal mean
(Fig. 8a). The CC index displays a monotonic although not
linear increase in time, whereas the AMV displays visible
multi-decadal fluctuations. The linear regressions of global
SST at each grid point with the AMV and CC indices are
shown in Fig. 8b, c, respectively. The global patterns are
similar to those shown in Ting et al. (2009), the warming
signals associated with climate change present in most of
the global oceans (Fig. 8b), while the AMV influence is
concentrated in the North Atlantic, with weak warming in
NH and cooling in SH of the other ocean basins associated
with the warm AMV phase (Fig. 8b).
We now regress the seasonal PI anomalies at each
spatial grid point onto the CC and AMV indices to obtain
the PI associated with these variations. Note that the
regression is performed on seasonal PI values and that we
do not show the regression of individual environmental
variables that are part of the PI calculation. The spatial
pattern of the regression coefficients (in m/s per �C) for
GOGA, TAGA and IOPOGA are shown in Fig. 9.
In both GOGA and TAGA (Fig. 9a, c), the variation in
tropical Atlantic PI associated with the positive phase of
AMV, displays a consistent relationship to the corre-
sponding SST anomaly pattern (Fig. 8b) with maximum PI
Fig. 5 Ensemble mean climatological (1856–2006) PI (m/s) for the
peak hurricane season ASO in the tropical Atlantic for a GOGA, c TAGA,
and e IOPOGA simulations. Differences between climatological PI in
ASO for b GOGA and TAGA, d GOGA and IOPOGA, e TAGA and
IOPOGA
1522 S. J. Camargo et al.
123
1860 1880 1900 1920 1940 1960 1980 2000-6
-4
-2
0
2
4
6
Year
Ano
m. P
I (m
/s)
(a) Mean Anom. PI Tropical North Atlantic
GOGATAGAIOPOGA
1860 1880 1900 1920 1940 1960 1980 2000-0.8
-0.6
-0.4
-0.2
0
0.2
0.4
0.6
Year
Ano
m. R
el. S
ST
(C
)
(b) Mean Anom. Relative SST Tropical North Atlantic
GOGATAGAIOPOGA
Fig. 6 Mean anomalous
(1856–2006 climatology
subtracted) a PI (m/s), b relative
SST (difference of local SST
and mean tropical SST) in the
tropical North Atlantic in ASO.
GOGA is shown in blue, TAGA
in red, and IOPOGA in green,
with the thicker curves showing
the smoothed 5-year mean time
series
100W 80W 60W 40W 20W 0
5N
10N
15N
20N
25N
30N(a) Rel. SST & PI - IOPOGA
-1
-0.8
-0.6
-0.4
-0.2
0
0.2
0.4
0.6
0.8
1
100W 80W 60W 40W 20W 0
5N
10N
15N
20N
25N
30N(b) Rel. SST & Temp. 300hPa - IOPOGA
-1
-0.8
-0.6
-0.4
-0.2
0
0.2
0.4
0.6
0.8
1
Fig. 7 Correlations of
anomalous PI (a) and
anomalous 300 hPa temperature
(b) with anomalous relative SST
in the IOPOGA simulation
Influence of local and remote SST 1523
123

values located in the eastern tropical North Atlantic near
20�N and 20�W where the AMV-related SST values are
maximum.
The maximum change in the PI patterns of GOGA and
TAGA associated with the CC index (Fig. 9b, d) is
located in the eastern tropical South Atlantic, consistent
with the local SST anomaly maximum in the CC pattern
of Fig. 8c. Large positive PI values extend northward into
the Tropical North Atlantic (TNA). There is a notable
difference between the TAGA and GOGA regression
pattern on the CC index, with TAGA showing a much
stronger positive anomaly for the TNA region than that
for in GOGA. The difference between GOGA and TAGA,
as shown in Fig. 9h, is largely explained by the PI
regression to CC in IOPOGA (Fig. 9f). This implies that
the remote SST anomalies (tropical Indian and Pacific
Oceans) suppress tropical Atlantic PI anomalies associ-
ated with global warming, consistent with Vecchi et al.
(2008).
While the AMV-related PI differences between GOGA
and TAGA (Fig. 9g) are much smaller than the corre-
sponding one for CC-related PI differences (Fig. 9h), it
also shows a suppression of PI anomalies by remote SST.
This difference in Fig. 9g is largely, but not entirely,
consistent with the AMV-related PI in IOPOGA, possibly
due to the weak tropical Pacific SST in Fig. 8b. However,
the suppression of AMV-related, tropical Atlantic PI is
larger in (Fig. 9e) is larger than expected from IOPOGA
(Fig. 9g), particularly over the northeastern part of the
TNA. We will address this difference and its probable
cause later (see Sect. 3.4 below). The difference in PI
anomalies associated with AMV between GOGA (Fig. 9a)
and TAGA (Fig. 9c), however, is much smaller than the
corresponding PI anomalies associated with climate
change.
The regressed time-series of the TNA and MDR aver-
aged PI onto the North Atlantic SST indices (Fig. 10a),
which includes both the climate change and AMV
1900 1910 1920 1930 1940 1950 1960 1970 1980 1990 2000-0.5
0
0.5
Year(C
)
(a) CC and AMV indices
AMVCC
0E 50E 100E 150E 160W 110W 60W 10W50S
0
50N(b) Regression SST and AMV
-3
-2
-1
0
1
2
3
0E 50E 100E 150E 160W 110W 60W 10W50S
0
50N(c) Regression SST and CC
-3
-2
-1
0
1
2
3
Fig. 8 a Time-series of the
climate change (CC) and AMV
indices (in �C) calculated
following Ting et al. (2009) for
the period 1900–2006.
Regression of anomalous
JJASON SST (�C) with AMV
(b) and CC (c) indices per �C
1524 S. J. Camargo et al.
123

components, exhibit both an upward trend and multi-dec-
adal variations, with a larger amplitude in the case of
TAGA than in GOGA. In contrast, IOPOGA has a clear
downward trend in the same period. When we consider
separately the impact of AMV and climate change on MDR
PI (Fig. 10b, c), it is clear that both contributed to the lower
values of PI in the early twentieth century and the increase
in the late twentieth century and early twenty-first century
for GOGA and TAGA. As expected, the AMV caused
below normal PI values between 1970 and the early 1990s
(as argued also in Goldenberg et al. 2001). The sum of
TAGA and IOPOGA time-series (shown in black dashed
line) is very close to the time-series of GOGA in all 3
panels, which confirming that the influence of the remote
tropical SST in the North Atlantic PI. It is very clear in
these figures that the presence of the non-local SST in
GOGA (i.e. the forcing in IOPOGA) leads to weaker PI
anomalies in GOGA than in TAGA, in all cases, particu-
larly in the case of external, climate change forcing.
The results in Figs. 9 and 10 illustrate the relative
importance of internal variability versus externally forced
climate change in the PI of Atlantic hurricanes. Based on
the results of TAGA with only the tropical Atlantic SST
effects (Fig. 9c, d), and red lines in Fig. 10), the variation
due to externally forced and natural PI variability is com-
parable (ranging between *2 and 2.5 m/s). When the
remote SST effects are taken into consideration in the case
of GOGA (Fig. 9a, b, and blue lines in Fig. 10), the relative
Fig. 9 Regression of anomalous ASO PI (m/s) with AMV (leftpanels) and climate change (CC) indices (right panels). Regression
pattern of AMV and GOGA (a), TAGA (c), and IOPOGA (e).
Regression pattern of CC index and GOGA (b), TAGA (d), and
IOPOGA (f). The difference between the PI regression patterns in
GOGA and TAGA are shown in (g) and (h) for the AMV and CC
patterns, respectively. The region of the MDR is indicated by the
black box
Influence of local and remote SST 1525
123

amplitude of the forced change in PI (0.5 m/s) is much
smaller than that due to the AMV (*1.5 m/s). These dif-
ferences are very close to the values of the IOPOGA
changes, which have the opposite sign of TAGA. The
dramatic recent increases in PI (from 1990 to 2005, Fig. 1)
reflects a combination of a gradual increase in PI due to
forced tropical SST warming, as well as the more dramatic,
late twentieth century warming due to the AMV.
3.4 Effects of the extra-tropical North Atlantic
As indicated above, the difference between GOGA and
TAGA on the AMV response (Fig. 9e) indicates that
remote ocean influences mildly suppress the local SST
influence on PI even in the case of natural variability. Part
of this impact is due to the slight warming in SST associate
with AMV as this phenomenon is depicted in the
1900 1910 1920 1930 1940 1950 1960 1970 1980 1990 2000-2
-1
0
1
2
Year
Ano
m. P
I (m
/s)
(a) Anom. PI Reg. AMV & CC
GOGA
TAGA
IOPOGA
1900 1910 1920 1930 1940 1950 1960 1970 1980 1990 2000-2
-1
0
1
2
Year
Ano
m. P
I (m
/s)
(b) Anom. PI Reg. AMV
GOGA
TAGA
IOPOGA
1900 1910 1920 1930 1940 1950 1960 1970 1980 1990 2000-2
-1
0
1
2
Year
Ano
m. P
I (m
/s)
(c) Anom. PI Reg. CC
GOGA
TAGA
IOPOGA
Fig. 10 Regression time-series
of anomalous ASO PI (m/s) in
the MDR with a AMV and CC
indices, b AMV index
component only, c CC index
component only, for GOGA
(blue), TAGA (red) and
IOPOGA (green). Also shown
in a thin dashed line is the sum
of TAGA and IOPOGA
1526 S. J. Camargo et al.
123

observations as indicated by the difference IOPOGA and
TAGA (Fig. 9g) but note that this remote association,
while apparently statistically significant should be treated
with some caution but that is nonetheless present in the
prescribed SST fields used in this study). However, the
difference GOGA-TAGA displays a large suppression of
PI than the difference IOPOGA-TAGA. We suspect that
this difference is due to the concomitant AMV SST change
in the extratropical North Atlantic. To test this assertion,
we examine a set of ‘‘idealized’’ simulations in which fixed
Atlantic SST anomalies patterns were added to the clima-
tological state in the Atlantic basin only. As described in
Sect. 2, the anomalous SST patterns are derived from a
rotated EOF analysis of the global SST in the twentieth
century (as described in Schubert et al. 2009). One of the
leading EOFs has pattern similar to the SST anomaly
associated with AMV, and is the one considered here. The
model was forced with this AMV pattern added to and
subtracted from the monthly varying global SST clima-
tology, hereafter referred to as warm AMV and cold AMV,
respectively. We performed two sets of these experiments,
one where the pattern was prescribed in its entirety, that is
over the entire North Atlantic and the other with only the
tropical portion of the pattern (between the equator and
30�N) prescribed while the extratropical part is set to zero.
Figure 11 shows the difference in PI between the warm
and cold AMV simulations with SST anomalies prescribed
in the entire North Atlantic (a) and in the tropical Atlantic
only (b). The difference between the two fields is shown in
Fig. 11c. These results show that the extra-tropical North
Atlantic portion of the AMV introduces a mild negative
influence on the tropical Atlantic PI field. This is consistent
with the stronger PI suppression GOGA-TAGA (Fig. 9g)
than in IOPOGA-TAGA (Fig. 9e) discussed earlier.
Assuming then that the influences are of different ocean
basins are close to linear, we conclude on the basis of these
fixed SST anomaly experiments that the extratropical
warming (or cooling) associated with the AMV mildly
counteracts the response of tropical Atlantic PI to local
SST anomalies. Similar to the changes in remote tropical
SSTs, the warming in the North Atlantic, which is part of
the AMV SST footprint, slightly warms the tropical
Atlantic upper troposphere (not shown) and thus increases
the atmospheric stability of the tropics, reducing the PI in
the warm AMV phase (and increases in the cold phase)
relative to the impact of tropical SSTs alone.
4 Summary
In this paper we explore the relative importance of exter-
nally forced (mainly anthropogenic) and internal (AMV)
SST variability on the tropical Atlantic tropical cyclone
potential intensity, with a focus on the relative contribu-
tions of local and remote SSTs. This is achieved by using
NCAR CCM3 model simulations with prescribed historical
SST in the entire global ocean (GOGA), in the tropical
Atlantic only (TAGA) and in the tropical Indian and Pacific
Oceans only (IOPOGA). We find that the relative contri-
bution of the forced and internal SST variability on tropical
Atlantic PI depends on whether local or global SST
anomalies are considered. When non-local SST effects are
taken into account, the relative role of global climate
change in tropical Atlantic PI, during the twentieth Cen-
tury, is lower compared to that induced by the warming of
100W 80W 60W 40W 20W10S
5S
0
5N
10N
15N
20N
25N
30N(a) Diff. PI Warm & Cold Atlantic
-10
-8
-6
-4
-2
0
2
4
6
8
10
100W 80W 60W 40W 20W10S
5S
0
5N
10N
15N
20N
25N
30N(b) Diff. PI Warm & Cold tropical Atlantic
-10
-8
-6
-4
-2
0
2
4
6
8
10
100W 80W 60W 40W 20W10S
5S
0
5N
10N
15N
20N
25N
30N(c) Diff. PI Atlantic and Tropical Atlantic
-1.5
-1
-0.5
0
0.5
1
1.5
Fig. 11 Difference of PI for JJASON between: a warm and cold
Atlantic, b warm and cold tropical Atlantic, c panels (a) and (b); i.e.
the difference of warm and cold Atlantic minus the difference of
warm and cold tropical Atlantic
Influence of local and remote SST 1527
123

tropical Atlantic SST alone, because of the damping of the
PI, resulting from the warming in the other (tropical) ocean
basins. This is consistent with the idea of relative SST
(local minus tropical mean) contribution to PI as discussed
in Vecchi and Soden (2007) in reference to the change in
hurricane potential intensity for the twenty-first century.
We show here that when only the SST in the Indian and
tropical Pacific Oceans is varying, with the Atlantic SSTs
fixed at climatological values, the PI in the tropical Atlantic
has a downward trend. The sum of the PI anomalies in the
other tropical Oceans and in the Atlantic oceans is very
close to the values obtained when the model is forced with
global SST, pointing towards an almost linear additive
behavior.
In the case of AMV, the dominant SST anomalies are
located in the tropical and extra-tropical North Atlantic
with a minor contribution from other ocean basins. The PI
variations associated with the AMV are thus largely
determined by the local SST change. The dominance of
local SST in the AMV case leads us to conclude that the
late twentieth Century increase in North Atlantic PI (e.g.
Kossin and Camargo 2009), while closely related to the
tropical Atlantic SST increase (Fig. 1), includes a con-
siderable impact of internal variability and cannot be
attributed purely to anthropogenic warming. The up swing
of the multi-decadal internal SST variability associated
with AMV is the most important cause (as hinted also by
results of DelSole et al. 2011). Whether and how PI may
change in the late 21st century, when anthropogenic
influence increases in amplitude while the AMV can
presumably continue to slowly swing between negative
and positive phases with the same amplitude as during the
twentieth Century (see Ting et al. 2011) will be examined
in a subsequent study using the CMIP3 and CMIP5
simulations.
Recent papers by Emanuel (2010, 2012) analyzed the
relative influence of tropical tropopause layer cooling in
the Atlantic on potential intensity trends in models and
observations and emphasized that the climate models
shortcomings in simulating this cooling could be signifi-
cant. However, Vecchi (2012) did not show the same level
of sensitivity to this cooling in the high-resolution climate
model analyzed. Regardless, we should note that the rela-
tive importance of the tropopause cooling over the Atlantic
was not considered explicitly in our analysis.
Acknowledgments The authors acknowledge support of the
National Oceanic and Atmospheric Administration (NOAA) Grants
NA08OAR4320912, NA10OAR4310124 and NA10OAR4320137.
We would like to thank Donna Lee and Naomi Naik (LDEO) for
performing the CCM3 simulations used in this study. The authors
would like to thank the Global Decadal Hydroclimate group at
Lamont and Columbia for helpful discussion and input and two
anonymous reviewers for their useful suggestions and comments.
References
Bister M, Emanuel KA (1998) Dissipative heating and hurricane
intensity. Meteor Atmos Phys 65:223–240
Bister M, Emanuel KA (2002a) Low frequency variability of tropical
cyclone potential intensity: 1. Interannual to interdecadal variabil-
ity. J Geophys Res 107:4801. doi:10.1029/2001JD000776
Bister M, Emanuel KA (2002b) Low frequency variability of tropical
cyclone potential intensity: 2. Climatology for 1982–1995.
J Geophys Res 107:4621. doi:10.1029/2001JD000780
Bryan GH, Rotunno R (2009) The maximum intensity of tropical
cyclones in axisymmetric numerical model simulations. Mon
Weather Rev 137:1770–1789
DelSole T, Tippett MK, Shukla J (2011) A significant component of
unforced multidecadal variability in the recent acceleration of
global warming. J Clim 24:909–926
Emanuel KA (1986) An air-sea interaction theory for tropical cyclones.
Part I: steady-state maintenance. J Atmos Sci 43:585–604
Emanuel KA (1987) The dependence of hurricane intensity on
climate. Nature 326:483–485
Emanuel KA (1988) The maximum intensity of hurricanes. J Atmos
Sci 45:1143–1155
Emanuel KA (1995) Sensitivity of tropical cyclones to surface
exchange coefficients and a revised steady-state model incorpo-
rating eye dynamics. J Atmos Sci 52:3969–3976
Emanuel K (2005) Increasing destructiveness of tropical cyclones
over the past 30 years. Nature 436:686–688
Emanuel K (2010) Tropical cyclone activity downscaled from
NOAA-CIRES Reanalysis, 1908–1958. J Adv Model Earth Syst
2. doi:10.3894/JAMES.2010.2.1
Emanuel K, Solomon S, Folini D, Davis S, Cagnazzo C (2012)
Influenced of tropical tropopause layer cooling on Atlantic
hurricane activity. J Clim (submitted)
Enfield DB, Mestas-Nunez AM, Trimble PJ (2001) The Atlantic
multidecadal oscillation and it’s relation to rainfall and river
flows in the continental U.S. Geophys Res Lett 28:2077–2080
ERA-Interim (2011) ERA-Interim re-analysis brief description,
http://www.ecmwf.int/research/era/do/get/ERA-Interim_brief
Goldenberg SB, Landsea CW, Mestas-Nunez AM, Gray WM (2001)
The recent increase in Atlantic hurricane activity: causes and
implications. Science 293:474–479
Graumann A, Houston T, Lawrimore J, Levinson D, Lott N, McCown
S, Stephens S, Wuertz D (2005) Hurricane Katrina—a climato-
logical perspective. NOAA’s National Climatic Data Center,
Technical Report 2005-01
Gray WM (1968) Global view of the origin of tropical disturbances
and storms. Mon Weather Rev 96:669–700
Gray WM (1979) Hurricanes: their formation, structure and likely
role in the tropical circulation. Meteorology over the tropical
oceans. Royal Meteorological Society, Bracknall
Holland GJ (1997) The maximum potential intensity of tropical
cyclones. J Atmos Sci 54:2519–2541
Kalnay E et al (1996) The NCEP/NCAR 40-year reanalysis project.
Bull Am Meteorol Soc 77:437–471
Kaplan A, Cane MA, Kushnir Y, Clement AC, Blumenthal MB,
Rajagopalan B (1998) Analyses of global sea surface temper-
ature: 1856–1991. J Geophys Res 103:18567–18589
Kiehl JT, Hack JJ, Bonan GB, Bovile BA, Williamson DL, Rasch PJ
(1998) The national center for atmospheric research community
climate model: CCM3. J Clim 11:1131–1149
Kistler R et al (2001) The NCEP-NCAR 50-year reanalysis: monthly
means CD-ROM and documentation. Bull Am Meteorol Soc
82:247–267
Kossin JP, Camargo SJ (2009) Hurricane track variability and secular
potential intensity trends. Clim Chang 9:329–337
1528 S. J. Camargo et al.
123

Kossin JP, Vimont DJ (2007) A more general framework for
understanding Atlantic hurricane variability and trends. Bull
Am Meteorol Soc 88:1767–1781
Kossin JP, Camargo SJ, Sitkowski M (2010) Climate modulation of
North Atlantic hurricane tracks. J Clim 23:3057–3076
Kushnir Y (1994) Interdecadal variations in North Atlantic Sea
surface temperature and associated atmospheric conditions.
J Clim 7:141–157
Kushnir Y, Seager R, Ting M, Naik N, Nakamura J (2010)
Mechanisms of tropical Atlantic SST influence on North
American precipitation variability. J Clim 23:5610–5628
Lau N-G, Nath MJ (1994) A modeling study of the relative roles of
tropical and extratropical SST anomalies in the variability of the
global atmosphere-ocean system. J Clim 7:1184–1207
Mann ME, Emanuel KA (2006) Atlantic hurricane trends linked to
climate change. EOS. Trans Am Geophys Union 87:233–241
Montgomery MT, Van Sang N, Smith RK, Persing J (2009) Do
tropical cyclones intensify by WISHE? Q J R Meteorol Soc
135:1697–1714
Palmen EH (1948) On the formation and structure of tropical
cyclones. Geophysica 3:26–38
Ramsay HA, Sobel AH (2011) Effects of relative and absolute sea
surface temperature on tropical cyclone potential intensity using
a single-column model. J Clim 24:183–193
Rayner N, Parker D, Horton E, Folland C, Alexander L, Rowell D,
Kent E, Kaplan A (2003) Global analyses of sea surface
temperature, sea ice, and night marine air temperature since the
late nineteenth century. J Geophys Res 108:4407. doi:
10.1029/2002JD002670
Schubert S et al (2009) A US CLIVAR project to assess and compare
the responses of global climate models to drought-related SST
forcing patterns: overview and results. J Clim 22:5251–5272
Seager R (2007) The turn of the century North American drought: global
context, dynamics, and past analogs. J Clim 20:5527–5552
Seager R, Kushnir Y, Herweijer C, Naik N, Velez J (2005) Modeling
of tropical forcing of persistent droughts and pluvials over
western North America: 1856–2000. J Clim 18:4065–4088
Seager R, Kushnir Y, Ting M, Cane M, Naik N, Miller J (2008)
Would advance knowledge of 1930s SSTs have allowed
prediction of the dust bowl drought? J Clim 21:3261–3281
Servain J (1991) Simple climatic indexes for the tropical Atlantic-
Ocean and some applications. J Geophys Res C 96:15137–15146
Smith RK, Montgomery MT, Vogl S (2008) A critique of Emanuel’s
hurricane model and potential intensity theory. Quart J R
Meteorol Soc 134:551–561
Sobel AH, Camargo SJ (2012) Projected future seasonal changes in
tropical summer climate. J Clim 24:473–487
Sobel AH, Held IM, Bretherton CS (2002) The ENSO signal in
tropical tropospheric temperature. J Clim 12:2702–2706
Solomon A, Goddard L, Kumar A, Carton J, Deser C, Fukumori I,
Greene AM, Hegerl G, Kirtman B, Kushnir Y, Newman M,
Smith D, Vimont D, Delworth T, Meehl GA, Stockdale T (2011)
Distinguishing the roles of natural and anthropogenically forced
decadal climate variability. Bull Am Meteorol Soc 92:141–156
Swanson KL (2008) Nonlocality of tropical cyclone intensities.
Geochem Geophys Geosyst 9:Q04V01
Tang BH, Neelin JD (1994) ENSO influence on Atlantic hurricanes
via tropospheric warming. Geophys Res Lett 31:L24204
Ting M, Kushnir Y, Seager R, Li C (2009) Forced and natural 20th
Century SST trends in the North Atlantic. J Clim 22:1469–1481
Ting M, Kushnir Y, Seager R, Li C (2011) Robust features of Atlantic
multidecadal variability and its climate impacts. Geophys Res
Lett 38:L17705. doi:10.1029/2011GL048712
Uppala SM et al (2005) The ERA-40 re-analysis. Quart JR Meteorol
Soc 131:2961–3012
Vecchi GA, Soden BJ (2007) Effect of remote sea surface temper-
ature change on tropical cyclone potential intensity. Nature
450:1066–1070
Vecchi GA, Swanson KL, Soden BJ (2008) Whither hurricane
activity? Science 322:687–689
Vecchi GA, Fueglistaler S, Held IM, Knutson TR, Zhao M (2012)
Influence of tropical tropopause layer cooling on Atlantic
hurricane activity. J Clim (submitted)
Villarini G, Vecchi GA (2012) Twenty-first-century projections of
North Atlantic tropical storms from CMIP5 models. Nat Clim
Chang Early online. doi:10.1938/nclimate1530
Vimont DJ, Kossin JP (2007) The Atlantic meridional mode and
hurricane activity. Geophys Res Lett 34:L07709
Wing AA, Sobel AH, Camargo SJ (2007) The relationship between
the potential and actual intensities of tropical cyclones on
interannual time scales. Geophys Res Lett 34:L08810
Zhang R, Delworth TL (2006) Impact of Atlantic multidecadal
oscillation on India/Sahel rainfall and Atlantic hurricanes.
Geophys Res Lett 33:L17712
Influence of local and remote SST 1529
123