global sea level change: what drives the decadal variability? analysis of near global altimetry data...
TRANSCRIPT

Global sea level change: What drives the decadal variability?
• Analysis of near global altimetry data suggests a rise of 2.9 mm/yr (3.3 mm/yr after GIA correction) over the past decade
• On the face of it, this is a large, recent acceleration
• Global sea level is believed to have risen 1-2 mm/yr over the past 100 years
Sparse dataset from tide gauges
Simon Holgate, Permanent Service for Mean Sea Level ([email protected])

Questions to be answered....
• Has there been an acceleration in sea level rise over the past century?
• How great is the variability in rates of sea level rise?
Is a decadal rate of 3 mm/yr that unusual?
• How do Spanish tide gauges fit this picture?

Spatial variability in altimetry trends 1993-2003
(From Cazenave and Nerem, 2004)

Intergovernmental Panel on Climate Change
• The IPCC AR4 gives 1.8±0.5 mm/yr for global mean 20th century sea level rise
• Largest component of sea level rise is thought to be thermal expansion (thermosteric rise)
- Huge uncertainties in thermal expansion, melting rates, groundwater run-off and impoundment
- Large gaps in datasets

IPCC AR4 rates of sea level rise components
1961-2003 (mm/yr) Observed Modelled
Thermal expansion 0.42±0.12 0.5±0.2
Glaciers and ice caps 0.50±0.18 0.5±0.2
Greenland – 20th century effects 0.05±0.12*
0.14±0.41*Antarctica – 20th century effects
Estimated from tide gauges 1.8±0.5
Total 1.1±0.5 1.2±0.5
Difference (TG - contributions)
0.7±0.7

IPCC TAR estimated rates of SLR components(mm/yr) Minimum Central value Maximum
Thermal expansion 0.3 0.5 0.7
Glaciers and ice caps 0.2 0.3 0.4
Greenland – 20th century effects
0.0 0.05 0.1
Antarctica – 20th century effects
– 0.2 – 0.1 0.0
Ice sheets – adjustment since LGM
0.0 0.25 0.5
Permafrost 0.00 0.025 0.05
Sediment deposition 0.00 0.025 0.05
Terrestrial storage – 1.1 – 0.35 0.4
Total – 0.8 0.7 2.2
Estimated from observations 1.0 1.5 2.0

Datasets
• Tide gauge records selected from the Revised Local Reference dataset of the Permanent Service for Mean Sea Level (PSMSL)
- Records have been corrected for local datum changes and checked for obvious problems such as abrupt changes due to earthquakes or trends due to local factors (e.g. Subsidence due to water extraction)

The PSMSL Dataset
• The PSMSL dataset is global but has many gaps in time and space
− Contains over 53 000 station years of data from about 1800 stations
− Only ~180 stations are of sufficient quality at 50 years

Methods
• Not possible to link RLR records together
− No accurate geodetic surface available
• 20th century acceleration investigated using Peltier's ICE-4G model of Glacial Isostatic Adjustment
− Assumes GIA is only geological process leading to vertical land movement
• Sea level data corrected for inverse barometer effects using HadSLP2 reanalysis

Regional distribution of tide gauge records for 20th C study
• Nine long station records selected• Successive, over-lapping 10 years means
calculated

Variability in decadal rates over the 20th century
• Highest rate in the past 100 years is for the decade centred on 1979, second highest rate is 1938
• Lowest rate is 1963

• Total sea level rise has been ~170 mm over the past 100 years Mean rate is 1.740.16 mm/yr
• Sea level rise has decelerated 1904-1953: 2.030.35 mm/yr, 1954-2003: 1.450.34 mm/yr
Integrated sea level rise 1904-2003

Spanish tide gauge records
• There are 27 time series in the PSMSL from Spain
• 12 time series are on the Atlantic coast• Only 4 Atlantic series are longer than 20 years

Long Atlantic tide gauge records
• The 4 longest records have similarities but also major differences
• ‘Coruña I’ has some problems in the early record

Decadal Rates of Change
• Decadal variability is quite large• Similarities between stations are weak• The relationship with the global mean is also
poor

Wind and Pressure Monthly Contributions
• Multivariate regression using static pressures and wind fields greatly reduces monthly variability
• >50% reduction in SD
La Coruña
Santander

Wind and Pressure Decadal Contributions
• On decadal timescales, variance reduction is small
• Implication that variability derives from open ocean
La Coruña
Santander

Model Variability
• POLCOMS model• 12km resolution• Domain: 40oN-65oN,
19oW-13oE• 40 year run: 1960-2000• Danish Met reanalysis
wind forcing• Single year deep ocean
boundary condition• No decadal variability!• “Stations” much more
coherent than real data

Summary• Has sea level rise accelerated over the past century?
Not significantly, but possibly over the past 130 yrs.
• Has there been a recent acceleration in the rate of sea level rise? The 1990s rate is high but not significantly different from other 20th C decadal rates
• Decadal variability in Atlantic sea level records is much larger than the global mean
• Variance reduction using static pressures and winds is very effective at monthly time-scales
• Atmospheric forcing appears to have little influence at decadal time-scales. Variability probably comes from the deep ocean
• Coastal sea level and extremes are what count for humans


Global sea level curve based on EOF reconstruction
• EOF based reconstruction of sea level by Church and White (2006)
• 20th century sea level rise is 1.7 mm/yr
• Significant acceleration of 0.013 mm/yr2 over the last 130 years

Comparison of 20th century rates from EOF and tide gauges
• Comparison of Church and White’s EOF reconstruction of rates of sea level rise with those directly obtained from tide gauge records

• Church and White shows slight acceleration in second half of 20th century while others decelerate– acceleration/deceleration highly dependent on period chosen
Comparison of reconstructions of 20th Century sea level change

• The longest sea level records (all European) show an apparent acceleration over the longer term recovery from the Little Ice Age?
(From Woodworth, 1999)
Comparison with other long sea level records

Relationship of sea level to SST and heat content
Relationship of sea level to atmospheric forcing through heat content?

Relationship of rate of sea level change to global temperatures
• Rahmstorf has found a statistical relationship between global temperatures and the rate of sea level change (Science Express, 2006)
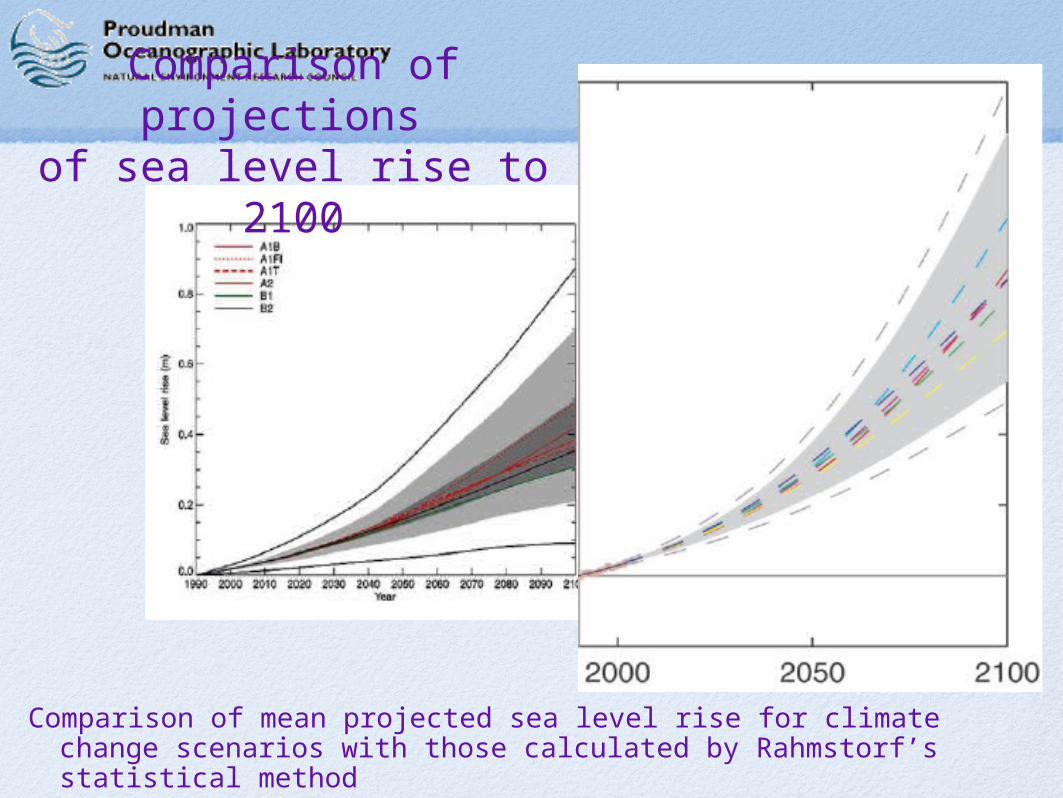
Comparison of projections
of sea level rise to 2100
Comparison of mean projected sea level rise for climate change scenarios with those calculated by Rahmstorf’s statistical method

Sea level variability and volcanism
• Church et al (2005) found a significant link between global ocean heat content and volcanism
• They argue that volcanism has slowed global sea level rise since 1960

Regional variation in sea level rise over past 55 years
Neighbouring regions tend to be the most coherent
Shows the large scale of sea level variability
Some regions are anti-correlated e.g. E and W Atlantic
Sea level rise in the 1990s was most marked in Australasia, Scandinavia and N.
Europe

Variability in rates of sea level rise over the past 55 years
Highest rate in the past 55 years is for the decade centred on 1995, followed by
1979. Lowest rate is centred on 1987
High rates of SLR are not significantly correlated with ENSO