global natural gas insights • 2019 edition sustainable
TRANSCRIPT
Sustainable FuturePowered by Gas
G L O B A L N A T U R A L G A S I N S I G H T S • 2 0 1 9 E D I T I O N
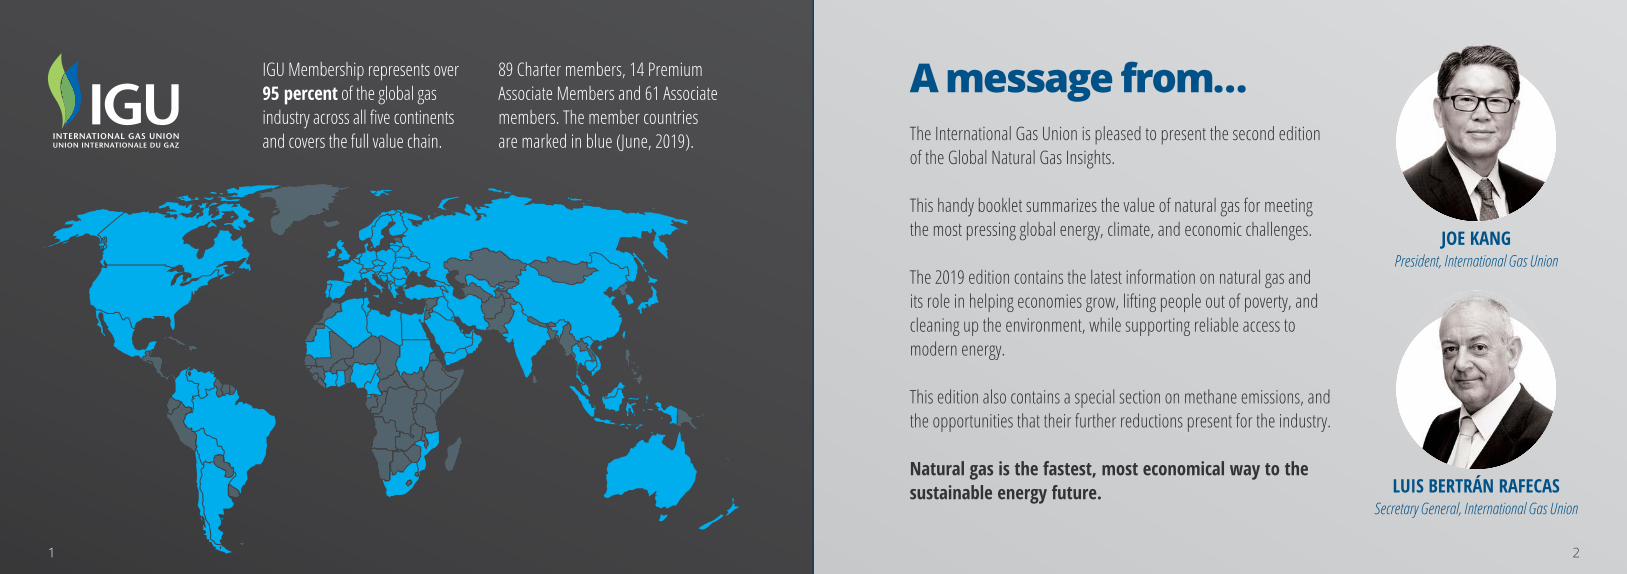
IGU Membership represents over95 percent of the global gas industry across all five continents and covers the full value chain.
89 Charter members, 14 Premium Associate Members and 61 Associate members. The member countries are marked in blue (June, 2019).
A message from… The International Gas Union is pleased to present the second edition of the Global Natural Gas Insights.
This handy booklet summarizes the value of natural gas for meeting the most pressing global energy, climate, and economic challenges.
The 2019 edition contains the latest information on natural gas and its role in helping economies grow, lifting people out of poverty, and cleaning up the environment, while supporting reliable access to modern energy.
This edition also contains a special section on methane emissions, and the opportunities that their further reductions present for the industry.
Natural gas is the fastest, most economical way to the sustainable energy future.
JOE KANGPresident, International Gas Union
LUIS BERTRÁN RAFECASSecretary General, International Gas Union
21
Sustainable Future Powered by Gas
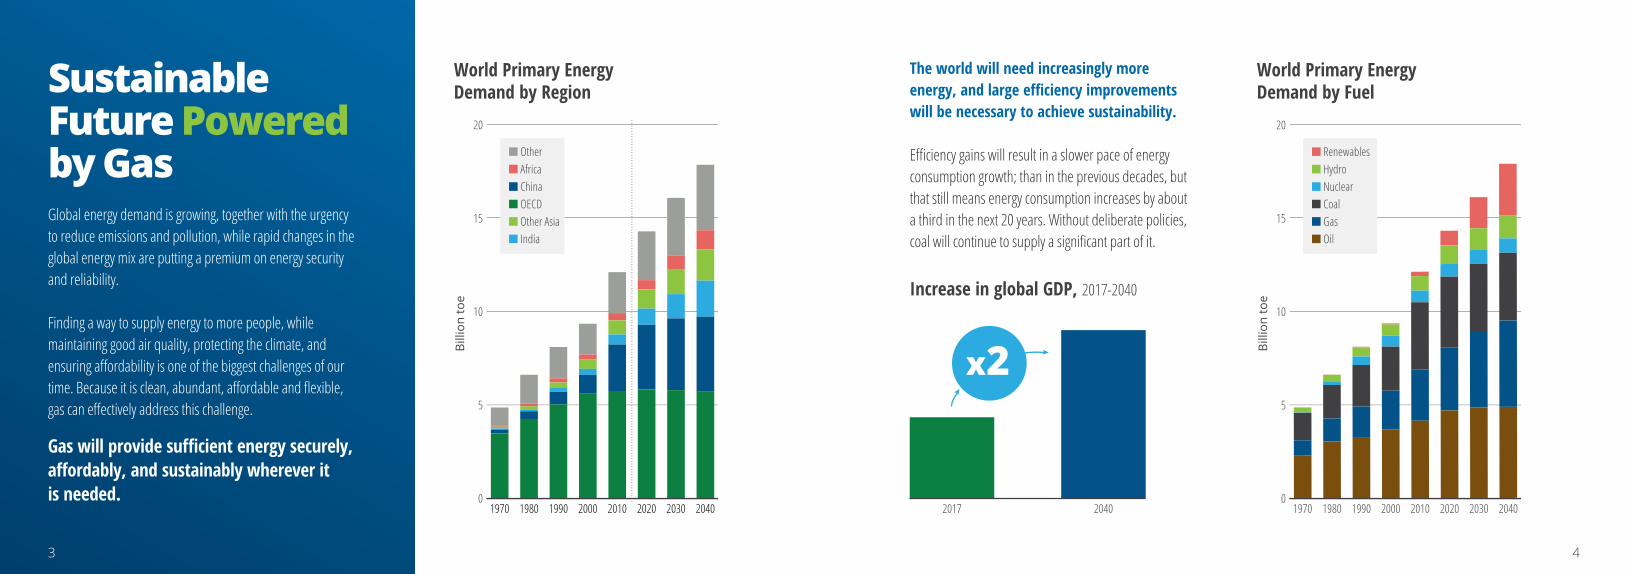
The world will need increasingly more energy, and large efficiency improvements will be necessary to achieve sustainability.
Efficiency gains will result in a slower pace of energy consumption growth; than in the previous decades, but that still means energy consumption increases by about a third in the next 20 years. Without deliberate policies, coal will continue to supply a significant part of it.
Global energy demand is growing, together with the urgency to reduce emissions and pollution, while rapid changes in the global energy mix are putting a premium on energy security and reliability.
Finding a way to supply energy to more people, while maintaining good air quality, protecting the climate, and ensuring affordability is one of the biggest challenges of our time. Because it is clean, abundant, affordable and flexible, gas can effectively address this challenge. Gas will provide sufficient energy securely, affordably, and sustainably wherever it is needed.
World Primary EnergyDemand by Fuel
20
15
10
5
01970 1980 1990 2000 2010 2020 2030 2040
Billi
on to
e
RenewablesHydro
GasOil
NuclearCoal
2017 2040
Increase in global GDP, 2017-2040
x2
World Primary EnergyDemand by Region
20
15
10
5
01970 1980 1990 2000 2010 2020 2030 2040
Billi
on to
e
OtherAfrica
Other AsiaIndia
ChinaOECD
43
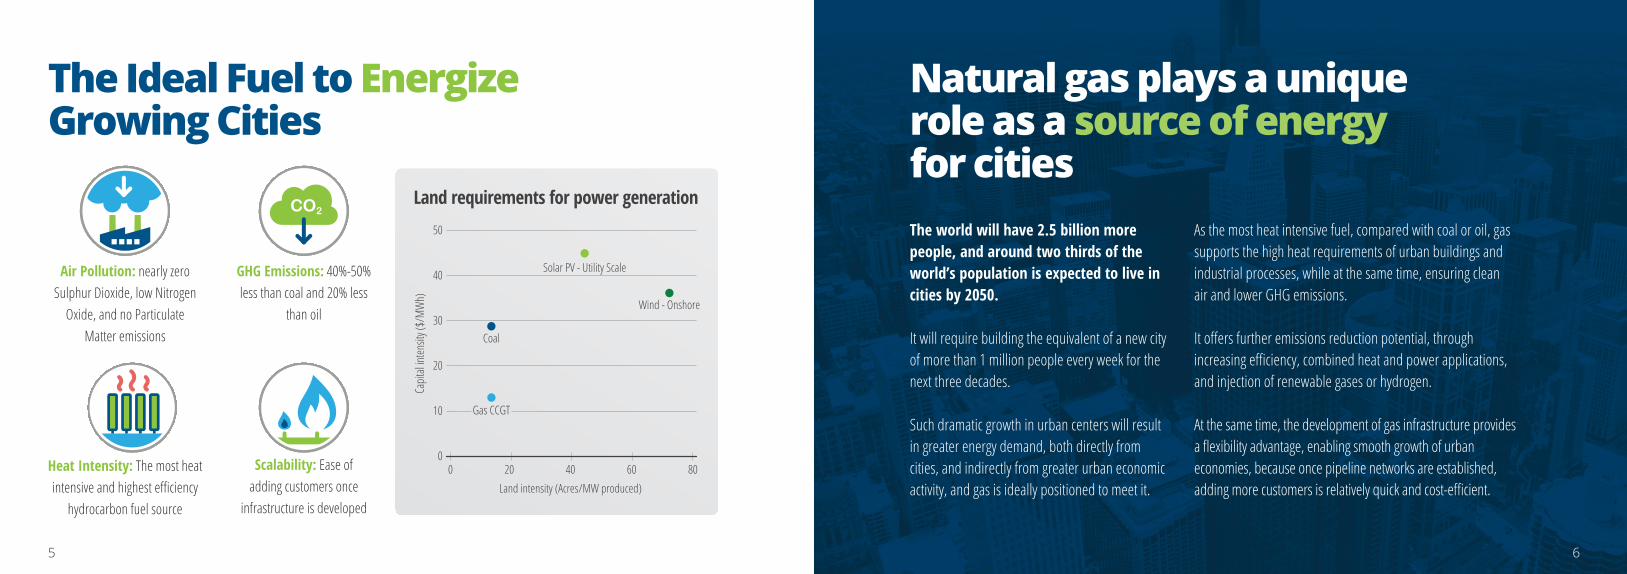
The Ideal Fuel to EnergizeGrowing Cities
The world will have 2.5 billion more people, and around two thirds of the world’s population is expected to live in cities by 2050.
It will require building the equivalent of a new city of more than 1 million people every week for the next three decades.
Such dramatic growth in urban centers will result in greater energy demand, both directly from cities, and indirectly from greater urban economic activity, and gas is ideally positioned to meet it.
As the most heat intensive fuel, compared with coal or oil, gas supports the high heat requirements of urban buildings and industrial processes, while at the same time, ensuring clean air and lower GHG emissions.
It offers further emissions reduction potential, through increasing efficiency, combined heat and power applications, and injection of renewable gases or hydrogen.
At the same time, the development of gas infrastructure provides a flexibility advantage, enabling smooth growth of urban economies, because once pipeline networks are established, adding more customers is relatively quick and cost-efficient.
Natural gas plays a unique role as a source of energyfor cities
Air Pollution: nearly zero Sulphur Dioxide, low Nitrogen
Oxide, and no Particulate Matter emissions
Heat Intensity: The most heat intensive and highest efficiency
hydrocarbon fuel source
GHG Emissions: 40%-50% less than coal and 20% less
than oil
Scalability: Ease of adding customers once
infrastructure is developed
Land requirements for power generation
Capit
al int
ensit
y ($/
MW
h)
Land intensity (Acres/MW produced)
0
50
806040200
40
30
20
10 Gas CCGT
Coal
Solar PV - Utility Scale
Wind - Onshore
5 6
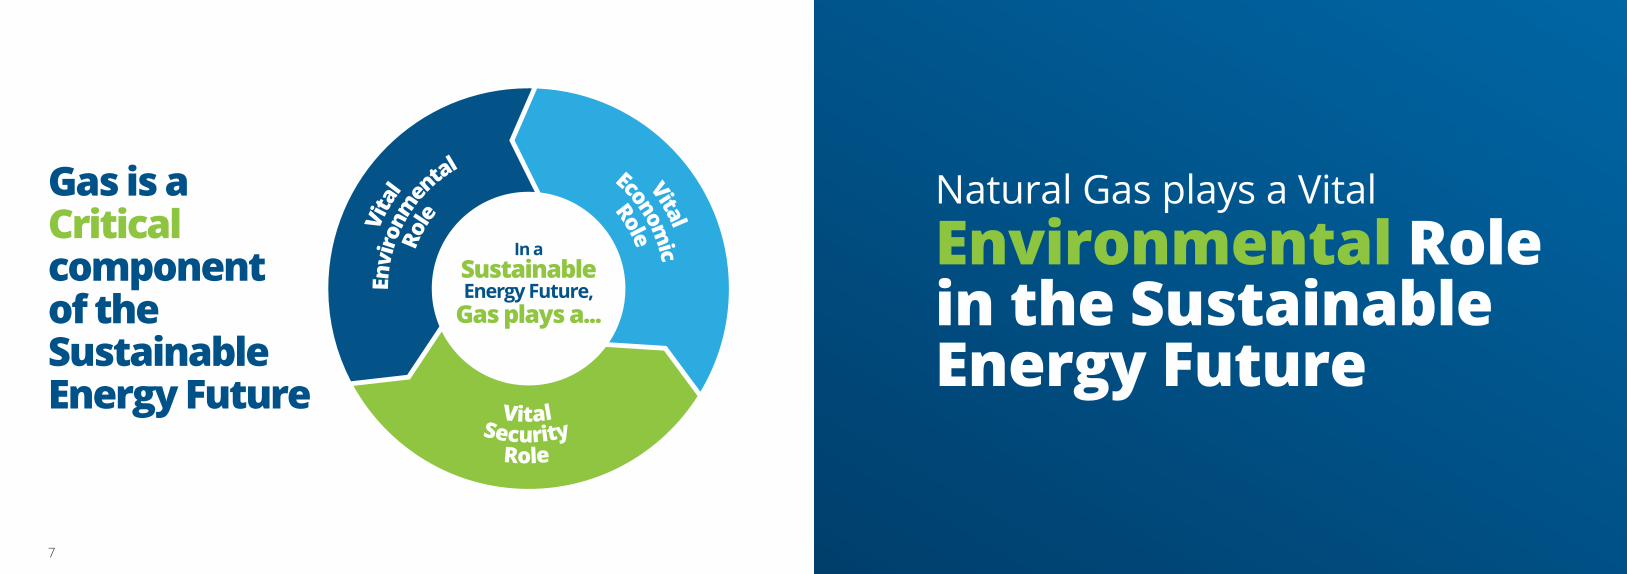
Gas is a Critical component of the Sustainable Energy Future
EN
VIR
ON
ME
NT
AL
Natural Gas plays a VitalEnvironmental Rolein the SustainableEnergy Future
In aSustainableEnergy Future,
Gas plays a...
Vita
lEn
viro
nmen
tal
Role
Vital
Economic
Role
RoleSecurity
Vital
7
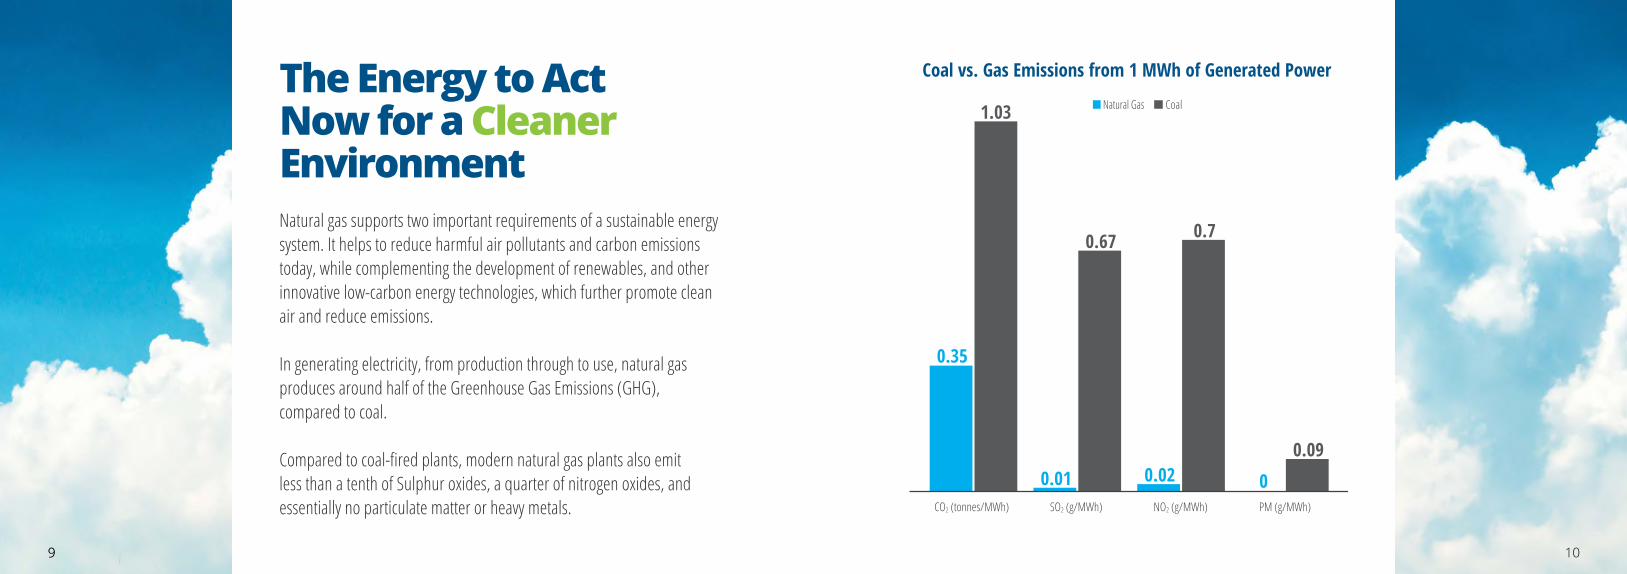
Natural gas supports two important requirements of a sustainable energy system. It helps to reduce harmful air pollutants and carbon emissions today, while complementing the development of renewables, and other innovative low-carbon energy technologies, which further promote clean air and reduce emissions.
In generating electricity, from production through to use, natural gas produces around half of the Greenhouse Gas Emissions (GHG), compared to coal.
Compared to coal-fired plants, modern natural gas plants also emit less than a tenth of Sulphur oxides, a quarter of nitrogen oxides, and essentially no particulate matter or heavy metals.
The Energy to Act Now for a Cleaner Environment
0.35
1.03
0.01
0.67
0.02
0.7
0.090
Natural Gas Coal
Coal vs. Gas Emissions from 1 MWh of Generated Power
CO2 (tonnes/MWh) SO2 (g/MWh) NO2 (g/MWh) PM (g/MWh)
9 109
Enables Clean airAir pollution continues to be the world’s single greatest immediate environmental risk to health.
Air pollution affects the vast majority of global population; however, its heaviest burden falls on the most vulnerable members of society – the elderly, children, and those with health issues. It also tends to be much more severe in the developing world.
According to the WHO, in 2016 air pollution was responsible for 7 million premature deaths, and almost 600,000 of those were children, under the age of 5.
4.2 million deaths every year as a result of exposure to ambient (outdoor) air pollution
3.8 million deaths every year as a result of household exposure to smoke from dirty cookstoves and fuels
91% of the world’s population lives in places where air pollution exceeds WHO guideline limits
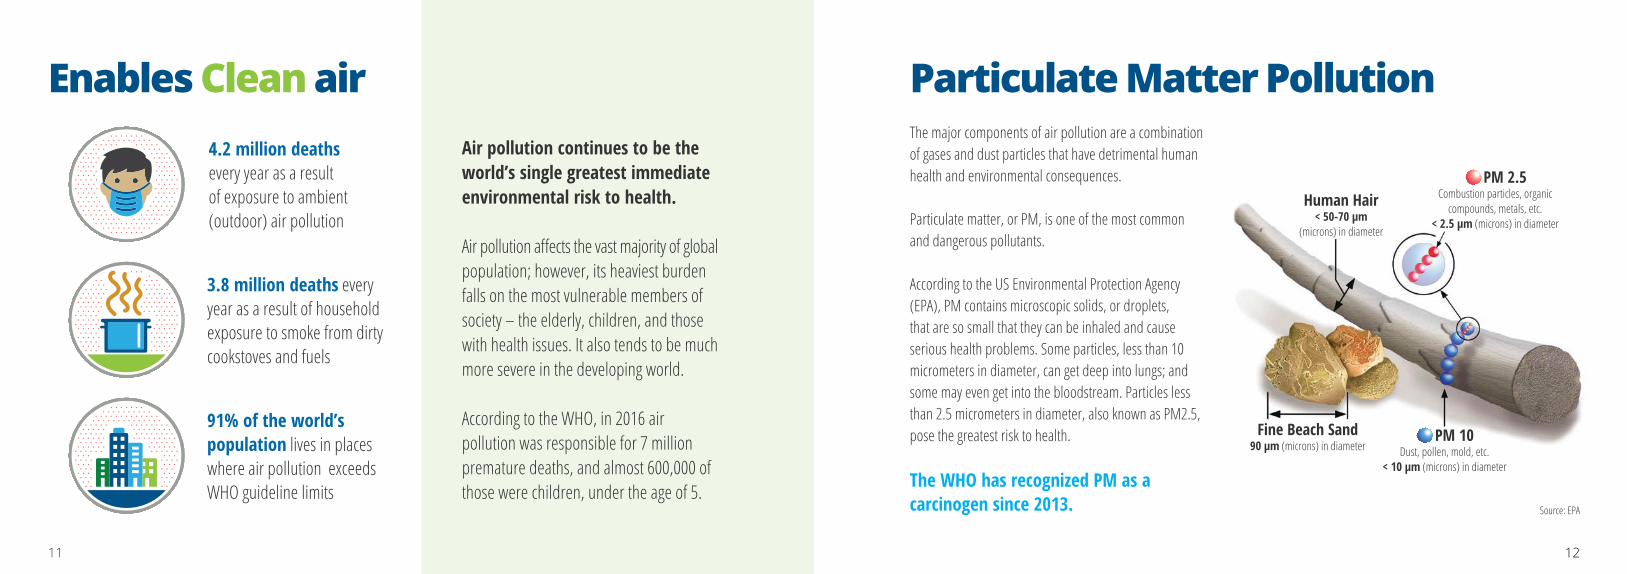
Particulate Matter Pollution
Source: EPA
The major components of air pollution are a combination of gases and dust particles that have detrimental human health and environmental consequences.
Particulate matter, or PM, is one of the most common and dangerous pollutants.
According to the US Environmental Protection Agency (EPA), PM contains microscopic solids, or droplets, that are so small that they can be inhaled and cause serious health problems. Some particles, less than 10 micrometers in diameter, can get deep into lungs; and some may even get into the bloodstream. Particles less than 2.5 micrometers in diameter, also known as PM2.5, pose the greatest risk to health. The WHO has recognized PM as a carcinogen since 2013.
11 12
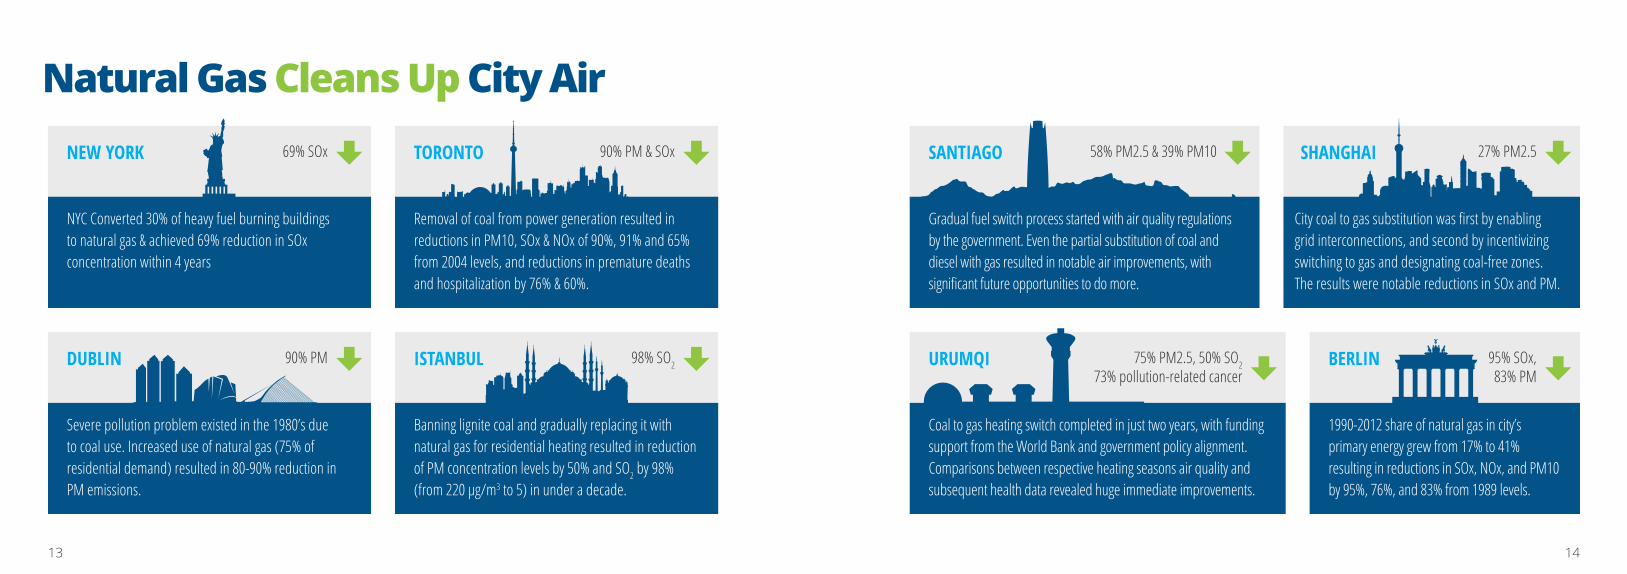
Natural Gas Cleans Up City Air
13 14
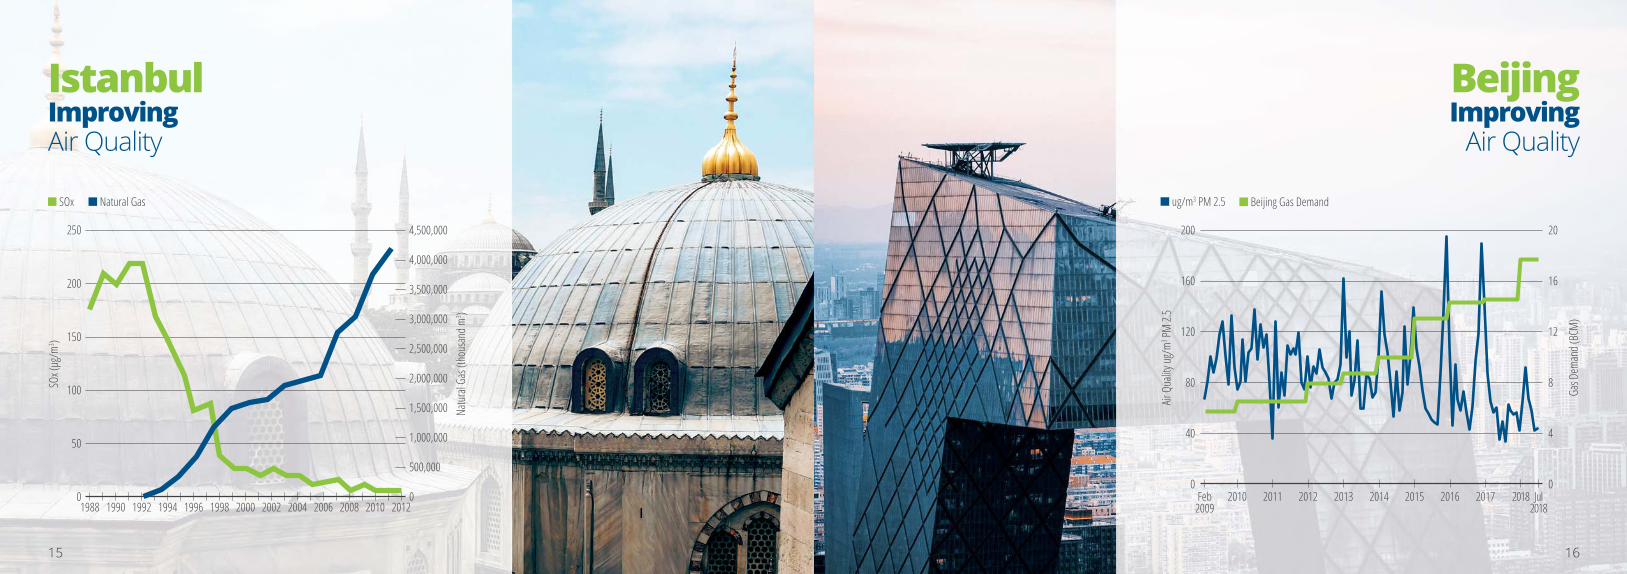
SOx (
μg/m
3 )
0
50
100
150
200
250
1988 19921990 1996 2000 2004 201220081994 1998 2002 2006 2010
Natur
al Ga
s (tho
usan
d m3 )
4,500,000
4,000,000
3,500,000
3,000,000
2,500,000
2,000,000
1,500,000
1,000,000
500,000
0
SOx Natural Gas
Air Q
uality
ug/m
3 PM 2.
5
200
160
120
80
40
02010 2012 2014 2016 201820172011 2013 2015
Gas D
eman
d (BC
M)
20
12
16
8
4
0
ug/m3 PM 2.5 Beijing Gas Demand
Jul2018
Feb2009
1615
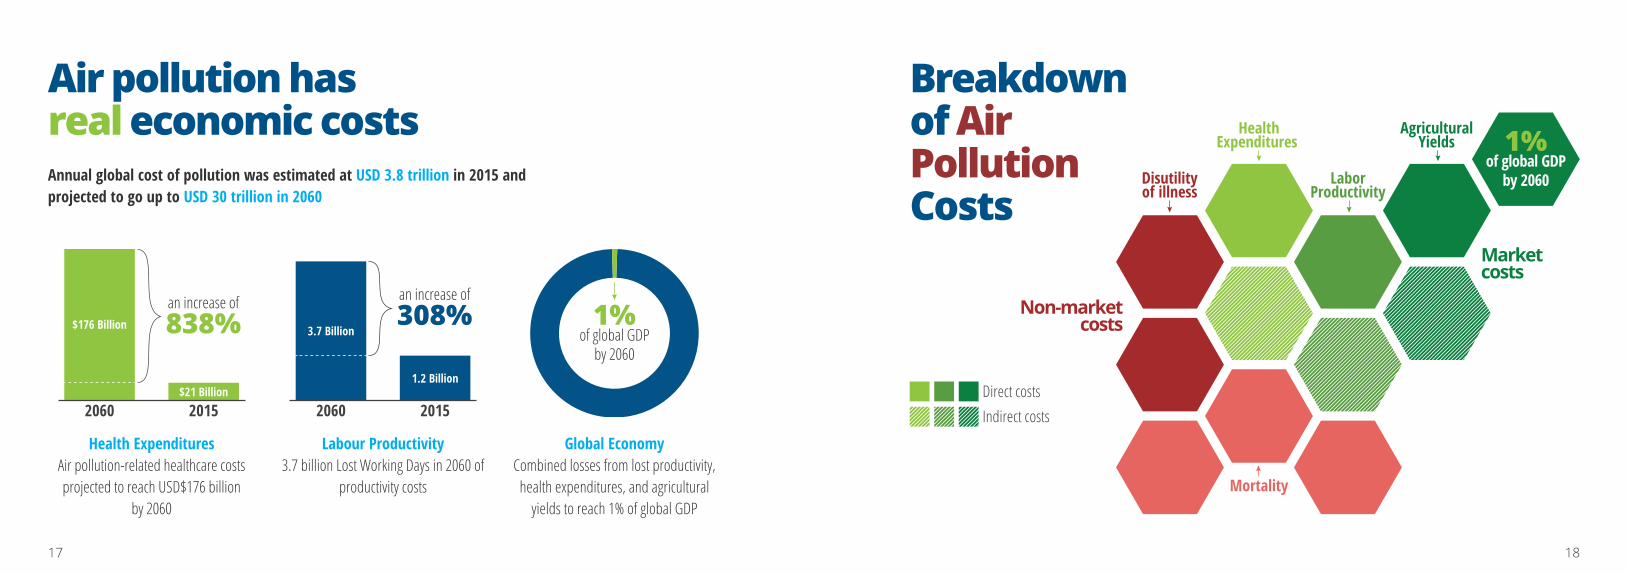
Non-marketcosts
Marketcosts
Direct costsIndirect costs
Mortality
Disutilityof illness
HealthExpenditures
LaborProductivity
AgriculturalYields
of global GDPby 2060
1%
Breakdown of Air Pollution Costs
Air pollution has real economic costsAnnual global cost of pollution was estimated at USD 3.8 trillion in 2015 and projected to go up to USD 30 trillion in 2060
20152060$21 Billion
$176 Billion
an increase of838%
20152060
1.2 Billion
3.7 Billion
an increase of308%
of global GDPby 2060
1%
17 18
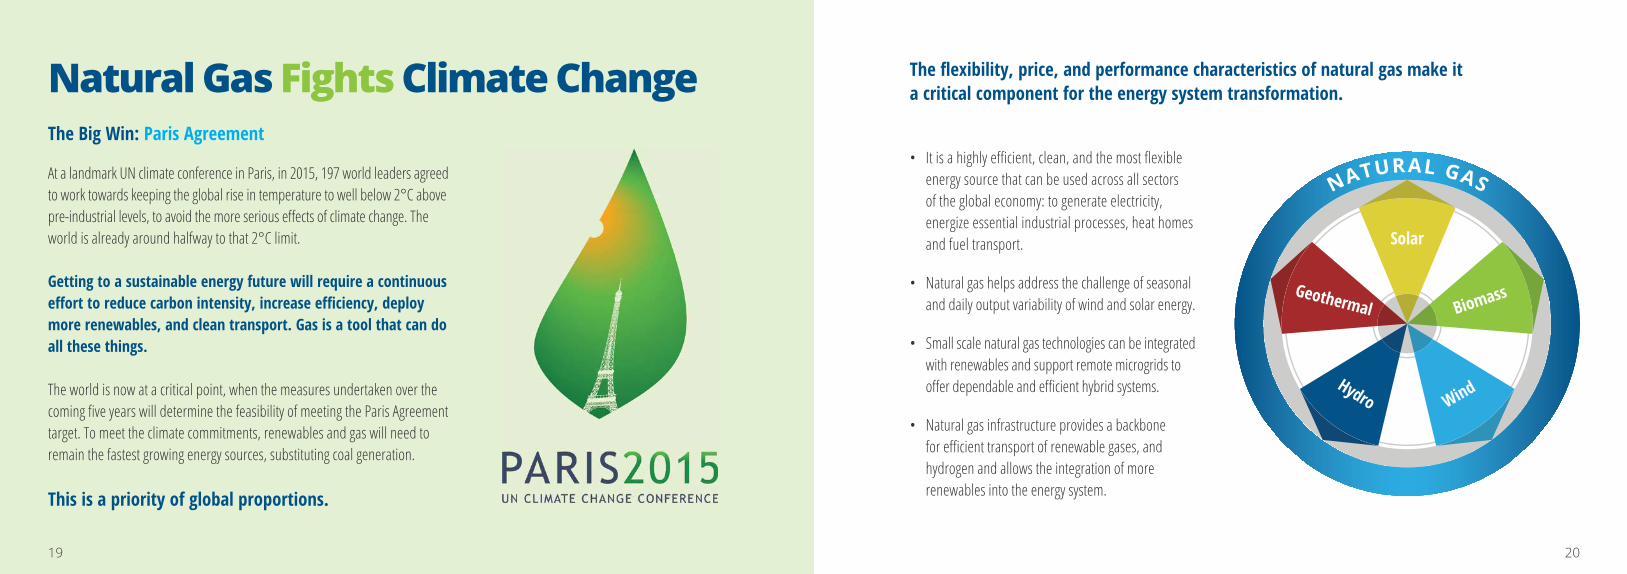
NATURAL GAS
Solar
Hydro Wind
Geothermal Biomass
The Big Win: Paris Agreement
At a landmark UN climate conference in Paris, in 2015, 197 world leaders agreed to work towards keeping the global rise in temperature to well below 2°C above pre-industrial levels, to avoid the more serious effects of climate change. The world is already around halfway to that 2°C limit.
Getting to a sustainable energy future will require a continuous effort to reduce carbon intensity, increase efficiency, deploy more renewables, and clean transport. Gas is a tool that can do all these things.
The world is now at a critical point, when the measures undertaken over the coming five years will determine the feasibility of meeting the Paris Agreement target. To meet the climate commitments, renewables and gas will need to remain the fastest growing energy sources, substituting coal generation.
This is a priority of global proportions.
The flexibility, price, and performance characteristics of natural gas make it a critical component for the energy system transformation.Natural Gas Fights Climate Change
• It is a highly efficient, clean, and the most flexible energy source that can be used across all sectors of the global economy: to generate electricity, energize essential industrial processes, heat homes and fuel transport.
• Natural gas helps address the challenge of seasonal and daily output variability of wind and solar energy.
• Small scale natural gas technologies can be integrated with renewables and support remote microgrids to offer dependable and efficient hybrid systems.
• Natural gas infrastructure provides a backbone for efficient transport of renewable gases, and hydrogen and allows the integration of more renewables into the energy system.
19 20
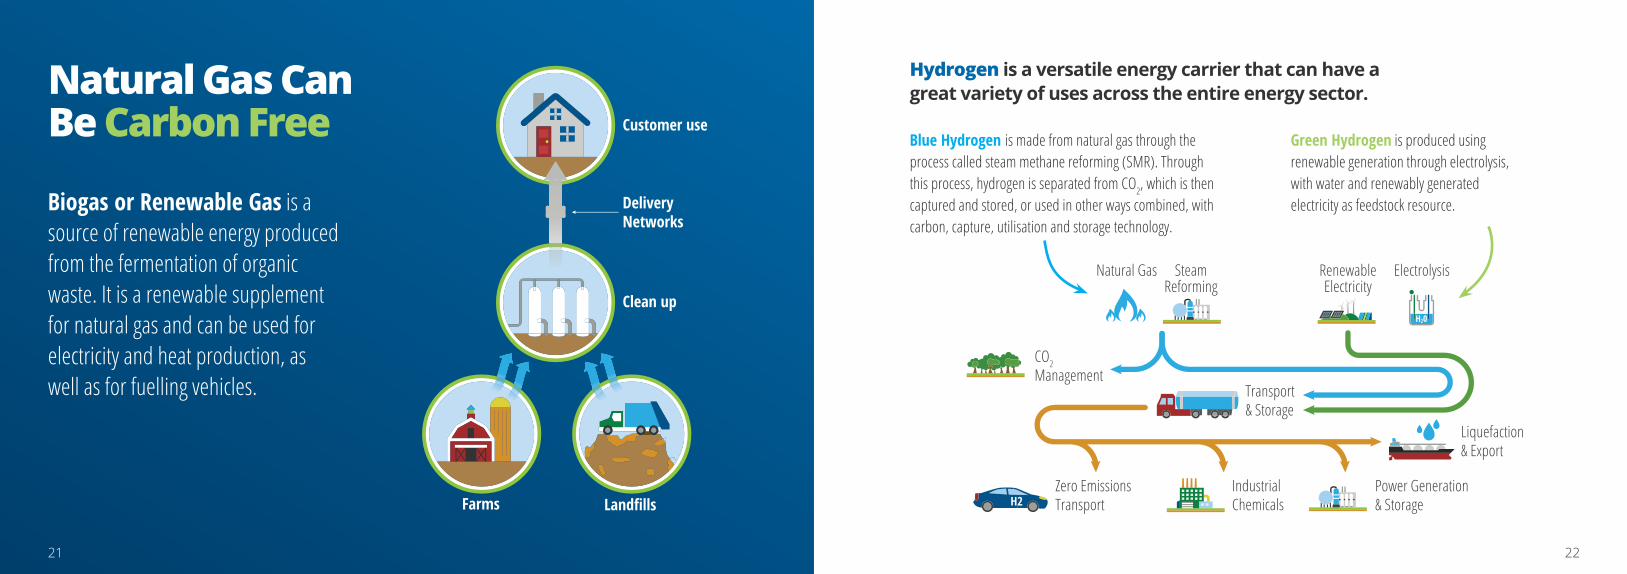
Natural Gas Electrolysis
Liquefaction& Export
Transport& Storage
CO2Management
Zero EmissionsTransport
IndustrialChemicals
Power Generation& Storage
SteamReforming
RenewableElectricity
Farms
DeliveryNetworks
Landfills
Clean up
Customer use
Hydrogen is a versatile energy carrier that can have a great variety of uses across the entire energy sector. Natural Gas Can
Be Carbon Free
Biogas or Renewable Gas is a source of renewable energy produced from the fermentation of organic waste. It is a renewable supplement for natural gas and can be used for electricity and heat production, as well as for fuelling vehicles.
2221
2000m
1
2
3
4
1
2
3
4
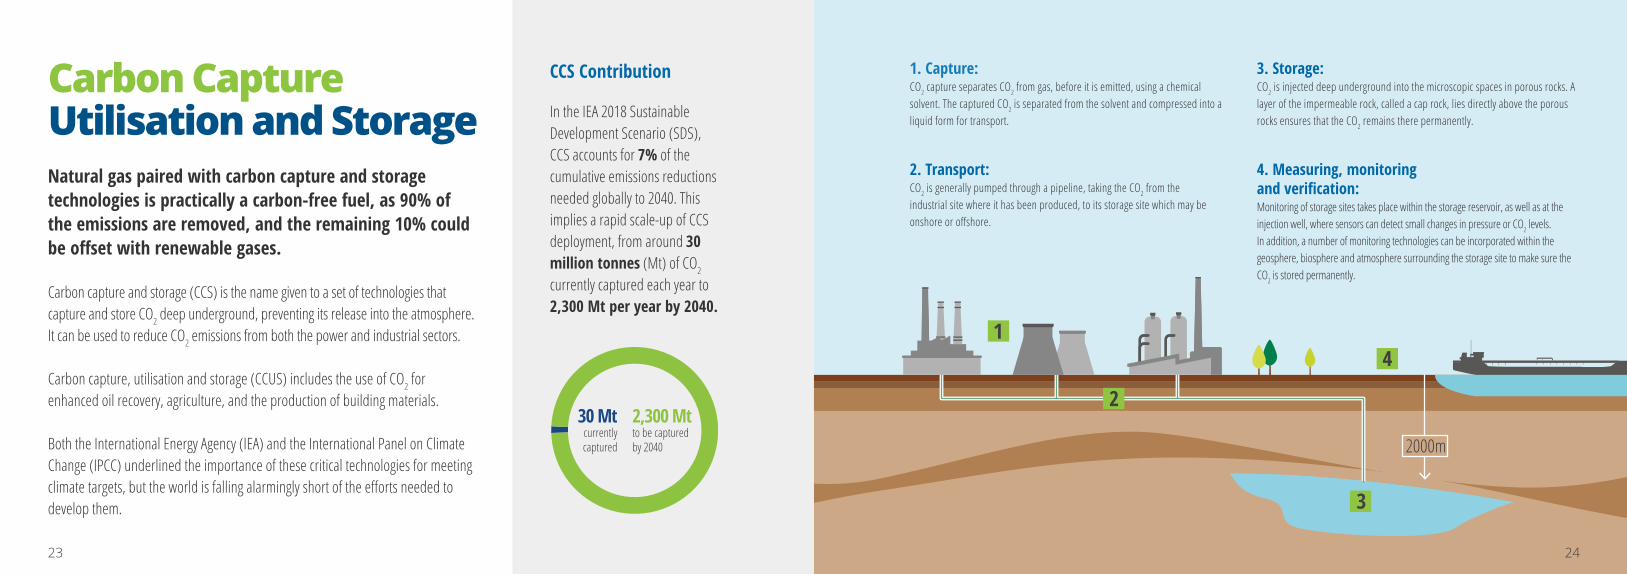
Carbon Capture Utilisation and StorageNatural gas paired with carbon capture and storage technologies is practically a carbon-free fuel, as 90% of the emissions are removed, and the remaining 10% could be offset with renewable gases.
Carbon capture and storage (CCS) is the name given to a set of technologies that capture and store CO2 deep underground, preventing its release into the atmosphere. It can be used to reduce CO2 emissions from both the power and industrial sectors.
Carbon capture, utilisation and storage (CCUS) includes the use of CO2 for enhanced oil recovery, agriculture, and the production of building materials.
Both the International Energy Agency (IEA) and the International Panel on Climate Change (IPCC) underlined the importance of these critical technologies for meeting climate targets, but the world is falling alarmingly short of the efforts needed to develop them.
1. Capture:CO2 capture separates CO2 from gas, before it is emitted, using a chemical solvent. The captured CO2 is separated from the solvent and compressed into a liquid form for transport.
3. Storage:CO2 is injected deep underground into the microscopic spaces in porous rocks. A layer of the impermeable rock, called a cap rock, lies directly above the porous rocks ensures that the CO2 remains there permanently.
2. Transport:CO2 is generally pumped through a pipeline, taking the CO2 from the industrial site where it has been produced, to its storage site which may be onshore or offshore.
4. Measuring, monitoring and verification:Monitoring of storage sites takes place within the storage reservoir, as well as at the injection well, where sensors can detect small changes in pressure or CO2 levels. In addition, a number of monitoring technologies can be incorporated within the geosphere, biosphere and atmosphere surrounding the storage site to make sure the CO2 is stored permanently.
CCS Contribution
In the IEA 2018 Sustainable Development Scenario (SDS), CCS accounts for 7% of the cumulative emissions reductions needed globally to 2040. This implies a rapid scale-up of CCS deployment, from around 30 million tonnes (Mt) of CO2 currently captured each year to 2,300 Mt per year by 2040.
30 Mtcurrentlycaptured
2,300 Mtto be capturedby 2040
23 24
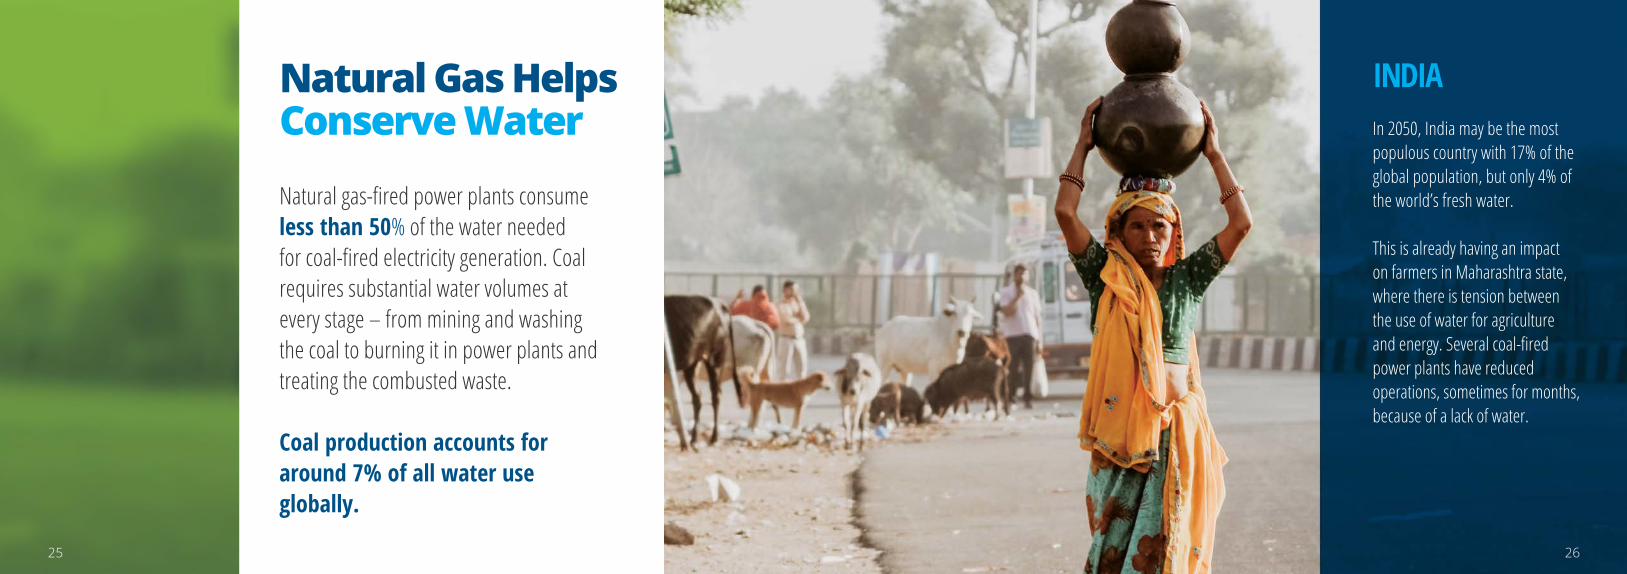
Natural Gas Helps Conserve WaterNatural gas-fired power plants consume less than 50% of the water needed for coal-fired electricity generation. Coal requires substantial water volumes at every stage – from mining and washing the coal to burning it in power plants and treating the combusted waste.
Coal production accounts for around 7% of all water use globally.
INDIAIn 2050, India may be the most populous country with 17% of the global population, but only 4% of the world’s fresh water.
This is already having an impact on farmers in Maharashtra state, where there is tension between the use of water for agriculture and energy. Several coal-fired power plants have reduced operations, sometimes for months, because of a lack of water.
2625
Sales
Volum
es (t
cf/ye
ar)
9
8
7
6
5
4
3
2
1
0
Milli
ons o
f cus
tomer
s
70
60
50
40
30
20
10
01970 2017
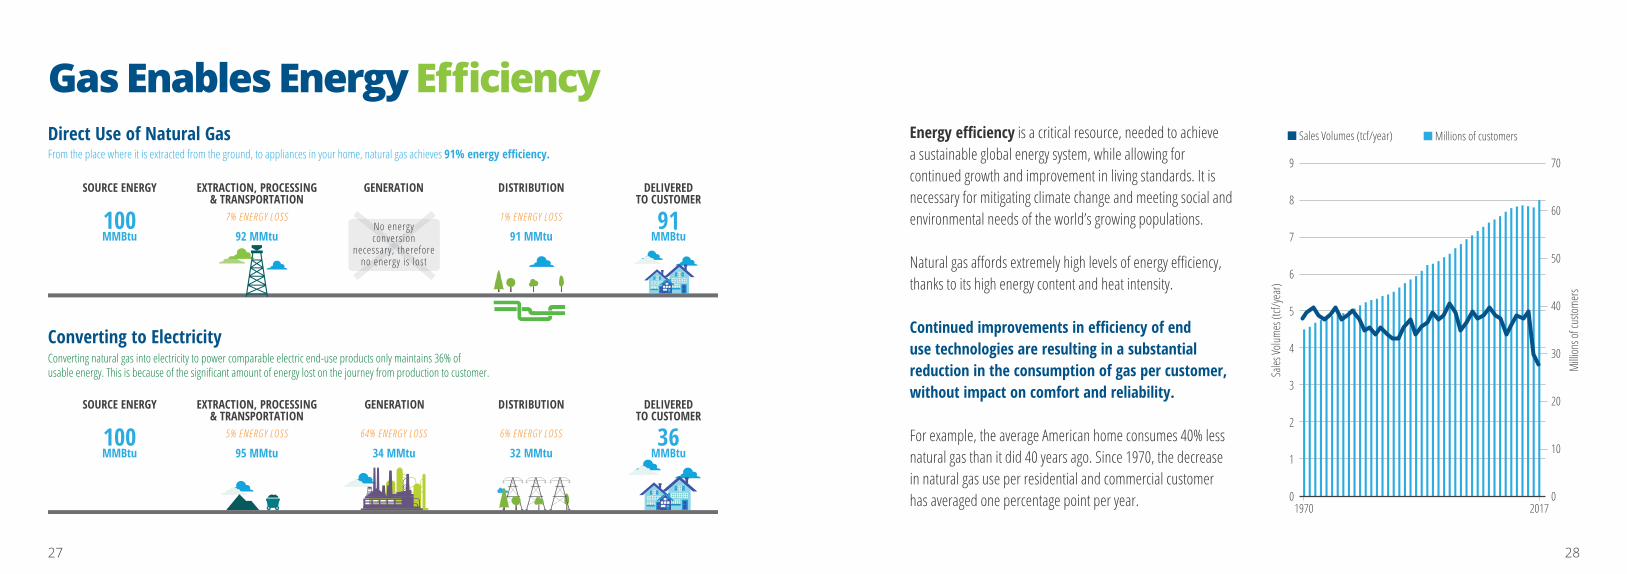
Sales Volumes (tcf/year) Millions of customersDirect Use of Natural GasFrom the place where it is extracted from the ground, to appliances in your home, natural gas achieves 91% energy efficiency.
Converting to ElectricityConverting natural gas into electricity to power comparable electric end-use products only maintains 36% ofusable energy. This is because of the significant amount of energy lost on the journey from production to customer.
EXTRACTION, PROCESSING& TRANSPORTATION
95 MMtu5% ENERGY LOSS
DISTRIBUTION
32 MMtu6% ENERGY LOSS
GENERATION
34 MMtu64% ENERGY LOSS
SOURCE ENERGY
100MMBtu
DELIVEREDTO CUSTOMER
36MMBtu
EXTRACTION, PROCESSING& TRANSPORTATION
92 MMtu7% ENERGY LOSS
DISTRIBUTION
91 MMtu1% ENERGY LOSS
SOURCE ENERGY
100MMBtu
GENERATION
No energyconversion
necessary, thereforeno energy is lost
DELIVEREDTO CUSTOMER
91MMBtu
Energy efficiency is a critical resource, needed to achieve a sustainable global energy system, while allowing for continued growth and improvement in living standards. It is necessary for mitigating climate change and meeting social and environmental needs of the world’s growing populations.
Natural gas affords extremely high levels of energy efficiency, thanks to its high energy content and heat intensity.
Continued improvements in efficiency of end use technologies are resulting in a substantial reduction in the consumption of gas per customer, without impact on comfort and reliability.
For example, the average American home consumes 40% less natural gas than it did 40 years ago. Since 1970, the decrease in natural gas use per residential and commercial customer has averaged one percentage point per year.
Gas Enables Energy Efficiency
27 28
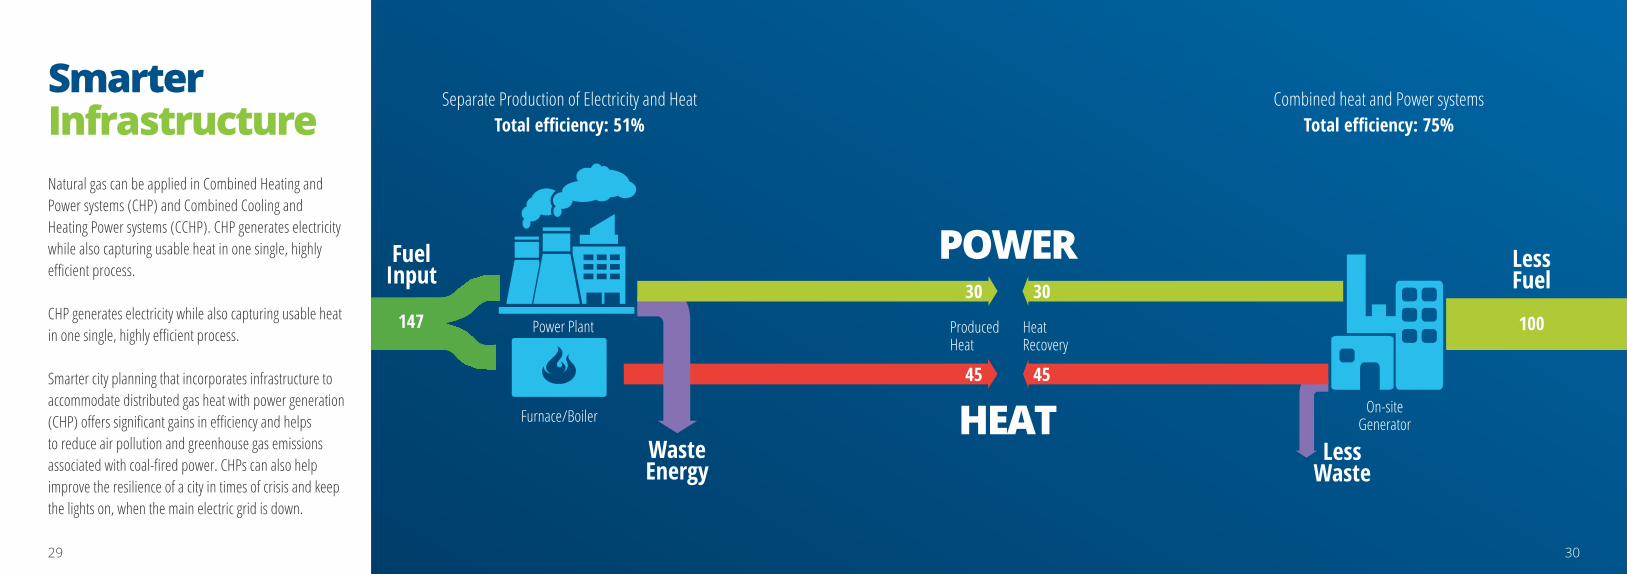
SmarterInfrastructureNatural gas can be applied in Combined Heating and Power systems (CHP) and Combined Cooling and Heating Power systems (CCHP). CHP generates electricity while also capturing usable heat in one single, highly efficient process.
CHP generates electricity while also capturing usable heat in one single, highly efficient process.
Smarter city planning that incorporates infrastructure to accommodate distributed gas heat with power generation (CHP) offers significant gains in efficiency and helps to reduce air pollution and greenhouse gas emissions associated with coal-fired power. CHPs can also help improve the resilience of a city in times of crisis and keep the lights on, when the main electric grid is down.
147
Fuel Input
Waste Energy
Power Plant
Furnace/Boiler
ProducedHeat
HeatRecovery
30
45
30
45
HEAT
POWER LessFuel
100
On-siteGenerator
Less Waste
Separate Production of Electricity and HeatTotal efficiency: 51%
Combined heat and Power systemsTotal efficiency: 75%
29 30
CO2Carbon dioxideby up to 20%
NMOGNon-methane
organic gasby 50 to 75%
NOXNitrogen oxides
by 75 to 95%
24 Million
GLOBALLYNGVs
COCarbon monoxide
by 70 to 90%
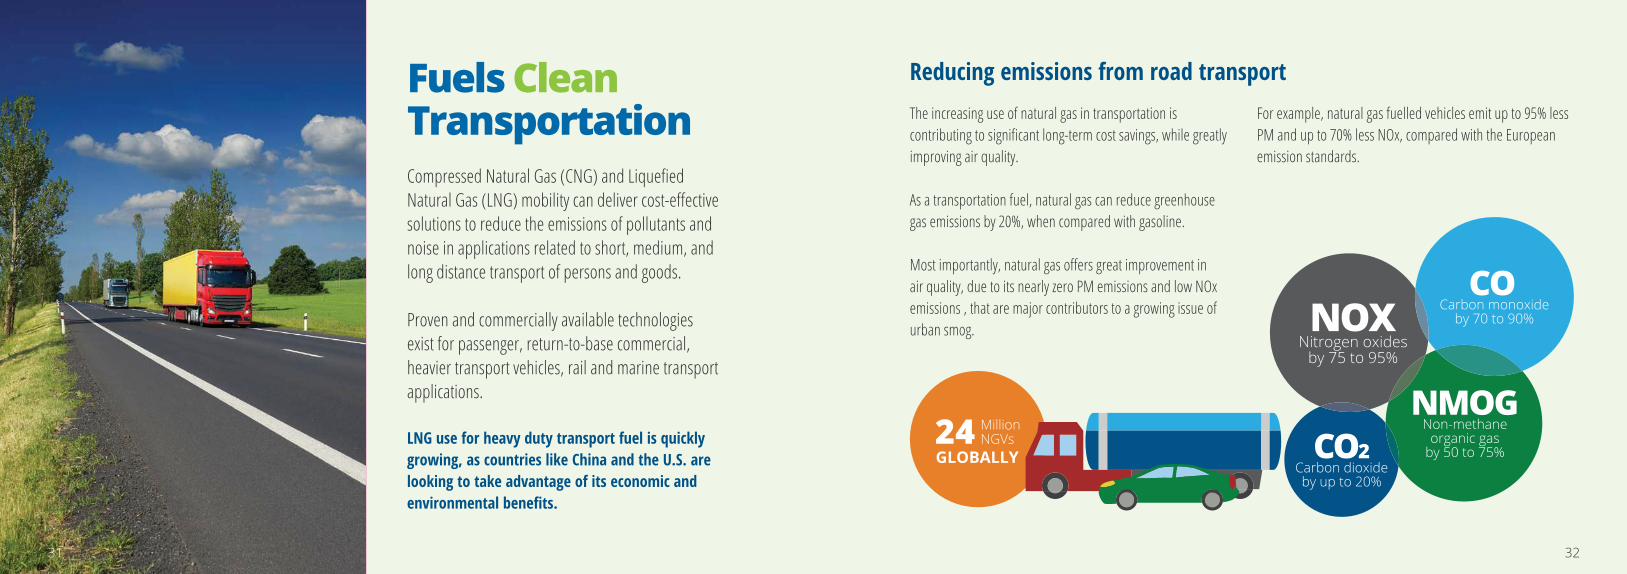
The increasing use of natural gas in transportation is contributing to significant long-term cost savings, while greatly improving air quality.
As a transportation fuel, natural gas can reduce greenhouse gas emissions by 20%, when compared with gasoline.
Most importantly, natural gas offers great improvement in air quality, due to its nearly zero PM emissions and low NOx emissions , that are major contributors to a growing issue of urban smog.
For example, natural gas fuelled vehicles emit up to 95% less PM and up to 70% less NOx, compared with the European emission standards.
Compressed Natural Gas (CNG) and Liquefied Natural Gas (LNG) mobility can deliver cost-effective solutions to reduce the emissions of pollutants and noise in applications related to short, medium, and long distance transport of persons and goods.
Proven and commercially available technologies exist for passenger, return-to-base commercial, heavier transport vehicles, rail and marine transport applications.
LNG use for heavy duty transport fuel is quickly growing, as countries like China and the U.S. are looking to take advantage of its economic and environmental benefits.
Fuels Clean Transportation
Reducing emissions from road transport
3231
Heavy Fuel Oil
Marine Distillate
LNG
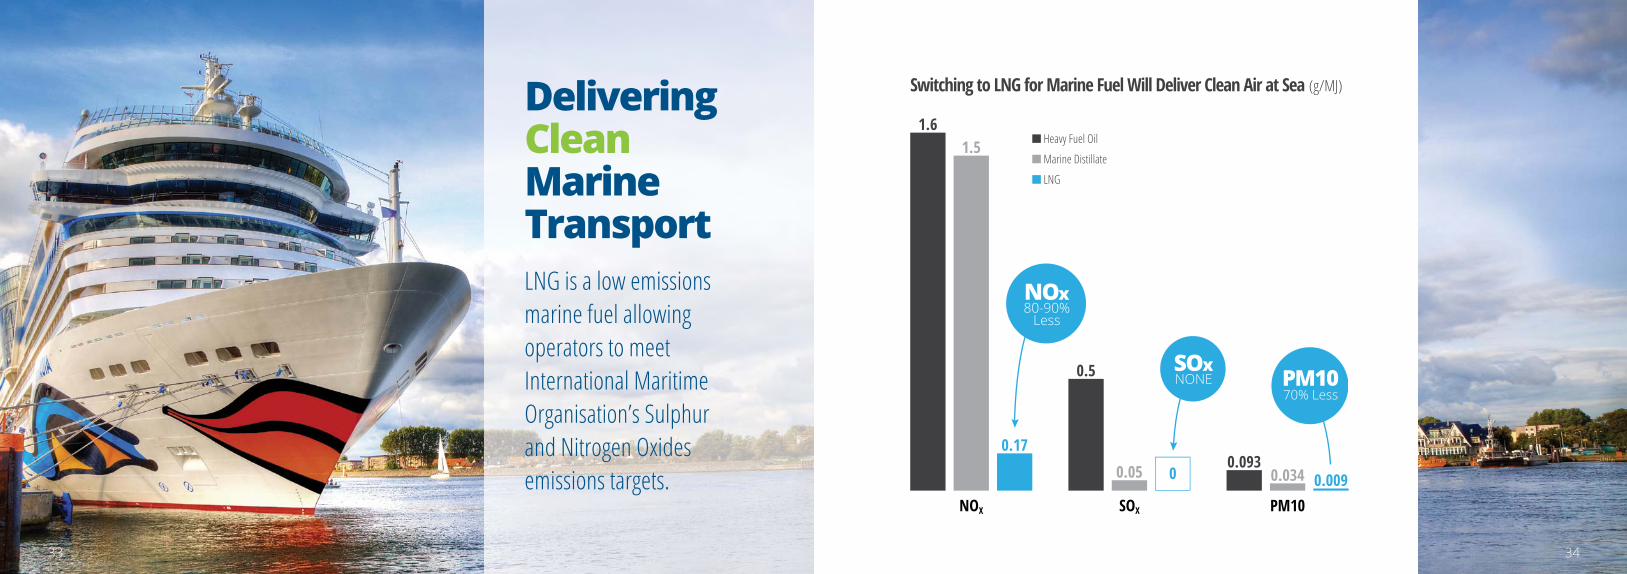
Switching to LNG for Marine Fuel Will Deliver Clean Air at Sea (g/MJ)
NOX SOX PM10
NOx80-90%
Less
SOxNONE PM10
70% Less
1.61.5
0.17
0.5
0.05 00.093
0.034 0.009
Delivering CleanMarine TransportLNG is a low emissions marine fuel allowing operators to meet International Maritime Organisation’s Sulphur and Nitrogen Oxides emissions targets.
3433
MethaneEmissions
ME
TH
AN
E
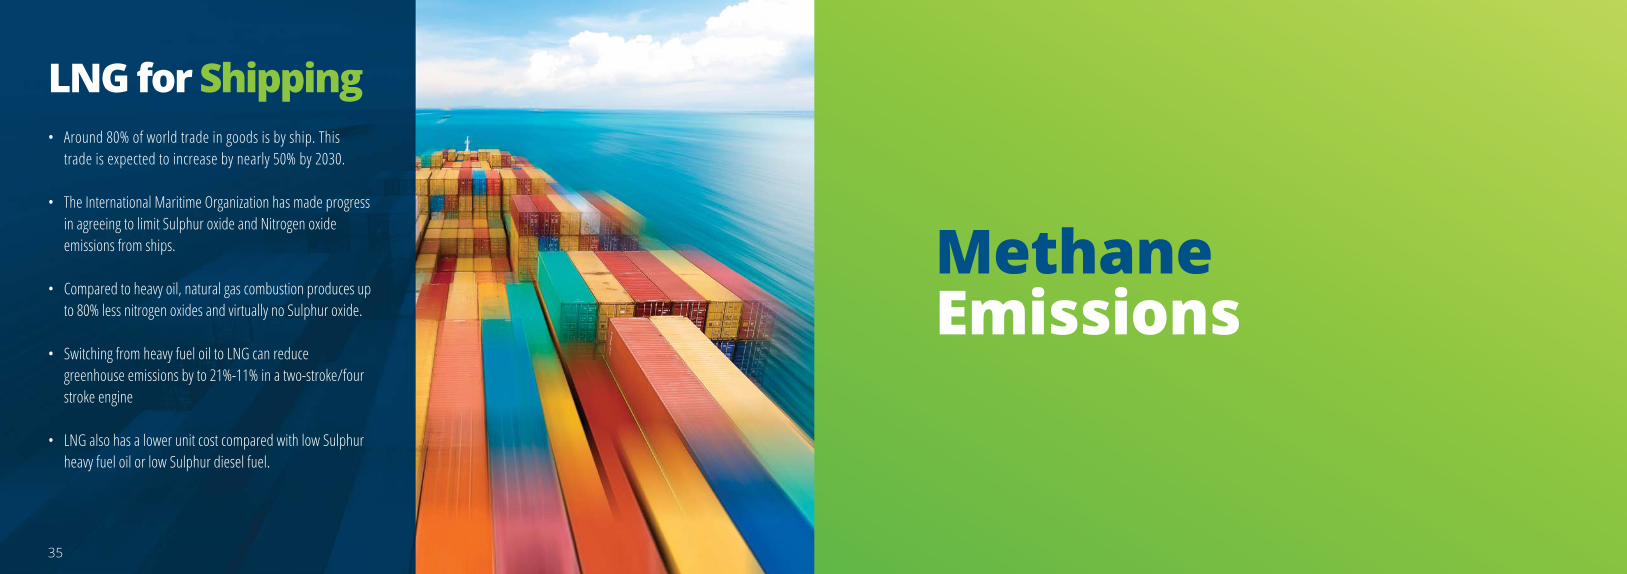
LNG for Shipping • Around 80% of world trade in goods is by ship. This
trade is expected to increase by nearly 50% by 2030.
• The International Maritime Organization has made progress in agreeing to limit Sulphur oxide and Nitrogen oxide emissions from ships.
• Compared to heavy oil, natural gas combustion produces up to 80% less nitrogen oxides and virtually no Sulphur oxide.
• Switching from heavy fuel oil to LNG can reduce greenhouse emissions by to 21%-11% in a two-stroke/four stroke engine
• LNG also has a lower unit cost compared with low Sulphur heavy fuel oil or low Sulphur diesel fuel.
35
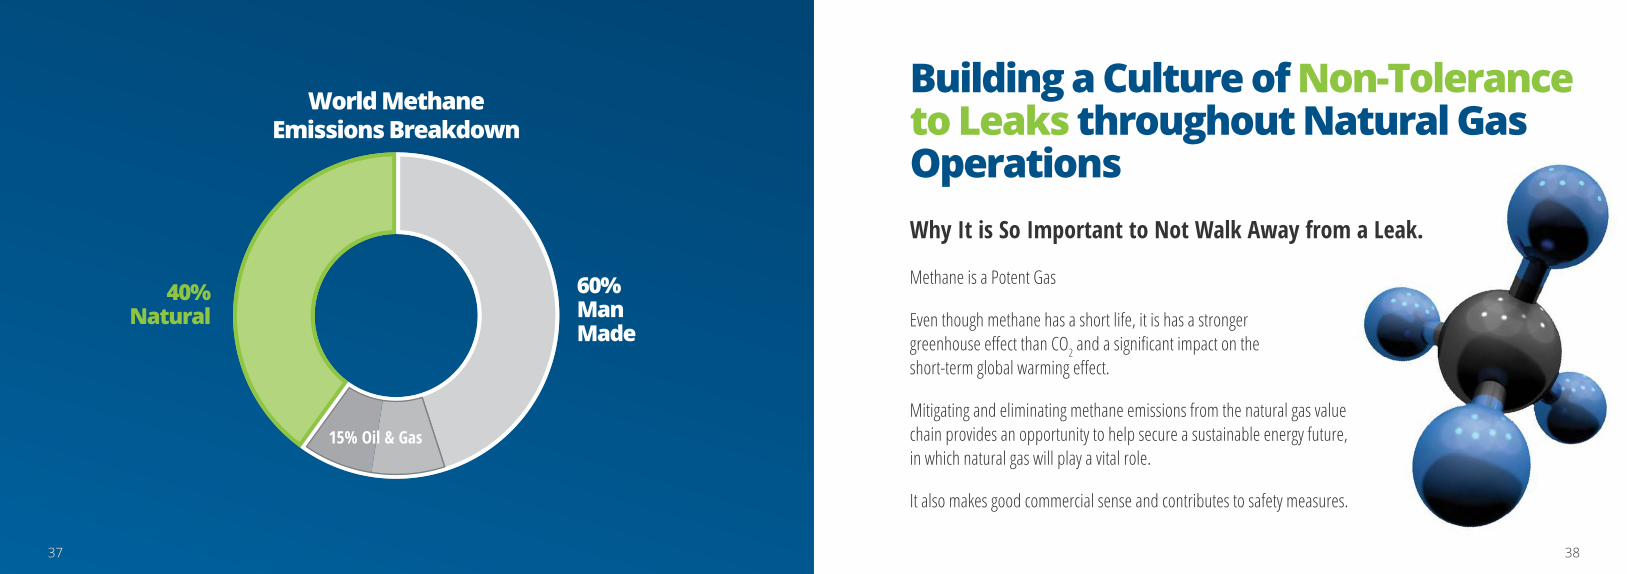
40%Natural
60%ManMade
15% Oil & Gas
World MethaneEmissions Breakdown
Building a Culture of Non-Tolerance to Leaks throughout Natural Gas Operations Why It is So Important to Not Walk Away from a Leak.
Methane is a Potent Gas
Even though methane has a short life, it is has a strongergreenhouse effect than CO2 and a significant impact on theshort-term global warming effect.
Mitigating and eliminating methane emissions from the natural gas valuechain provides an opportunity to help secure a sustainable energy future,in which natural gas will play a vital role.
It also makes good commercial sense and contributes to safety measures.
37 3837
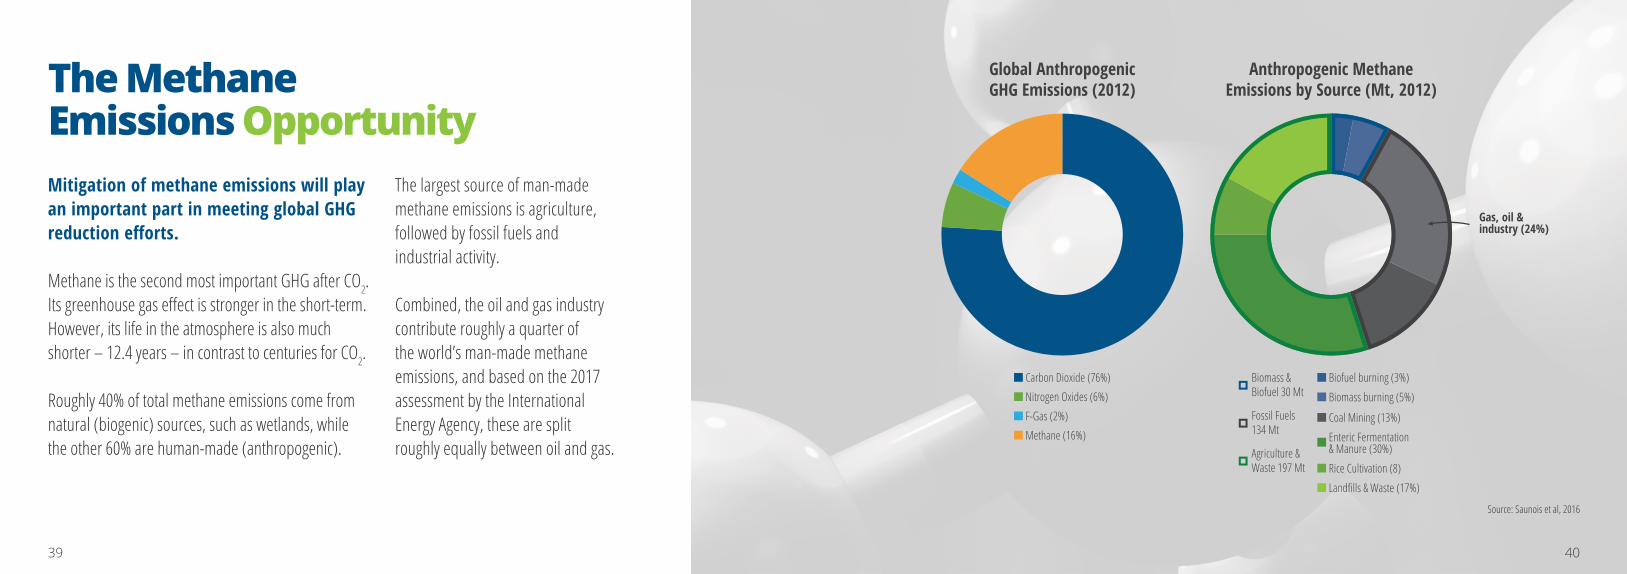
The Methane Emissions Opportunity
Global AnthropogenicGHG Emissions (2012)
Carbon Dioxide (76%)Nitrogen Oxides (6%)F-Gas (2%)Methane (16%)
Anthropogenic MethaneEmissions by Source (Mt, 2012)
Biomass &Biofuel 30 Mt
Fossil Fuels134 Mt
Agriculture &Waste 197 Mt
Biofuel burning (3%)
Biomass burning (5%)
Gas, oil &industry (24%)
Coal Mining (13%)
Enteric Fermentation& Manure (30%)
Rice Cultivation (8)
Landfills & Waste (17%)
Source: Saunois et al, 2016
Mitigation of methane emissions will play an important part in meeting global GHG reduction efforts.
Methane is the second most important GHG after CO2. Its greenhouse gas effect is stronger in the short-term. However, its life in the atmosphere is also much shorter – 12.4 years – in contrast to centuries for CO2.
Roughly 40% of total methane emissions come from natural (biogenic) sources, such as wetlands, while the other 60% are human-made (anthropogenic).
The largest source of man-made methane emissions is agriculture, followed by fossil fuels and industrial activity.
Combined, the oil and gas industry contribute roughly a quarter of the world’s man-made methane emissions, and based on the 2017 assessment by the International Energy Agency, these are split roughly equally between oil and gas.
39 40
Natural gas combustion is highly efficient in its end-use applications, like providing energy for cooking and heating, industrial use, fuelling transport, or producing electricity. Methane emissions occur in different segments of the supply chain, and can happen during extraction, storage, production, transport, or distribution. As no two systems are alike, this can vary greatly by geography and operator.
Owing to the vastness of natural gas infrastructure, the exact quantification of emissions can be challenging. Thus, the industry uses a combination of direct measurement and sophisticated estimation techniques to extrapolate methane emissions across its infrastructure.
Based on the IEA 2017 assessment, the natural gas sector is responsible for about half (42 Mt) of the total oil and gas methane emissions, or about 7-8% of the total Global Methane Emissions.
Methane Emissions in the Natural Gas Sector
41 42
Identification and Elimination of Methane Emissions from its Operations is a Top Priority for the Natural Gas Industry.
Join the Action!
There is a long history of industry efforts to minimize methane emissions across its value chains.
The practice has originated in routine safety requirements and operational efficiency improvements.
More recently, the industry began to further strengthen work in this area, with the intent of accelerating its environmental goals and minimizing the carbon footprint of natural gas.
Several large industry participants have also announced voluntary methane emissions reduction targets.
In addition to individual company efforts, there are several collaborative industry initiatives to improve understanding the scale of methane emissions, potential sources, and opportunities for reductions.
Some of the most known global examples include:
Natural GasSustainability
Initiative
4443
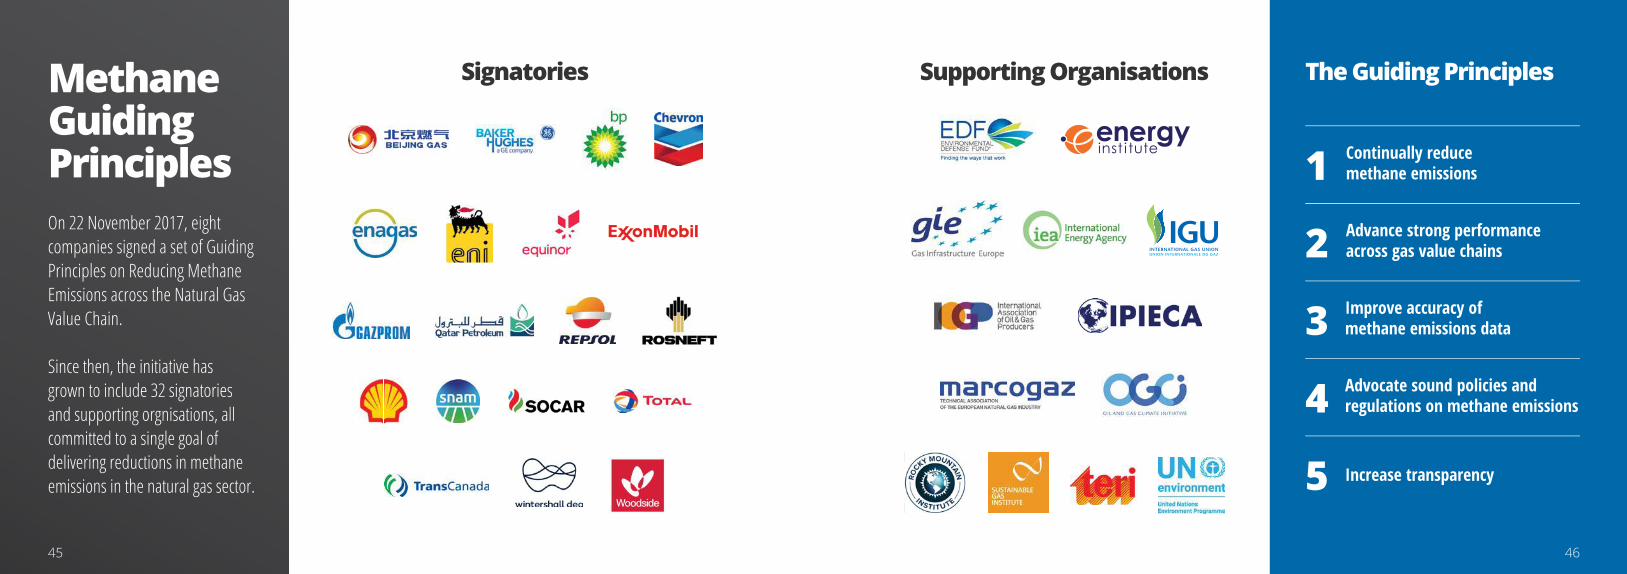
On 22 November 2017, eight companies signed a set of Guiding Principles on Reducing Methane Emissions across the Natural Gas Value Chain.
Since then, the initiative has grown to include 32 signatories and supporting orgnisations, all committed to a single goal of delivering reductions in methane emissions in the natural gas sector.
Methane Guiding Principles
Signatories The Guiding Principles
Continually reducemethane emissions1Advance strong performanceacross gas value chains2Improve accuracy ofmethane emissions data3Advocate sound policies andregulations on methane emissions4Increase transparency5
Supporting Organisations
4645
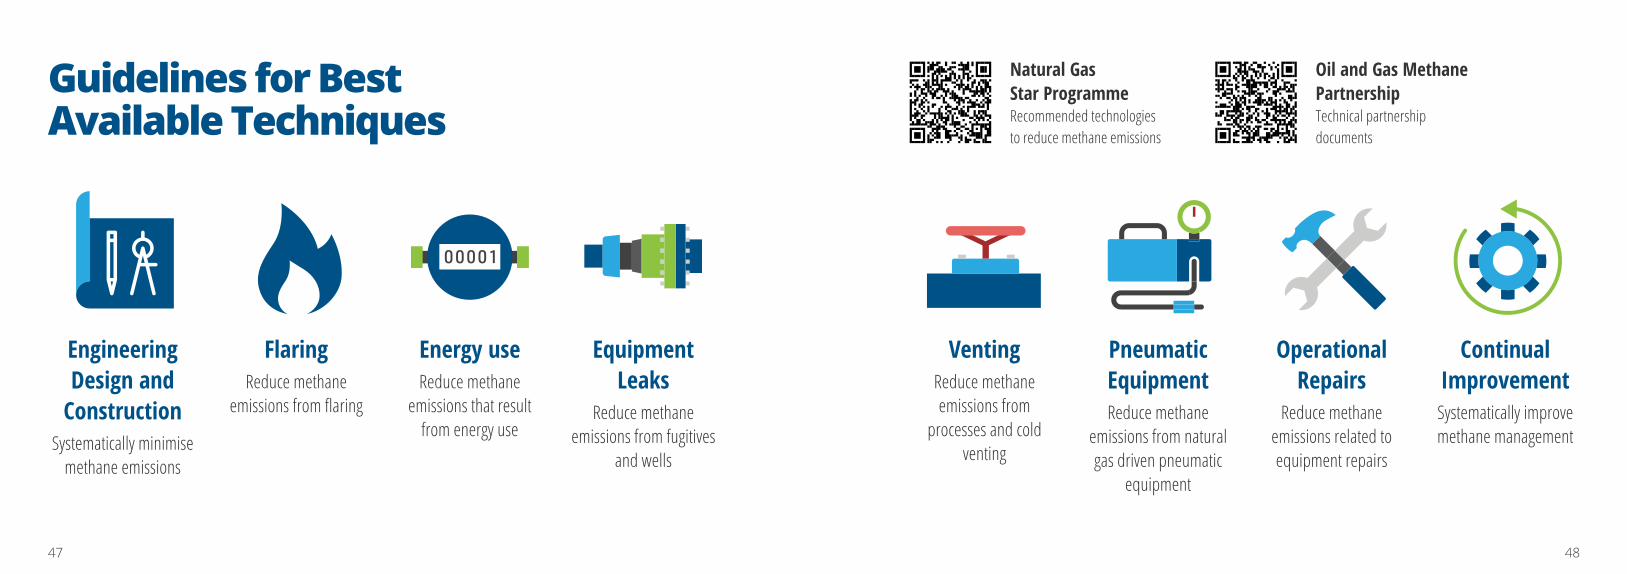
Systematically minimise methane emissions
Engineering Design and
ConstructionReduce methane
emissions from flaring
FlaringReduce methane emissions from
processes and cold venting
Venting
Reduce methane emissions from natural gas driven pneumatic
equipment
Pneumatic EquipmentReduce methane
emissions that result from energy use
Energy use
Reduce methane emissions from fugitives
and wells
Equipment Leaks
Reduce methane emissions related to equipment repairs
Operational Repairs
Systematically improve methane management
Continual Improvement
Natural Gas Star ProgrammeRecommended technologiesto reduce methane emissions
Oil and Gas MethanePartnershipTechnical partnership documents
Guidelines for Best Available Techniques
47 48
Natural Gas plays a VitalEconomic Rolein the SustainableEnergy Future E
CO
NO
MIC
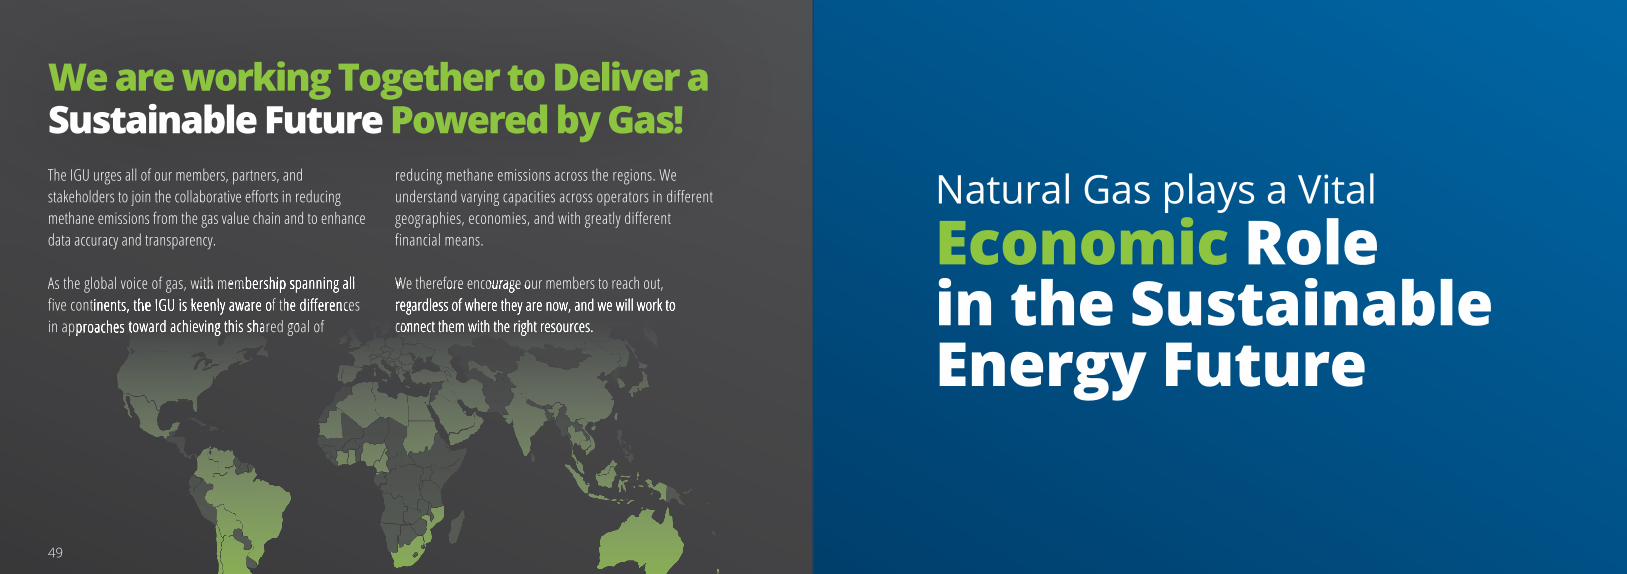
We are working Together to Deliver a Sustainable Future Powered by Gas!The IGU urges all of our members, partners, and stakeholders to join the collaborative efforts in reducing methane emissions from the gas value chain and to enhance data accuracy and transparency.
As the global voice of gas, with membership spanning all five continents, the IGU is keenly aware of the differences in approaches toward achieving this shared goal of
reducing methane emissions across the regions. We understand varying capacities across operators in different geographies, economies, and with greatly different financial means.
We therefore encourage our members to reach out, regardless of where they are now, and we will work to connect them with the right resources. regardless of where they are now, and we will work to five continents, the IGU is keenly aware of the differences We therefore encourage our members to reach out, We therefore encourage our members to reach out, regardless of where they are now, and we will work to connect them with the right resources. regardless of where they are now, and we will work to We therefore encourage our members to reach out, regardless of where they are now, and we will work to We therefore encourage our members to reach out, We therefore encourage our members to reach out, regardless of where they are now, and we will work to We therefore encourage our members to reach out, regardless of where they are now, and we will work to
in approaches toward achieving this shared goal of in approaches toward achieving this shared goal of in approaches toward achieving this shared goal of in approaches toward achieving this shared goal of connect them with the right resources.
As the global voice of gas, with membership spanning all
in approaches toward achieving this shared goal of in approaches toward achieving this shared goal of five continents, the IGU is keenly aware of the differences five continents, the IGU is keenly aware of the differences in approaches toward achieving this shared goal of
As the global voice of gas, with membership spanning all five continents, the IGU is keenly aware of the differences in approaches toward achieving this shared goal of
As the global voice of gas, with membership spanning all five continents, the IGU is keenly aware of the differences in approaches toward achieving this shared goal of five continents, the IGU is keenly aware of the differences in approaches toward achieving this shared goal of
As the global voice of gas, with membership spanning all As the global voice of gas, with membership spanning all As the global voice of gas, with membership spanning all As the global voice of gas, with membership spanning all As the global voice of gas, with membership spanning all five continents, the IGU is keenly aware of the differences As the global voice of gas, with membership spanning all
connect them with the right resources. connect them with the right resources.
As the global voice of gas, with membership spanning all
in approaches toward achieving this shared goal of
We therefore encourage our members to reach out,
connect them with the right resources. regardless of where they are now, and we will work to connect them with the right resources. connect them with the right resources. regardless of where they are now, and we will work to
49
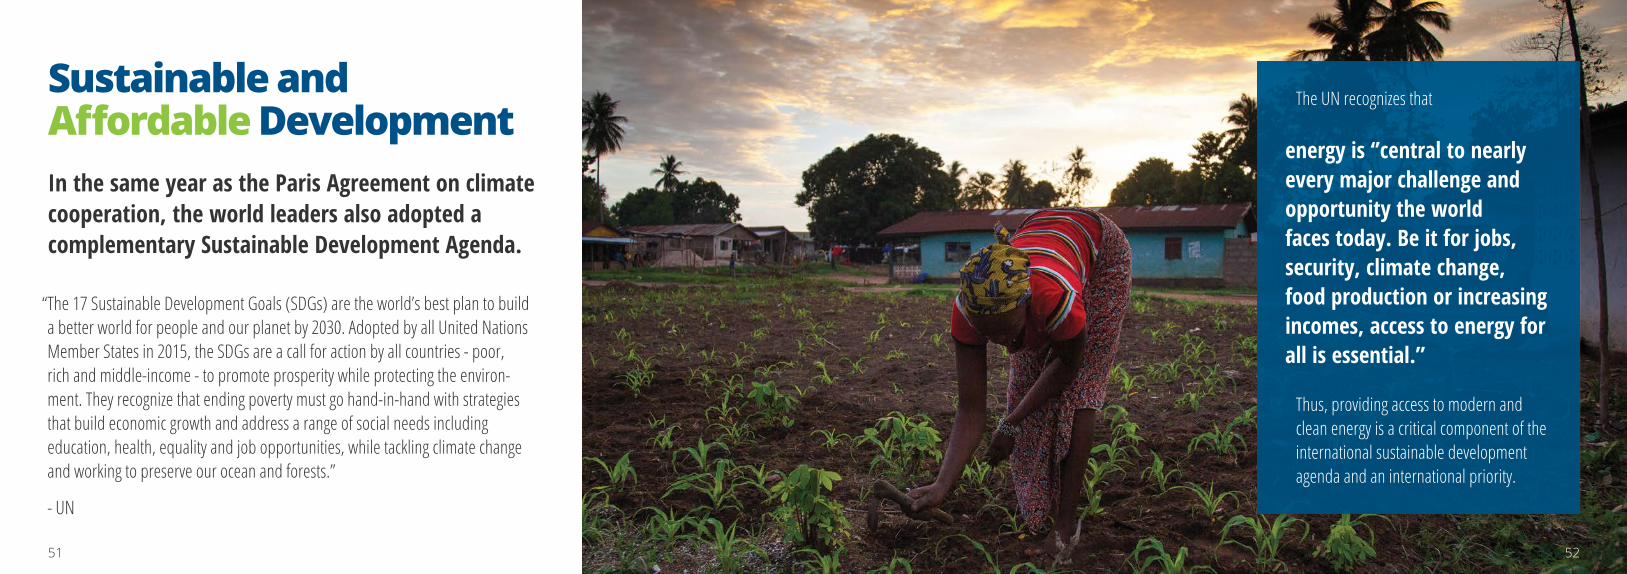
In the same year as the Paris Agreement on climate cooperation, the world leaders also adopted a complementary Sustainable Development Agenda.
“ The 17 Sustainable Development Goals (SDGs) are the world’s best plan to build a better world for people and our planet by 2030. Adopted by all United Nations Member States in 2015, the SDGs are a call for action by all countries - poor, rich and middle-income - to promote prosperity while protecting the environ-ment. They recognize that ending poverty must go hand-in-hand with strategies that build economic growth and address a range of social needs including education, health, equality and job opportunities, while tackling climate change and working to preserve our ocean and forests.”
- UN
Sustainable andAffordable Development
The UN recognizes that
energy is ‘’central to nearly every major challenge and opportunity the world faces today. Be it for jobs, security, climate change, food production or increasing incomes, access to energy for all is essential.”
Thus, providing access to modern and clean energy is a critical component of the international sustainable development agenda and an international priority.
51 52
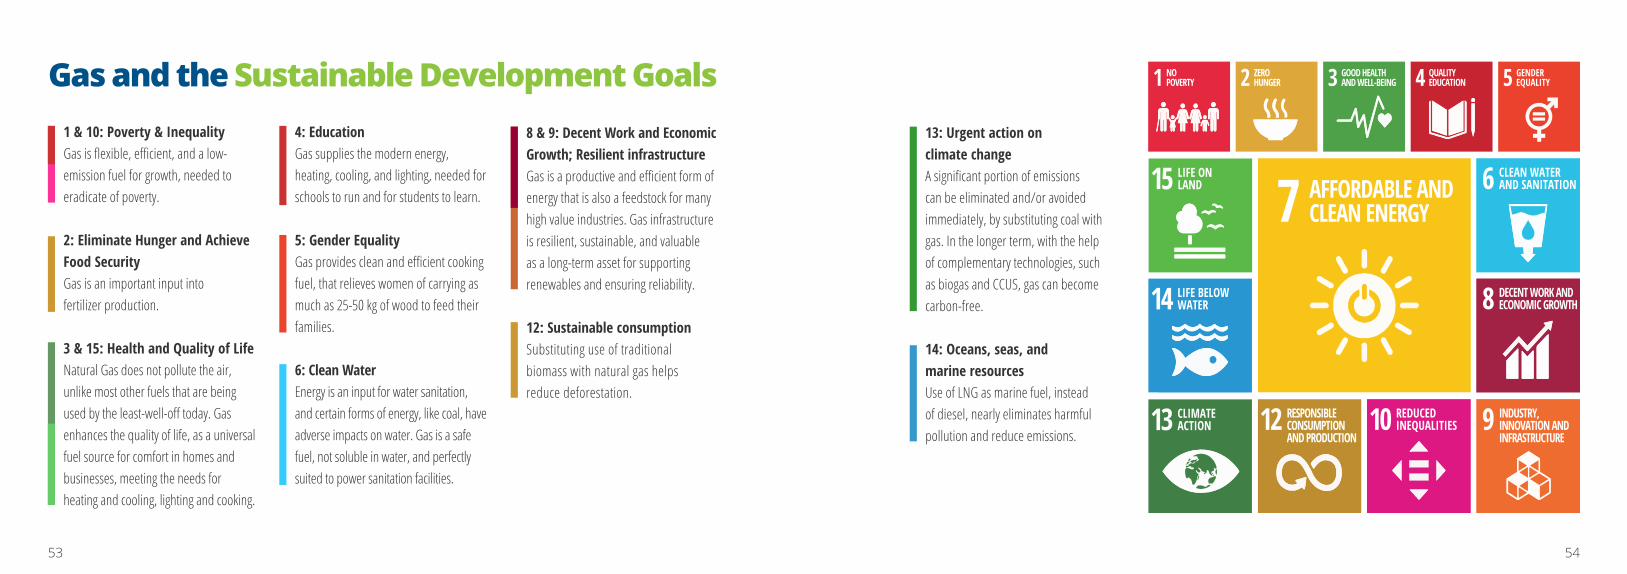
1 & 10: Poverty & Inequality Gas is flexible, efficient, and a low-emission fuel for growth, needed to eradicate of poverty.
2: Eliminate Hunger and Achieve Food Security Gas is an important input into fertilizer production.
3 & 15: Health and Quality of Life Natural Gas does not pollute the air, unlike most other fuels that are being used by the least-well-off today. Gas enhances the quality of life, as a universal fuel source for comfort in homes and businesses, meeting the needs for heating and cooling, lighting and cooking.
4: Education Gas supplies the modern energy, heating, cooling, and lighting, needed for schools to run and for students to learn.
5: Gender Equality Gas provides clean and efficient cooking fuel, that relieves women of carrying as much as 25-50 kg of wood to feed their families.
6: Clean Water Energy is an input for water sanitation, and certain forms of energy, like coal, have adverse impacts on water. Gas is a safe fuel, not soluble in water, and perfectly suited to power sanitation facilities.
8 & 9: Decent Work and Economic Growth; Resilient infrastructure Gas is a productive and efficient form of energy that is also a feedstock for many high value industries. Gas infrastructure is resilient, sustainable, and valuable as a long-term asset for supporting renewables and ensuring reliability.
12: Sustainable consumption Substituting use of traditional biomass with natural gas helps reduce deforestation.
13: Urgent action on climate change A significant portion of emissions can be eliminated and/or avoided immediately, by substituting coal with gas. In the longer term, with the help of complementary technologies, such as biogas and CCUS, gas can become carbon-free.
14: Oceans, seas, and marine resources Use of LNG as marine fuel, instead of diesel, nearly eliminates harmful pollution and reduce emissions.
1 NOPOVERTY
14 LIFE BELOWWATER
5 GENDEREQUALITY
13 CLIMATEACTION
6 CLEAN WATERAND SANITATION
12 RESPONSIBLECONSUMPTIONAND PRODUCTION
10 REDUCEDINEQUALITIES 9 INDUSTRY,
INNOVATION ANDINFRASTRUCTURE
8 DECENT WORK ANDECONOMIC GROWTH
2 ZEROHUNGER 3 GOOD HEALTH
AND WELL-BEING 4 QUALITYEDUCATION
7 AFFORDABLE ANDCLEAN ENERGY
15 LIFE ONLAND
Gas and the Sustainable Development Goals
5453
Key Feedstock for IndustryNatural gas is a clean, reliable, efficient, and economical energy source for electricity generation, heating and hot water supply, cooking fuel and motor fuel. Because of these attributes, it serves as a key feedstock for industry, across a range of sectors – from agriculture to chemicals – natural gas enables the manufacture of life-enhancing products.
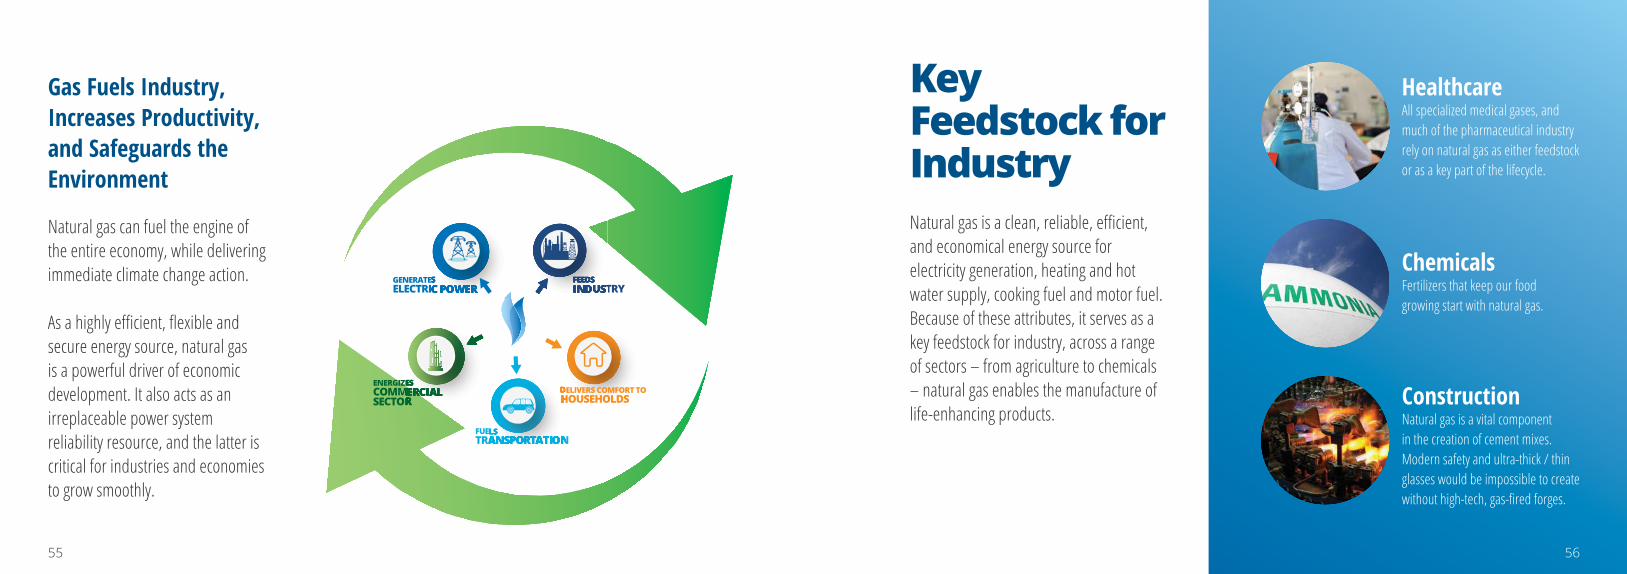
Gas Fuels Industry, Increases Productivity, and Safeguards the Environment
Natural gas can fuel the engine of the entire economy, while delivering immediate climate change action.
As a highly efficient, flexible and secure energy source, natural gas is a powerful driver of economic development. It also acts as an irreplaceable power system reliability resource, and the latter is critical for industries and economies to grow smoothly.
HealthcareAll specialized medical gases, and much of the pharmaceutical industry rely on natural gas as either feedstock or as a key part of the lifecycle.
ChemicalsFertilizers that keep our food growing start with natural gas.
ConstructionNatural gas is a vital component in the creation of cement mixes. Modern safety and ultra-thick / thin glasses would be impossible to create without high-tech, gas-fired forges.
55 56
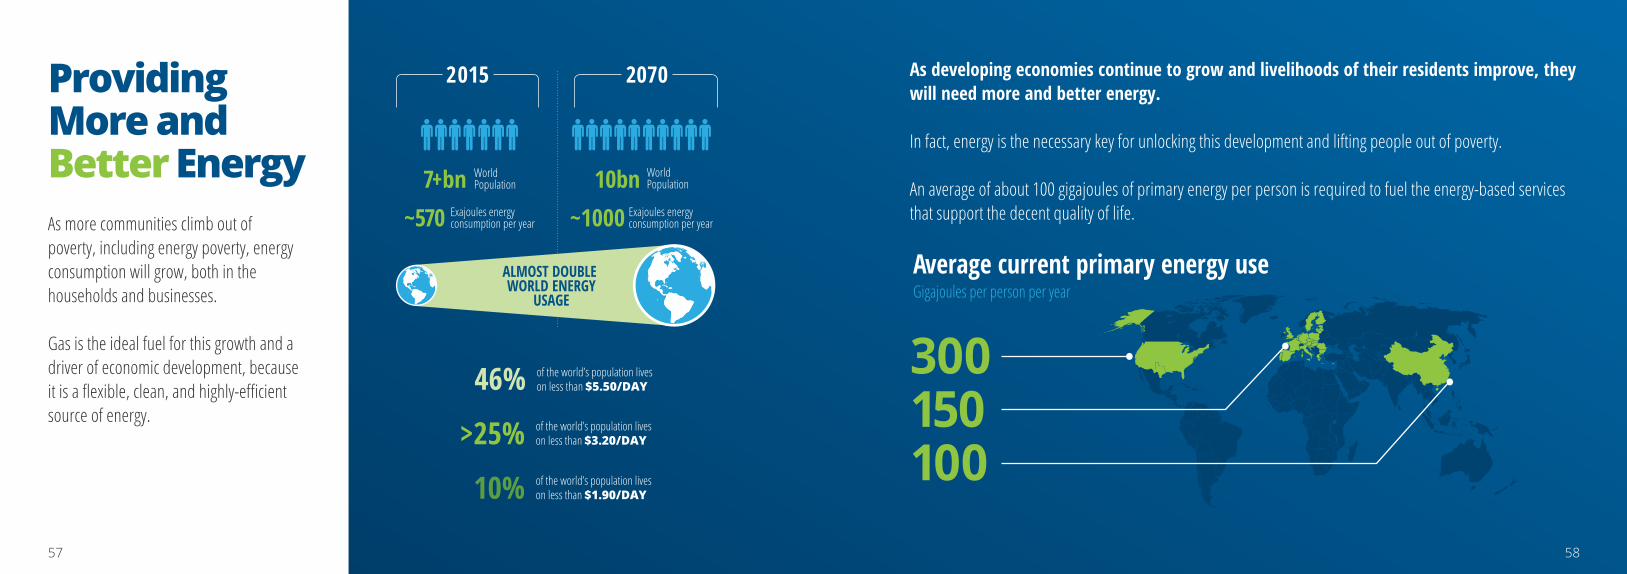
As more communities climb out of poverty, including energy poverty, energy consumption will grow, both in the households and businesses. Gas is the ideal fuel for this growth and a driver of economic development, because it is a flexible, clean, and highly-efficient source of energy.
As developing economies continue to grow and livelihoods of their residents improve, they will need more and better energy.
In fact, energy is the necessary key for unlocking this development and lifting people out of poverty.
An average of about 100 gigajoules of primary energy per person is required to fuel the energy-based services that support the decent quality of life.
2015 2070
7+bn WorldPopulation 10bn World
Population
~1000 Exajoules energyconsumption per year~570 Exajoules energy
consumption per year
ALMOST DOUBLE WORLD ENERGY
USAGE
46% of the world’s population liveson less than $5.50/DAY
10% of the world’s population liveson less than $1.90/DAY
>25% of the world’s population liveson less than $3.20/DAY
Average current primary energy useGigajoules per person per year
300150100
Providing More and Better Energy
57 58
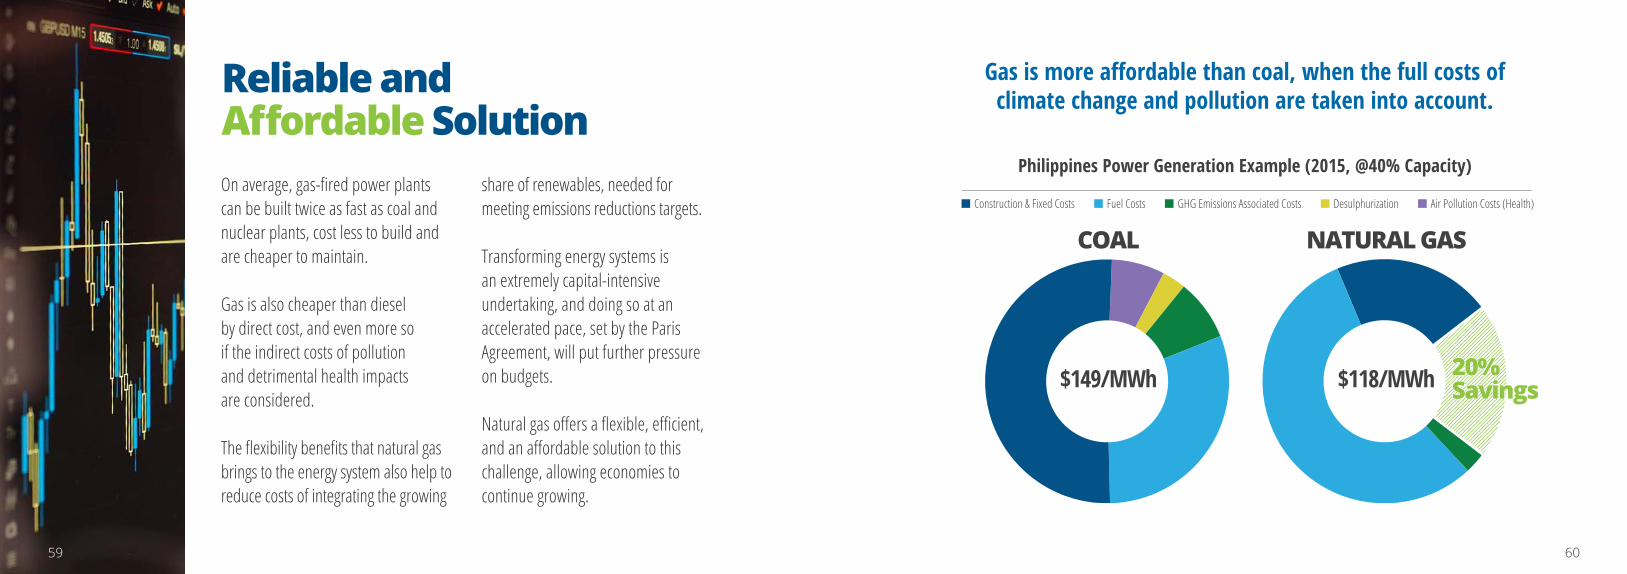
Reliable and Affordable Solution
Philippines Power Generation Example (2015, @40% Capacity)
$149/MWh $118/MWh
COAL NATURAL GAS
20%Savings20%Savings
Construction & Fixed Costs Fuel Costs GHG Emissions Associated Costs Desulphurization Air Pollution Costs (Health)
Gas is more affordable than coal, when the full costs of climate change and pollution are taken into account.
On average, gas-fired power plants can be built twice as fast as coal and nuclear plants, cost less to build and are cheaper to maintain.
Gas is also cheaper than diesel by direct cost, and even more so if the indirect costs of pollution and detrimental health impacts are considered.
The flexibility benefits that natural gas brings to the energy system also help to reduce costs of integrating the growing
share of renewables, needed for meeting emissions reductions targets.
Transforming energy systems is an extremely capital-intensive undertaking, and doing so at an accelerated pace, set by the Paris Agreement, will put further pressure on budgets.
Natural gas offers a flexible, efficient, and an affordable solution to this challenge, allowing economies to continue growing.
6059
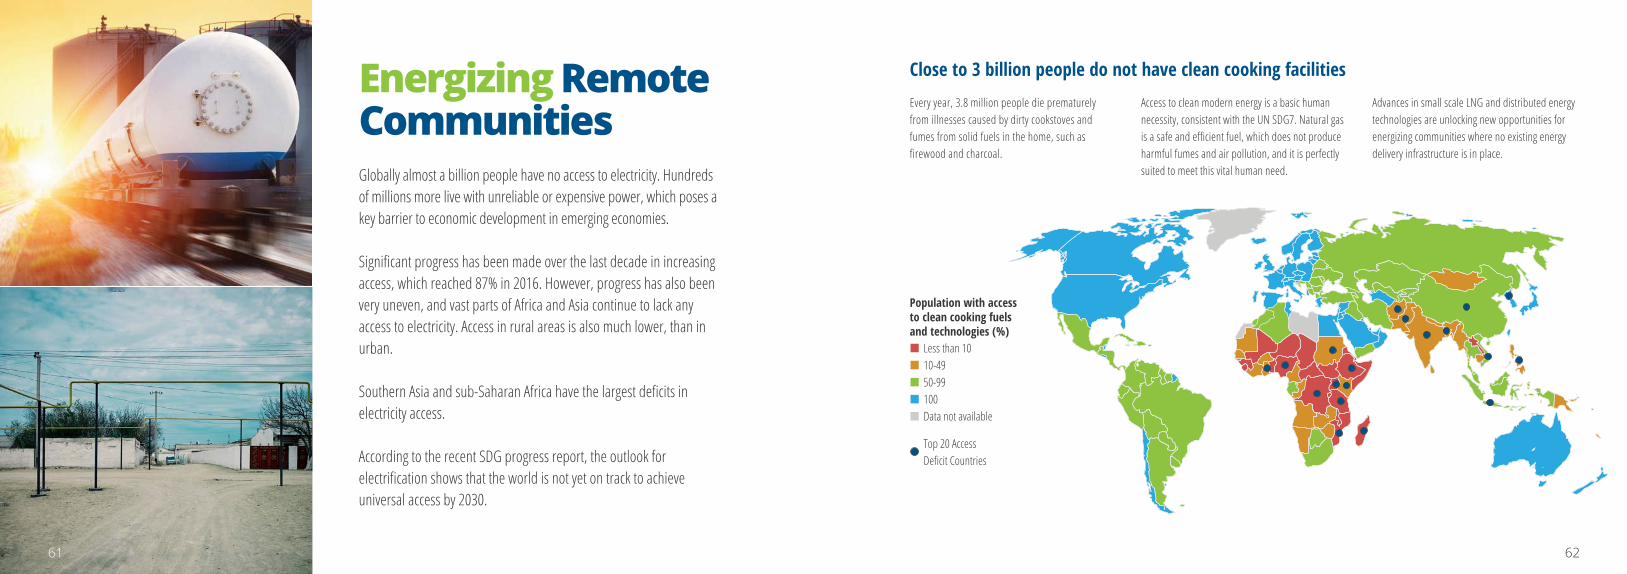
Close to 3 billion people do not have clean cooking facilitiesEvery year, 3.8 million people die prematurely from illnesses caused by dirty cookstoves and fumes from solid fuels in the home, such as firewood and charcoal.
Access to clean modern energy is a basic human necessity, consistent with the UN SDG7. Natural gas is a safe and efficient fuel, which does not produce harmful fumes and air pollution, and it is perfectly suited to meet this vital human need.
Advances in small scale LNG and distributed energy technologies are unlocking new opportunities for energizing communities where no existing energy delivery infrastructure is in place.
Less than 1010-4950-99100Data not available
Top 20 AccessDeficit Countries
Population with access to clean cooking fuels and technologies (%)
Energizing Remote CommunitiesGlobally almost a billion people have no access to electricity. Hundreds of millions more live with unreliable or expensive power, which poses a key barrier to economic development in emerging economies.
Significant progress has been made over the last decade in increasing access, which reached 87% in 2016. However, progress has also been very uneven, and vast parts of Africa and Asia continue to lack any access to electricity. Access in rural areas is also much lower, than in urban.
Southern Asia and sub-Saharan Africa have the largest deficits in electricity access.
According to the recent SDG progress report, the outlook for electrification shows that the world is not yet on track to achieve universal access by 2030.
6261
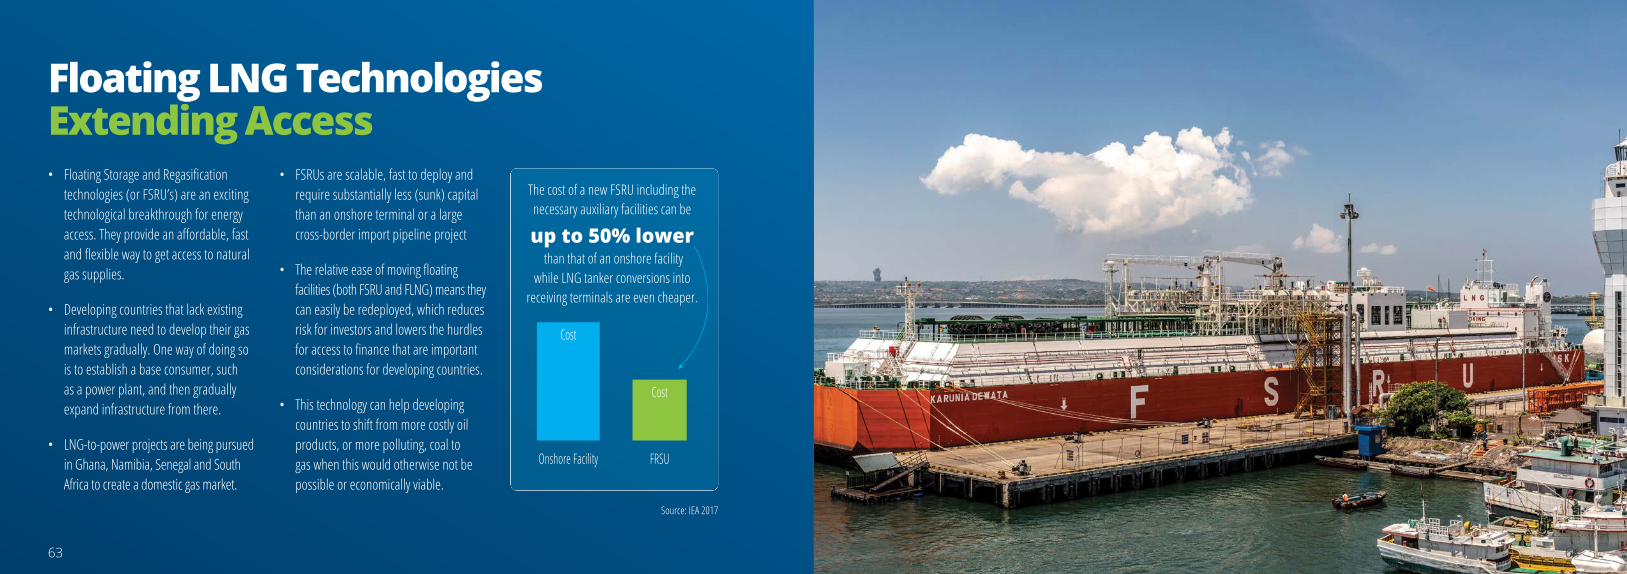
• Floating Storage and Regasification technologies (or FSRU’s) are an exciting technological breakthrough for energy access. They provide an affordable, fast and flexible way to get access to natural gas supplies.
• Developing countries that lack existing infrastructure need to develop their gas markets gradually. One way of doing so is to establish a base consumer, such as a power plant, and then gradually expand infrastructure from there.
• LNG-to-power projects are being pursued in Ghana, Namibia, Senegal and South Africa to create a domestic gas market.
• FSRUs are scalable, fast to deploy and require substantially less (sunk) capital than an onshore terminal or a large cross-border import pipeline project
• The relative ease of moving floating facilities (both FSRU and FLNG) means they can easily be redeployed, which reduces risk for investors and lowers the hurdles for access to finance that are important considerations for developing countries.
• This technology can help developing countries to shift from more costly oil products, or more polluting, coal to gas when this would otherwise not be possible or economically viable.
Floating LNG Technologies Extending Access
The cost of a new FSRU including the necessary auxiliary facilities can be
than that of an onshore facilitywhile LNG tanker conversions into
receiving terminals are even cheaper.
up to 50% lower
Onshore Facility
Cost
FRSU
Cost
Source: IEA 2017
6463
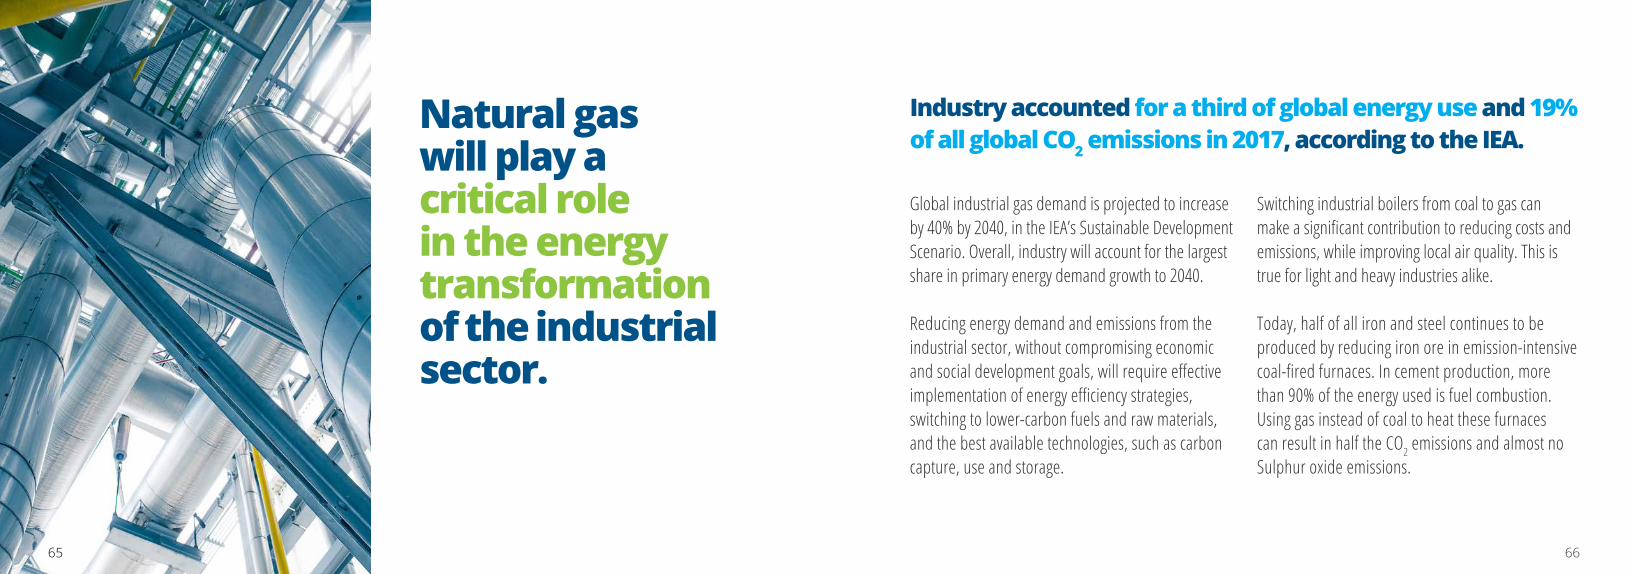
Global industrial gas demand is projected to increase by 40% by 2040, in the IEA’s Sustainable Development Scenario. Overall, industry will account for the largest share in primary energy demand growth to 2040.
Reducing energy demand and emissions from the industrial sector, without compromising economic and social development goals, will require effective implementation of energy efficiency strategies, switching to lower-carbon fuels and raw materials, and the best available technologies, such as carbon capture, use and storage.
Switching industrial boilers from coal to gas can make a significant contribution to reducing costs and emissions, while improving local air quality. This is true for light and heavy industries alike.
Today, half of all iron and steel continues to be produced by reducing iron ore in emission-intensive coal-fired furnaces. In cement production, more than 90% of the energy used is fuel combustion. Using gas instead of coal to heat these furnaces can result in half the CO2 emissions and almost no Sulphur oxide emissions.
Industry accounted for a third of global energy use and 19% of all global CO2 emissions in 2017, according to the IEA.
Natural gas will play a critical role in the energy transformation of the industrial sector.
6665
Natural Gas is Vitalfor a SecureSustainableEnergy Future
SE
CU
RE
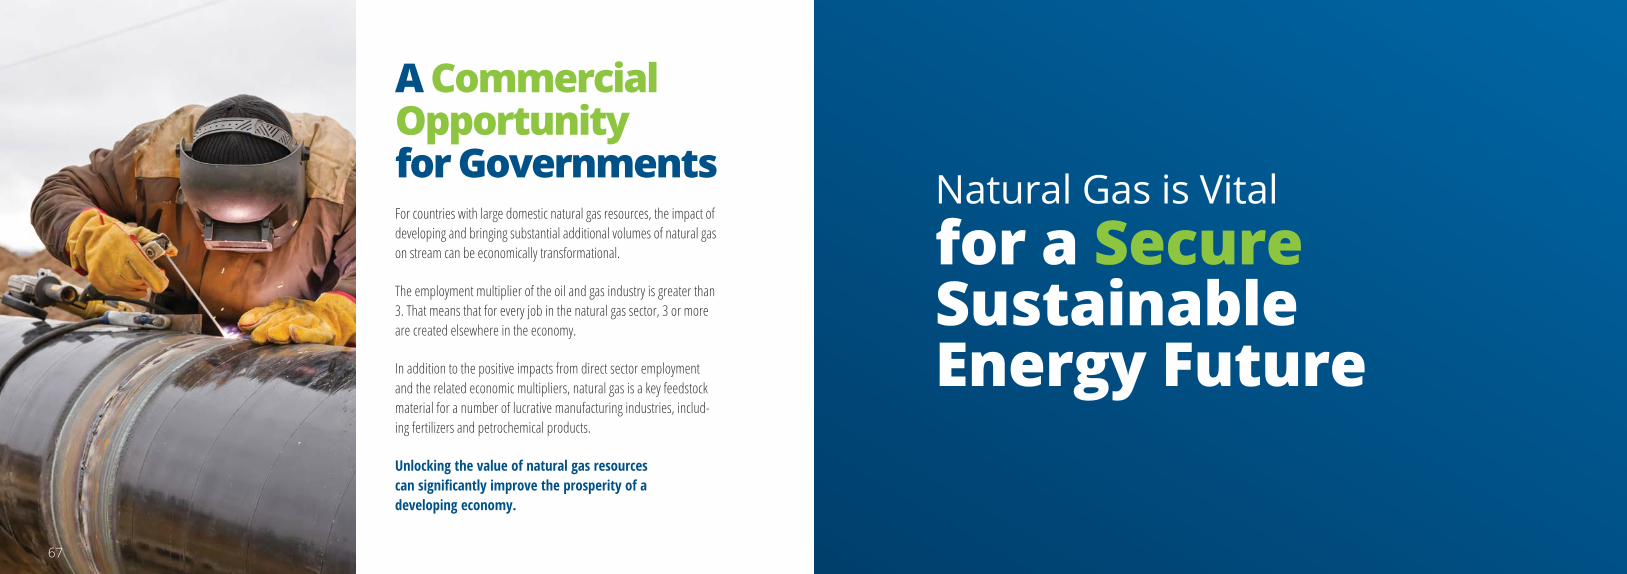
A Commercial Opportunity for GovernmentsFor countries with large domestic natural gas resources, the impact of developing and bringing substantial additional volumes of natural gas on stream can be economically transformational.
The employment multiplier of the oil and gas industry is greater than 3. That means that for every job in the natural gas sector, 3 or more are created elsewhere in the economy.
In addition to the positive impacts from direct sector employment and the related economic multipliers, natural gas is a key feedstock material for a number of lucrative manufacturing industries, includ-ing fertilizers and petrochemical products.
Unlocking the value of natural gas resources can significantly improve the prosperity of adeveloping economy.
67
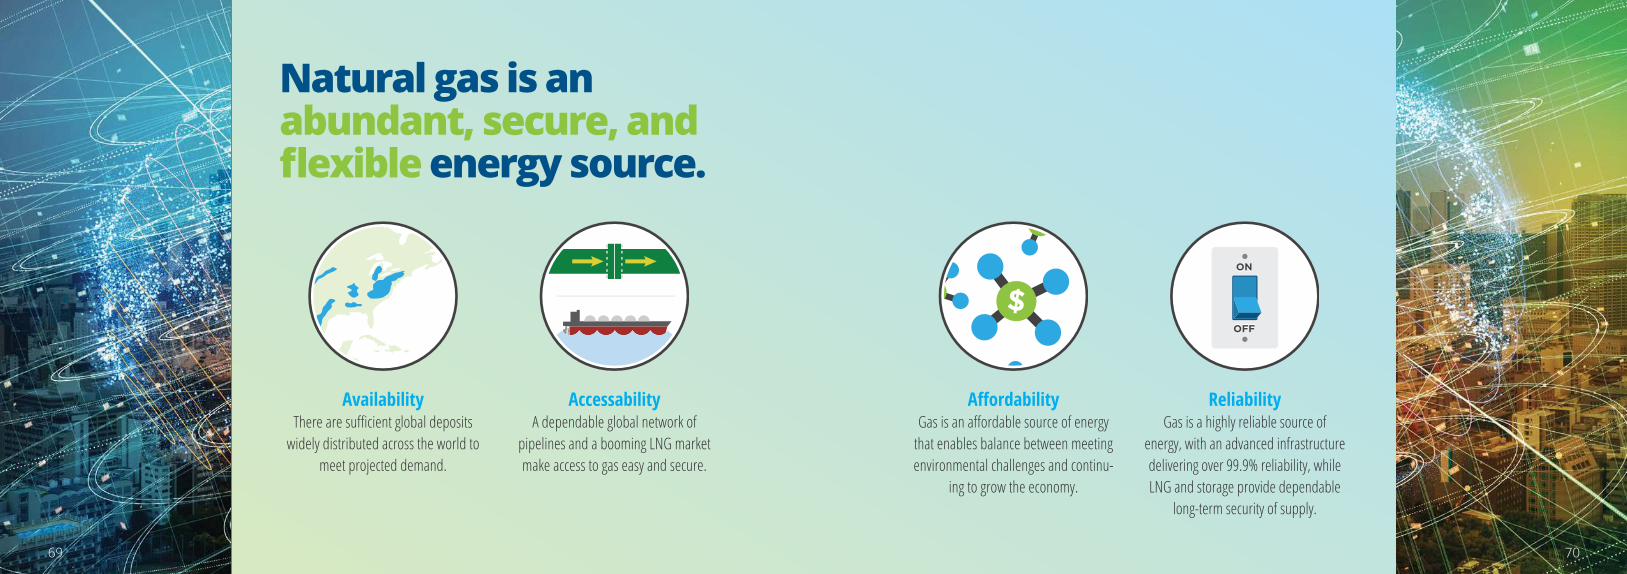
Natural gas is an abundant, secure, and flexible energy source.
69 7069
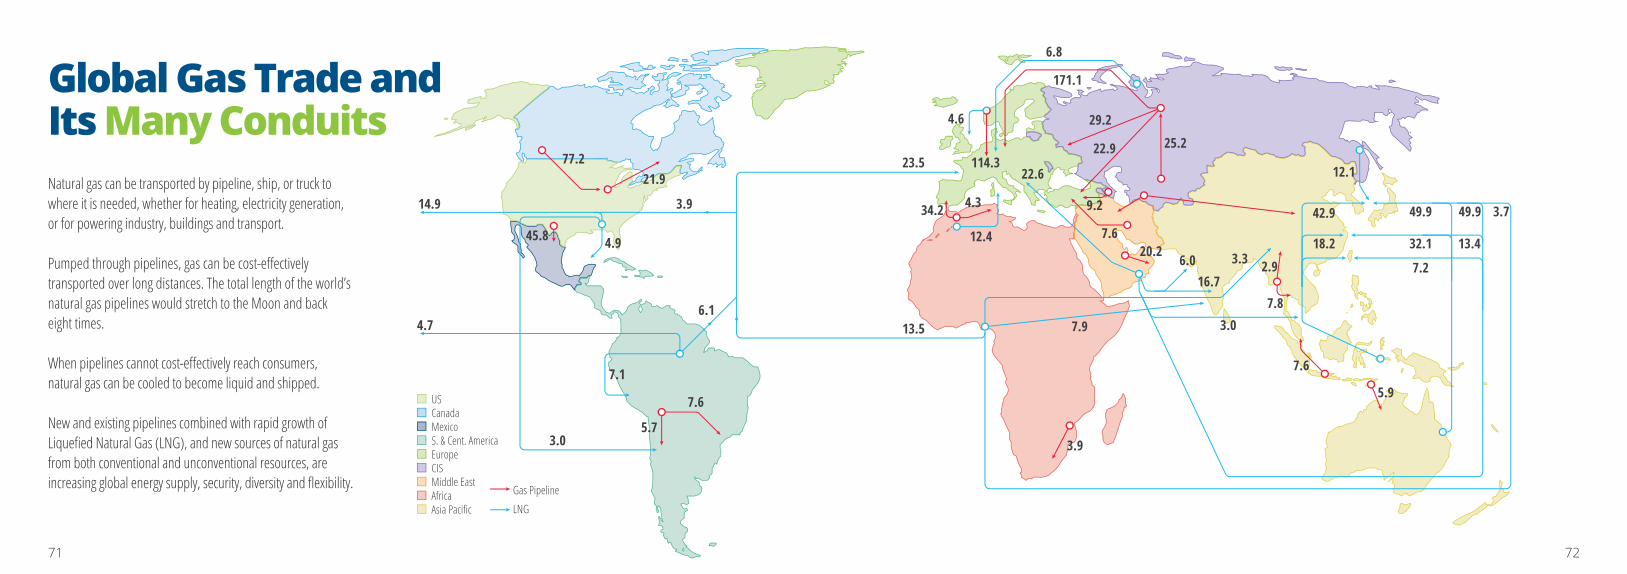
Natural gas can be transported by pipeline, ship, or truck to where it is needed, whether for heating, electricity generation, or for powering industry, buildings and transport.
Pumped through pipelines, gas can be cost-effectively transported over long distances. The total length of the world’s natural gas pipelines would stretch to the Moon and back eight times.
When pipelines cannot cost-effectively reach consumers, natural gas can be cooled to become liquid and shipped.
New and existing pipelines combined with rapid growth of Liquefied Natural Gas (LNG), and new sources of natural gas from both conventional and unconventional resources, are increasing global energy supply, security, diversity and flexibility.
Global Gas Trade and Its Many Conduits
3.914.9
4.945.8
4.7
3.0
7.1
6.113.5
23.5
12.4
4.334.2
4.6
114.3
6.8
171.1
29.2
22.9 25.2
9.2
7.620.2
22.6
7.9
6.016.7
3.3 2.9
7.83.0
7.6
5.9
3.9
7.2
32.1
49.9 49.9
13.418.2
42.9
12.1
3.7
77.221.9
7.6
5.7
USCanadaMexicoS. & Cent. AmericaEuropeCISMiddle EastAfricaAsia Pacific
Gas Pipeline
LNG
71 72
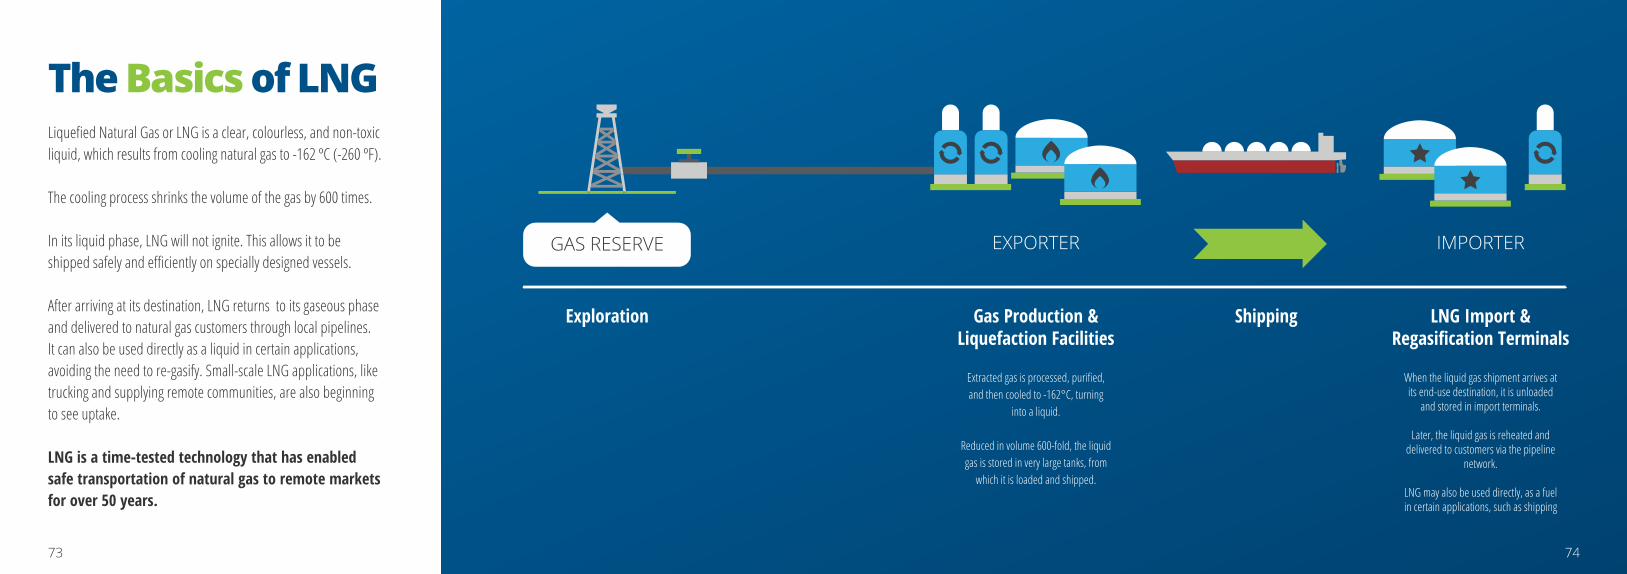
Liquefied Natural Gas or LNG is a clear, colourless, and non-toxic liquid, which results from cooling natural gas to -162 ºC (-260 ºF).
The cooling process shrinks the volume of the gas by 600 times.
In its liquid phase, LNG will not ignite. This allows it to be shipped safely and efficiently on specially designed vessels.
After arriving at its destination, LNG returns to its gaseous phase and delivered to natural gas customers through local pipelines. It can also be used directly as a liquid in certain applications, avoiding the need to re-gasify. Small-scale LNG applications, like trucking and supplying remote communities, are also beginning to see uptake.
LNG is a time-tested technology that has enabled safe transportation of natural gas to remote markets for over 50 years.
The Basics of LNG
Extracted gas is processed, purified,and then cooled to -162°C, turning
into a liquid.
Reduced in volume 600-fold, the liquidgas is stored in very large tanks, from
which it is loaded and shipped.
When the liquid gas shipment arrives atits end-use destination, it is unloaded
and stored in import terminals.
Later, the liquid gas is reheated anddelivered to customers via the pipeline
network.
LNG may also be used directly, as a fuelin certain applications, such as shipping
Exploration
GAS RESERVE
Gas Production &Liquefaction Facilities
Shipping LNG Import &Regasification Terminals
EXPORTER IMPORTER
73 74

The flexibility value of LNG is increasing market liquidity and enhancing security of supply.
Technology cost reductions and unlocking of new supplies resulted in a tremendous growth in the global LNG market, tripling in size since 2000.
Today, LNG already accounts for over 10% of total global gas supply, and this share will continue to increase, providing secure and flexible energy. A third of that trade was on a non-long-term contract basis in 2018.
The LNG market will continue to flourish with increasing dynamism, and a growing number, diversity, and size of players.
LNG Bridges the Distance between Supply and Demand
1990 1994 1998 2002 2006 2010 2014 2018
MTP
A
1000
800
600
400
200
0
No. o
f Cou
ntries
50
40
30
20
10
0
Global Regasification Capacity
Total Volumes of LNG Trade
No. of LNG Exporting Countries (right axis)
No. of LNG Importing Countries (right axis)
European LNG Imports:50 MT (+3.4 MT)
Middle EastQatar 25% oftotal global exports
Australia22% of totalglobal exports
U.S. second largestincremental exportsin 2018: +8.2MT
Asia leads demandgrowth and reached 27%of global tradeChina +15.8 MTS. Korea +6.4 MT
2 New countries beganimporting LNG in 2018:Bangladesh and Panama
Asia-Pacific imports38.4% of global exportsJapan: 83.2 MTS. Korea: 44.5
Russia +7.8 MT
Cameroon joined theexporters club via FLNG
Key Trends from 2018
75 76
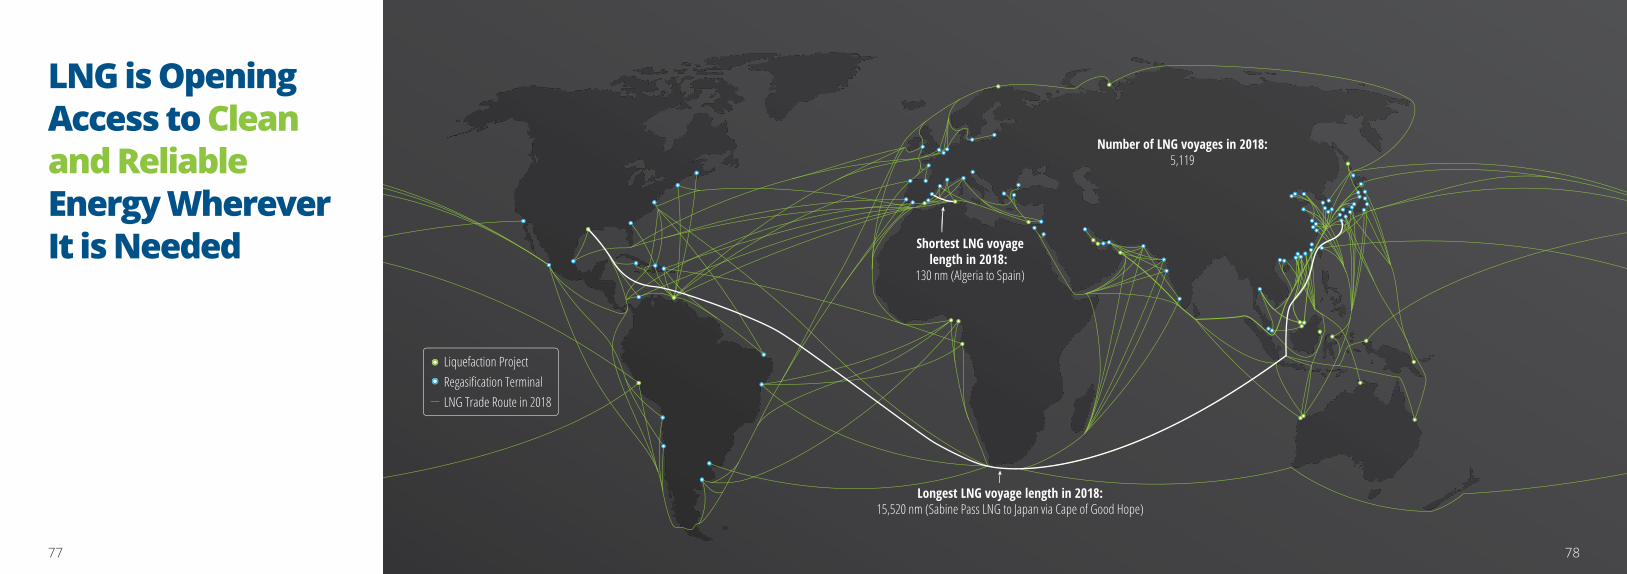
Shortest LNG voyagelength in 2018:
130 nm (Algeria to Spain)
Number of LNG voyages in 2018:5,119
Longest LNG voyage length in 2018:15,520 nm (Sabine Pass LNG to Japan via Cape of Good Hope)
Liquefaction ProjectRegasification TerminalLNG Trade Route in 2018
LNG is Opening Access to Clean and Reliable Energy Wherever It is Needed
77 78
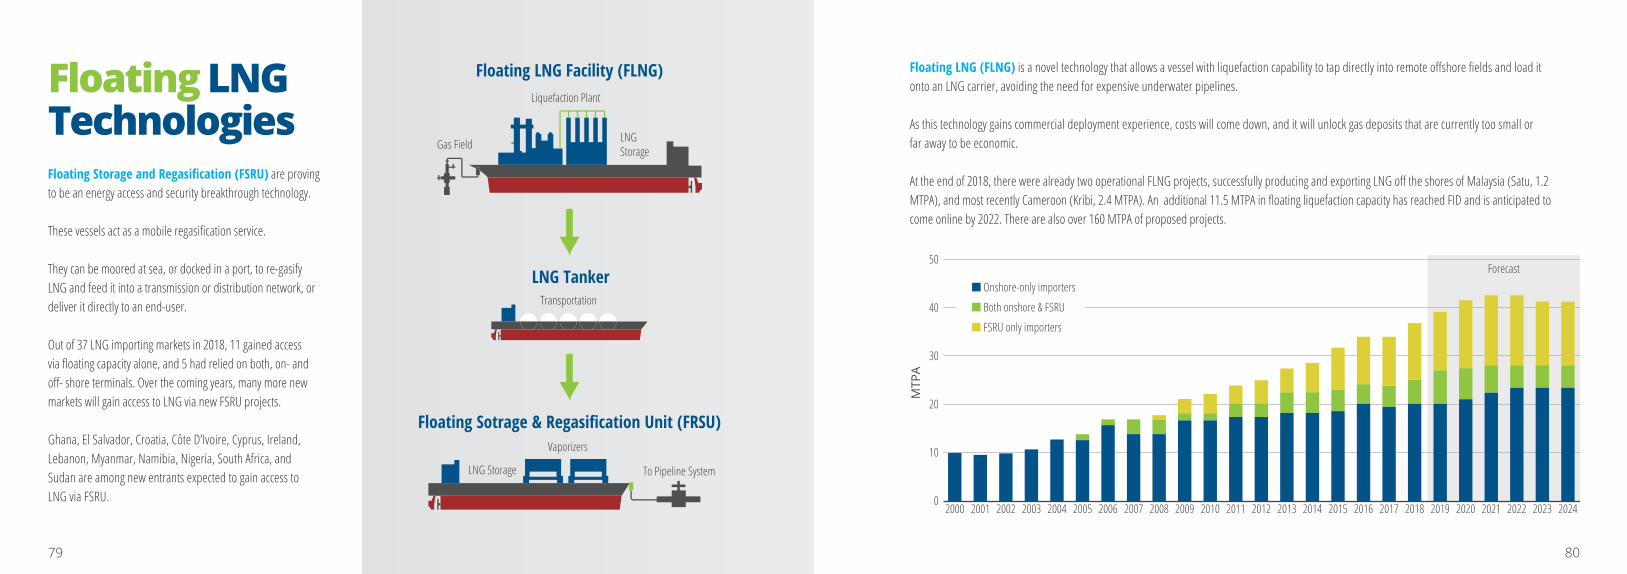
Floating LNG (FLNG) is a novel technology that allows a vessel with liquefaction capability to tap directly into remote offshore fields and load itonto an LNG carrier, avoiding the need for expensive underwater pipelines.
As this technology gains commercial deployment experience, costs will come down, and it will unlock gas deposits that are currently too small orfar away to be economic.
At the end of 2018, there were already two operational FLNG projects, successfully producing and exporting LNG off the shores of Malaysia (Satu, 1.2 MTPA), and most recently Cameroon (Kribi, 2.4 MTPA). An additional 11.5 MTPA in floating liquefaction capacity has reached FID and is anticipated tocome online by 2022. There are also over 160 MTPA of proposed projects.
Floating Storage and Regasification (FSRU) are proving to be an energy access and security breakthrough technology.
These vessels act as a mobile regasification service.
They can be moored at sea, or docked in a port, to re-gasify LNG and feed it into a transmission or distribution network, or deliver it directly to an end-user.
Out of 37 LNG importing markets in 2018, 11 gained access via floating capacity alone, and 5 had relied on both, on- and off- shore terminals. Over the coming years, many more new markets will gain access to LNG via new FSRU projects.
Ghana, El Salvador, Croatia, Côte D’Ivoire, Cyprus, Ireland, Lebanon, Myanmar, Namibia, Nigeria, South Africa, and Sudan are among new entrants expected to gain access to LNG via FSRU.
Floating LNGTechnologies
Floating LNG Facility (FLNG)
Gas Field
Liquefaction Plant
LNGStorage
LNG TankerTransportation
Floating Sotrage & Regasification Unit (FRSU)
LNG Storage
Vaporizers
To Pipeline System
Onshore-only importers
Both onshore & FSRU
FSRU only importers
MTP
A
50
40
Forecast
30
20
10
02000 2001 2002 2003 2005 2007 2009 2011 2013 2015 2017 20192004 2006 2008 2010 2012 2014 2016 2018 2020 2021 2022 2023 2024
79 80
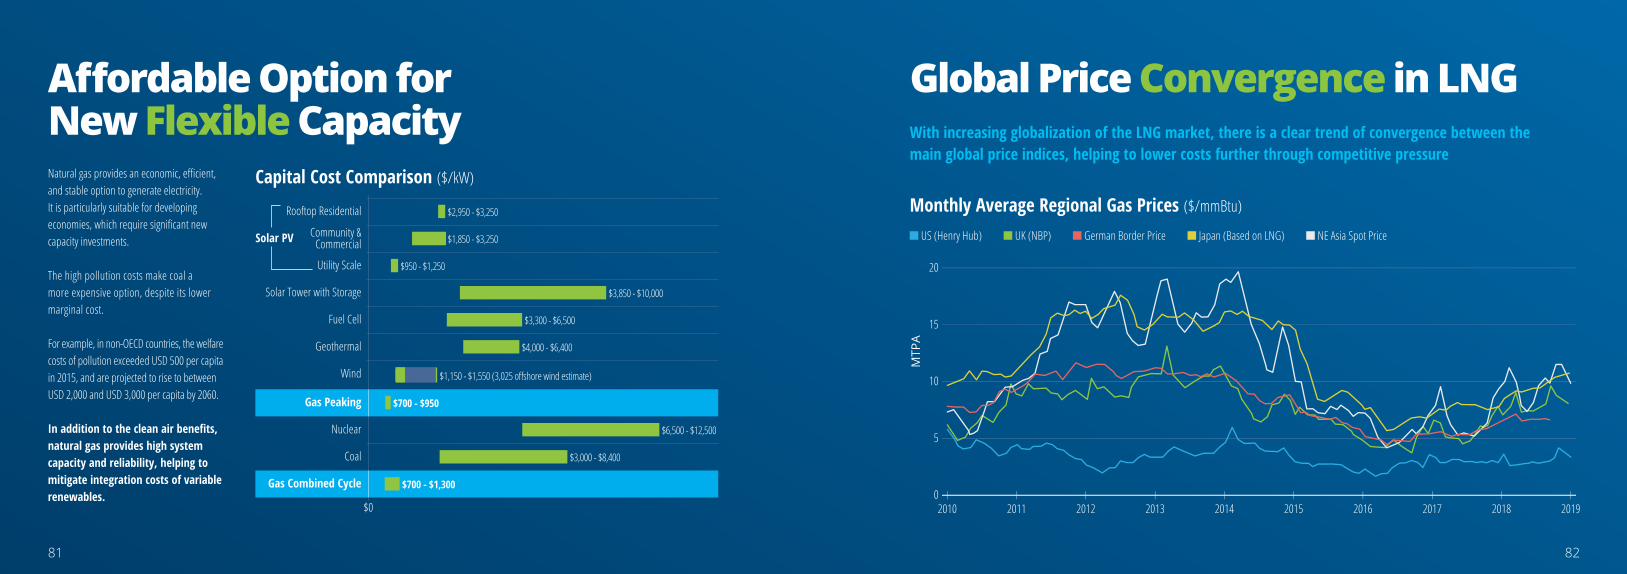
Natural gas provides an economic, efficient, and stable option to generate electricity. It is particularly suitable for developing economies, which require significant new capacity investments.
The high pollution costs make coal a more expensive option, despite its lower marginal cost.
For example, in non-OECD countries, the welfare costs of pollution exceeded USD 500 per capita in 2015, and are projected to rise to between USD 2,000 and USD 3,000 per capita by 2060.
In addition to the clean air benefits, natural gas provides high system capacity and reliability, helping to mitigate integration costs of variable renewables.
With increasing globalization of the LNG market, there is a clear trend of convergence between the main global price indices, helping to lower costs further through competitive pressure
Community &Commercial
Capital Cost Comparison ($/kW)
$2,950 - $3,250Rooftop Residential
$1,850 - $3,250
$950 - $1,250Utility Scale
$3,850 - $10,000Solar Tower with Storage
$3,300 - $6,500Fuel Cell
$4,000 - $6,400Geothermal
$700 - $950Gas Peaking
$6,500 - $12,500Nuclear
$3,000 - $8,400Coal
$700 - $1,300Gas Combined Cycle
$0
Solar PV
Wind $1,150 - $1,550 (3,025 offshore wind estimate)
Global Price Convergence in LNG
US (Henry Hub) UK (NBP) German Border Price Japan (Based on LNG) NE Asia Spot Price
Monthly Average Regional Gas Prices ($/mmBtu)
MTP
A
20
15
10
5
02010 2011 2012 2013 2014 2015 2016 2017 2018 2019
Affordable Option for New Flexible Capacity
81 82
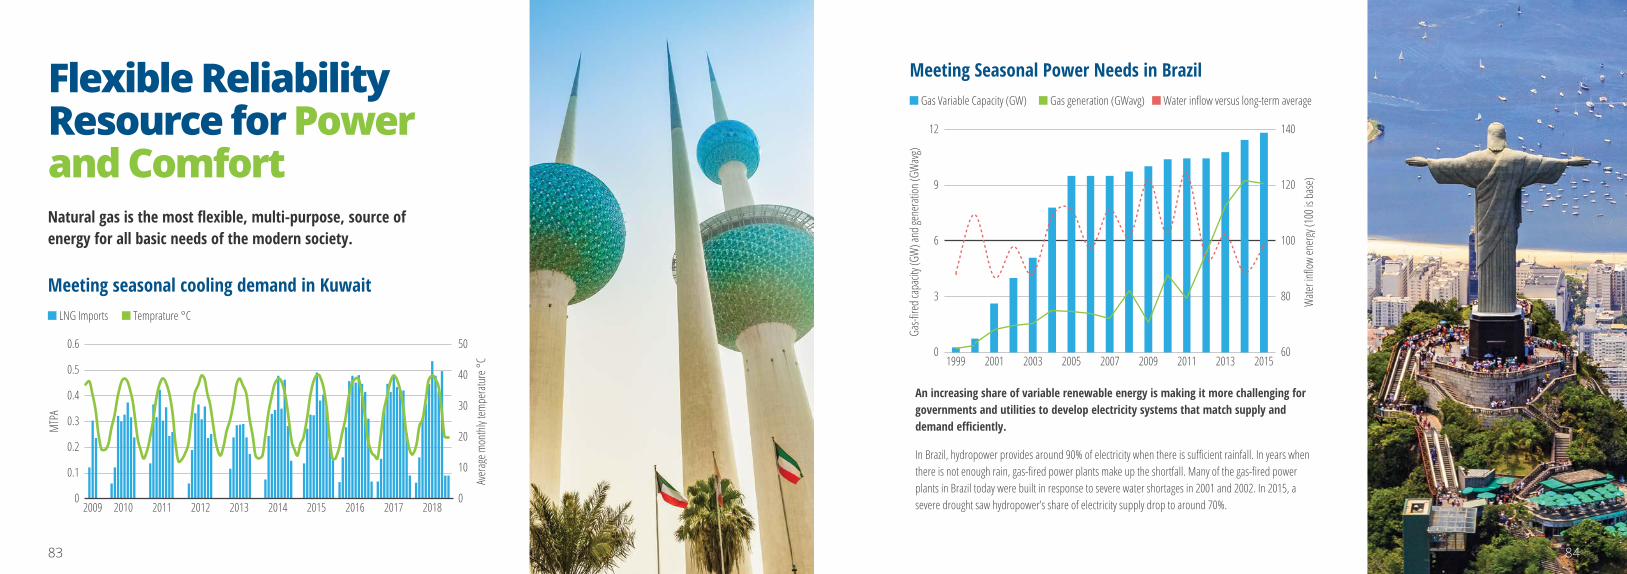
Flexible Reliability Resource for Power and ComfortNatural gas is the most flexible, multi-purpose, source ofenergy for all basic needs of the modern society.
LNG Imports Temprature °C
MTP
A
0.6
0.4
0.5
0.3
0.2
0.1
0
Meeting seasonal cooling demand in Kuwait
Aver
age m
onthl
y tem
pera
ture °
C
50
40
30
20
10
02009 2011 2013 2015 20172010 2012 2014 2016 2018
Gas Variable Capacity (GW) Gas generation (GWavg) Water inflow versus long-term average
Meeting Seasonal Power Needs in Brazil
12
9
6
3
0
140
120
100
80
601999 2001 2003 2005 2007 2009 2011 2013 2015
An increasing share of variable renewable energy is making it more challenging for governments and utilities to develop electricity systems that match supply and demand efficiently.
In Brazil, hydropower provides around 90% of electricity when there is sufficient rainfall. In years when there is not enough rain, gas-fired power plants make up the shortfall. Many of the gas-fired power plants in Brazil today were built in response to severe water shortages in 2001 and 2002. In 2015, a severe drought saw hydropower’s share of electricity supply drop to around 70%.
Gas-fi
red c
apac
ity (G
W) a
nd ge
nera
tion (
GWav
g)
Wate
r infl
ow en
ergy
(100
is ba
se)
83 84
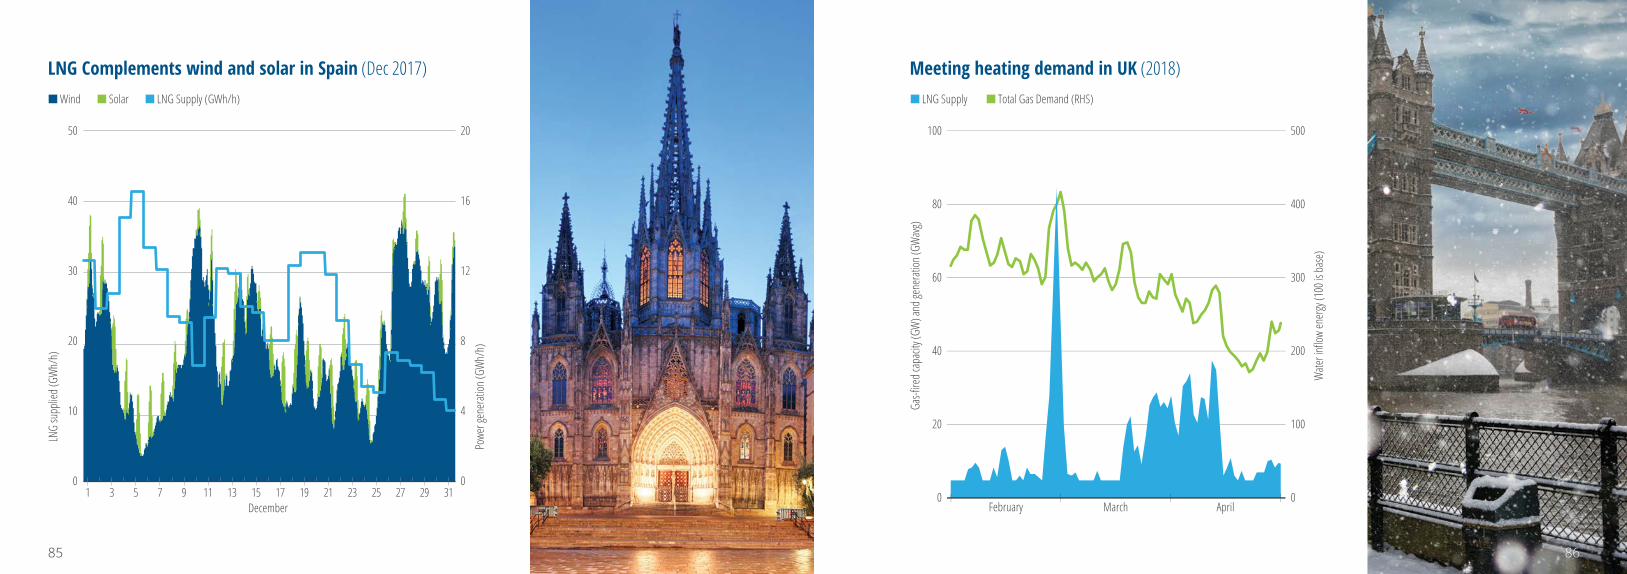
LNG Complements wind and solar in Spain (Dec 2017) Meeting heating demand in UK (2018)
Gas-fi
red c
apac
ity (G
W) a
nd ge
nera
tion (
GWav
g)
Wate
r infl
ow en
ergy
(100
is ba
se)
LNG Supply Total Gas Demand (RHS)
80
60
40
20
400
300
200
100
February March April
100 500
0 0
50 20
40 16
30 12
20 8
10 4
0
December1 3 5 7 9 11 13 15 17 19 21 23 25 27 29 31
0
LNG
supp
lied (
GWh/
h)
Powe
r gen
erati
on (G
Wh/
h)
Wind Solar LNG Supply (GWh/h)
85 86
ReferencesPages 3-4 BP Energy Outlook, 2019
Page 5 BCG, IGU, Snam, Global Gas Report, 2018
Page 10 Emissions data compiled from DOE, EIA, and Shell
Page 11 Information from the World Health Organisation (https://www.who.int/airpollution/en)
Page 12 US Environmental Protection Agency (https://www.epa.gov/pm-pollution/particulate-matter-pm-basics)
Page 35 ThinkStep, 2017; Royal Dutch Shell, Natural Gas, Providing More and Cleaner Energy
Page 37 M. Saunois et al., 2016. The Global Methane Budget 2000-2012. Earth System Science Data.
Pages 39-40 M. Saunois et al, 2016; IEA World Energy Outlook, 2017
Page 41 IEA World Energy Outlook, 2017
Pages 13-14 IGU Clean Air Report 2015; IGU Clean Air Report 2018
Page 15 IGDAS 2015 Annual Report
Page 16 Shell LNG Outlook, 2019
Pages 17-18 OECD, The Economic Consequences of Outdoor Pollution, 2016
Page 22 Infographic courtesy of Woodside Energy
Pages 51-52 UN Sustainable Development Goals Knowledge Platform (https://sustainabledevelopment.un.org)
Page 54 Ibid
Pages 57-58 Adapted from Shell; Poverty figures from the World Bank, 2018
Page 60 Royal Sutch Shell, based on 2015 IHS analysis
Page 23 IEA, 2019. (https://www.iea.org/topics/carbon-capture-and-storage)
Page 24 Infographic courtesy of Royal Dutch Shell
Pages 25-26 Royal Dutch Shell, Natural Gas, Providing More and Cleaner Energy, 2017
Page 27 Graphic courtesy of the American Gas Association (AGA)
Page 28 AGA, 2019
Pages 61-62 Tracking SDG 7. Energy Progress Report. 2019. Joint Report by IEA, IRENA, UNSD, WBG, WHO
Page 63 IEA, 2017 World Energy Outlook, p. 358
Page 66 IEA World Energy Outlook, 2018; Royal Dutch Shell, 2017.
Page 67 AGA
Pages 71-72 Graphic adapted from BP, Statistical Review of World Energy, 2019
Pages 29-30 Graphic courtesy of AGA
Page 32 See NGVA Europe, ThinkStep Natural Gas Greenhouse Gas Intensity Study, 2017
Page 33 LNG-powered Aida Cruise Ship
Page 34 S Bengtsson et al, Emissions Data: A comparative life-cycle assessment of marine fuels - liquefied natural gas and three other fossil fuels report, 2011
Pages 75-76 IGU World LNG Report, 2019
Pages 77-78 Ibid.
Pages 79-80 IEA, 2017; IGU World LNG Report, 2019
Page 81 Lazard’s Levelized Cost of Energy Analysis, 2018
Page 82 IGU World LNG Report, 2019
Pages 83-86 Adapted from Royal Dutch Shell LNG Outlook, 2019
8887
The International Gas Union (IGU) was founded in 1931. It is a worldwide non-profi t organisation registered in Vevey, Switzerland with the Secretariat currently located in Barcelona, Spain.
The mission of the IGU is to promote the political, technical and economic progress of the global gas industry. The IGU seeks to improve the competitiveness of gas in the world energy markets by promoting transparency, public acceptance eff orts, and the removal of supply and market access barriers.
The IGU also seeks to collaborate with governmental agencies and multilateral organizations to demonstrate the economic, social, and environmental benefi ts of gas in the global energy mix.
More than 150 IGU members are associations and corporations representing over 95% of the global natural gas market. IGU covers the entire natural gas value chain, from exploration and production, to transmission via pipelines and liquefi ed natural gas (LNG), through to distribution and combustion at the point of use.
igu.org