from natural resource boom to sustainable economic … · from natural resource boom to sustainable...
TRANSCRIPT

WP/15/90
From Natural Resource Boom to Sustainable Economic Growth: Lessons for Mongolia
by Pranav Gupta, Bin Grace Li, and Jiangyan Yu
© 2015 International Monetary Fund WP/15/90
IMF Working Paper
Research Department, Strategy, Policy, and Review Department, and
Asia and Pacific Department
From Natural Resource Boom to Sustainable Economic Growth: Lessons for Mongolia*
Prepared by Pranav Gupta, Bin Grace Li, and Jiangyan Yu
Authorized for distribution by Andrew Berg, Catherine Pattillo, and Koshy Mathai
April 2015
Abstract
Some resource-rich developing countries are in the process of harnessing immense mining
resources towards inclusive growth and prosperity. Nevertheless, tapping into natural
resources could be challenging given the large front-loaded investment, volatile capital
flows and exposure to global commodity markets. Public investment is needed to remove
the often-large infrastructure gap and unlock the economic potential. However, too rapid
fiscal outlays could push the economy to its limit of absorptive capacity and increase
macro-financial vulnerabilities. This paper utilizes a structural model-based approach to
analyze macroeconomic impacts of different public investment strategies on key fiscal and
non-fiscal variables such as debt, consumption, sovereign wealth fund, and real exchange
rates. We apply the model to Mongolia and draw policy recommendations from the
analysis. We find that fiscal policy adjustment, particularly moderating infrastructure
investment and optimizing investment efficiency is needed to maintain macroeconomic
and external stability, as well as to boost the long-term sustainable growth for Mongolia.
JEL Classification Numbers: E62; F34; Q32
Keywords: Natural resources management; Debt sustainability; Public investment
Author’s E-Mail Address: [email protected]; [email protected]; [email protected]
* We are grateful to Andy Berg, Koshy Mathai, Cathy Pattillo, Markus Rodlauer, Susan Yang, Felipe Zanna and
seminar participants at the IMF, the Central Bank and the Ministry of Finance of Mongolia for comments and
suggestions. This working paper is part of a research project on macroeconomic policy in low-income countries
supported by U.K.’s Department for International Development. The views expressed in this Working Paper are
those of the author(s) and do not necessarily represent those of the IMF, IMF policy, or of DFID.
This Working Paper should not be reported as representing the views of the IMF or DFID.
The views expressed in this Working Paper are those of the authors and do not necessarily
represent those of the IMF, IMF policy, or DFID. Working Papers describe research in progress
by the authors and are published to elicit comments and to further debate.

Contents Page
I. Introduction ......................................................................................................................... 3
II. Country Background ........................................................................................................... 4
III. A Model-Based Analysis of Mongolia’s Natural Resource Revenues ............................... 7
A. Model ........................................................................................................................ 7
B. Calibration: Applying to Mongolia .........................................................................16
C. Assumptions: Natural Resource Revenue and Investment Paths ............................17
D. Efficiency and Absorptive Capacity .......................................................................18
IV. Simulation Results and Policy Implication .......................................................................21
A. Baseline Scenario ....................................................................................................21
Figure 1. Assumptions: Resource Output and Public Investment Paths ...........20
Figure 2. Projection of Public Debt and Sovereign Welfare Fund ...................22
Figure 3. Paths of Other Variables ....................................................................23
B. Adverse Scenario: Negative Resource Shock .........................................................25
Figure 4. Robustness Check: Different Efficiency ...........................................25
C. Robustness Check ...................................................................................................26
V. Conclusions .......................................................................................................................26
VI. Appendix ...........................................................................................................................28
Table 1. Calibration of Key Parameters ..........................................................................28
VII. References .........................................................................................................................29

3
I. INTRODUCTION
For resource-rich developing countries, resource wealth offers major opportunities to
accelerate economic development and raise living standards. However, resource-rich
developing countries also face the challenges of achieving sustained growth, while avoiding
boom-bust cycles that stem from volatility, and sometimes exhaustibility in natural resource
revenues. Meanwhile, these countries often suffer from the lack of access to international
capital markets and domestic capital scarcity. Resource exhaustibility gives rise to inter-
temporal decisions of how much of the resource wealth to consume and how much to save,
and revenue volatility calls for appropriate fiscal rules and precautionary savings to prevent
expenditure volatility and procyclicality. (see IMF, 2012, Collier et al, 2010, Sachs and
Warner, 1995, van der Ploeg, 2011 and van der Ploeg and Venables, 2011) .
The objective of this paper is to assess macroeconomic developments, e.g. growth and debt
sustainability, under different public investment strategies, for a natural resource-rich
developing country – Mongolia, and presents relevant considerations for the policymakers.
Notably leveraging natural resources wealth for Mongolia has also encountered opportunities
and challenges. It has been a long term goal for the authorities of Mongolia to well manage
the natural resource revenues, speed up development and diversify the economy. This paper
utilizes a structural model-based approach to analyze macroeconomic implications of
alternative scenarios of public investment for Mongolia and presents its policy implications.
In this paper, we use Mongolia as an example to shed lights on the issues for many natural
resource rich developing countries in a general perspective. We assess the growth and debt
sustainability of the economy under alternative public investment path and different
commodity price and production trajectories. Especially, we introduce the features such as
physical capital scarcity and limited absorptive capacity to these countries, which usually
pose common policy challenges in defining the balance between scaling up investment and
safeguarding debt sustainability and macroeconomic stability.
We first present the country background of Mongolia, and its current development condition.
Then we analyze the dynamics of key macroeconomic variables under different public
investment paths. In particular, we compare the results of an aggressive investment path and
a smoothed path with fiscal consolidation. The aggressive investment path maintains
aggressive status-quo investment levels to develop infrastructure and boost growth at the cost
of higher deficit and public debt. Under a fiscal consolidation path, the government instead
restrains public investment so as to improve debt sustainability and avoid economic
overheating. Our results show that front-loaded fiscal consolidation is needed alongside a
comprehensive approach to enhance absorptive capacity, manage natural resources wealth in
a way to avoid the Dutch disease, and sustain the longer-term diversification of growth.
While the ambitious scaling up of public investment can generate higher nonmineral growth,
it can also pose substantial challenges to debt sustainability and macroeconomic stability.

4
Furthermore, we also find out that, without fiscal consolidation, when natural resource
revenues reduced owing to an adverse commodity price and production shock, public debt
would grow exponentially and become unsustainable in our simulation.
The paper is organized as follows: Section II discusses Mongolia’s economic background.
Section III described the model and the key assumptions that we used for the assessment.
Section IV presents the results derived from the analysis for alternative scenarios, and
explains the policy implications. Section V summarizes the main findings and concludes.
II. COUNTRY BACKGROUND
Natural Resource Sector: Mongolia embraces huge mineral resource wealth estimated at
US$1-3 trillion, with coal, copper, and gold being the principal reserves. Mongolia hosts 10%
of the world's known coal reserves, and the Tavan Tolgoi coal mine (TT) is one of the
world’s largest untapped coking and thermal coal deposits.
In 2009, the government established a joint venture with Turquoise Hill Resources (a
majority owned subsidiary of Rio Tinto) to develop the Oyu Tolgoi copper and gold deposit
(OT), which is the biggest foreign-investment project ever in Mongolia and has attracted
more than $6 billion (50 percent of GDP) in FDI for the first phase development (OT-1)with
another $5 billion in the pipeline for the second phase (OT-2). OT-1, which exploits the open
pit of the deposit, has completed construction and started commercial production in 2013.
Nevertheless, the second phase, which exploits the underground deposit and appears crucial
to recover the cost of the project, has been stalled by disputes between Mongolian
government and Rio Tinto. OT-2 at best could start production only from 2020 onwards
should the dispute be solved soon.
Growth and Outlook: On the back of large stock of resources and immense FDI inflows to
the mining sector, Mongolia has been one of the fastest growing economies in the past
decade. Real GDP growth averaged 9 percent over the past decade, and per capita income
has more than quadrupled, to more than $4,000. Mining accounts directly for 20 percent of
the economy, while the total share, including indirect impacts, is likely much higher—
mineral exports account for over 40 percent of GDP.
Notwithstanding promising long-term prospects, managing the resource boom could be
challenging in the near term. It is expected that over time the country is going to generate a
large stream of resource earnings, accumulate its sovereign wealth fund, and move solidly
into the upper-middle income range. But for any of that to happen, Mongolia must maintain
macro-financial stability and cast a sustainable policy path. Nevertheless, Mongolia’s narrow
economic base has left the country highly vulnerable to external shocks—minerals account
for 90 percent of all exports, and 90 percent of these are bound for China. This lack of

5
diversification has made the economy prone to repeated boom-bust cycles—the latest
balance-of-payments crisis took place in 2009, and renewed shocks to FDI and coal exports
against the backdrop of loose macro policies have led to sharp reserve losses and exchange
rate depreciation since early 2013.
Debt Sustainability: The Fiscal Stability Law (FSL) provides an extremely useful
framework for governing fiscal policy, but the presence of substantial off-budget spending
makes the FSL incomplete. The FSL, which absorbs successful experiences of a few
resource-rich countries, stipulates that the structural fiscal deficit should be kept below 2
percent of GDP. Nevertheless, the Development Bank of Mongolia (DBM) was established
in 2012 and has since served virtually as a vehicle of off-budget capital spending. As a
consequence, although on-budget deficit has been kept within 2 percent of GDP in line with
the FSL, large off-budget spending pushed the consolidated deficit to around 10 percent of
GDP in 2012 and 2013; and public debt has surged dramatically from below 40 percent of
GDP in 2011 to more than 60 percent of GDP in end-2013.
Meanwhile, investment efficiency is worrisome. Public investment suffers from weak project
selection and implementation, inadequate coordination between government agencies, and
excessive power of the parliament to insert poorly designed projects in the capital budget.
Moreover, lack of transparency and capacity in public procurement, and politically motivated
contracts also result in a low efficiency of infrastructure projects.2 World Bank (2013) report
highlights poor project selection and weak government policies in Mongolia as major
impediments to public investment efficiency in recent years.
A sovereign wealth fund (SWF) can be an integral part of a coherent fiscal framework, but
achieving its goals requires strong discipline. A legal framework for the SWF is being
developed, where authorities expect to start depositing a large share of mineral revenue into
the SWF from 2018 and refrain from drawing down the fund in the next few decades—after
that the drawing of SWF would be targeted to support social spending and capacity building.
The SWF could provide a useful vehicle to save mineral revenues for the future. However, if
the large fiscal deficit persists, building up SWF could be achieved only via borrowing rather
than saving, which is not an appropriate strategy. Going forward, with the fiscal policy fully
complying with the FSL or even running a surplus, there would be conditions to build up
savings under the SWF framework.
Clearly, the key to achieving fiscal sustainability is to make the fiscal policy fully comply
with the FSL. The consolidated fiscal balance should aim for a deficit of 2 percent of GDP as
prescribed by the FSL in the near term, and over time should target a surplus in favor of
accumulating savings under the SWF framework. Rather than following an aggressive
2 See World Bank (2013).
6
investment strategy, a moderate path of public investment appears appropriate as it would
allow the authorities to gradually build up capacity and refrain from wasting resources as
investment capacity is overly stretched.
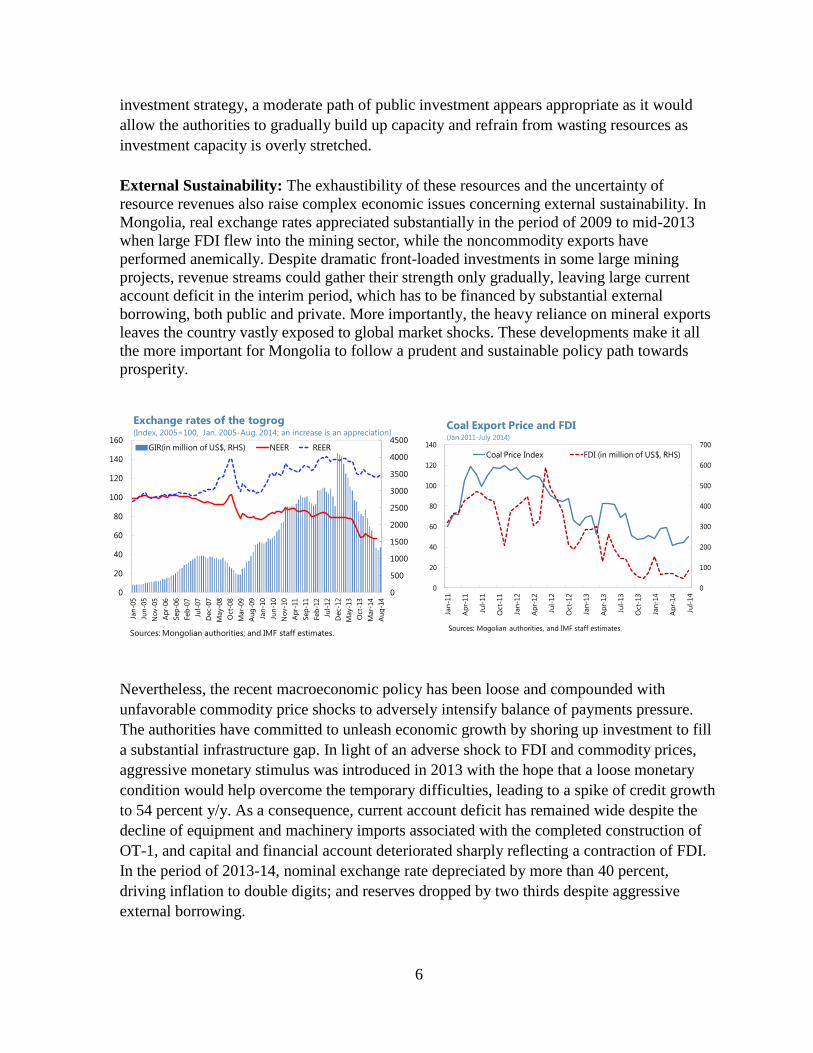
External Sustainability: The exhaustibility of these resources and the uncertainty of
resource revenues also raise complex economic issues concerning external sustainability. In
Mongolia, real exchange rates appreciated substantially in the period of 2009 to mid-2013
when large FDI flew into the mining sector, while the noncommodity exports have
performed anemically. Despite dramatic front-loaded investments in some large mining
projects, revenue streams could gather their strength only gradually, leaving large current
account deficit in the interim period, which has to be financed by substantial external
borrowing, both public and private. More importantly, the heavy reliance on mineral exports
leaves the country vastly exposed to global market shocks. These developments make it all
the more important for Mongolia to follow a prudent and sustainable policy path towards
prosperity.
Nevertheless, the recent macroeconomic policy has been loose and compounded with
unfavorable commodity price shocks to adversely intensify balance of payments pressure.
The authorities have committed to unleash economic growth by shoring up investment to fill
a substantial infrastructure gap. In light of an adverse shock to FDI and commodity prices,
aggressive monetary stimulus was introduced in 2013 with the hope that a loose monetary
condition would help overcome the temporary difficulties, leading to a spike of credit growth
to 54 percent y/y. As a consequence, current account deficit has remained wide despite the
decline of equipment and machinery imports associated with the completed construction of
OT-1, and capital and financial account deteriorated sharply reflecting a contraction of FDI.
In the period of 2013-14, nominal exchange rate depreciated by more than 40 percent,
driving inflation to double digits; and reserves dropped by two thirds despite aggressive
external borrowing.
0
500
1000
1500
2000
2500
3000
3500
4000
4500
0
20
40
60
80
100
120
140
160
Jan
-05
Jun
-05
No
v-0
5
Ap
r-06
Sep
-06
Feb
-07
Jul-
07
Dec-0
7
May-0
8
Oct-
08
Mar-
09
Au
g-0
9
Jan
-10
Jun
-10
No
v-1
0
Ap
r-11
Sep
-11
Feb
-12
Jul-
12
Dec-1
2
May-1
3
Oct-
13
Mar-
14
Au
g-1
4
GIR(in million of US$, RHS) NEER REER
Sources: Mongolian authorities; and IMF staff estimates.
Exchange rates of the togrog(Index, 2005=100, Jan. 2005-Aug. 2014; an increase is an appreciation)
0
100
200
300
400
500
600
700
0
20
40
60
80
100
120
140Ja
n-1
1
Ap
r-11
Jul-
11
Oct-
11
Jan
-12
Ap
r-12
Jul-
12
Oct-
12
Jan
-13
Ap
r-13
Jul-
13
Oct-
13
Jan
-14
Ap
r-14
Jul-
14
Coal Price Index FDI (in million of US$, RHS)
Coal Export Price and FDI(Jan.2011-July 2014)
Sources: Mogolian authorities, and IMF staff estimates.

7
External sector assessment points to a significant current account gap induced by
unsustainable macroeconomic policy mix. To restore external viability, a package of
adjustment policy needs to be implemented. Most importantly, fiscal deficit should be
compressed, monetary policy stance tightened, and exchange rate depreciated in real terms.
III. A MODEL-BASED ANALYSIS OF MONGOLIA’S NATURAL RESOURCE REVENUES
In this section we describe a dynamic stochastic general equilibrium (DSGE) model with
natural resource wealth in a small open economy. The model combines elements of
frameworks developed in Araujo et al (2013), Buffie et al (2012), Berg et al. (2013), and
Melina et al. (2014) in analyzing natural resource management for developing countries. In
particular, we utilize the model of Melina et al. (2014) and apply its model to Mongolia.
We analyze the debt sustainability and macroeconomic impact of various public investment
plans in Mongolia, which model is based on a DSGE model of a small open economy that
captures the investment-growth nexus in presence of given natural resource revenue, as well
as investment efficiencies and absorptive capacity constraints. It helps to inform the
authorities about the various policy decisions on investing resource revenues to boost growth
while maintaining fiscal sustainability and macroeconomic stability.
The model follows Melina et al. (2014) closely. It is a three-sector model of a small open
economy which comprises household, firms and government. The country produces a
composite of non-resource traded and traded sector good using capital k, labor L and
government-supplied infrastructure kg. The model incorporates various multiple types of
public debt instruments, multiple taxes and spending variables and resource fund.
A. Model
The economy features two types of households, including poor households with no access to
financial markets, and features traded and non-traded sectors as well as a natural resource
sector. Public capital enters production technologies, while public investment is subject to
inefficiencies and absorptive capacity constraints. The government has access to different
types of debt (concessional, domestic and external commercial) and a resource fund, which
can be used to finance public investment plans. The resource fund can also serve as a buffer
to absorb fiscal balances for given projections of resource revenues and public investment
plans. When the fund is drawn down to its minimal value, a combination of external and
domestic borrowing can be used to cover the fiscal gap in the short to medium run. Fiscal
adjustments through tax rates and government non-capital expenditures—which may be
constrained by ceilings and floors, respectively—are then triggered to maintain debt
sustainability.

8
Households: There is continuum of two types of households—optimizing households and
hand-to-mouth households—who live for infinite horizon. A fraction ω of the households
have access to capital markets, where they can trade contingent securities and own firms.
These types of households are often referred to as optimizing or Ricardian households and
are denoted by subscript OPT. The remaining fraction 1− ω are poor or financially
constrained also referred as rule-of thumb or hand-to-mouth households and are denoted by
subscript HTM. Hand-to-mouth households have no access to capital and financial market
and consume all of the disposable income each period.
Both types consume a consumption basket, , a constant-elasticity-of-substitution (CES)
aggregate of traded goods and nontraded goods
. Thus, the consumption basket is
=
, i = OPT, HTM (1)
where φ is the degree of non-traded goods bias in the consumption basket, and χ > 0 is the
intra-temporal elasticity of substitution.
Let and be the relative prices of nontraded and traded goods with respect to the
consumption basket. Assuming the law of one price holds for traded goods, is also the real
exchange rate, defined as the price of one unit of foreign consumption basket in units of
domestic basket. The unit price of the consumption basket is
1=
. (2)
Both types of households provide labor service ( and
, i = OPT, HTM) to the traded
and the nontraded good sectors, denoted by subscripts T and N. Total labor has a CES
specification to capture that labor supplied to the two sectors are not perfect substitutes,
=
, i = OPT, HTM , (3)
where δ is the steady-state share of labor in the nontraded good sector, and ρ > 0 is the intra-
temporal elasticity of substitution. Let and be the real wage rate paid in each sector.
The real wage index is
=
(4)

9
A representative optimizing household (OPT) maximizes its utility
subject to the budget constraint expressed in units of composite consumption
. (6)
is the discount factor. σ and ψ are the inverse of the inter-temporal elasticity of substitution
of consumption and of labor supply. is the disutility weight of labor. and
are the
effective tax rates on consumption and labor income. is domestic government bonds
that pay units of the consumption basket at time t + 1,
is liabilities to the rest
of the world that entail repayment of
units of the foreign consumption basket.
and are firms’ profits in the traded and nontraded good sector. The term
is a tax rebate that optimizing households receive on the tax
levied on the firms’ return on capital.3 is remittance from abroad, are government
transfers. μ is user fees of public capital , and
are portfolio
adjustment costs associated to foreign liabilities, where η controls the degree of capital
account openness and (a variable without a time subscript) is the initial the steady-state
value.
We assume that the private sector pays a constant premium over the interest rate that the
government pays on external commercial debt , such that
. (7)
Hand-to-mouth households (HTM) have the same utility function as optimizing households
. (8)
Their consumption is determined by the budget constraint
. (9)
3Because of the common wedge between tax burden imposed and tax revenues accrued to the government in
developing countries, we assume that a fraction of the tax revenue related to capital income does not enter
the government budget constraint.
10
Static maximization of the utility function gives the labor supply function:
. (10)
In aggregation, with two types of households, aggregate consumption, labor, privately owned
government bonds, and foreign liabilities are computed as follows.
, (11)
, (12)
;
. (13)
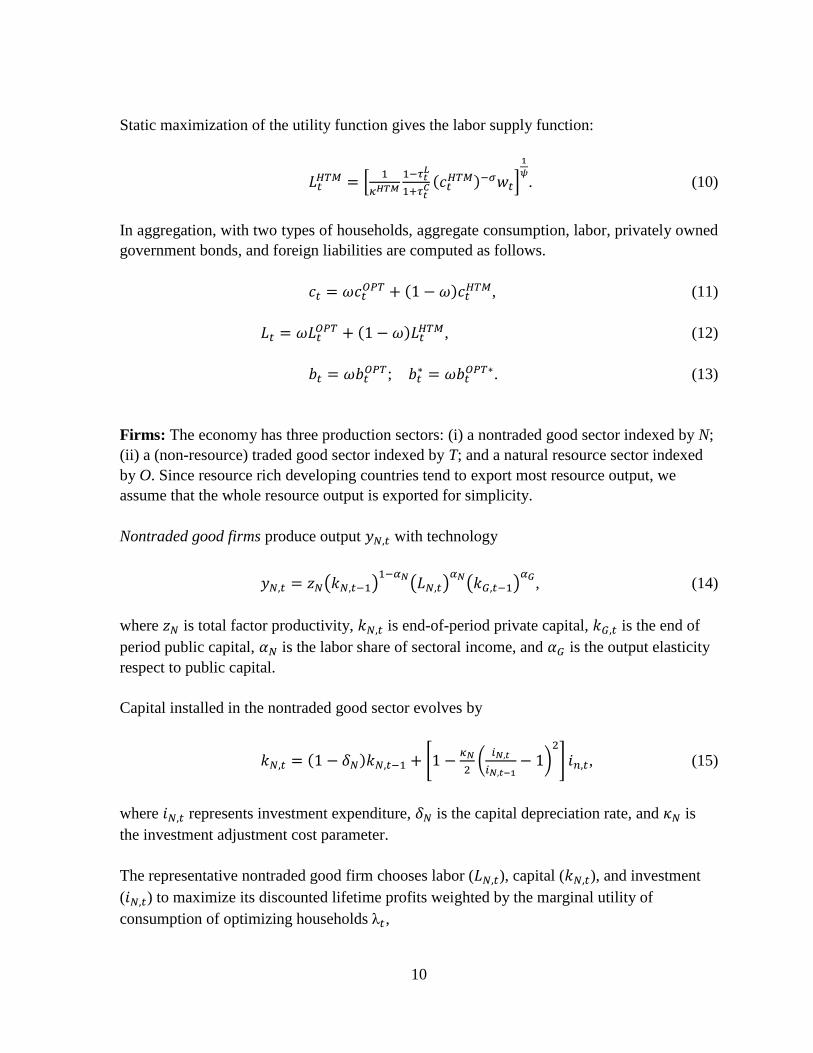
Firms: The economy has three production sectors: (i) a nontraded good sector indexed by N;
(ii) a (non-resource) traded good sector indexed by T; and a natural resource sector indexed
by O. Since resource rich developing countries tend to export most resource output, we
assume that the whole resource output is exported for simplicity.
Nontraded good firms produce output with technology
, (14)
where is total factor productivity, is end-of-period private capital, is the end of
period public capital, is the labor share of sectoral income, and is the output elasticity
respect to public capital.
Capital installed in the nontraded good sector evolves by
, (15)
where represents investment expenditure, is the capital depreciation rate, and is
the investment adjustment cost parameter.
The representative nontraded good firm chooses labor ( ), capital ( ), and investment
( ) to maximize its discounted lifetime profits weighted by the marginal utility of
consumption of optimizing households ,

11
where
is the return to capital.
Analogously to the nontraded good sector, firms in the traded good sector produce with
technology
. (17)
To capture the common Dutch disease associated with spending resource revenues, we
assume total factor productivity, , is subject to learning-by-doing externalities:
, (18)
where ,
control the severity of Dutch disease. The law of motion of private
capital is
. (19)
Like nontraded good firms, a representative traded good firm chooses labor ( ), capital
( ), and investment ( ) to maximize its discounted lifetime profits,
As most natural resource production is capital intensive and much of investment in the
natural resource sector is financed by foreign direct investment in developing countries,
natural resource production is simplified in the model.
Resource production follows an exogenous process
, (21)
where is an auto-regressive coefficient and
is the resource
production shock. We assume that resource production is small relative to world production;
hence, the international commodity price (relative to the foreign consumption basket),

12
, is taken as given. It is assumed to evolve following the process:
, (22)
where is an auto-regressive coefficient and
is the resource
price shock. Resource GDP in units of the domestic consumption basket is
. (23)
Government: Let be the royalty rate on production. Then, the resource revenue collected
each period is
. (24)
The government flow budget constraint is
, (25)
where is international grants. The user fee paid on public capital is computed as a
fraction f of recurrent costs: .
The government has three debt instruments: external concessional debt ( ), external
commercial debt ( ), and domestic debt ( ). Concessional loans extended by official
creditors are taken as exogenous in the model. and are the gross real interest rates
paid on concessional debt and external commercial debt. The latter incorporates a risk
premium depending on the deviations of total external public debt to GDP ratio from its
initial steady state,
(26)
where is a (constant) risk-free world interest rate, is total GDP and and are
structural parameters.
Public investment paths (as a share of GDP) are computed outside the model and taken as
exogenous. Except for the fiscal approach that increases transfers, all other approaches
assume constant transfers as a share of GDP. Throughout all simulations, government
consumption is kept constant as the level in a trend-growth path.

13
Government purchases comprise government consumption and public investment
.
Like private consumption, government expenditure,
, is also a CES aggregate
of domestic traded goods, and domestic nontraded goods, . Thus,
, (27)
where is the weight given to nontraded goods in government purchases. Government
purchases have the same intra-temporal elasticity of substitution χ > 0 as private
consumption. is the government consumption price index in terms of units of the
consumption basket,
. (28)
Note that is time-varying. As we focus on the effects of additional government spending in
public investment, the weight given to nontraded goods for the additional government
spending, , can differ from its steady state value, .
Public investment features inefficiency and absorptive capacity constraints. To reflect this,
we assume that investment efficiency on additional investment above a threshold level drops
from the steady-state efficiency value to a lower value . Let denote the effect public
investment, and
be the public investment-to-output ratio with being
the real GDP. Then,
, (29)
where is the threshold value that triggers efficiency costs associated with absorptive
capacity constraints.
The law of motion of public capital is
, (30)
where is the depreciation rate of public capital.
Resource fund and fiscal gap: Let be the foreign financial asset value in a resource fund,
and it serves as a fiscal buffer to absorb fiscal surplus or deficits. Each period, the resource
fund earns interest income
, with a constant gross real interest rate .

14
When the resource fund reaches zero, a government has to resort to borrowing to cover the
revenue shortfall, which then triggers fiscal adjustments to maintain debt sustainability.
To formalize the function of the resource fund, we assume that the resource fund evolves by
the process
, (31)
where represents the total fiscal inflow, represents the total fiscal outflow. Every
period, if the fiscal inflow exceeds the outflow, a resource fund increases its value.4 Instead,
if the fiscal inflow falls short of the outflow, the fund is drawn down to support government
spending. We assume that the resource fund cannot accumulate liabilities. Thus, when
< 0 (i.e., the fund does not have sufficient assets to be drawn down to
cover the difference between the fiscal inflow and outflow), is set to zero. Later we
explicitly define and and explain in detail the mechanism of closing the fiscal gap.
Given the paths of public investment, concessional borrowing, foreign aids and grants,
algebraic manipulation of (25) allows the government budget constraint to be rewritten as
, (32)
where
,5 (33)
, (34)
=
. (35)
Equation (33) says that covering the fiscal gap entails domestic and/or external commercial
borrowing or adjustments in various fiscal instruments.
When the government has to borrow, we assume that only external debt can be accessed.
Thus, . Debt sustainability requires that eventually revenues have to increase and/or
4 To guarantee that the resource fund is not an explosive process, we assume that in the very long run, a small
autoregressive coefficient (0, 1) is attached to. The model is typically solved at a yearly frequency for a
1000-period horizon. The coefficient is activated after the first 100 years of simulations. 5 In addition tax rates, government consumption and transfers can also be used as fiscal adjustment instruments.
15
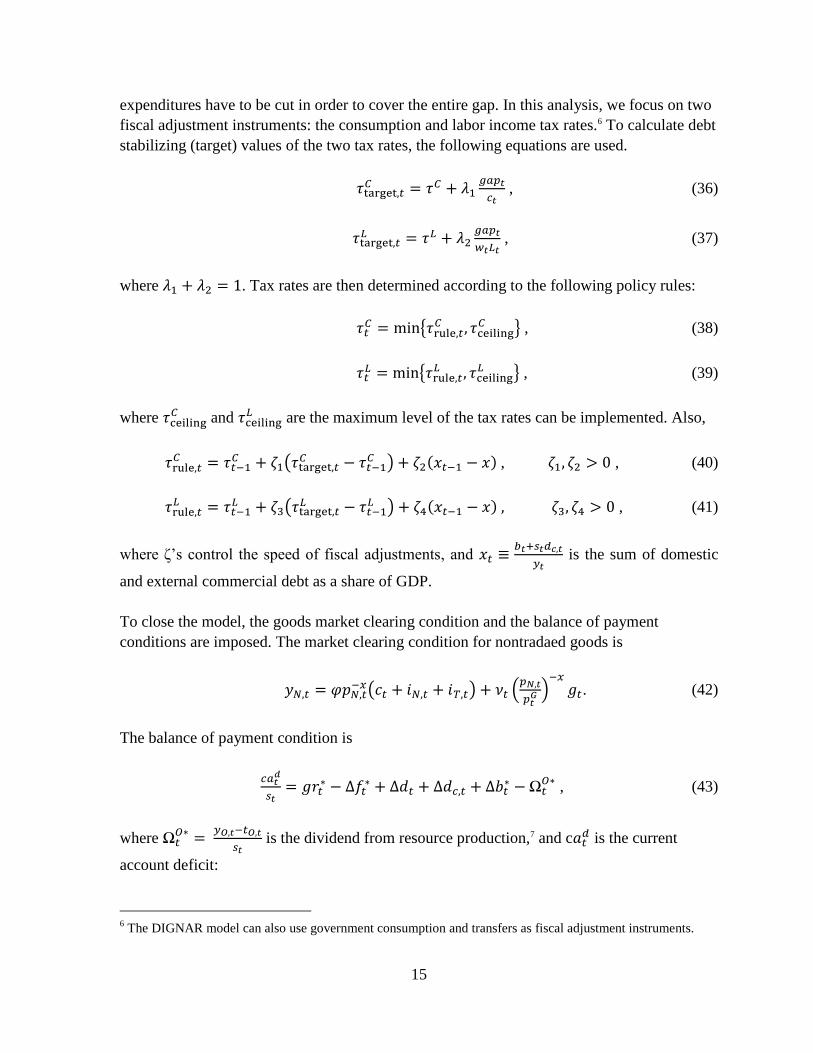
expenditures have to be cut in order to cover the entire gap. In this analysis, we focus on two
fiscal adjustment instruments: the consumption and labor income tax rates.6 To calculate debt
stabilizing (target) values of the two tax rates, the following equations are used.
, (36)
, (37)
where . Tax rates are then determined according to the following policy rules:
, (38)
, (39)
where and
are the maximum level of the tax rates can be implemented. Also,
, , (40)
, (41)
where ζ’s control the speed of fiscal adjustments, and
is the sum of domestic
and external commercial debt as a share of GDP.
To close the model, the goods market clearing condition and the balance of payment
conditions are imposed. The market clearing condition for nontradaed goods is
. (42)
The balance of payment condition is
, (43)
where
is the dividend from resource production,7 and c
is the current
account deficit:
6 The DIGNAR model can also use government consumption and transfers as fiscal adjustment instruments.

16
. (44)
Finally, total real GDP, is given by
. (45)
B. Calibration: Applying to Mongolia
The equilibrium system of the model consists of first-order conditions for all optimization
problems of the households and firms, market clearing conditions, the balance of payment
condition, and exogenous paths of resource variables (resource production quantities, prices,
and revenues as a share of GDP), public investment and transfers to households, and
concessional debt. We solve for a perfect foresight solution, using Dynare’s nonlinear
package.
Departing from Melina et al. (2014), we applied the model to Mongolia in particular, who
has been facing a high risk of debt distress because of its aggressive government spending in
recent years. The initial steady states are calibrated to the recent macroeconomic conditions
of Mongolian economy in year 2014, based on national accounts and fiscal data gathered
from the World Economic Outlook (WEO) and International Finance Statistics (IFS)
databases. Calibrating the model in this way captures the key features of the economy using
wide range of data on income share of GDP, cost shares, tax rates, debt and asset stocks etc.
The frequency of model is annual and the simulation horizon runs till 2025. Table 1
summarizes the calibration while rationale for important parameters choice is discussed
below.
National accounting. The national accounts data is taken from the WEO/IFS
database for the last 15 years. The share of export to GDP and import to GDP are
calibrated by taking average of past few years and are 40% and 57% respectively.
The share of government spending is taken as 19.6% of GDP, 13.7% of which is
government consumption whereas 5.9% is government investment expenditure.
Assets, debt and grants. Stock of assets, grants and debt reflects the 2013 values for
Mongolia. The government domestic level is much higher than the government’s
FSL debt limit of 40% and was at around 60% of GDP (14.7% domestic debt, 20%
7 For simplicity, we assume there is no cost in resource production, and the dividends are received by
foreigners.

17
concessional debt and 26% government external borrowing). Private foreign
borrowing stands at 87% of GDP, whereas sovereign welfare fund is much below
the government desired level of 5%.
Private production. Consistent with the evidence on Low and middle income
countries in Buffie et al. (2012), the labor income shares in the nontraded and
traded good sectors correspond to αN = 0.45 and αT = 0.60. In both sectors private
capital depreciates at an annual rate of 10 percent (δN = δT = 0.10). Following Berg
et al.(2013), we assume a minor degree of learning-by-doing externality in the
traded good sector (ρYT = ρzT = 0.10). Also as in Berg et al. (2010), investment
adjustment costs are set to κN = κT = 25.
Households’ preferences. The coefficient of risk aversion σ = 2.94 implies an inter-
temporal elasticity of substitution of 0.34, which is the average LIC estimate
according to Ogaki et al. (1996). We assume a low Frisch labor elasticity of 0.10 (ψ
= 10), similar to the estimate of wage elasticity of working in rural Malawi
(Goldberg, 2011). The labor mobility parameter ρ is set to 1 (Horvarth, 2000), and
the elasticity of substitution between traded and nontraded goods is χ = 0.44,
following Stockman and Tesar (1995). To capture limited access to international
capital markets, we set η = 1 as in Buffie et al. (2012).
Tax rates. The steady state value of consumption and labor tax rate are kept as 10%
each which is consistent with the observed data whereas the tax rate on the return
on capital is calibrated at 24% such that the steady state share of government tax
revenue to GDP calculated by combination of tax rates and the implied inefficiency
in revenue mobilization matches with the average of past years (around 28% of
GDP). Considering that Mongolia has limited space for tax adjustment, we assume
that the government will not adjust tax rates to finance public spending. Additional
public debt will be financed by non-concessional external debt.
C. Assumptions: Natural Resource Revenue and Investment Paths
This paper utilizes the model described above to illustrate the policy implications from two
alternative public investment paths of Mongolia. This approach is essential to analyze the
current internal and external balances of Mongolia and impact of various policy decisions on
Mongolia’s macroeconomic outlook. In the previous section, we calibrate the model using
the historical data of Mongolia and parameters widely used in the literature. In particular, the
initial steady state values are set using the country’s medium-term averages of relevant
aggregate variables. Details on the calibration and parameterization for the model are given
in Table 1.

18
When applying to Mongolia, our analysis investigates two alternative public investment
paths in particular:
1. Fiscal consolidation: In this plan government starts fiscal consolidation to reduce
fiscal debt by cutting its public investment.
2. Aggressive Investment: In this plan, the government maintains its current public
investment level for infrastructure development and growth.
Given the uncertainty in the resource sector production and prices, specifically in copper
mining, the above mentioned public investment approaches are analyzed under two
scenarios—baseline and adverse scenarios—with different mining revenue profiles down the
road. Both the public investment paths and resource sector scenarios are shown in Figure 1.
Under both the scenarios, we assume that the government resorts to only external commercial
borrowing to balance its financial deficit and fiscal adjustment in terms of increasing
consumption tax or labor tax is not feasible due to political constraints. In the baseline
scenario, the mining revenues follow the no-adverse-shock projections; in the adverse
scenario, the revenues would be hit by a reduced mining production shock and lower
international copper prices. To be specific, the two scenarios are summarized as below:
Baseline scenario: In this scenario the mining revenue projections are obtained using
the FARI model8. According to these projections, copper concentrate production is
estimated to increase from its current level of about ½ million tons in 2013 to more
than 1 million tons by 2020. The rapid growth in copper mining production is
expected to occur around 2020, when the major mining company Oyu Tolgio LLC.
plans to start its second round of copper mining (phase II).
Adverse scenario: In this scenario, we introduce a negative copper production shock
by delaying the Phase II of mining by Oyu Tolgio LLC. Apart from this we also
introduce a copper price shock of the same size as observed during 2009.
D. Efficiency and Absorptive Capacity
Empirical studies suggest that investment inefficiencies (poor planning, higher-than-expected
costs, bad governance, corruption, supply bottlenecks, lack of complementary infrastructure,
etc.) are pervasive in developing countries. According to the literature on public investment
efficiency level for low income countries (Berg et al. 2013 and van der Ploeg, 2012), only
around half of public investment expenditure translates into effective public investment (i.e.
8 FARI model is developed by the FAD department of the International Monetary Fund.
19
investment that enhances the public capital stock). This means that $1 spent on public
investment will translate into $0.5 worth of public capital formulation. We assumed slightly
higher level of public investment efficiency level for Mongolia at 65%, considering relatively
higher public investment efficiency index of Mongolia as compared to several developing
countries. (See Dabla-Norris, 2011).
If public investment level remains high, the degree of inefficiency is likely to increase.
Namely, it is more likely to bump into absorptive capacity constraints in the short run. These
are limits on the level of public investment that the economy is able to retain and hence a
bigger part of investment expenditure will be wasted. As shown in Figure 3, investment
efficiency decreases more in short run in case of aggressive public investment than fiscal
consolidation.
If, over time, institutions, governance, management practices are improved, public
investment becomes, on average, more efficient and absorptive capacity constraints become
less binding. If investment projects are better designed, selected, and implemented, the
average real return of investment increases. This will increase productivity of private factors
for production with a more positive impact on capital stock accumulation, growth and
incomes without causing high debt distress level. In Figure 4, we show a robustness check
with a different efficiency of investment. For instance, a difference of average public
investment efficiency for about 1 percentage points will point to one percent change of public
capital accumulation over ten years9. Combined with a better project selection, an improved
efficiency can lead to same growth and public capital formulation as in the case of aggressive
public investment but without any negative consequences in terms of higher public debt or
worsen balance of payment. Thus increasing investment efficiency can lead to higher growth
and faster buildup of capital with fiscal macroeconomic stability in Mongolia.
9 Such an increase in efficiency has to be taken just as an example. In fact it can be very challenging for a
developing country to achieve such an efficiency improvement over ten years. This ultimately depends on
policy choices and individual country experiences.

20
Figure 1. Assumptions: Resource Output and Public Investment Paths
(Left column: Baseline Scenario; Right column: Adverse Scenario)

21
IV. SIMULATION RESULTS AND POLICY IMPLICATION
In this section, we present the simulation results with different scenarios of natural resource
revenues. In the first set of simulations, we consider the baseline natural resource output and
revenue with different public investment paths. Then, we explore the implications with the
adverse resource shocks. Last, we show a robustness check with different efficiency of public
investment.
A. Baseline Scenario
Under the baseline scenario (left columns in Figures 1--3), as Figure 1 shows, the baseline
envisages an increase of natural resource output and revenue starting from year 2020 as
shown in the left column of the panel, reflecting the start of production by OT-2. The copper
output, measured in millions of tons, is expected to double in 2020. Resource revenues from
copper as percent of total revenue increase from 20 percent to about 40 percent in 10 years.
With fiscal consolidation, we assume that the government will cut its public investment from
15 percent of GDP in 2014 to around 10 percent of GDP in 2015 and onward.
The baseline scenario with fiscal consolidation delivers more favorable outcomes in terms of
debt sustainability and financial assets accumulation in the SWF. As Figures 2—3 shows,
fiscal consolidation (solid blue lines) deliver sustainable and sizeable accumulations of
public capital. The public capital will rise by 60 percent from the level of the steady states.
Given the projected resource revenues in the baseline, it allows for a moderate amount of
savings in the SWF starting from 2019, and the SWF will increase to about 12 percent of
GDP in 2025. The investment path with fiscal consolidation will not require additional
borrowing. The path of total public debt will reduce and be stabilized at about 45 percent of
GDP eventually. There is about 10 percent overvaluation of the real exchange rate in 2014;
the gap will diminish by 5 percentage points with the fiscal actions.
However, if we assume that the government keeps its high public spending plans and only
gradually reduces it to 10 percent of GDP, the results and the impacts (shown in red dashed
lines) will be less favorable. In the long run, the economy might produce higher non-oil GDP
and private investment because of the crowding-in effect from higher public capital
accumulation. Although the public capital accrues more aggressively, the financing costs are
not trivial and the national debt burden becomes significant. The economy will accumulate
less saving in the stabilization fund. Also, with limited space for tax adjustment and low
sovereign wealth fund, we show that the total public debt will increase to 80 percent of GDP
in 2018 and stabilize at 65 percent in the long term, which is about 20 percentage points
higher compared to the results with the fiscal consolidation. The appreciation of real
exchange rate, however, will persist for a longer term in the high investment scenario than in
the fiscal consolidation scenario. A Dutch disease (a decline in traded output) will last longer
with the high investment government spending than otherwise. As most resource revenues
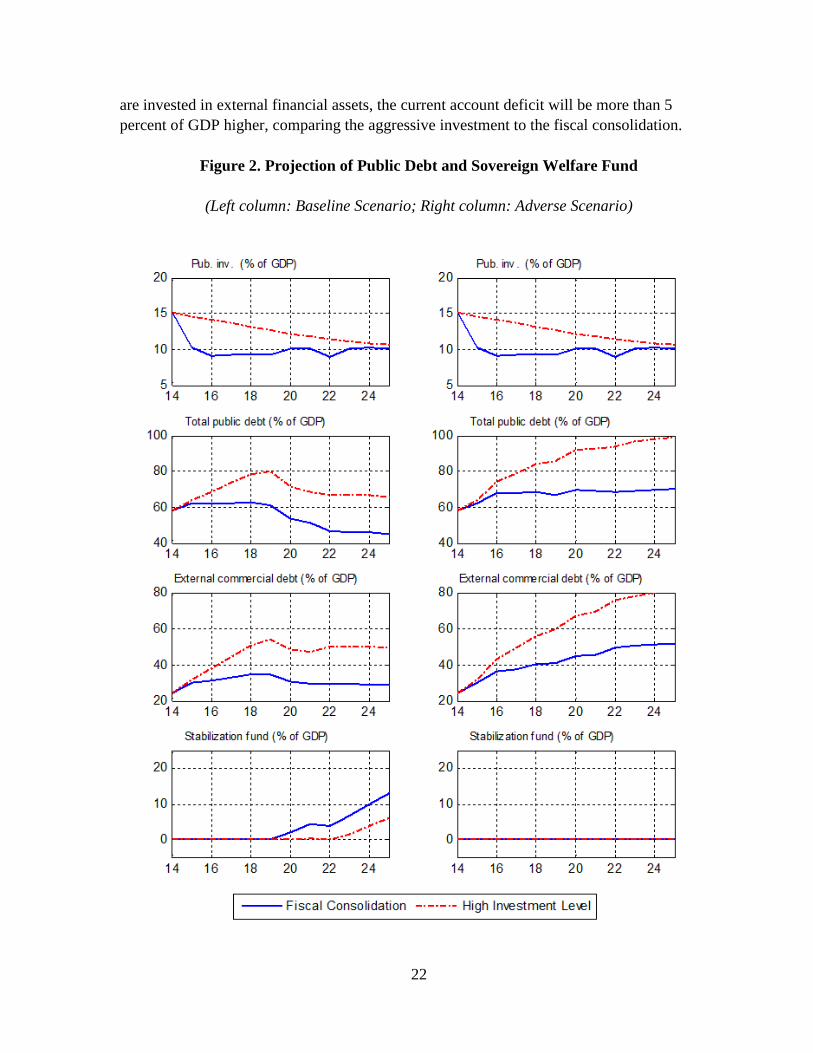
22
are invested in external financial assets, the current account deficit will be more than 5
percent of GDP higher, comparing the aggressive investment to the fiscal consolidation.
Figure 2. Projection of Public Debt and Sovereign Welfare Fund
(Left column: Baseline Scenario; Right column: Adverse Scenario)

23
Figure 3. Paths of Other Variables
(Left column: Baseline Scenario; Right column: Adverse Scenario)
24
B. Adverse Scenario: Negative Resource Shock
Turning to the adverse resource revenue scenario (right columns in Figures 1--3), we
introduce a negative copper production shock by vastly delaying the OT-2 production, and
we also introduce a copper price shock of the same size as observed during the 2009 global
crisis. The resource revenues from copper will stay flat in the range of 20-25 percent out of
the total government revenue.
With limited resource revenues, both projected paths of public investment deliver more
challenges to the economy. Still, public capital has accumulated sizably under both paths.
However, with relatively paltry resource revenues, the SWF will not have any savings in
either of the adverse scenarios. The ratio of public debt to GDP increases by 10 percentage
points to about 70 percent with fiscal consolidation (solid blue lines), reflecting higher levels
of external non-concessional debt (rising for about 20 percent of GDP). Even worse, if the
government keeps rapid spending plans (red dashed lines), the public debt path will be
explosive. Moreover, aggressive investments would put pressure on real exchange rate. The
exchange rate is currently overvalued by more than 10 percent and should be allowed to
depreciate. As a result, current account deficit would widen—we estimate an additional 5
percent of GDP in current account deficit as compared to the baseline projection with fiscal
consolidation path.
Under the aggressive investment path total, public debt sustainability is at high risk of
distress and may require large fiscal adjustment. Even if OT-2 is implemented and
substantially increases revenue, total public debt would remain significantly above the FSL
limit. In case of any major adverse shock as simulated in the model, the public debt level will
become unsustainable and the government would need to resort to undesirable increase in
taxes or sharp spending cuts. High levels of external borrowing will also lead to an increase
in country risk premium and higher cost of borrowing.
These flaws of aggressive investment call for fiscal consolidation. Although fiscal
consolidation is contractionary in the short run, output losses would be limited over the
medium term given the small fiscal multiplier. In the short run, the impact is driven by a
contraction of aggregate demand as a result of lower government spending. Moreover, lower
infrastructure investments tend to reduce medium-term growth and lead to slower growth of
public capital. Nevertheless, fiscal consolidation would boost growth prospects over the
medium and long run by lowering interest rates and spreads, putting debt on a sustainable
trajectory, and ultimately enhance the sustainability of the economy. In addition, lower
public expenditure would facilitate real exchange rate depreciation, which enhances external
competitiveness and helps avoid the Dutch disease. Finally, fiscal consolidation in the near
term would ease the constraints of absorptive capacity, give rise to investment efficiency in
the near term and allow for capacity building over time.

25
In the case of Mongolia, fiscal consolidation leads to reduction in total public debt to 40%
target over time (Figure 2). However, total public debt could increase by 10 percent of GDP
from the current level in case of adverse shock to the economy (such as delays OT-2 or a
negative international commodity price shock) even when fiscal consolidation is
implemented. The authorities should be alert to such risks and manage to build up sovereign
welfare fund that can be utilized to smooth out investment in case of negative shocks.
Figure 4. Robustness Check: Different Efficiency
(Left column: Baseline Scenario; Right column: Adverse Scenario)

26
C. Robustness Check
Public investment efficiency and absorptive capacity (Figures 3—4). In the long run,
fiscal consolidation and large resource sector revenues would put Mongolia on a sustainable
growth path. This would also be highly dependent on efficient implementation of projects
and sound absorptive capacity in the economy. In Figure 3, we show that under baseline
scenario, the efficiency of public investment remains lower in case of aggressive scaling up
as compared to fiscal consolidation. Fiscal consolidation instead will improve the measured
efficiency of public investment. This follows from our assumption that aggressive scaling up
can be bound by constraints like weak management capacity, supply bottlenecks, and
institutional quality issues. In Figure 4, we also show a robustness check for different
efficiency in the economy. If we assume the investment efficiency is lower by 2 percentage
points, which implies that the efficiency is about 63 percent at the steady state, the public
capital accumulation and the non-resource output production will be dampened mildly.
V. CONCLUSIONS
In sum, this paper employs a structural model-based analysis and helps answer various
questions pertaining to fiscal sustainability and macroeconomic stability of Mongolia. We
illustrate the policy tradeoffs faced by a natural resource-rich country that has large social
and infrastructure gaps, faces absorptive and implementation capacity constraints, and is also
subject to resource production and price uncertainty.
The outcomes are reflected in three areas. First, the model exhibits under two different public
investment strategies—baseline and fiscal consolidation—the development of key macro-
financial variables such as traded/non-traded sector growth rate, public capital formulation,
investment efficiency, consumption, real exchange rate, balance of payments, public debt,
etc. Second, the study explores how these variables would evolve in the presence of an
adverse scenario such as a negative resource sector shock. Our results highlight the
sensitivity of budgetary revenues to commodity production and price shocks, which could
affect both government spending and potential non-oil output growth. Third, the model-based
toolkit is also used to study the impact of enhanced institutional efficiency (in terms of
governance, project selection, etc) on public capital formulation and overall growth. We
show the positive impact of improving public investment efficiency, which can contribute to
a higher-level of public capital without adversely affecting fiscal sustainability.
The analysis stresses the benefits of adopting a comprehensive approach to managing natural
resources wealth and to sustaining the longer-term diversification of growth. In Mongolia,
given the large share of the natural resources sector, it is particularly important to look
beyond traditional metrics of the investment- growth nexus. While ambitious scaling up of
public investment can generate higher non-mineral growth, the challenges on debt
sustainability and external viability can be high and the associated macro-financial risks
27
would outweigh the benefit of higher investment and growth, calling for fiscal consolidation
and more moderate pace of public investment. Particularly, even without an adverse shock to
the mining sector, public debt under the baseline investment path would reach more than 80
percent of GDP over the medium term and stay above 60 percent of GDP in outer years,
signaling a high risk of debt distress. The buildup of sovereign wealth fund would be far
delayed if the baseline path (without fiscal consoilidation) is adopted. Meanwhile, there is a
wide gap of investment efficiency between the baseline and fiscal consolidation scenarios,
suggesting substantial ineffective investment in the near term under the baseline. The
baseline also entails immediate macroeconomic risk given the elevated balance of payments
pressure. These risks would increase substantially given an adverse shock to the mining
sector.
Going forward, the top priority is to safeguard macroeconomic stability and fiscal
sustainability via fiscal consolidation and complementary structural reforms on the basis of a
transparent institutional framework. From our analysis, we show that key measures could be
the deficit reduction—for example, reducing public expenditure while maintaining well-
targeted transfers and subsidies for inclusiveness—and a moderate investment strategy based
on improved efficiency to facilitate economic diversification and growth potential, alongside
the establishment of a coherent fiscal framework that addresses medium-term fiscal
sustainability and makes savings under the sovereign wealth fund in the long run. In light of
the lessons for Mongolia, we recommend to other similar natural resource rich and capital
scarce economies that a long-term optimal fiscal framework should account for both the
growth- or revenue-enhancing impact of investment and the fiscal distortions gauging its debt
sustainability.

28
VI. APPENDIX
Table 1. Calibration of Key Parameters
Parameter Value Description expshare: share of export to GDP 0.40 Data (WEO/IFS)
impshare: share of import to GDP 0.57 Data (WEO/IFS)
: Government consumption to GDP 0.137 Data (WEO/IFS)
0.059 Data (WEO/IFS)
0.25 Data (WEO/IFS)
0.5 Data (WEO/IFS)
0.5 Data (WEO/IFS)
0.147 Data (WEO/IFS)
0.87 Data (WEO/IFS)
0.2 Data (WEO/IFS)
0.26 Data (WEO/IFS)
0.01 Data (WEO/IFS)
3% Data (WEO/IFS)
2% Data (WEO/IFS)
0% Data (WEO/IFS)
2.5% Data (WEO/IFS)
substitution elasticity between and 1 Horvath (2000)
α labor income share in nontraded good sector 0.5 Buffie et al. (2012)
α : labor income share in traded good sector 0.5 Buffie et al. (2012)
α output elasticity with respect to public capital .15 Chosen to target the
annual net return to
public capital is 25%
investment adjustment cost 25 Berg et al. (2010)
annual depreciation rate of public capital 0.07 Melina et al. (2014) : annual depreciation rate of private capital 0.10 Melina et al. (2014)
, : learning-by-doing parameter 0.1 Berg et al. (2010), mild
externality
: steady-state efficiency of public investment 0.65 Pritchett (2000) for
SSA countries
: lower efficiency on additional investment when absorptive
capacity is constrained
0.5 Arestoff and Hurlin
(2006)

29
VII. REFERENCES
Araujo, J., Li, B., Poplawski-Ribeiro, M. and L.-F. Zanna, 2013, “Current Account Norms in
Natural Resource Rich and Capital Scarce Economies.” IMF Working Paper 13/80,
International Monetary Fund, Washington D.C.
Arestoff, F. and C. Hurlin, 2006, “Estimates of Government Net Capital Stocks for
26 Developing Countries, 1970-2002.” World Bank Policy Research Working Paper
3858, Washington, D.C.
Berg, A., J. Gottschalk, R. Portillo, and L.-F. Zanna, 2010. “The Macroeconomics of
Medium-term Aid Scaling-up Scenarios.” IMF Working Paper 10/160, International
Washington Fund, Washington, D.C.
Berg, A., R. Portillo, S.-C. S. Yang, L.-F. Zanna, 2013, “Public Investment in Resource-
Abundant Developing Countries,” IMF Economic Review, 61(1), 92-129.
Buffie, E. F., A. Berg, C. Pattillo, R. Portillo, and L.-F. Zanna, 2012, “Public Investment,
Growth, and Debt Sustainability: Putting together the Pieces,” IMF Working Paper
12/144, International Monetary Fund, Washington, D.C.
Collier, P., R. van der Ploeg, M. Spence, and A. J. Venables, 2010, “Managing Resource
Revenues in Developing Economies,” Staff Papers, International Monetary Fund,
Palgrave Macmillan, Vol. 57(1), pp. 84-118.
Dabla-Norris, E., J. Brumby, A. Kyobe, Z. Mills, and C. Papageorgiou, 2011. “Investing in
Public Investment: An Index of Public Investment Efficiency.” IMF Working Paper
11/37, International Monetary Fund, Washington, D.C.
Goldberg, J., 2011, “Kwacha Gonna Do? Experimental Evidence about Labor Supply in
Rural Malawi,” Manuscript, Economics Department, University of Maryland.
Gupta, S., A. Kangur, C. Papageorgiou, and A. Wane, 2014, “Efficiency-Adjusted Public
Capital and Growth,” World Development, 57, 164–178.
International Monetary Fund, 2012, Macroeconomic Frameworks for Resource-Rich
Developing Countries, Washington, D.C. Available at:
www.imf.org/external/np/pp/eng/2012/082412a.pdf
Melina, G., S.-C. S. Yang, and L.-F. Zanna, 2014, “Debt Sustainability, Public Investment,
and Natural Resources in Developing Countries: the DIGNAR Model,” IMF Working
Paper 14/50, International Monetary Fund, Washington, D.C.
Ogaki, M., J. Ostry, and C. Reinhart, 1996, “Saving behavior in low- and middle-income
developing countries: A comparison,” IMF Staff Papers 43 (1), 38–71.

30
Pritchett, L., 2000, “The Tyranny of Concepts: CUDIE (Cumulated, Depreciated, Investment
Effort) is Not Capital,” Journal of Economic Growth vol. 5, 361-384.
Sachs, J.D. and A. M. Warner, 1995, revised 1997, 1999, “Natural Resource Abundance and
Economic Growth,” National Bureau of Economic Research Working paper No.
5398, Cambridge, MA.
Stockman, A.C. and Tesar, L.L., 1995, “Tastes and Technology in a Two-Country Model of
the Business Cycle: Explaining International Comovements,” American Economic
Review, vol. 85(1), pp. 168-85.
van der Ploeg, F., 2011. “Natural Resources: Curse or Blessing?” Journal of Economic
Literature, 49(2): 366-420.
van der Ploeg, F., and A.J. Venables, 2011, “Harnessing Windfall Revenues: Optimal
Policies for Resource Rich Developing Economies,” Economic Journal, Royal
Economic Society, Vol. 121(551), pp. 1-30.
World Bank, 2013, “Mongolia: Improving Public Investments to Meet the Challenge of
Scaling Up Infrastructure” January, available at
http://www.worldbank.org/en/news/feature/2013/02/27/mongolia-improving-public-
investments-to-meet-the-challenge-of-scaling-up-infrastructure