sustainable economic growth : natural resources …
TRANSCRIPT

Unclassified ECO/WKP(99)10
Organisation de Coopération et de Développement Economiques OLIS : 28-Jul-1999Organisation for Economic Co-operation and Development Dist. : 05-Aug-1999__________________________________________________________________________________________
English text onlyECONOMICS DEPARTMENT
SUSTAINABLE ECONOMIC GROWTH : NATURAL RESOURCES ANDTHE ENVIRONMENT IN NORWAY
ECONOMICS DEPARTMENT WORKING PAPERS N0. 218
byPaul van den Noord and Ann Vourc’h
Unclassified
EC
O/W
KP
(99)10E
nglish text only
Most Economics Department Working Papers beginning with No. 144 are now available throughOECD’s Internet Web site at http://www.oecd.org/eco/eco.
80280
Document complet disponible sur OLIS dans son format d’origine
Complete document available on OLIS in its original format

ECO/WKP(99)10
2
ABSTRACT/RÉSUMÉ
This document examines Norwegian policy on managing natural and environmental resources. Theseissues, and more generally the challenges of sustainable development, are primary concerns of theauthorities in Norway, a country richly endowed with natural resources. Substantial action has been taken,as can be seen in the development of an integrated institutional framework and in the major effortsundertaken to co-ordinate government policies in this area. The investment of a large share of the rentfrom oil and gas in foreign financial assets should help ensure the inter-generational balance. Norway’sleading role in fostering international co-operation on fisheries and environmental management — whereproblems often extend beyond national boundaries — also reflects an engagement mindful of the needs ofpresent and future generations. Within the country, the government has succeeded in reducing theemissions of a large number of pollutants. But measures still need to become more cost-effective,especially in areas where the desire to preserve the competitiveness of traditional economic activities, andthe policy goals of a particular region or sector (transport, agriculture), have outweighedcost-effectiveness considerations.
*****
Ce document examine la politique norvégienne en matière de gestion des ressources naturelles etenvironnementales. Ces questions, et plus généralement la problématique du développement durable,constituent des préoccupations centrales des pouvoirs publics dans ce pays amplement doté en ressourcesnaturelles, qui se sont traduits en pratique. En attestent le développement d’un cadre institutionnel intégréet les importants efforts de coordination des politiques des administrations publiques dans ce domaine.L’investissement d’une forte proportion de la rente pétrolière et gazière dans des actifs financiersextérieurs répond au souci d’équilibre intergénérationnel. La forte implication de la Norvège pour stimulerla coopération internationale dans la gestion des pêches et de l’environnement constitue également uninvestissement conforme à l’intérêt des générations présentes et futures, compte tenu du caractère souventinternational des problèmes rencontrés. Au niveau national, les autorités sont parvenues à réduire lesémissions d’un grand nombre de polluants. Cependant, des progrès restent à faire pour augmenterl’efficacité par rapport aux coûts, en particulier dans un certain nombre de domaines où le souci depréserver la compétitivité des activités économiques traditionnelles et les objectifs des politiquesrégionales et sectorielles (transport et agriculture) l’ont emporté sur ces considérations de coût-efficacité.
JEL codes: Q25, Q28, Q38, Q48Keywords: Norway, sustainable development, environment policy, natural resource policies
Copyright © OECD. All rights reserved.
Applications for permission to reproduce or translate all, or part of, this material should be madeto: Head of Publications Service, OECD, 2 rue André Pascal, 75775 Paris Cedex 16, France.

ECO/WKP(99)10
3
TABLE OF CONTENTS
Introduction ................................................................................................................................................... 5The policy issues — an overview .................................................................................................................. 7
What is sustainable development? ......................................................................................................... 7How to raise wealth accumulation? ....................................................................................................... 7Policies interact ...................................................................................................................................... 8
Resource management ................................................................................................................................... 9Non-renewable resources — oil and gas ............................................................................................... 9Renewable resources — fisheries and forestry .................................................................................... 13
Environmental management ........................................................................................................................ 15Global environmental problems .......................................................................................................... 16Transborder pollution problems .......................................................................................................... 27Local environmental problems ............................................................................................................ 32
Assessment and challenges ahead ............................................................................................................... 36Ensuring sustainability ........................................................................................................................ 36Fostering cost-effectiveness ................................................................................................................ 38Policy interactions are important.......................................................................................................... 40
Notes............................................................................................................................................................. 41
Glossary of acronyms .................................................................................................................................. 46
Bibliography ................................................................................................................................................ 47
AnnexNorway’s oil and gas wealth ........................................................................................................ 49
Boxes
1. The OECD’s work on sustainable development ............................................................................ 62. The Kyoto Protocol ...................................................................................................................... 17
Tables
1. CO2 tax structure and coverage .................................................................................................... 202. Petrol prices and taxes in international comparison .................................................................... 233. Macroeconomic effects in 2010 of meeting the Kyoto Protocol obligations .............................. 254. Norwegian policy targets for transborder environmental problems ............................................ 285. Emission intensity of various forms of transport ......................................................................... 31

ECO/WKP(99)10
4
AnnexA1. World reserves of oil and gas ....................................................................................................... 50A2. Petroleum resources on the Norwegian continental shelf ............................................................ 52
Figures
1. National wealth .............................................................................................................................. 82. Net petroleum revenues of the government ................................................................................. 123. Fish catches in OECD countries .................................................................................................. 144. Carbon dioxide emissions ............................................................................................................ 185. Projections for greenhouse gas emissions ................................................................................... 196. Prices and taxes for fuel oil and petrol ........................................................................................ 227. Emissions to air ............................................................................................................................ 268. Marginal cost of reduction in sulphur dioxide emissions ............................................................ 299. Water pollution ............................................................................................................................ 3210. Air pollution in Oslo .................................................................................................................... 33
AnnexA1. Production and net exports of crude oil ....................................................................................... 50A2. Oil and gas production on the Norwegian continental shelf ........................................................ 51A3. North Sea oil and natural gas transportation systems .................................................................. 54

ECO/WKP(99)10
5
SUSTAINABLE ECONOMIC GROWTH: NATURAL RESOURCESAND THE ENVIRONMENT IN NORWAY
Paul van den Noord and Ann Vourc’h1
Introduction
1. Since 1989, sustainable development has become a cornerstone of policy-making in Norway andit has recently been made a top priority area for the work of the OECD (Box 1). Sustainable developmenttouches on a wide range of policy issues, including how to raise human and physical capital and how tomanage natural resources. OECD country surveys have always covered a wide range of policy issuesconcerning potential output growth, the sustainability of pension systems or of the macroeconomic policysetting. While these issues are important in ensuring sustained economic growth, this paper looks to abroader set of issues concerning natural resource management, including non-renewable and renewableresources as well as the environment, which are also necessary for ensuring sustainable development.
2. The management of natural resources involves fairly extensive public policy decision making.The key economic policy objectives concerning non-renewable resources in Norway, of which crude oiland natural gas are the most prevalent, are two-pronged. First, economic policy aims at maximising thewealth associated with the non-renewable resource, by choosing an extraction path and achievingcost-effectiveness. Other things equal, conditions of great uncertainty over future market developmentstend, rationally, to encourage relatively rapid extraction. Second, economic policy is geared towardsachieving a fair distribution of wealth across present and future generations, i.e. by establishing a mixbetween present and future consumption which maximises long-run economic well-being. This hasentailed setting up a vehicle through which the resource wealth can be transmitted to future generations.The policy objectives associated with renewable resources, of which fisheries are the most important, arenot fundamentally different. However, the ecological dynamics involved and the international sharing ofstocks form additional conditioning factors. To date, economic policies in Norway have by and largeachieved these objectives, but there remains scope for further improvement.
3. The environment is largely a public good which is available to all, despite its exhaustiblecharacter. Hence economic policies are needed to ensure that an optimal production level and structure isachieved, taking into consideration the (properly valued) effects of economic activities on theenvironment (i.e. ensuring externalities are properly recognised). Environmental targets set by nationalchoice or international agreements should reflect these objectives, and economic policies shouldsubsequently contribute to attaining these targets in a cost-effective way. There is no simple rule forensuring cost-effectiveness, but it is, to a certain extent, a function of the choice of environmental policyinstruments. Direct regulation, which relies on emission, process and product standards, is sometimesappropriate — for example in the case of heavily toxic substances. In other instances the use of economic

ECO/WKP(99)10
6
instruments, such as taxes, subsidies and tradeable emission rights may be preferable as they leave morefreedom for economic actors to seek the cheapest method of abatement and contribute to continuinginnovation. Several economic instruments (taxes, auctioned quotas) raise revenue for the government in anon-distortionary way and thus may have an impact on overall economic performance by enabling a lowertax burden on human and fixed capital. Conversely, economic policies in other domains than theenvironment can have significant consequences for the environment, agricultural and transportationpolicies being prominent examples. Given the complex interactions, the Norwegian authorities have set upan extensive framework for co-ordination of economic and environmental policies, which aim at asustainable development of environmental resources and at reducing policy conflicts.
4. The discussion of non-renewable resources in the first section of this paper draws on earlierOECD work (the 1995 Economic Survey and the International Energy Agency’s [IEA] 1997 NorwayReview).2 The environmental section that follows also builds on previous OECD work (1993Environmental Performance Review for Norway).3 Compared to the IEA and the OECD EnvironmentalPerformance Reviews, which provide more detail on energy provision and environmental performanceper se, this paper focuses on sustainable development in its broadest economic sense — including, forexample, considerations of inter-generational equity and cost-effectiveness — and are thuscomplementary. The paper concludes with an overall assessment in the light of the challenges that lieahead.
Box 1. The OECD’s work on sustainable development
In a paper for the 1998 meeting of Ministers from OECD countries, the Secretary-General outlined athree-year work programme on this topic, covering four key aspects: follow-up of the Kyoto agreement; analysis ofhow prices could better reflect the social costs of environmental damage, including through subsidy reduction; the roleof better exploitation of knowledge, technology and innovation for resource productivity; and improved measurementof performance. For instance, in the field of climate policy, one important objective for the OECD is to assessdevelopments and facilitate discussion on good practice as Member countries are developing policies to achieve Kyototargets.
As part of this programme, a series of in-depth special chapters in the OECD Economic Surveys areplanned. They will focus on how countries go about achieving their environmental and resource managementobjectives with a view to strengthening sustainable economic growth in the long run. An important aspect in thiscontext is to aim at a comprehensive policy approach, for instance, a better integration of sectoral policies. Ananalytical framework for these chapters will be established by spring 1999. It will subsequently provide a benchmarkfor policy analysis in the following Surveys. The experience gained from the reviews of individual countries will thenbe presented in a report to OECD Ministers in 2001. In this process, the present paper on Norway is a pilot case, withthe Norwegian experience influencing the work on the general framework. This choice has been motivated byNorway’s strong focus on sustainable development. Indeed, already in its 1989 Long-Term Programme the Norwegiangovernment adopted sustainable development as an overriding goal of economic policy.

ECO/WKP(99)10
7
The policy issues — an overview
What is sustainable development?
5. The 1987 Brundtland Report (UN, 1987) defined sustainable development as “development thatmeets the needs of the present without compromising the ability of future generations to meet their ownneeds”. Concerns over equity between and within generations are central to this definition in particular asthe world’s resources (including global natural resources) are so unequally distributed, but the focus todate has mostly been on inter-generational equity. Hence a policy for sustainable development is typicallydefined as one that leaves future generations with the opportunity to attain similar or higher levels ofwell-being than the present one. In an economic sense, “opportunities” left to future generations dependon the total stock of wealth they inherit, including natural (resource and environmental) capital as well asman-made physical and human capital. “Social capital”, i.e. the whole system of social values andinstitutions, could also importantly influence sustainable development, but is less amenable to economicanalysis and beyond the scope of this paper. Nonetheless, institutional aspects bearing on the setting ofresource and environmental objectives and policies are covered.
6. A key issue is the degree of substitutability of the various forms of capital. To the extent they aresubstitutes, sustainability can be achieved by offsetting a decline in natural capital by a proportionateincrease in man-made capital. This is the “weak” concept of sustainability. The “strong” concept requiresthat some level of the stock of natural capital be preserved under any circumstance. In reality some formsof natural capital are critical for development and can be replaced with man-made capital to only a limitedextent, while others are more fully substitutable. Most non-renewable resources are of the formercategory, as are renewable and environmental resources that are prone to very slow regeneration processes(fishery, forestry, biodiversity, ozone layer, etc.). As long as science is unable to provide reliable rules forsustainable depletion paths or viable alternatives for these forms of natural capital, their depletion couldpresent a high cost for future generations, because of irreversibility.
7. Natural capital other than the non-renewable resources are virtually impossible to value, butskimming the large amount of indicators below suggests that national assets of this sort may havedecreased until the early 1980s and are likely to have risen again since. Market valuations ofnon-renewable resources and man-made capital are to some extent available. According to officialestimates, the decline in oil and gas stocks in recent decades has been outstripped by far by thesimultaneous substantial increase in human, financial and fixed capital (Figure 1). Of these, human capitalhas shown a significant increase, rising from NKr 3.7 million per capita in 1970 (1997 prices) toNKr 4.2 million in 1997, while on current projections it could soar to NKr 7.7 million per capita(1997 prices) by 2050. As discussed in the 1997 OECD Economic Survey of Norway, educationalqualifications of the population in Norway have risen strongly and are now among the highest in theworld. The fact that Norway’s mainland potential output growth has been relatively subdued by OECDstandards in recent decades mirrors the comparatively low rate of return on human capital in the extensivepublic sector, which may be associated with a lack of market scrutiny (OECD, 1997). Nevertheless,overall per capita GDP, including oil and gas output, is close to the top in the OECD.
How to raise wealth accumulation?
8. Sustainable development as defined above constitutes a major goal for policy, but does notnecessarily imply that the welfare of both current and future generations is maximised within theconstraints imposed by sustainability requirements. Cost-effective policies aim to correct market failures,by properly pricing the use of natural capital while prompting cost minimisation by the individual

ECO/WKP(99)10
8
economic actors. Cost-effective policies, moreover, ensure that the extraction of the proceeds from the useof natural capital (the “rent”), and their distribution among present and future generations does notconflict with the objective of optimal allocation. Cost-effectiveness is, indeed, vital to achievesustainability, as it will allow faster wealth accumulation. In this respect, the OECD has always cast its netwidely. Major examples concern the horizontal work on ageing, labour and product markets. ConcerningNorway, in the Economic Surveys, work with a clear connection to sustainable development in recentyears concerned special chapters on the environment, the oil and gas sector, pensions and human capitalformation. In addition, the major aim of the structural surveillance chapters is to analyse structuralconditions and to encourage policies that boost potential output growth.
Policies interact
9. Policy goals can conflict. There is, for instance, a strong emphasis on regional policy in Norway.As part of regional policy, a high degree of agricultural subsidisation not only boosts agricultural output,but also emissions to the soil and air, while the rent of the fishing industry is not taxed because of thedesire to generate income for fishermen. At a minimum the cost of such policies should be madetransparent, so as to be better able to evaluate trade-offs. In many cases, there should also be possibilitiesto design better policies which will reduce distortions, while keeping to the initial goals. Policy goals canalso be mutually reinforcing. Taxing the natural resource rent or environmental externalities providesgovernment revenues which are not distorting and can be used to reduce other taxes, which couldinfluence potential output.
Figure 1. National wealthMillion NKr per capita, 1997 prices
Source: Ministry of Finance, Long-term Programme 1998-2001.
0
1
2
3
4
5
6
7
8
9
10
0
1
2
3
4
5
6
7
8
9
10
1970 1997 2010 2030 2050
Oil and gas wealthFinancial assetsFixed capitalHuman capital

ECO/WKP(99)10
9
Resource management
10. Norway is endowed with major non-renewable and renewable resources. These comprise theimportant crude oil and natural gas resources on the Norwegian continental shelf, a very large hydrocapacity, substantial forest resources and significant fish stocks in the Atlantic Ocean and the North Sea.4
The government is strongly engaged in the management of these resources and, in the case of oil and gas,draws significant rents from it. Yet, it is difficult to design strategies for the sustainable development ofthese resources:
− Since the government is the sole owner of the oil and gas stock, it could, in theory, aim tomaximise the associated wealth by optimising the pace of extraction in view of the expecteddevelopment of oil and gas prices over time. In practice, however, the uncertainty overfuture price developments has been overwhelming and, moreover, the size of the resourceshas been systematically underestimated. The pace of production of oil and gas fields has,therefore, largely been left to market forces, with the government acting as a regulator.
− Since the early 1990s, the government has transformed part of the rent from the developmentof the oil and gas resources into foreign financial capital in order to improve the optionsopen to future generations. In contrast, in the 1970s and 1980s, priority was given toinvesting the rent domestically in physical, in particular infrastructure, and human capital.All along, moreover, the oil and gas rent was also used to expand the public sector andsubsidise economic activities — including most notably fisheries and agriculture.
− In the case of fisheries, property rights are subject to international agreements on sharedstocks and quotas. The imperfect design of these agreements has implied that overfishingproblems have not been resolved. The implementation of quotas in Norwegian waters isembedded in an extensive regulatory framework, which is mainly geared towards achievingsustainable harvesting — with fish stocks recovering since the 1980s — and regional policyobjectives.
Non-renewable resources — oil and gas
Government policies allow market forces to determine oil and gas extraction rates
11. Norway is endowed with a large oil and gas wealth (see Annex), but at current extraction ratesand technology, oil reserves could be exhausted in the next 20 years, while gas reserves are likely to lastmuch longer (more than 80 years). An optimal management of the petroleum wealth involves decisions onthe speed of oil and gas extraction, as well as when and how the rent should be distributed. Thesedecisions are, in principle, separable. The optimal speed of extraction is determined by comparing thereturn on “keeping oil and gas in the ground” to the return from extracting it and investing the rent. Anincome maximising producer will increase extraction if the returns from investing the net proceeds fromadditional oil and gas sales exceed the appreciation of the oil reserves in the ground and vice versa. Theintroduction of uncertainties modifies the optimal extraction rate. For example, the risk of sustained pricedeclines of fossil fuels due to environmental policies, provides an incentive to increase the speed ofextraction. On the other hand, political economy arguments — governments may be short-sighted in theuse of the oil wealth — would argue for a slower speed of extraction.
12. In practice, the Norwegian government has chosen not to steer the extraction rate according tothese text book principles. When production on the shelf started in the 1970s, the dominant view was that

ECO/WKP(99)10
10
reinvesting the oil and gas rent in financial assets was more risky than preserving the petroleum stockitself and hence would not be a viable option. Calls to slow down the issuance of licences in the 1970salso stemmed from inter-generational considerations, while currently such calls are also based on theclimate change issue. The point of view of the early “oil conservation adepts” has been superseded bysubsequent developments: a faster extraction rate than actually realised combined with a policy ofreinvesting the proceeds in securities would have yielded higher returns. After the oil price collapse in1986, the idea of transforming the oil and gas stock into financial capital emerged. The world-wide bullrun on stock markets since the 1980s raised hopes that the conversion of the oil and gas stock intofinancial capital would be very beneficial (see below).
13. Oil and gas resources are state-owned, regulation being based on the Petroleum Act. Licensesawarded by the state give companies the right to explore, produce and sell the resources for a certainperiod of time. Afterwards, ownership reverts to the state, unless the license is extended.5 When issuingacreage licences for exploration, the authorities invite companies who meet high standards of security,solvency and reliability to participate in a consortium. Following new discoveries, production licenses aregranted if exploitation is profitable. Licences are not auctioned off, unlike in some other oil and gasproducing countries in the OECD area, such as the United States (Gulf of Mexico), Canada and Australia.Companies may apply in groups in the Barents Sea and in the North Sea, while they are obliged to applyindividually in the Norwegian Sea. However, the authorities usually grant a joint licence to a group ofcompanies designated to form a consortium also in the Norwegian Sea.
14. In recent years, Norway’s approach to developing oil and gas fields has evolved in a number ofareas, providing a clearer distinction between government regulatory functions and those of commercialoperators, including the state-owned ones. In particular, the government has reduced its directinvolvement in the set-up of consortia for field development. Some of the changes are related to the needfor compliance with competition rules of the European Economic Area (EEA), and some are aimed atproviding incentives for exploration and development in frontier regions.6 The joint applications forblocks in the Barents Sea in 1997 and in the North Sea in 1999, rather than the government designatingthe consortia (so-called “arranged marriages”) is a reflection of the evolution of Norway’s policy in thisregard. Moreover, from the 1996 15th licensing round, the state-owned operator Statoil is no longerawarded an automatic share of every license (see Annex).7 The price of crude oil is determined in theglobal market, and the government does not directly control exports of oil (apart from adhering to oilsanctions decided by the United Nations [UN]). There are no quotas, tariffs, product or crude restrictions.
15. The authorities have argued that the strong state involvement in gas sales and contract allocationcan be justified by the fact that there is a need for co-ordination of the development of gas fields and gaspipelines due to economies of scale, in order to make gas development economically viable and to ensureoptimal resource management. Recently governments in a number of EU countries have stated that theyare opening up their local energy markets to increased competition, and the current structure of the EU gasmarket may change significantly as a result — i.e. become more “atomistic”. This could have a substantialimpact on Norway’s market for future gas sales. It is, thus, important for Norway to keep under review theexisting structure for gas transport and sales so that it is consistent with good resource management andchanging market conditions. Such a review could provide an assessment of the pros and cons of differentways of managing the gas transportation grid and negotiating gas contracts.
The government increasingly transforms the oil and gas wealth into financial capital
16. The stock of oil and gas in the continental shelf represents a large source of wealth. In managingthis wealth, the Norwegian authorities have aimed to: i) channel a substantial part of the revenues
ECO/WKP(99)10
11
originating from the production of oil and gas through the budget to ensure that the whole society benefitsfrom it at a given point in time; and ii) preserve an equitable share of these revenues for future generationsthrough the build-up of public assets.8 In line with these objectives, the government has set up anextensive welfare system while ensuring a comfortable net asset position. In this respect, Norway is aunique case in the OECD area. However, as has been highlighted in previous Economic Surveys, vigilanceis needed as the projected fall in oil production in the first half of the next century will coincide with anexpected increase in public welfare expenditure as the population ages.
17. Significant revenues accrue to the government due to the transfers of net income from the State’sDirect Financial Interest — the SDFI — and the special tax regime applying to oil companies, includingthe fully state-owned company Statoil (see Annex). In the past, government revenues stemming from theoil and gas sector have shown large swings (Figure 2). In recent years, for instance, they soared from 3 percent of GDP in 1994 to 8 per cent in 1997, before plummeting to an estimated 4 per cent in 1998 in thewake of the recent oil price collapse.
18. Producers of petroleum earn a rent as profits will exceed average profits in other industriesbecause they are given access to a scarce resource.9 In principle, all the oil and gas rent should accrue tothe government. The government can achieve this via the auctioning of licenses, taxation or by developingthe resources on its own behalf. In practice, the Norwegian approach aims at extracting the rent viataxation and by the use of the SFDI. Estimates by Statistics Norway, however, indicate that about 80 percent of the cumulative rent accrued to the government between 1980 and 1995. An alternative would be tocombine these instruments with auctioning of exploration rights. This would also partly transfer the riskconcerning the flow of oil revenues away from the state to the producers and reduce taxationnon-neutralities associated with the need to maintain two different tax regimes: offshore and onshore (seeAnnex). However, it is also very important for the companies to have the right balance between risk andreward. Higher price risk for companies associated with auctioning could imply a lower level ofexploration, while the government’s tax system spreads the risk over a large number of wells.
19. The view that not only present but also future generations should benefit from the oil and gasactivities has led to the estimation of the remaining “petroleum wealth in the ground”, both of the nationas a whole and the part which accrues to the government in the form of future petroleum proceeds — roughly 80 per cent of the total. Estimates of the petroleum wealth have tended to be volatile as they arevery sensitive to oil price developments: in the 1980s and 1990s, they have varied between half and2½ times GDP.10 Until the mid-1990s such wealth estimates were used to set rules for the amount ofspending out of government petroleum revenues that would not affect the wealth position of futuregenerations. For example, the revised national Budget of 1992 stipulated that the non-petroleum deficit(the fiscal balance excluding petroleum revenues) should not exceed the implicit return on the assessedvalue of the remaining petroleum wealth, estimated at the time to be in the range of 5 to 7 per cent ofmainland GDP.
20. Such rules of thumb have received less attention in recent years as the non-oil fiscal deficitvirtually disappeared. Instead, budgets routinely include “generational accounts” as a way to assess theinter-generational distribution of government policies, including petroleum proceeds.11 These accountssuggest that, on current demographic projections, social transfers and government services such as health,pensions and education, major inter-generational imbalances are unlikely to emerge. Such estimates are,however, very sensitive to the underlying assumptions with regard to the oil price and the projected socialexpenditure entitlements.

ECO/WKP(99)10
12
Figure 2. Net petroleum revenues of the government
Source: Ministry of Petroleum and Energy, and OECD Secretariat.
-20
0
20
40
60
80
100
120
140
160
-20
0
20
40
60
80
100
120
140
160A. Source of revenue NKr billion
Projections
1980 82 84 86 88 90 92 94 96 97 98 2000 2005 2010
Corporate taxSpecial taxRoyalties and area fees
Carbon dioxide taxNet cash flow, SDFITotal taxes and royalties
0
5
10
15
20
25
30
35
40
0
5
10
15
20
25
30
35
40
1980 81 82 83 84 85 86 87 88 89 90 91 92 93 94 95 96 97 98
B. Total revenues
As a per cent of GDP
As a per cent of generalgovernment current receipts
-10
-5
0
5
10
15
-10
-5
0
5
10
15
1980 81 82 83 84 85 86 87 88 89 90 91 92 93 94 95 96 97 98
C. General government balances Per cent of GDP
Net lending
Net lendingexcluding oil receipts

ECO/WKP(99)10
13
21. The preservation of petroleum wealth for future generations calls for a vehicle for transmissionof the wealth to future generations. While the government had accumulated significant financial assetsprior to the adverse oil-price shock in 1986, it was reluctant to create a fund, but finally established theGovernment Petroleum Fund in 1990. It initially remained empty due to the recession, but the favourablefiscal outcomes later on prompted the government to start transferring assets into the Fund in 1996. Bydesign, the annual allocations to the Fund correspond to the fiscal surplus of the central government, andhave been of the order of 5 per cent of GDP per year. As a result, by mid-1998 the capital in the Fundamounted to a market value of NKr 136 billion, or 14 per cent of GDP and is officially projected to growto NKr 600 billion (close to 46 per cent of GDP) by the year 2002.12 The Fund, as currently managed bythe central bank in co-operation with external fund managers, invests exclusively in foreign currencydenominated assets in order to: i) offset the impact of the currency inflow associated with oil exports onthe exchange rate; and ii) avoid the risk of a combined fall in oil prices and the market value of domesticassets, as many domestic asset values are highly correlated with the oil price.
Renewable resources — fisheries and forestry
Fisheries
22. Norway is the tenth largest fishing nation in the world and the third largest in the OECD, afterthe United States and Japan13 (Figure 3). Norway is, moreover, the world’s leading producer of farmedAtlantic salmon (serving 50 per cent of the world market). The bulk of Norwegian fish is exported:Norway is the second largest seafood exporter in the world, following Thailand. The fishing industry,including the fish-farming industry, is Norway’s second-biggest export industry — but it represents onlyone-tenth of oil and gas exports. Other key features of the Norwegian fishery sector are the limitedprocessing activities, which are small scale and decentralised, the remoteness from markets (and closenessto resources); and its seasonal character. Fishery activities involve 50 000 workers (2¼ per cent of totalemployment), including fishermen, fish farmers, workers in processing plants and marketing agents. Thefishing industry underpins the coastal area’s economic activity, including private and public services. Thetotal catch has grown considerably during the 1990s, from a trough of 1.6 million tonnes in 1990 to2.8 million tonnes in 1997 even though the number of fishermen has continued its long-run decline.
23. Fish catches in Norway are constrained either by nationally fixed targets or by theinternationally-agreed Total Allowable Catches (TACs) to prevent overfishing — i.e. the collapse ofharvestable stocks.14 These TACs are based on scientific research of the size and age composition of eachstock as well as changes in migratory patterns, although the estimates have not been very robust to date.International agreements have increasingly been used to settle disputes concerning the distribution ofTACs for such species as the Atlantic herring, which migrates seasonally and unpredictably between theNorwegian, Faeroese and Icelandic 200 mile exclusive economic zones as well as the “Ocean Loop”outside the 200 mile zones.15 Apart from the international Atlantic Herring Agreement, Norway hasbilateral agreements with Russia and the EU on the sharing of fish stocks. For herring, for example, thesecond most important species for Norwegian fisheries, the country received 57 per cent of the Atlanticherring quota in 1997 while the rest was distributed among the EU countries, Russia, Iceland and theFaroe Islands. The use of TACs to limit fishing in the North Atlantic region remains the dominantmanagement tool. They do not, however, avoid incidental catches of unwanted fish of other species andyoung fish, or of illegal “black-fish” landings. Overfishing in the North Sea remains a serious problem, asseveral species have almost been driven to extinction and the ecosystem is severely damaged, as reflectedin increasing fishing mortalities. The tendency towards overfishing in this region is heightened by theovercapacity in the European fishing fleets. Indeed, both in the EU and in Norway, over-capacity isconsidered to be the single most urgent issue hindering the transition towards sustainable fisheries.16

ECO/WKP(99)10
14
Overall, existing fishery control policies and measures are either inadequate or not sufficiently enforced.17
Despite failures, the overall resource and economic situation of the Norwegian fishing industry hasimproved. Some fish stocks have been rebuilt, for instance, Atlantic herring from practical extinction inthe late 1960s to the biggest North Atlantic fish stock in 1997, while government financial transfers to thefishing industry peaked in 1981 (at 25 per cent of the export value) and has been reduced to practicallyzero in 1997.
24. The right to fish in the Norwegian 200 mile zone by Norwegian fishermen, is based on a quotasystem to allocate the TACs, managed by the Ministry of Fisheries.18 The Norwegian quota system allowsa fleet of traditional small fishing boats to operate alongside a fleet of larger and capital intensive ships(trawlers and purse seine vessels), with small vessels receiving the largest quotas in proportion to theircapacity. In addition, vessels registered in the remote northern counties enjoy a favoured treatment. Thequotas require renewal from the ministry each year and are not transferable at the sale of fishing boats andships. Since 1996, however, owners who agree to withdraw a vessel from the fleet in perpetuity have beenallowed to allocate part of their quota to the remaining fleet for a period of 13 years in order to achievescale economies. This has induced owners of bigger vessels to buy smaller ones in order to combine twolicenses for one ship, and has sparked a sharp price increase of ships with a license. While contributing togreater cost effectiveness, this system implies that the increased rent is reaped exclusively by the fleetowners. Not surprisingly, the current system of allocating the annual fish quotas for free among owners onthe basis of historic rights is debated. A system of auctioned and freely tradeable quotas would allow afurther re-allocation of production to the most efficient suppliers and would transfer the rent to the publiccoffers. These objectives could also be achieved by other means, for instance, tradeable licences and feesor resource taxes. The rent is currently estimated to be of the order of NKr 1.5 billion, if fisheries weremanaged in an efficient way. Given the inefficiencies generated by the current set-up, the actual rent isprobably much smaller.
Figure 3. Fish catches in OECD countriesPer cent of total world catch, 1996
1. Marine catches of fish, crustacea and molluscs.Source: FAO Fisheries Department, 1998.
0
1
2
3
4
5
6
7
0
1
2
3
4
5
6
7
1
JPN USA NOR KOR ISL DNK MEX ESP GBR CAN FRA TUR NZL SWE NLD ITA IRL POL PRT DEU AUS GRC FIN

ECO/WKP(99)10
15
Forestry
25. Forests cover 37 per cent of the Norwegian land area, with 80 per cent privately owned. Aftersuffering from excessive harvesting, the volume of timber has doubled since 1900. Since 1920, the aim ofpolicy has been to increase the forestry resources and to improve their condition. More recently, policyhas focused on environmental aspects, in particular biodiversity. Employment considerations in rural areasalso play an important role. The measures to achieve these objectives include legislation, taxation,financial support and training. The authorities justify subsidisation by the very long growing period fortrees in Norway (70 years on average). Subsidies have decreased in nominal terms since 1990 (fromNKr 350 million to NKr 250 million). Over-harvesting is not an issue and there were only marginalchanges in forest area over the last decade.
Environmental management
26. Norway probably has the most extensive framework for environmental policy of all countries inthe world:
− It was among the first countries to establish a Ministry of Environment, in 1972. Theministry is responsible for identifying environmental problems, assessing and reporting onenvironmental trends and proposing cross-sectoral measures and national goals. It is assistedby several environmental management bodies under its authority, including the importantState Pollution Control Authority which, pursuant to the Pollution Control Act of 1981, ruleson emission permits for industrial activities and monitors compliance, either directly or onthe basis of annual environmental reports of companies that have set up their own emissioncontrol and monitoring procedures. In clear cases of violation, companies are prosecuted andfined and profits may be confiscated.
− Co-ordination on environmental matters is supported by various inter-ministerialcommittees, that aim to: i) establish a common knowledge base on the environmental effectsand their valuation in a wide range of policy areas, and ii) ensure that this knowledge feedsthrough into official policy proposals.19 Such co-ordination is important so that, as far aspossible, policy objectives of other ministries do not conflict with environmental goals. Inparticular, government support to economic activities in environmentally vulnerable remoteareas, including fishery, agriculture, mining and heavy industries, have been susceptible tosuch conflicting goals.
− In the late 1980s, the Ministry of Environment, in co-operation with the Ministry of Finance,established a framework for an annual document annexed to the National Budget examiningthe “Environmental Profile of the State Budget”, identifying all expenditure items that arewholly or partly motivated by environmental policy objectives. For this purpose, thespending ministries have been asked to classify outlays by “result areas”, i.e. according tothe environmental policy goals they should help achieve. There are no attempts to calculate a“green Net Domestic Product” (GDP corrected for depreciation of natural capital). However,environmental expenditure was estimated in the OECD Environmental PerformanceReview 1993, showing outlays of 1.2 per cent of GDP.
27. The main body of environmental legislation was established in the 1970s and early 1980s. Mostimportantly, the Pollution Control Act of 1981 and subsequent amendments instituted integrated pollutioncontrol for all stationary sources (industry, agriculture, municipalities and the continental shelf), endorsing

ECO/WKP(99)10
16
four main principles: i) avoid irreversible developments and decisions (precautionary principle); ii) givepriority to prevention over restoration; iii) assess the environmental properties of products at all stages,including their production, use and disposal; iv) seek cost-effective solutions. The Act contains provisionson implementation, enforcement, inspection, penalties for non-compliance, civil fines and compensationfor environmental damage. Polluters must meet regulations, respect limits set by emission permits or paytaxes on certain emissions. Moreover, the Constitution was amended in 1992 to include considerationsrelating to the right to a clean environment and natural resource management, and several new Acts werelegislated.
28. Since the early 1990s, an ongoing evaluation effort of environmental policies has beenundertaken. The government has mandated several high level committees to investigate ways to improvethe policy framework. In 1992, the Environmental Tax Commission published its report “Towards morecost-effective environmental policies in the 1990s: principles and proposals for better pricing of theenvironment” (Ministry of Finance, 1992). The report called for a differentiation of several environmentaltaxes to better take account of polluting substances contained in fuels and other products, in order toenhance the cost-effectiveness of these tax measures. This was followed up by the Environmental PolicyInstruments Committee (Ministry of Environment, 1995a), which recommended to improve thecost-effectiveness of a wide range of environmental policies. The Green Tax Commission established in1994 released in 1996 its report “Policies for a better environment and high employment” (Green TaxCommission, 1996). It suggested ways to capture better the “rent” from the use of natural capital. Itrecommended, inter alia, to impose a rent tax on hydro power stations, which was actually implementedin 1998, and to examine the possibility of auctioning emission and catch quotas. It also proposed changesto a number of existing environmental taxes, most prominently to extend the carbon dioxide (CO2) tax toall sources exempted to date, and to introduce new environmental taxes, inter alia on waste. Being a largenet importer of air-borne pollution and a small open economy, Norway has a clear interest in internationalco-operation and co-ordination of environmental policies and the country has been very active in thisregard. Indeed, the implementation of, and compliance with international agreements figures very high onthe political agenda.
29. The extensive institutional framework for environmental policy has helped to integrate policiesand to build a consensus about the need to make these amenable to sustainability in the long run.However, there remains considerable scope for improvement, which may not be easy to achieve sincepolicies pursuing sustainability in the long run can conflict with vested interests in the short run.
Global environmental problems
Climate change
30. Norway has been one of the main proponents of putting climate change on the internationalagenda and has actively participated in the conclusion of the Kyoto Protocol for reducing greenhouse gasemissions (see Box 2). Prior to the Protocol, moreover, Norway was one of the five countries toimplement a carbon tax to curb CO2 emissions which are the main source of climate change. Norway’sactive stance on climate change policies may seem at odds with its small contribution to globalgreenhouse gas emissions and its interests as a major oil and gas exporter (even though its hydropowerindustry would benefit from increased demand for clean energy sources). However, irreversible change inthe earth’s climate is an important preoccupation of the Norwegian people, even though the country is notparticularly vulnerable to a sea level rise.

ECO/WKP(99)10
17
Box 2. The Kyoto Protocol
As a follow up to the 1992 Convention on Climate Change at the Earth Summit in Rio de Janeiro, it wasdecided to hold a Conference in Kyoto in December 1997 to agree on legally binding quantitative targets. The resultwas a protocol which involved the following major provisions:
− Annex I group countries (OECD countries except Mexico, Korea and Turkey, plus Russia, Belarus and thecountries of central and eastern Europe) will cut their greenhouse gas emissions by at least 5 per cent relative tothe 1990 level in the 2008 to 2012 period. The reduction commitments are differentiated by country, but theprotocol mentions that they can be met individually or jointly. The reduction targets range from an increase inemissions of 10 per cent in Iceland to reductions of 8 per cent in the European Union. Norway is one of the fewcountries that has been granted an increase in greenhouse gas emissions (1 per cent relative to 1990 outcomes),with the rationale that Norway’s relatively clean system of power generation (hydro power), leaves limited scopefor further reductions in CO2 emissions at reasonable cost. The Protocol covers a basket of six greenhouse gases:carbon dioxide (CO2), methane (CH4), nitrous oxide (N2O) and three synthetic fluorinated compounds (SF6, HFCsand PFCs).
− The Protocol allows for emission trading and joint implementation among Annex I countries. Emission reductionscan be “banked” in the sense that countries that more than meet their commitments in the “first commitmentperiod” (2008-12) can use the surplus reductions for future commitment periods (to be defined). In addition, theProtocol contains a provision whereby abatement investments in a non-Annex I country financed by an Annex Icountry could count against the target of the latter (Clean Development Mechanism) but rules for such amechanism are yet to be defined. Similarly, to some extent changes in a country’s absorption of CO2 emissionsdue to a change in its land use and forest surface, would count against its abatement requirement set by theProtocol.
− The Protocol will enter into force 90 days after 55 Parties accounting for 55 per cent of total CO2 emissions ofAnnex I countries in 1990 have ratified it. Future meetings will define rules and guidelines for emission trading;ways to verify compliance with agreed commitments; and other specific rules for implementation of the Protocol.
31. As in most countries, carbon dioxide is by far the most important greenhouse gas emitted inNorway, accounting for 70 per cent of total emissions in 1996. Norway is a median OECD country whenit comes to CO2 emission per capita, and in the lower range with regard to emission per unit of GDP — inpart reflecting the mainland economy’s reliance on hydro power (Figure 4, Panels A and B). Theextraction and transportation of oil and gas on the continental shelf generate large greenhouse gasemissions (Figure 4, Panel C). Hence, the decline in CO2 emission per unit of GDP achieved since theearly 1980s is remarkable in view of the soaring oil and gas production, and reflects strong improvementsin energy efficiency. Carbon dioxide emissions have, nevertheless, continued to rise in absolute termssince 1990. As concerns other greenhouse gases, Norway has significantly reduced the emissions ofperfluoridised carbons (PFCs) and sulphur hexafluorides (SF6) in the aluminium and magnesiumindustries to a considerable extent due to the implementation of “no-regret” measures which werefinancially beneficial as well (Figure 5). By contrast, emissions of hydrofluorocarbons (HFCs) have beenincreasing since 1990 due to the banning of the ozone-depleting gases (chlorofluorocarbons [CFCs] andhydrochlorofluorocarbons [HCFCs]). Nitrous oxides and methane emissions have been roughly stable inthe same period.

ECO/WKP(99)10
18
Figure 4. Carbon dioxide emissions
1. Using 1991 prices and purchasing power parities.2. Average excluding eastern Germany, Czech Republic, Hungary and Poland.Source: IEA (1998), CO Emissions from Fuel Combustion; OECD Environmental Indicators 1998; Statistics Norway and OECD Secretariat.
28.2%
Oil and gas production
16.1%
Heating17.0%
Industrial processing
23.6%Road traffic
14.1%
Other mobile sourcesOther
C. By source 1996
0.4
0.5
0.6
0.7
0.8
0.9
1.0
1980 82 84 86 88 90 92 94 96
A. Per $ of GDP Kilogrammes CO2
2
1
2
NORWAY
OECD
6
7
8
9
10
11
12
13
1980 82 84 86 88 90 92 94 96
B. Per capita Tonnes CO2
2
NORWAY
OECD

ECO/WKP(99)10
19
Figure 5. Projections for greenhouse gas emissionsMillion tons CO -equivalents
Source: Ministry of Finance and State Pollution Control Authority.
0
10
20
30
40
50
60
70
80 A. Total and principal gas emissions
2
Total
CO2
CH4
1990 1996 2000 2005 20100
1
2
3
4
5
6
7B. Other gas emissions
N O2
PFCs
SF6
HFCs
1990 1996 2000 2005 2010
32. Under the Kyoto Protocol, Norway has been permitted a 1 per cent increase in greenhouse gasemissions in the period 2008 to 2012 relative to the 1990 outcome, while the national baseline projectionpoints to an increase of 23 per cent. Thus, a reduction of 18 per cent from the baseline will be required.The rise in the baseline scenario is mainly due to increasing carbon dioxide emissions (Figure 5). Oil andgas production is largely responsible for the bulk of the projected increase. The rest of the expectedincrease in CO2 emissions stems from mainland economic growth, changes in production structure and thepossible introduction of gas-fired power generation.20 The emissions of the other greenhouse gases areexpected to remain broadly stable in aggregate, but this masks diverging tendencies among them. Inparticular, methane emissions from waste deposited in landfills and animal manure are expected to fallwhereas emissions of HFCs will continue to increase as ozone-depleting gases are phased out.21
33. The key climate policy instrument used to date is the carbon dioxide tax introduced in 1991. Thetax rate differs across fossil fuel category and geographic location of the activity (mainland and offshore),see Table 1. Process emission from several export-oriented mainland manufacturing industries, such as theferro-alloy, aluminium, fertiliser, petro and other chemicals industries have, moreover, been exempted.Exemptions are also granted to the fishing fleet, aviation, coastal shipping of goods and internationalshipping.22 As a result, only about 60 per cent of CO2 emissions are subject to the tax, and only about20 per cent of emissions from manufacturing. The exempted manufacturing sectors are all heavyCO2 emitters and most of them are strongly exposed to international competition. Similar arrangementsexist in the other countries with a CO2 tax, and are motivated by concerns over internationalcompetitiveness of individual firms. In Norway such concerns are heightened by the aim to maintain

ECO/WKP(99)10
20
Table 1. CO2 tax structure and coverage1 January 1998
Memorandum:
Tax rate1Tax per ton of CO2 emission
As a per cent of total CO2 emissions
NKr in 1995Mainland
Petrol 0.890 384 13.8
Mineral oil Heavy oil 0.445 143 23.8 Light oil 0.445 168 Pulp, paper and herring meal 0.222 n.a.
Air transport .. .. 11.7 Shipping of goods2 .. .. Supply fleet in the North Sea .. .. Shipping fleet2 .. ..
Coke and coal Coal used for energy purposes 0.445 183 0.4 Coke used for energy purposes 0.445 382
Production of cement and leca .. .. 1.3 Coke and coal used for non-energy purposes .. .. 13.3
Gas .. .. 7.5
Offshore
Oil 0.890 336 18.9Gas 0.890 382
1. NKr/l for petrol and mineral oil; NKr/kg for coke and coal; NKr/scm oe for offshore oil and gas.2. Coastal fishing and coastal goods transport are fully compensated for the CO2 tax paid on fuel oil consumption.Source: Ministry of Finance, St prp nr 54 (1997-98), Grønne skatter, Oslo.
industrial activities in remote areas — CO2-intensive industries being particularly important there. Asnoted by the Green Tax Commission, it is difficult to avoid a loss in competitiveness in individual sectors,but this could be offset by overall tax reductions in a revenue-neutral tax reform package.23 It also pointedout that structural change is the inevitable consequence of the introduction of a CO2 tax, as its basic aim isto change industrial structures and consumption patterns. An introduction of a relatively high andbroad-based carbon tax could prove costly if similar policies are not adopted by a significant number ofother countries, e.g. in the framework of internationally binding commitments. This could implyadjustment in the medium term which may prove undesirable in the long term, if other countries introducesimilar measures later on. The industry argues that, in addition, the closing and relocation ofCO2-intensive production to other countries resulting from such a unilateral broad-based CO2 tax would beineffective in terms of reducing global emissions. Norwegian companies prefer “voluntary agreements”with the government to reduce greenhouse gas emissions over a CO2 tax. One exempted industry

ECO/WKP(99)10
21
(aluminium) has recently concluded such an agreement.24 As with all such agreements, the governmentlacks a legal basis to enforce them.
34. Taxes on fossil fuel consumption typically take the form of excise duties and value added tax(VAT), and represent up to 70 per cent of the market price (Figure 6). Although these taxes do notprimarily aim at reducing emissions, they provide the same type of incentive as the CO2 tax, even thoughthey do not take into account the emission content of the fuel. Taxes are lowest for fuel consumption inindustry and highest for car fuels, mostly affecting households. Whereas other tax elements on mineral oilproducts have been eliminated in steps after the introduction of the CO2 tax, the taxation of petrol hasincreased. Norway, therefore, has a relatively high level of petrol tax compared to the North American andPacific OECD countries although it is in line with the European average (Table 2).25 By contrast, thepurchase tax on cars is high compared to other European countries and since 1996 has been differentiatedaccording to car weight, engine output and engine volume.
35. The size of the impact of CO2 and related taxes on the emission of greenhouse gases is uncertain.A study by Statistics Norway suggests that the CO2 tax may have reduced CO2 emissions from households,transport and stationary sources by 3 to 4 per cent in the period 1991-93. There is, moreover, evidencesuggesting that the CO2 tax has prompted lower CO2 emissions on the Norwegian continental shelf byencouraging the use of energy-efficient gas turbines and the replacement of pilot flames for flaring byelectronic ignition systems.
36. Even if the CO2 tax may have contained growth in CO2 emissions, studies by the EnvironmentalTax Commission in 1992 and the Green Tax Commission in 1996 show that the structure of the carbon taxshould be adapted to raise cost-effectiveness. The exemptions and the weak link between the rates oftaxation and the carbon content of products imply that the incentives for reducing carbon emission areweakest in industries where marginal abatement costs are lowest. The overall cost of meeting a givenCO2 reduction target, therefore, tends to be too high — in any case higher than if the tax were levied inproportion to carbon emissions and applied across the board.26 The majority in the Green Tax Commissionthus advocated a rapid change to a carbon tax system without exemptions. The weak incentives foremission reduction in the exempted sectors is also conflicting with goals of stimulatingenvironmentally-friendly technological change and may lead Norwegian households and businesses tomove towards more polluting economic activities. Although they are probably of less importancecompared to environmental policies per se, some transport subsidy schemes provided to agriculture, thefisheries and petroleum products used in remote areas as part of regional policy were also identified by theGreen Tax Commission as environmentally harmful.
37. Policies focusing on curbing emissions of methane have relied essentially on changing wastetreatment, as waste disposal in landfills has been the main source of rising emissions in recent years. Since1994, landfills generating large amounts of combustible gas have been equipped with systems to extractgas for heating purposes or flaring, a technology which has proved successful in reducing emissions.Limiting landfilled waste through greater emphasis on separation, recycling, composting and incinerationof waste will also contribute to reducing methane emissions. By contrast, methane emissions from animalsin agriculture have not been tackled to date, and the shift from production-related subsidies to subsidiesper animal are unlikely to lead to an improvement. Nor have the authorities established policies to reduceemissions of the other greenhouse gases, apart from a voluntary agreement with the aluminium industry toreduce emissions of PFCs, even though the abatement costs per CO2 equivalent of these other gases maybe lower than for CO2. The authorities have, however, for many years had a close dialogue with industriesincluding the possibility to reduce these emissions.

ECO/WKP(99)10
22
Figure 6. Prices and taxes for fuel oil and petrolNKr per litre
1. Automotive diesel for non commercial use.Source: IEA (1998), Energy Prices and Taxes and OECD Secretariat.
0
2
4
6
8
10A. Light fuel oil for households
1990 91 92 93 94 95 96 970
2
4
6
8
10B. Light fuel oil for industry
1990 91 92 93 94 95 96 97
0
2
4
6
8
10C. Premium unleaded petrol (95 RON)
1990 91 92 93 94 95 96 970
2
4
6
8
10D. Diesel 1
1990 91 92 93 94 95 96 97
2Base price Excise tax Sulphur tax CO tax VAT

ECO/WKP(99)10
23
Table 2. Petrol prices and taxes in international comparisonUS$ per litre,1 1996
Diesel fuel Unleaded premium
Price excluding
taxTax
Price including
tax
Price excluding
taxTax
Price including
tax
Norway 0.26 0.32 0.58 0.22 0.58 0.80
Austria 0.22 0.24 0.46 0.23 0.46 0.70Belgium 0.22 0.26 0.48 0.21 0.56 0.77Denmark 0.20 0.15 0.35 0.20 0.46 0.66Finland 0.21 0.24 0.45 0.20 0.60 0.80France 0.18 0.32 0.50 0.17 0.67 0.84
Germany 0.18 0.26 0.44 0.18 0.49 0.67Greece 0.20 0.27 0.48 0.23 0.50 0.73Ireland 0.46 0.34 0.80 0.28 0.53 0.81Italy 0.25 0.41 0.66 0.26 0.72 0.98Luxembourg 0.19 0.22 0.41 0.20 0.37 0.57
Netherlands 0.31 0.29 0.60 0.23 0.60 0.83Portugal 0.29 0.41 0.69 0.31 0.76 1.07Spain 0.25 0.31 0.56 0.26 0.54 0.80Sweden 0.25 0.23 0.48 0.19 0.52 0.71United Kingdom 0.20 0.47 0.66 0.18 0.58 0.76
Australia 0.20 0.08 0.28 0.22 0.27 0.50Canada 0.23 0.16 0.39 0.22 0.21 0.42Czech Republic 0.45 0.48 0.93 0.54 0.85 1.39Hungary 0.35 0.63 0.98 0.38 0.72 1.10
Japan 0.14 0.17 0.31 0.24 0.29 0.53Mexico 0.35 0.05 0.40 0.47 0.07 0.54New Zealand 0.24 0.00 0.25 0.27 0.25 0.52Poland 0.35 0.21 0.55 0.32 0.47 0.79
Switzerland 0.11 0.31 0.42 0.15 0.33 0.48Turkey 0.36 0.57 0.93 0.44 0.85 1.29United States 0.18 0.10 0.29 0.24 0.09 0.33
1. 1991 prices and PPPs.Source: IEA-OECD.

ECO/WKP(99)10
24
38. In April 1998, the government proposed a reform of environmental taxes which was only partlyendorsed by parliament. The proposal comprised the following measures:
− To introduce a CO2 tax of NKr 100 per ton of CO2 for the previously exempted sectors in linewith the recommendations of the Green Tax Commission. The processing industries(aluminium, ferro-alloy, carbides, etc.), however, would be granted a flat rate compensationper ton of output for carbon emissions unrelated to combustion.27 Fisheries and air transportwere also to be compensated. The compensation schemes aim at avoiding a fall inprofitability, but do not undo the incentives for CO2 emission abatement. The compensationwas proposed to be gradually phased out after the entry in force of the Kyoto Protocol, andto be abolished by 2010.28
− To introduce a tax of NKr 300 per ton of waste delivered to landfills or combustion plants inorder to reduce methane emissions.29
− To exempt investment in renewable energy sources (biofuels, windmills and heat pumps)from the 7 per cent investment tax, and to remove the exemption of the automobile diesel taxon diesel oil used in buses, with a compensation scheme for bus services to avoid negativeeffects on public transport.
39. The proposed extension of the CO2 tax to the exempted mainland industries met strongopposition in parliament, which decided to limit the extension of the tax to air traffic (with acompensation), cargo shipping in coastal waters and shipping activities on the continental shelf.Parliament also requested the government to appoint a special Committee to prepare a national system oftradeable emission quotas, and proposed a CO2 emission reduction target of 30 per cent for the currentlyexempted mainland industry for the 1990-2010 period (corresponding to 12 per cent for the economy as awhole). This Committee, which should report by the end of 1999, is mandated to examine several options,as a minimum including the introduction of tradeable emission quotas in mainland processing industries,currently exempted from CO2 tax.30 The domestic quota system shall be linked to the Kyoto-mechanisms.In addition, a choice needs to be made between handing out emission quotas for free — which amounts toa subsidy from other parts of society — or to capture part or all of the “resource rent” by selling the quota,either at a pre-set rate or through auctioning or tendering.31 Parliament endorsed the government proposalson diesel, waste and tax exemptions for renewable energy sources. Since the reform is intended to berevenue neutral overall, the net proceeds should slightly reduce non-environmental income taxes.32
40. Even if Norway could achieve the target of reducing CO2 emissions by 30 per cent in mainlandindustry by 2010, this would not suffice to comply with the Kyoto target. In fact, to achieve it through abroad-based CO2 tax would impose a significant burden on the economy, as this would require anestimated tax rate in the range of NKr 250 to NKr 350 per ton of CO2, a level which is currently attainedonly in the offshore oil and gas sector and for car petrol.33 Such a tax rate would dwarf the theoreticalworld-wide quota price of NKr 125 per ton of CO2,
34 reflecting the much higher abatement costs inNorway. On the other hand, a CO2 tax would also have ancillary benefits by leading to reductions in otherpollutants. Norway would greatly gain from buying CO2 emission quotas abroad if that were possible.Indeed, the Ministry of Finance estimates, in a partial exercise that does not include the response of othersignatories, that attaining the Kyoto targets by using emission trading and other “flexibility mechanisms”(investing in clean-up projects abroad to obtain additional emission rights) would reduce the annual costsof compliance with Kyoto to a third (from 0.6 to 0.2 per cent of GDP), compared to the mostcost-effective domestic solution (Table 3).

ECO/WKP(99)10
25
Table 3. Macroeconomic effects in 2010 of meeting the Kyoto Protocol obligationsIn million tons CO2 equivalents as compared to the reference scenario
Scenario 1 Scenario 2
Cost-effective using flexible mechanisms
Cost-effective domestic solution
Total greenhouse gas emissions 68.1 68.1
Reduction in non-CO2 greenhouse gases 3.7 4.2
Reduction in CO2 1.5 8.1
Emission reduction abroad through different flexibility mechanisms 7.1 0.0
Total yearly costs1 (1997 billion NKr) 2.0 6.0
1. Change in real net disposable income in Norway compared to the reference scenario as a result of: abatement and adaption costs in reducing CO2 emissions, abatement costs in reducing emissions of other greenhouse gases and costs following the use of the flexibility mechanisms.Source: Ministry of Finance.
41. If all signatories to the Kyoto agreement were to faithfully implement reduction targets, thiscould have a considerable effect on the oil and gas price. The impact is highly uncertain, however. Itwould, for instance, strongly depend on whether countries implement cost-effective policies or not. In apartial exercise, excluding Norway’s response to climate change, contained in the Long-term Programme1998-2001, it was assumed that crude oil prices could fall by 15 to 20 per cent in 2010, while gas priceswould not be influenced. Such an oil price fall would reduce real national income by NKr 15 to 20 billion.Adding the two partial exercises suggests that the overall income loss could be more than 2 per cent ofGDP, thus imposing a heavy burden on the economy.
Ozone depletion
42. Subsequent to the Montreal Protocol signed in 1987 and revised in 1995, Norway has reducedand gradually eliminated consumption of all substances susceptible to depleting the stratospheric ozonelayer protecting the earth from UV radiation. The most important ozone-depleting substances arechlorofluorocarbons (CFCs) and halons which are used mainly in cooling systems, dry cleaning andfire-extinguishers.35 National regulations in Norway imply a faster phasing out for several substancesrelative to the Protocol’s timetable, in line with EU regulation.36 As a result, the imports ofnewly-produced halons and CFCs have been entirely eliminated, while recycled substances are stillaccepted.37 The tight timetable required strict regulation and reduced the scope for the use of economicinstruments such as a tax.38 However, a tax to meet the reduction targets for ozone-depleting substanceswith a longer phasing out period — e.g. extending to 2015 for HCFCs — is being considered.

ECO/WKP(99)10
26
Figure 7. Emissions to air
1. Or latest year available.Source: Statistics Norway, OECD Environmental Indicators 1997 and OECD Secretariat.
20
40
60
80
100
120
140
160
180
200
220
A. Norway 1980 = 100
1980 82 84 86 88 90 92 94 96
2SO
NOx
VOCs
20
40
60
80
100
120
140
160
180
200
220
B. OECD average 1980 = 100
1980 85 90 95
SOx
NOx
0 20 40 60 80 100 120
Czech Republic
Canada
Hungary
Poland
United States
Spain
Ireland
United Kingdom
Germany
Korea
Iceland
Denmark
Portugal
Belgium
Finland
France
Sweden
Netherlands
Austria
NORWAY
Switzerland
C. Emissions of SOx Kg per capita, 19951
OECD average
0 20 40 60 80 100 120
AustraliaIceland
United StatesCanadaFinland
NORWAYLuxembourg
DenmarkSweden
Czech RepublicUnited Kingdom
BelgiumNetherlands
IrelandSpain
PolandGermanyPortugal
FranceKorea
AustriaSwitzerland
Hungary
D. Emissions of NOx
Kg per capita, 19951
OECD average

ECO/WKP(99)10
27
Transborder pollution problems
43. The Norwegian territory is affected by a number of transborder environmental problems, mostprominently:
− Acidification, especially in the southern and western parts of the country and close to theRussian border, caused by atmospheric emissions of sulphur dioxide and nitrogen oxideswhich, through “acid rain”, lead to deposition of sulphur and nitrogen in the soil and watersurfaces. The damage in Norway is relatively important due to its lime-poor rocks and thinsoils which have little capacity to neutralise acid deposition — i.e. low “critical loads”. Thiscombination of factors has caused death of aquatic life in surface waters and weakened thevegetation resistance capacity against drought, cold and frost, of Norwegian forests.39 Thebulk of the sulphur and nitrogen deposition, 95 and 86 per cent, respectively in 1994, stemsfrom long-range air transport from the United Kingdom, Central Europe and Russia.Domestic emissions, in turn, play a relatively minor role, mainly because there is no sulphurdioxide (SO2) emission from coal and oil-fuelled power generation, as reflected in a lowSO2 emission intensity by international standards (Figure 7).
− High concentrations of tropospheric ozone. Ozone is formed in the lower layers of theatmosphere when nitrogen oxides (NOx) and volatile organic compounds (VOC) react whenexposed to strong sunlight. A too high concentration of ozone in the air can cause respiratoryproblems and damage to vegetation and the ecosystem at large. Contrary to acidification,pollution by ozone in the lower atmosphere is less pronounced in Norway than in the rest ofEurope, due to the specific climate conditions in the region.40 Ozone concentration inNorway is largely due to long range transport of ozone from other European countries andvaries widely from year to year, depending on emissions abroad and meteorologicalconditions. The highest ozone concentrations are found in southern coastal areas of Norway.
− Eutrophication in the North Sea area. The release of nitrogen and phosphorus lead to nutrientenrichment which promotes the growth of plants and algae; the algae reduce lightpenetration and, when they die, consume oxygen in the water, thereby damaging marine life.Both Norwegian discharges and long-range transport of nutrients by ocean streamscontribute to marine eutrophication but, unlike the cases of acidification and ozone,Norwegian sources are predominant in the areas most affected — including municipal andindustrial waste water, fertilisers and animal manure.41 Norway’s use of fertilisers is ratherintensive compared to other OECD countries,42 owing partly to its highly protectionistagricultural regime. A recent shift in agricultural subsidies from price support to incomesupport related to acreage size has reduced the incentive for intensive cultivation somewhat.The Norwegian Producer Subsidy Equivalent has remained one of the highest in the OECD,however, and is likely to be a major influence on production and environmental pressures. Inaddition, it is largely offsetting the effect of the fertiliser tax.
44. Transborder pollution problems are dealt with within the framework of international treaties(Table 4). Norway is co-operating with other European countries, the United States and Canada under theframework of the United Nations - Economic Commission for Europe (UN-ECE) Convention on LongRange Transboundary Air Pollution (CLRTAP). The Sofia and Oslo Protocols deal with the acidificationproblem, and the Geneva Protocol with tropospheric ozone. With the 1987 North Sea declaration, NorthSea countries addressed the problems of eutrophication and pollution with toxic substances in the NorthSea. Apart from these international agreements, Norway has co-operated bilaterally with Russia, regarding

ECO/WKP(99)10
28
Table 4. Norwegian policy targets for transborder environmental problems
Type of emissions/inputs International targets National targets
Sulphur Oslo Protocol (1994)- 76 per cent reduction by 2000 with 1980 as a base year
NOx Sofia Protocol (1988)- Stabilisation by 1994 with 1987 as a base year 30 per cent reduction by 1998
with 1986 as a base year
VOC Geneva Protocol (1991)- 30 per cent reduction by 1999 with 1988 as a base year
Nitrogen and phosphorus North Sea Declaration (1987)- 50 per cent reduction with 1985 as a base year in the nine North Sea countries
Source: OECD Secretariat.
air pollution produced by a Russian nickel smelter located near the Norwegian border, in the arcticFinmark region.
45. Once targets are agreed among the countries concerned, the design of policies to reduce theemissions is rather complex, since the gases and substances contributing to transborder pollution problemshave different local pollution effects. Hence, policy instruments should be differentiated according to thedamage they cause in the different parts of the country. The best way to proceed would be to solve localproblems as a priority, and use national instruments if necessary to respect the international commitment.Norwegian policies in this regard, indeed, apply this principle to a certain extent.
Acidification
46. Prompted by its exposure to acid rain from foreign sources, Norway has been a major drivingforce behind the protocols on acidification. The early protocols (Helsinki 1985 and Sofia 1988) setuniform targets for participating countries for reducing SO2 and NOx emissions, and hence were not gearedtowards a cost-effective solution. In order to raise cost-effectiveness, Norway supported the initiative forthe more recent Oslo (sulphur) Protocol, which established targets per country according to critical loadsand abatement costs, and participated in the scientific underpinning of the protocol.43 For Norway, thisimplied a reduction target of sulphur emissions of 76 per cent by 2000 relative to the 1980 level. In thesame spirit, Norway is strongly involved in the preparation of the future NOx Protocol, which is expectedto be concluded in 1999. This protocol is to be multi-target, coherent and science-based, coveringacidification, eutrophication and tropospheric ozone, and including emissions of NOx, SO2, ammonia(NH3) and VOCs. Helped by the various protocols, European emissions of SO2 have declined steadilysince the early 1980s while a less rapid fall in nitrogen emissions has been observed since 1990.

ECO/WKP(99)10
29
47. The Norwegian authorities have concentrated major efforts on reducing SO2 emissions fromlarge industrial sources. In 1996, 60 per cent of the SO2 emissions originated from these sources,particularly heavy metal industries, while the remainder was due to stationary combustion and mobilesources, contributing 25 and 13 per cent of total SO2 emissions, respectively. Pursuant to the PollutionControl Act, discharge permits have been the main instrument used to reduce industrial emissions.44
Emissions from stationary combustion have been reduced mainly through ceilings for the sulphur contentof heating oil, which are differentiated by region to reflect variation in local problems associated withsulphur emissions.45 To supplement the sulphur content regulation, the tax on sulphur in heating oil, in usesince 1975, has been gradually increased up to a level of about NKr 17 per kg of SO2.
46 The tax coversabout 70 per cent of the combustion emissions of SO2 or around 20 per cent of total emissions. Coke andcoal are not subject to the tax, and non-combustion emissions from industrial processes are exempted. Taxexemptions are motivated by the fear of competitiveness losses of heavy energy-consuming industries — the same as with the CO2 tax.
48. These measures have allowed Norway to reduce its current SO2 emissions below the target set bythe Oslo Protocol, as SO2 emissions decreased by 78 per cent between 1980 and 1997, slightly more thanthe target set for the year 2000 (Figure 8). However, emissions are expected to rise again towards theyear 2000, due to a projected increase in fuel oil consumption. Hence, more needs to be done to respectthe Oslo Protocol. The creation of a market for SO2 emission quotas has been considered as an alternative,but would, among other things, imply higher administrative costs than a SO2 tax and distortions may arisedue, for instance, to market power, given the small size of the market. Last spring, following therecommendation of the Green Tax Commission, parliament approved the extension of the SO2 tax to thesectors and products previously exempted, at a low rate of NKr 3 per kilogramme of SO2. Moreover,refineries will be taxed directly on the basis of their emissions. For the time being, the level of the tax is,however, too low to have a strong effect on emissions given that the rate is above marginal abatementcosts only for small emission reductions (Figure 8).
Figure 8. Marginal cost of reduction in sulphur dioxide emissions
1. Calculated in 1994-95, starting out from an emission level of 36 000 tons.2. Primarily covering diesel oil and heating oil.3. The parliament has decided to implement a tax of 3 NKr/KgSO for sources not covered by the current tax as from 1 January 1999.Source: Ministry of Environment.
0
10
20
30
40
50
60
NKr/Kg of reduction
0
10
20
30
40
50
60
NKr/Kg of reduction
34 33 32 31 30 29 28 27 26 25
Thousand tons
2
1
2
3
Marginal cost
Tax applied tospecific sources
Tax to be applied toall other sources
1997emission
level

ECO/WKP(99)10
30
49. While SO2 emissions in Norway have been substantially reduced to date, NOx emissions haveincreased by 19 per cent since the early 1980s. Mobile sources generate 75 per cent of the NOx emissions— more than half of it from shipping and the rest from road traffic — while the oil and gas sector on thecontinental shelf is the dominant stationary source for NOx emissions. The quantity of emissions dependson the combination of four main factors: the nitrogen content of the fuel, the combustion technology used,the operation and maintenance of the equipment and, since NOx can be removed, the purificationtechnology. Hence, there is only a weak link between the amount of emission and the amount of fuelcombusted, and therefore a fuel tax is highly inefficient. At the same time, since the emissions originatemostly from mobile sources, which are very difficult to monitor, a tax based on measured emissionswould also be costly. This means that the instruments need to be adapted to the processes underlying theNOx emissions, and based on an analysis of the costs and benefits associated with the abatement optionsavailable for each sector. Moreover, as NOx emissions contribute to a range of environmental problems — acidification, eutrophication, tropospheric ozone and local pollution — the measures should be tailored tolocal conditions.
50. In order to comply with the target set in the Sofia Protocol — the stabilisation of NOx emissionsat their 1987 level by 1994, a variety of instruments have been implemented in Norway:
− As regards road traffic, the major focus has been to reduce NOx emissions through exhaustemission criteria for vehicles, which has resulted in a decline in emissions fromgasoline-powered motor vehicles since 1987. Since 1989, all new gasoline-powered carshave had to be fitted with a three-way catalytic converter, but due to the relatively longlifetime of private cars47 in Norway, only 39 per cent were equipped by 1997. In the yearsahead, emissions from road traffic are expected to decrease further as the car park isrenewed.
− Emissions from stationary combustion have been tackled by discharge permits for someindustrial plants.
Limited measures have been taken regarding shipping, even though emissions associated with shippinghave become the dominant source of NOx emissions: emissions of NOx per person-kilometre of traditionalpassenger ships and high speed passenger ships are, respectively, three and 14 times those of private carsand buses (Table 5). In the case of gas flaring on the continental shelf, emission reductions of NOx havebeen achieved as a side effect of the introduction of the CO2 tax. Emissions from the petroleum sector are,nonetheless, expected to rise due to increased activity. The authorities have given priority to reducingNOx emissions from urban traffic and from combustion for heating as their impact on the localenvironment is important. On the other hand, the government has preferred to protect the shippingindustry, including fishing, for regional policy purposes. Fishing vessels, however, do receive a subsidytargeted on increasing energy efficiency.
Excessive concentration of tropospheric ozone
51. In combination with NOx, VOC emissions generate tropospheric ozone. VOC emissions haverisen steeply in Norway since the late 1970s with the development of the offshore oil and gas fields.Indeed, per capita emissions of VOCs are currently among the highest in Europe. OffshoreVOC emissions, which account for more than half of the total in Norway, result from evaporation duringthe shipment and transfer of crude oil in the North Sea. To date, government action has focused on supportfor research and development to reduce these emissions.48 The main onshore source of VOC emissions isroad traffic. These emissions have been contained in the 1990s by the adoption of catalytic converters,

ECO/WKP(99)10
31
emission standards for trucks and measures to reduce emissions during filling at petrol stations. Despitethese measures, the target of reducing VOC emissions by 30 per cent from 1988 to 1999, established inthe Geneva Protocol, will be largely missed.49 Development of new technology which will make itpossible to mitigate these emissions has taken longer than expected. However, rapid deployment of suchtechnology is expected to be stimulated through the agreement under preparation between the governmentand the petroleum industry. The emission of VOCs from loading crude oil accounts for 60 per cent of totalemissions.
Eutrophication in the North Sea
52. To ease the marine eutrophication problem, the North Sea countries have agreed to a series offar-reaching commitments in the North Sea Declaration to reduce discharges of nutrients.50 Norway iscommitted to reduce discharges of nutrients by about 50 per cent compared to 1985 levels in areas of thesouthern part of the country.51 A series of measures have been taken:
− Since the mid-1980s, the construction and upgrading of sewage water treatment plants isfacilitated by government loans and grants to cover the capital costs of the requiredinvestments.52 Consequently, the density and quality of the waste water treatment capacity inthe North Sea region is much higher than in the rest of the country. Moreover phosphatedetergent has been banned. 53
− To reduce nutrient runoff in agriculture, regulations for better utilisation of animal manurehave been adopted, and support is given to farmers for leaving areas that are particularlyvulnerable to erosion under stubble during the winter. The use of fertilisers, moreover, istaxed, at a rate of 19 per cent of the purchase price for nitrogen and 11 per cent forphosphorus. As noted above, the current agricultural subsidisation scheme tends to offset theeffect of the fertiliser tax.
Table 5. Emission intensity of various forms of transportEmissions per person/kilometre, 1993/94
Air transport 182 516 .. Train1 61 189 20
Cars using petrol2 106 606 11Cars using diesel 86 313 119Buses3 80 950 62
Car ferries 926 14 600 146Other passenger ships 818 18 060 129
1. Estimates based on electricity produced in gas-powered plants.2. High emissions of NOx are due to the fact that only a minor part of the fleet was equipped with catalytic converters at this time.3. Average of 11.32 passengers.Source: Institute of Transport Economics, 1997.
Particulatesmg
CO2
gram
NOx
mg

ECO/WKP(99)10
32
Figure 9. Water pollutionWaste input to the North Sea coastal area, in tons
1. The area from Østfold to Vest-Agder. Calculated inputs to the coastal zone outside this area, particularly from agriculture, are uncertain.Source: Norwegian Institute for Water Research.
0
200
400
600
800
1000
1200
A. Phosphorus
1985 90 91 92 93 94 95 960
5000
10000
15000
20000
25000
30000B. Nitrogen
1
1985 90 91 92 93 94 95 96
Municipal waste water Agriculture Industry
53. Nitrogen discharges to Norwegian North Sea coastal water were reduced by 22 per cent between1985 and 1995, with the bulk of the reduction originating from industry while discharges from agricultureand municipal waste water remained more or less constant (Figure 9). North Sea discharges ofphosphorus, however, have decreased by 44 per cent in the same period, reflecting the emphasis of thepolicy effort in this regard, which is justified by the fact that phosphorus has been the critical factor ofeutrophication in Norwegian rivers and lakes. In agriculture, phosphorus fertilisation has beensubstantially reduced since the 1980s, whereas nitrogen fertilisation has only marginally decreased — which partly explains why runoff of nitrogen has been reduced less than that of phosphorus. Recentresearch indicates that a significant reduction of nitrogen runoff in the agricultural sector could beachieved by combining an increase of the tax on nitrogen fertilisers with specific agronomic measuresadapted to local conditions.54
Local environmental problems
54. Norway is privileged by its geographical situation which, together with a low population density,implies a limited burden on the local environment. Local problems, nevertheless, exist:
− Urban air and noise pollution. Local air and noise pollution concern mainly the urban areaswhich are concentrated in the southern part of the country. Overall, air quality as measuredby the annual average concentration of pollutants in Norwegian cities is relatively good, and

ECO/WKP(99)10
33
the concentration of SO2 and lead in urban areas has been substantially reduced over the lastdecades (Figure 10).55,56 The Norwegian Pollution Control Authority estimated the annualcost of damage to health resulting from air pollution at NKr 3.8 billion in 1998 for Oslo andBergen only, and NKr 2.5 billion due to noise for the whole country.
− In addition, according to the State Pollution Control Authority, about 25 per cent of thepopulation experience noise as a problem at their homes, and 260 000 persons suffer fromserious discomfort as a result of road-traffic noise. While road traffic is by far the mostimportant source of local air pollution and noise, there are two emission sources of particleswhich are specific to Norway: heating systems for buildings — wood-burning stoves inparticular — and the use of studded tyres.
− The emission and accumulation of hazardous substances, which potentially represent themost acute threat to human health and the environment, and also contributes to transborderpollution, has been significantly reduced. In the past, some fjords were heavily polluted bydischarges of toxic substances by local manufacturing industries, which seriously damagedthe marine life. However, these “point source” emissions have been significantly reducedthrough discharge permits, and the most hazardous substances have been banned. Leademissions are being reduced as leaded petrol is progressively disappearing from the market.
Figure 10. Air pollution in OsloMidwinter, urban area, g/m
1. The data concerning particles is the measurement of black soot at one location in the period 1970/71-1994/95, and of PM at another location for the years 1985, 1986 and 1989-97. The two series are not directly comparable. The stations are not directly influenced by road traffic and show background values.Source: Luftforurensninger i Oslo, Årsrapport 1998.
0
20
40
60
80
100
120
140
160
180
0
20
40
60
80
100
120
140
160
180
1970 72 74 76 78 80 82 84 86 88 90 92 94 96
µ1
3
2
10
2
10
SOPMNO

ECO/WKP(99)10
34
− Waste, although not an environmental problem per se, can give rise to various environmentalproblems and health damage. As in most other OECD countries, waste production has beenincreasing exponentially since the 1970s, reflecting production and consumption trends.57
Hazardous waste represents slightly more than 1 per cent of total waste, which needs to betreated separately.58 Non-hazardous waste, however, may also pollute water, soil and air.Waste deposited in landfills causes leakages into groundwater and the soil, smells, andgenerates emission of methane and other damaging gases. The incineration of waste,moreover, generates emissions of acidifying substances and toxic gases.
Urban air and noise pollution
55. In 1998 the Norwegian government has adopted new national goals for the reduction of urban airpollution. New goals were adopted for SO2, benzene, NO2 and particulate matter.59 Regarding road trafficwhich, as noted, is the most important source of air pollution and noise, the Norwegian authorities havedeployed a large number of instruments, both national and local. A first group of measures aims atreducing emissions per vehicle-kilometre in line with EU regulations. Emission standards have been fixed,which led to the introduction of catalytic converters for the removal of a substantial part of NOx, VOC andCO2 emissions from petrol-fuelled cars — but much less so for diesel-driven cars. The standards on thesulphur content of oil, the sulphur tax and the tax on the lead content of petrol have helped to reducesulphur and lead emissions. Noise criteria for cars have also been adopted. A second group of measuresaims at limiting the volume of road traffic by increasing its price vis-à-vis other means of transport. Asnoted earlier, taxes on petrol have been raised, but less so on diesel. Toll systems for all inbound vehicleshave been established around the city centres of Bergen and Oslo. While these toll rings merely serve toraise funds for investment in the local road infrastructure to reduce congestion,60 the toll ring in Trondheimis to some extent used for traffic management, as the toll fee is somewhat higher during peak hours andseasonal tickets are not available.61
56. Total support to public transport (subsidies and transfers to buy transport services) amounts toclose to NKr 4 billion per year. These subsidies are not primarily directed towards solving localenvironmental problems, which means that a reallocation of support could have substantial environmentalbenefits. Support is, among other things, provided to air transport, bus transport in remote areas andhigh-speed passenger ships, all of which give rise to high emissions per person kilometre (Table 5).
57. Aside from road traffic, a series of other measures have been taken in recent years to improvethe air quality in urban areas. Emission standards for wood-burning stoves have been included in the newbuilding regulations, and they are expected to reduce emissions from this source by 70 per cent in thelong-run. Standards for studded tyres have also been adopted and the local measures to reduce the use ofstudded tyres is currently discussed. Moreover, parliament passed legislation last spring to entitle localauthorities to impose charges on the use of these tyres. An inter-ministerial report concluded that a sharpreduction in the use of studded tyres in the four major urban areas could provide a net benefit of aroundNKr 500 million per year due to e.g. improved health and less corrosion. To address a specific noisepollution problem around the airports of Oslo and Bodø, a charge on aircraft noise has been introduced:the aircraft landing and departure fees are differentiated according to the noise level they create and thenoise problem. This charge is earmarked for use within the sector, in contrast with most otherenvironmental taxes in Norway. The opening of a new airport outside Oslo replacing the Fornebu airporthas reduced the associated noise problem, but no decisions have yet been taken concerning the aircraftnoise charge.

ECO/WKP(99)10
35
Hazardous substances and waste
58. The problems regarding air and surface water discharges of hazardous substances by industryhave been largely resolved in the past decade. Increasingly, the authorities are focusing on emissions fromthe use and disposal of hazardous chemical products and substances such as solvents, anti-fouling paintand batteries. This requires the use of instruments which are targeted on the individual substances.Systems of classification, labelling, registration and, if needed, banning of hazardous chemicals have beenimplemented and appear to function well. The Green Tax Commission, however, saw some scope forgreater use of taxes to reduce these product-related emissions, or emissions from individual substances. Arefund deposit scheme for nickel/cadmium batteries and a tax on various other products, such as fodderused in fish farming which contains antibiotics, should also be considered.
59. The overall waste management policy objective, as set out in a 1992 report to parliament, is toensure that waste problems are solved in a way that minimises environmental and health problems, andalso minimises the use of resources. The strategy of the Norwegian authorities to reach this objective is toi) minimise waste generation; ii) promote the re-use and recycling of material and the extraction of energyfrom waste; and iii) ensure that remaining waste is disposed of in an environmentally sound way. TheNorwegian authorities also have specific targets, such as for the recycling of packaging waste which, inline with EU directives, requires that between 50 and 65 per cent of the total packaging waste should berecycled.
60. Since 1995, the Pollution Control Act requires that municipalities charge fees for wastetreatment that fully cover their expenses — an objective that has been largely achieved62 — and thatpromote waste reduction and recycling. The introduction of stricter standards for landfills and incinerationin line with EU directives has contributed to increase the costs of waste treatment, and as such givesincentives to recycle. To reduce litter and illegal disposal of hazardous waste and encourage recycling,state-run deposit-refund systems have also been established for lubricating oil and scrapped cars. A tax onbeverage containers has been introduced and consists of two elements: i) a general tax on all containersdifferentiated by the degree of recycling potential; and ii) a surtax on containers which are notre-useable.63 The first tax element gives producers an incentive to establish a deposit-refund system. Suchsystems were introduced for glass (currently 98 per cent return) and plastic beverage containers. The lattertax has turned out to be prohibitive for beverage cans, so they were not introduced. In fact, recyclingbeverage cans rather than glass would be more friendly to the environment. The government has tried tochange the current incentive structure several times, but parliament never passed the legislation.
61. The Norwegian authorities have also made an active use of regulatory measures, “voluntaryagreements” and subsidies to promote waste recycling. If voluntary schemes do not produce satisfactoryresults, the Ministry of Environment has a mandate to require the municipalities to introduce sorting ofwaste at source. Industry, which treats 85 per cent of its waste on site or through private wastemanagement companies, may also be required to recycle their waste. “Voluntary agreements” have beensigned between various industry branches and the Ministry of Environment regarding paper, cardboard,glass, lead accumulators and car tyres. The government is also providing financial support to municipalrecycling and source separation projects.64 These measures have resulted in a steep increase in theproportion of waste recycled from municipal collection schemes, from 9 per cent in 1992 to 22 per cent in1996 for households, and from 8 to 18 per cent for industries.
62. The cost-effectiveness of increased recycling is in doubt. A recent study by Bruvoll (1998),based to a large extent on United States empirical data, for example, suggests that recycling of paper andplastic waste, except for commercial paper waste, is probably less cost-effective than incineration orlandfilling. There is some evidence that the costs of collection, transport and production processes

ECO/WKP(99)10
36
associated with recycling, as well as the environmental costs of emissions from transport may beunderestimated. Moreover, new technologies have reduced the environmental costs of incineration andlandfill. These conclusions may not be valid for every single municipality, as they depend on, forexample, the density of population and the distance to the various treatment facilities. The use of purelynational targets for recycling are, in any event, inappropriate. Hence the necessity to examine the variousoptions at the local level.
63. The above-mentioned study also suggested that waste minimisation at the source is the mostcost-effective alternative for the categories of waste examined. This could be achieved by a tax at thesource — i.e. the products which generate the waste — with the rate varying according to the marginaltreatment costs. The introduction of a tax of NKr 300 per ton of waste deposited to landfills or incineratedapproved by parliament last spring — as recommended by the Green Tax Commission — constitutes animportant step in this direction. The tax level does not cover all environmental costs of waste involved,and is still very crude as there is no differentiation with regard to the treatment cost.65 However, theintroduction of a differentiated tax would be quite complex and costly in practice, while raising the overalltax level would provide a stronger incentive to deposit waste illegally.
Biodiversity
64. Biodiversity derives its importance from the interaction of mankind with other forms of life, forinstance, for recreational reasons, use of genetics by industry or the existence value of species. It isestimated that about 40 000 species of plants and animals exist in Norway. Human-induced extinction ofspecies has continued. About 45 species are known to have become extinct in the last 50 years, and almost500 are considered to be endangered or vulnerable. Loss of biological diversity is caused by a wide rangeof factors which influence the environment, such as land use, over-exploitation or pollution. Theexpansion of towns and the agricultural area has implied serious losses of areas of natural habitat, swampforests, wetlands and other ecosystems. Policy aims at protecting endangered and vulnerable species, andto restore biodiversity, where possible, for instance, by expanding the area of national parks to 13 per centof the total Norwegian area by 2008. In addition, ensuring that agriculture, forestry and fisheries areharvesting in a sustainable way is of particular importance. Currently, no cost-benefit analysis is pursuedin this area, which would allow prioritisation. Even though uncertainties are large, there is probably scopeto establish broad guidelines.
Assessment and challenges ahead
Ensuring sustainability
65. The evolution of human and fixed capital, of the oil and gas wealth as well as its transformationinto financial capital, and of forests, suggests that total national wealth has increased in the past. Whiletrends are much more difficult to judge, natural capital apart from the oil and gas stock and forests appearsto have also risen overall since the early 1980s. However, the dwindling of fish stocks has only beenpartly reversed, keeping biodiversity intact is not easy and local environmental problems persist. Whiletotal wealth has probably increased in the past, it could have accumulated faster — or, conversely,consumption could have been higher — with greater cost-effectiveness of policies in various areas and abetter integration of different policies. Finally, the implementation of climate change policies poses aformidable challenge.

ECO/WKP(99)10
37
66. Norway is in the very privileged position of possessing a large national wealth in the form of itsoil and gas stores and the financial assets ensuing from its development. The move towards channelling agreater part of the rent from the oil and gas sector into foreign financial assets, initiated several years ago,should help ensure the inter-generational balance by providing more freedom of choice for futuregenerations. Accordingly, the generational accounts for Norway, which are routinely updated for everynational Budget, suggest that the government’s strategy to achieve sound public finance in the long runcould succeed. There are some concerns, however, that the government has not fully succeeded incapturing the entire natural resource rent associated with the oil and gas stock. Other countries havechosen to capture some of this rent through auctioning of production acreage rather than only taxing therent — the approach which is prevalent in Norway. The Norwegian authorities should be encouraged toexamine the possibility of auctioning, the more so since a shift from pure taxation to auctioning wouldreduce the volatility of the annual flow of revenues associated with variations in the oil price.
67. Norway, being the world’s second largest fish exporter, has a clear interest in the application ofinternational agreements to curb overfishing in the northern Atlantic area. Fish stocks fell considerablybetween the 1960s and early 1980s, when several species were almost driven to extinction and the marineecosystem severely damaged. Even though the situation has improved since then, overfishing, in particularin the North Sea, remains a serious problem. The use of Total Allowable Catches to limit fishing remainsthe dominant international management tool, but there are strong incentives for fishery nations to lobbyfor large quotas which in aggregate are unsustainable — due mainly to excess capacity of fishing fleets.Moreover, fishery control policies and measures are often either inadequate or not sufficiently enforced.There is little Norway can do on its own, apart from reforming policies that have led to excess capacity inits own fishing fleet.
68. Over the last two decades, environmental policy in Norway has been fairly successful inreducing the emissions of a wide range of pollutants. In a few areas, however, environmental pressureshave continued to rise. Since a substantial part of pollution in Norway is imported from abroad, policyalso focuses on negotiating, implementing and complying with international agreements. In this regard,Norway stands out by its valuable efforts to stimulate international co-operation on global and transborderenvironment policies. In many domains, this is clearly in the country’s best interest, given its vulnerabilityto e.g. acidification and marine pollution originating from neighbouring countries. In other cases, forinstance, climate change agreements, this may conflict with Norway’s national interest because it is amajor global oil and gas exporter. However, climate change has been an important preoccupation ofNorwegian governments, and this preoccupation is shared by the overwhelming majority of the people.
69. Improvements in Norway’s local environment are to some extent interlinked with policiesgeared towards complying with international agreements addressing cross-frontier pollution — e.g. acidification and eutrophication. Local environmental policies are, moreover, in many instancesaligned with EU regulations following Norway’s membership of the EEA. Pollution from hazardoussubstances due to industrial activities along the fjords has been significantly reduced, while the mosthazardous substances have been banned. Progress in the area of waste reduction and treatment aimed atreducing emissions and leakage into the environment has been marked as well. Nevertheless, from time totime the few urban areas in Norway face serious air and noise pollution associated with car traffic. Thereare also concerns that the expansion of towns and agricultural activities contributes to further losses inbiodiversity. The scope for enhancing the environmental sustainability of local economic activities thusremains significant. Policies in this regard should be guided by extensive and systematic cost-benefitanalysis.

ECO/WKP(99)10
38
Fostering cost-effectiveness
70. The current policy framework could be improved upon in many respects, which would eitherraise wealth accumulation and future consumption potential or allow higher current consumption. Asconcerns oil and gas extraction policies, the elaborate regulatory framework for the licensing ofexploration and development acreage has created favourable conditions for participation of foreignoperators and participants on the shelf. Foreign companies often welcome a certain degree of stateinvolvement, including the presence of a large state company on national territory. However, there isscope for improvement. In particular, companies bidding in licensing rounds should be allowed to formtheir own partnerships also in the Norwegian Sea, as the system of “arranged marriages” by thegovernment in which the fully state-owned company Statoil frequently participates does not necessarilyyield the best team. In particular, the government should allow a greater variation in participants in eachlicense, possibly based on auctioning of licenses (see above). Concerning licensing in the fishing industry,the existing system of transferring fish quotas between licensees could be changed by de-linking quotasfrom vessels to facilitate re-allocation of quotas to the most efficient parts of the fleet. As a further step,the government could consider the auctioning of the fish quotas to vessel owners in order to increase andextract the resource rent. Such a reform would, however, clash with regional policy objectives.
71. Climate change policies in Norway will be geared towards meeting the commitments arisingfrom the Kyoto Protocol concluded in 1997. There is a potential for enhancing cost-effectiveness of thesepolicies which resides in a greater use of instruments geared to equalising marginal abatement costs acrossall economic activities. At present, about 60 per cent of all CO2 emissions are taxed. Exemptions are stillgranted to heavy industries, fishing and international shipping.66 Moreover, rates of taxation varyconsiderably and are unrelated to the carbon content of products and activities. Ironically, the incentivesfor reducing carbon emission are generally weakest in industries where the marginal abatement costs arelowest. Moreover, the current tax structure may lead to a bias towards CO2-intensive activities in thelonger run, which conflicts with the objectives of the tax. The new CO2-taxes with effect fromJanuary 1999 have slightly raised cost-effectiveness. However, inefficiencies remain since most of themainland’s energy intensive activities will still be exempted from the CO2 tax. A market for CO2 emissionquotas is being prepared, but will need to be underpinned by clear rules for trading, banking, verificationand compliance, which have not yet been established. Finally, emission permits should be auctioned ortendered, because otherwise the associated scarcity rent would be left in the hands of existing companies.This would penalise new entrants and rob the government of the opportunity to cut distorting taxes. If aunilateral tradeable quota system appears not to be feasible in Norway, a uniform CO2 tax rate applied toall sectors, at a lower level, should be considered until further international decisions are taken.Compensation schemes for the currently exempted industries, as proposed by the government inApril 1998, could provide the necessary time to adapt. Model simulations show that utilisation of theKyoto-mechanisms would reduce the cost of complying with the Kyoto target significantly — by as muchas two thirds compared with an approach based only on domestic measures.
72. While Norway has succeeded in fulfilling its commitments arising from internationalagreements on transborder pollution, there is scope for improved cost-effectiveness also in this area. Asconcerns acidification, the Norwegian authorities may now need to refocus their efforts towardsNOx abatement, as the scope for SO2 abatement at reasonable cost has been largely exploited. Increasedemphasis on NOx abatement also opens up opportunities for positive side-effects on tropospheric ozoneformation and local air pollution. With regard to NOx policy, the authorities have so far given priority toreducing emissions from road traffic and combustion for heating as its impact on the local environment isimportant. To date, measures have been implemented in the areas where the regional and local damagecaused by NOx emissions are the highest. In the future, however, further reductions will probably call formeasures in the sectors left unaffected until now, in particular coastal shipping and fishing vessels.

ECO/WKP(99)10
39
Applying an annual tax on all mobile sources based on their NOx emission intensity could be acost-effective way to do this. The introduction of such a tax for vehicles has been considered by theNorwegian authorities, but has so far not been adopted. In any event, an extensive cost-benefit analysis ofall sectors is needed. Concerning SO2 policy, the extension of the sulphur tax to sectors previouslyexempted represents an important step in the direction of enhanced cost-effectiveness. Current plans for auniform tax rate should be adopted with priority, especially since the targets of the Oslo Protocol may callfor a higher overall level of the tax.
73. Rebalancing the policy mix may also be useful with regard to eutrophication and wastetreatment. Eutrophication policies should now be re-oriented to nitrogen in order to exploit abatement costdifferentials that have opened up between nitrogen and phosphorus. An increase in the tax on nitrogenwould be a cost-effective way of dealing with this. Concerning waste, the adoption of the state tax onwaste is welcome, but the national strategy should be underpinned by a better balance between the variouswaste treatment options based on region-specific cost-benefit analysis, and the prevention of waste shouldbe sought.
74. The policies aimed at a reduction of pollution caused by road traffic are subject to debate inNorway. Several issues stand out:
− The current level of car fuel taxes is controversial. The official policy stance is that the taxon car fuels should be used to internalise all external costs of car use and that theregion-specific external costs of driving a car should be covered by local taxes and measurestailored to local problems.
− While there is considerable scope for the use of local instruments to restrict car use, theirintroduction meets resistance. For example, the existing toll-rings could be revamped intoroad pricing systems — by adopting fees which vary according to the type of car (itspolluting properties) and the time of the day or week of the trip. As a first step, the seasontickets on the Oslo and Bergen toll rings could be suppressed and time-differentiated fees beintroduced. Research by the Institute of Transport Economics indicates that a well designedroad pricing system could double the benefits to society as compared to the current situation.Although EU-led test programmes have demonstrated that the technology is available, theoperating costs are still considered to be too high and the electronic surveillance system maycreate privacy problems. Concerns about the distributional impact of road pricing anddisagreements on the earmarking of the proceeds are also obstacles to its implementation.Nevertheless, parliament is in favour of the introduction of such variable tariffs in principle.Further initiatives in this regard are planned.
− As elsewhere, the much lower taxation of diesel as compared to petrol is particularlycost-ineffective in environmental terms since the local air pollution generated by diesel cars(NOx and particles) is greater than that of petrol driven cars. A study by Statistics Norwayestimated that the average social costs of burning one litre of diesel in Oslo is at least 6 to 20times higher than for a litre of petrol. The low diesel tax — including the CO2 tax which isalso lower for diesel as compared to petrol — has, moreover, induced a shift towards morediesel cars (as in other countries), a tendency which is expected to be exacerbated in thefuture.
75. Cost-effectiveness could be enhanced in a number of domains by moving from “command andcontrol” to the use of economic instruments, such as taxes, deposit-refund schemes and tradable quotas.The introduction of taxes, differentiated by the emission properties of the capital equipment should be

ECO/WKP(99)10
40
considered for all mobile sources, with the rate differentiated according to NOx emission intensity. Thetaxation of remaining ozone-depleting substances, several hazardous substances and the greenhouse gasHFC, should also be encouraged. Deposit-refund schemes could be envisaged for products containinghazardous elements, such as nickel/cadmium batteries. In addition, the possibility of combining taxes withdischarge permits should be further examined.
Policy interactions are important
76. Environmental and resource management policies in Norway aim to strike a balance betweenconsiderations of cost-effectiveness, international competitiveness of individual industries and regionaldevelopment — with the latter two considerations often overriding environmental and cost-effectivenessconcerns. Fishing policies, for instance, have been geared towards maintaining existing settlement patternsby redistributing the resource rents towards smaller vessels registered in remote areas. Environmentalpolicies have been designed so as to limit the impact on the economic performance of industries that areexposed to foreign competition and that are mostly based in remote areas. Hence, there are cases wherethe scope for cost-effectiveness is not being exploited. It is important that the economic costs and benefitsof these choices are carefully evaluated and made transparent to guide future decision making.
77. There are also interactions between transport policy and environmental pressures. Transportpolicy aims inter alia to provide transport infrastructure. In principle, the user should pay for the use ofthe infrastructure, and not the tax payer, and congestion fees should be levied to align private and socialcosts. Concerning road transport, petrol-driven cars probably come close to paying the use ofinfrastructure and even for externalities (environmental and accidents). This is not the case fordiesel-driven cars and even more so for trucks. Raising taxes on diesel would not only make for a bettertransport policy, but also reduce environmental pressures. At the same time, reductions in supportprovided to bus transport in remote areas and high-speed passenger ships could yield substantialenvironmental benefits.
78. Agricultural policies have also important environmental ramifications. Agricultural subsidisationis particularly high in international comparison. While its major aim is to keep farm communities intact,the link between subsidies and production gives incentives to farm intensively, for example, by heavy useof fertilisers. A recent shift in agricultural subsidies from price support to more neutral support hasreduced this incentive for intensive cultivation. A further move in this direction would lead to aconsiderable further reduction of environmental pressures from intensive farming and enhance thesustainability of agricultural production.
79. Norway has an extensive institutional framework to foster sustainable development gearedtowards resolving policy conflicts. In addition, since the early 1990s, an ongoing evaluation effort of thesustainability of policies is underway. This has, for instance, led to the compilation of inter-generationalaccounts. It has also helped to integrate policies and to build a consensus about the need to foster policieswhich are sustainable in the long run. While clearly in the interest of society as a whole in the long run,policies pursuing sustainability can clash with vested interests in the short run. Agricultural or transportpolicies are a case in point. Furthermore, structural policies, financed in part by the oil and gas proceeds,have often served to perpetuate historical patterns of economic activity and settlements that may proveunsustainable once the oil and gas proceeds decline. Hence, even if generational accounts for Norwaysuggest inter-generational equilibrium of public finances — in itself an important achievement — there isa risk that many forms of public support may turn out to carry a low return in the long-run.

ECO/WKP(99)10
41
NOTES
1. This paper was originally produced for the OECD Economic Survey of Norway, which was published inFebruary 1999 under the authority of the Economic and Development Review Committee. The authors areindebted to Christian Averous, Nils Braathen, Andrew Dean, Jørgen Elmeskov, Mike Feiner, Peter Hoellerand Tom Radahl for valuable comments and drafting suggestions and to Desney Erb and Mee-Lan Frankfor technical assistance.
2. OECD (1995) and IEA (1997).
3. OECD (1993).
4. Policies concerning fresh water management are not discussed, because they do not currently raise majorsustainability concerns.
5. Parliament has the responsibility for the approval of major developments, while the government isauthorised to approve smaller development projects. The overall administrative responsibility for theoperations rests with the Ministry of Petroleum and Energy. The Norwegian Petroleum Directorate (NPD),subordinate to the Ministry, has supervisory and administrative responsibility.
6. The new Petroleum Act adopted by Parliament in 1996 entered into force in 1997, and introduced moreadministrative flexibility in several areas, including acreage management, in order to ensure the attainmentof these policy aims.
7. Statoil’s regulatory framework was set up in order to manage the public assets on the Norwegiancontinental shelf. However, the EU license directive prohibits governments giving priority to a nationalcompany, and as a result Statoil is now in open competition with other companies on the Norwegiancontinental shelf. The directive has also created new opportunities for Statoil abroad. Statoil and NorskHydro are extending their reach to Russia and other states of the former Soviet Union (in particular thecountries surrounding the Caspian Sea where reserves are estimated to be in the range of 50 and 100 billionbarrels or two to three times the size of the Norwegian continental shelf). These companies are deemed tono longer need protection within their core Norwegian market.
8. In the early 1970s when the significance of the petroleum resources had become clear, the governmentstipulated that the profits from the operations on the shelf should “benefit the entire population” and shouldbe used to “create a better society” through increased public spending on social security, culture, educationand infrastructure, as well as the development of rural areas. Lower taxes on mainland economic activities,a shorter working week and an increase in development aid were also considered as priority areas, seeStortingsmelding nr. 25, (1973-74).
9. The rent is defined as the market price of oil and gas minus the marginal cost of extraction (includingcapital cost).

ECO/WKP(99)10
42
10. For example, after the second OPEC shock, the petroleum wealth jumped from NKr 590 billion in 1979 toNKr 2 273 billion in 1981, only to collapse to NKr 694 billion when the oil price plummeted in 1986 (seeThøgersen, 1994).
11. The accounts were set up by Auerbach et al. (1993).
12. Based on the assumption that the oil price will recover in real terms by 20 per cent from its 1998 level (seethe 1999 Budget proposal released in October 1998).
13. The major fishery nations in the world are China (27 million tonnes per year) and Peru (10 million tonnesper year). Norway catches 3 million tonnes per year.
14. There are a few fish resources considered exclusively Norwegian national stocks of which coastal cod andNorth-East Arctic saithe are the major ones. For such stocks TACs are determined by the Norwegianauthorities.
15. Atlantic herring is a so-called “straddling” stock, i.e. various stocks mix on the feeding grounds in theNorwegian and North Sea and it is, therefore, difficult to distinguish between the catches from theIcelandic, Faeroese and Norwegian stocks. At the close of the Third UN Conference on Law of Sea, 1982,straddling fish stock was hardly a problem, as 90 per cent of the world catch was taken within the zones. Bythe late 1980s a crisis had developed: as stocks in the zones were fully utilised, there was persistent fleetover-capacity and high sea fishing became more profitable. There was growing alarm over the straddlingfish stock problem and a UN General Assembly established the UN High Seas Fishery Conference inApril 1993. The UN Conference on Straddling Fish Stocks and Highly Migratory Fish Stocks concluded inDecember 1995 that straddling fish stocks should be managed by regional organisations. If this systemsucceeds, straddling stocks will be managed as shared stocks and high seas adjacent to 200 mile zones willbecome high sea in name only.
16. When Norway negotiated the European Economic Area agreement with the EU Commission in 1993, it wasagreed to introduce a five-year moratorium on investment by firms in this sector. At the discretion of theEU, this agreement may be reopened for negotiation in 1999.
17. European Environment Agency (1998).
18. These national TACs are set as a level consistent with bilateral agreements between Norway, Russia and theEU allowing for fishing in each other’s 200 mile zone.
19. Important decisions are taken by the Cabinet, based on proposals by these committees.
20. A consortium of Naturkraft, owned by Statoil, Statkraft and Norsk Hydro is in the process of developingtwo gas-fired power plants at Karstø and Kollsnes. Norsk Hydro has, however, announced that it coulddevelop such a plant using new technology to eliminate 90 per cent of the CO2 emissions by re-injectingCO2 in oil fields.
21. The reduction in emissions of PFCs and SF6 (or “the other gases”) are expected to continue, albeit at a muchslower pace. N2O emissions, stemming from fertilisation in agriculture and production of nitric acid, areprojected to remain stable.
22. International shipping is not included in the emission commitments.
23. This was proposed by the government but rejected by the parliament.

ECO/WKP(99)10
43
24. In June 1997, the aluminium industry signed a voluntary agreement with the Ministry of Environment toreduce greenhouse gas emissions per unit of aluminium by 55 per cent in the period 1990-2005, most ofwhich has already been achieved.
25. See OECD (1998), pp. 91.
26. A key feature of greenhouse gases is that the marginal damage of emission is always the same wherever itoriginates from.
27. In the aluminium industry, for example, greenhouse gas emissions are due mostly to the chemical reactionsunderpinning the production of aluminium from aluminium oxide.
28. The CO2 tax extension net of the compensation was estimated to add NKr 1 billion to the NKr 7.7 billion ofthe total expected CO2 tax revenues for 1998.
29. Combustion plants utilising methane from waste for energy purposes would pay a lower rate, even thoughmethane emissions will not be reduced.
30. For CO2 or possibly all greenhouse gases.
31. A combination of several of these possibilities could also be envisaged.
32. With parliament’s amendments, the reduction will be less than the 0.1 percentage point decrease in labourtax rates initially calculated by the government.
33. A domestic tax-based solution which would leave the energy intensive sectors unaffected would requireeven higher tax rates in the non-exempted sectors.
34. Estimate provided in Storting Prp No. 54. The study provided a range of between NKr 50 and NKr 200 perton of CO2.
35. Other important ozone depleting substances are methyl chloroform, carbon tetrachloride, methyl bromide,hydrobromofluorocarbons (HBFCs) and hydrochlorofluorocarbons (HCFCs).
36. Moreover, additional restrictions on specific uses have been imposed.
37. To enforce the regulations, parliament decided to impose a tax on CFCs if consumption is not reduced.Before the CFC regulations came into force, the industries concerned had organised a reception system forused CFCs. Similar regulations have been used for implementing the phasing out of the other substanceswith a strong depleting potential.
38. Establishing a market for emission quotas, as in the United States, was also not viable given the smallnumber of potential participants.
39. Critical load is defined as the highest load/deposition in soil or surface water that will not damage theecosystem. In the mid-1990s, critical loads for the acidification of surface water were exceeded on 37 percent of the Norwegian territory, and on more than 90 per cent of the southern-most counties area (Aust andVest-Agder). Between 1960 and 1990, 20 per cent of the fish stocks were lost, and another 20 per centdamaged, in the rivers and lakes of the 12 southern counties. The critical loads for acidification of forestsoils are also exceeded in the southern-most parts of the country.
40. The population warning threshold defined by the EU ozone directive has never been reached and thepopulation information threshold is exceeded only a few days a year.

ECO/WKP(99)10
44
41. There is also nutrient runoff from uncultivated land, partly natural, and partly resulting from nitrogendeposition from long-range transported air pollution.
42. A better measure concerning environmental effects — nitrogen surplus — was developed in the context ofthe OECD agri-environmental indicators activity. It counts all nitrogen, including animal manure, whichpasses into the environment. On this indicator, Norway is about average in the OECD, even though thetrend is upward.
43. In addition to the stabilisation target of the Sofia Protocol, Norway has, as laid down in the SofiaDeclaration, the national goal of reducing NOx emissions by 30 per cent in 1998 compared to 1986. TheDeclaration’s target is thus more ambitious than that in the Protocol, but not binding.
44. Several plants have been required to install equipment to control emissions, and some of the most pollutingplants have been closed.
45. There are regimes for the Oslo region, the twelve most southern counties and the rest of the country.
46. NKr 0.07 per 0.25 per cent of sulphur content per litre of mineral oil.
47. The long lifetime of cars is mainly due to high taxes on car purchases.
48. The decrease in VOC emissions observed in 1997 is partly explained by the installation of a recoveryfacility for oil vapour at one of the oil landing terminals.
49. In fact, VOC emissions have grown by more than 40 per cent between 1988 and 1997.
50. The North Sea Declaration also includes emission targets for toxic pollutants.
51. The initial timetable for achieving this target was abandoned by the signatories of the Declaration. TheDeclaration also included a commitment to set up secondary treatment facilities for discharges frommunicipal sewage treatment plants serving areas of over 5 000 people (in population-equivalent terms).
52. Grants cover between 20 and 35 per cent of the capital costs with the remainder financed throughgovernment loans.
53. Indeed, in 1996, treatment plants removed 91 per cent of the phosphorus from waste water in the southernpart of the country, against 37 per cent in the rest.
54. A reduction in the nitrogen runoff can be achieved by the introduction of “catch crops” along the coast thatabsorb the nitrogen in the soil and leave land that is vulnerable to erosion out of crop during the winter(winter “stubbling”).
55. Industrial processes were the main source of emissions to air, particularly of SO2, but their contribution tolocal air pollution in urban areas has substantially decreased over time. There are, however, emissions ofheavy metals and toxic substances in some industrialised areas.
56. Nevertheless, local pollution peaks are sometimes observed in the winter season. Peak values may be veryhigh. The maximum concentrations of the main pollutants (NO2 and particles), recommended by theNorwegian Pollution Control Authority, are occasionally exceeded for at least 700 000 persons in recentwinters.
57. More than 5 million tonnes of waste are generated yearly in Norway — excluding waste from mining,building and construction. 1.3 million tonnes are from private households.

ECO/WKP(99)10
45
58. Part of hazardous waste is exported, largely to other surrounding Nordic countries in order to reducehazards from transportation. Other waste exports are small, except for old newspapers, which cannot betreated in Norway because no de-inking facility exists yet.
59. By 2005, the 24-hour mean concentration of sulphur dioxide shall not exceed 90 µg/m3; by 2010, the annualmean concentration of benzene shall not exceed 2 µg/m3 (urban background value); also by 2010, the hourlymean concentration of nitrogen dioxide shall not exceed 150 µg/m3 for more than 8 hours per year; and by2005, the 24-hour mean concentration of particulate matter (PM10) shall not exceed 50 µg/m3 for more than25 days per year and by 2010 not more than 7 days per year.
60. In Oslo, moreover, 20 per cent of the toll ring proceeds accrue to public transport and the construction ofbicycle tracks.
61. Some impact on travel patterns has been observed in Trondheim, with a slight shift in the timing of car tripstowards toll-free periods. In Oslo and Bergen, season tickets are available. In Oslo, the toll fees are notdifferentiated during the day, while in Bergen no tolls are collected during the night.
62. Overall, the income-to-cost ratio of municipal waste collection systems reached 95 per cent in 1995, and itwas between 90 and 110 per cent in more than two thirds of the Norwegian municipalities.
63. Packaging of milk and milk products is fully exempted.
64. Pilot projects for waste recycling are also conducted by the Norwegian pollution control authority (SFT) insome municipalities.
65. The tax level was set so that the methane emissions would be taxed in line with the average rate of taxationof CO2.
66. However, international shipping is not covered by the Kyoto agreement.
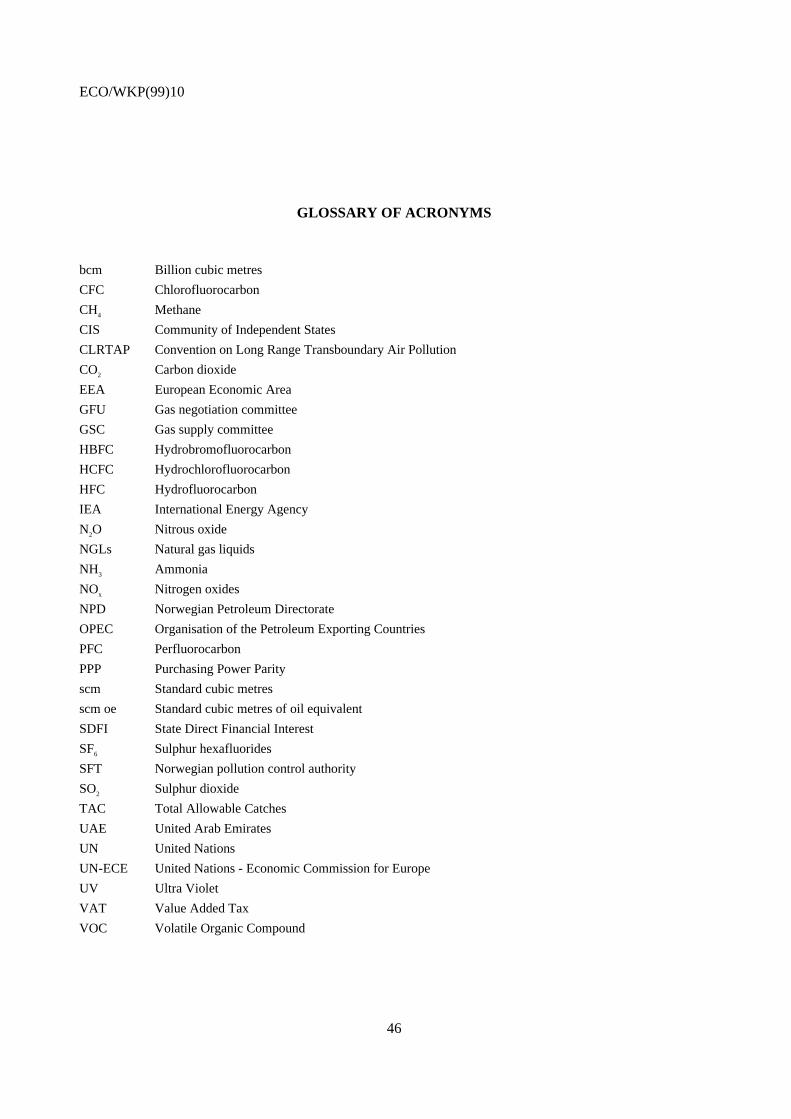
ECO/WKP(99)10
46
GLOSSARY OF ACRONYMS
bcm Billion cubic metres
CFC Chlorofluorocarbon
CH4 Methane
CIS Community of Independent States
CLRTAP Convention on Long Range Transboundary Air Pollution
CO2 Carbon dioxide
EEA European Economic Area
GFU Gas negotiation committee
GSC Gas supply committee
HBFC Hydrobromofluorocarbon
HCFC Hydrochlorofluorocarbon
HFC Hydrofluorocarbon
IEA International Energy Agency
N2O Nitrous oxide
NGLs Natural gas liquids
NH3 Ammonia
NOx Nitrogen oxides
NPD Norwegian Petroleum Directorate
OPEC Organisation of the Petroleum Exporting Countries
PFC Perfluorocarbon
PPP Purchasing Power Parity
scm Standard cubic metres
scm oe Standard cubic metres of oil equivalent
SDFI State Direct Financial Interest
SF6 Sulphur hexafluorides
SFT Norwegian pollution control authority
SO2 Sulphur dioxide
TAC Total Allowable Catches
UAE United Arab Emirates
UN United Nations
UN-ECE United Nations - Economic Commission for Europe
UV Ultra Violet
VAT Value Added Tax
VOC Volatile Organic Compound

ECO/WKP(99)10
47
BIBLIOGRAPHY
Auerbach, A.J., J. Gokhale, L.J. Kotlikoff and E. Steigum (1993),Generational Accounting in Norway: Is Norway Overconsuming Its Petroleum Wealth?, mimeo.
Bruvoll, A. (1998),The Costs of Alternative Policies for Paper and Plastic Waste, Statistics Norway Reports, No 98/2.
European Environment Agency (1998),Europe’s Environment: The Second Assessment, Office for Official Publications of the EuropeanCommunities, Elsevier Science Ltd.
Green Tax Commission (1996),Policies for a better environment and high employment - An English summary, Oslo.
IEA (1997),Norway 1997 Review, Energy Policies of IEA Countries, OECD, Paris.
Ministry of Environment (1995a),Evaluation of Environmental Policy Instruments in Norway, Report from a committee appointed by theMinistry of Environment in October 1992, February.
Ministry of Environment (1995b),Report to the Storting No. 41 (1994-1995) on Norwegian Policy to Mitigate Climate Change and ReduceEmissions of Nitrogen Oxides (NOx) - Summary.
Ministry of Environment (1997),Norway’s second national communication under the Framework Convention on Climate Change, April.
Ministry of Environment (1998),Assessment Report on Fisheries and Fisheries-Related Species and Habitat Issue, Fifth InternationalConference on the Protection of the North Sea, Oslo.
Ministry of Finance (1992),Towards More Cost-effective Environmental Policies in the 1990s — Principles and Proposals for BetterPricing of the Environment (Report of the Environmental Tax Commission to the Minister of Finance).
OECD (1993),Environmental Performance Review of Norway, Paris.
OECD (1995),Economic Survey of Norway 1995, Paris.
OECD (1997),Economic Survey of Norway 1997, Paris.
OECD (1998),Towards Sustainable Development, Environmental Indicators, Paris.
SFT (1996),Norwegian Pollution Control Authority, Pollution in Norway, Oslo.
Statistics Norway (1997),Natural Resources and the Environment 1997, Oslo-Kongsvinger.

ECO/WKP(99)10
48
Statistics Norway (1998),Natural Resources and the Environment 1998, Oslo-Kongsvinger.
Thøgersen, O. (1994),Economic Policy, Macroeconomic Performance and the Norwegian Petroleum Wealth: A Survey, NHH andSNF, Bergen (mimeo).
UN (1987),Our Common Future, New York.

ECO/WKP(99)10
49
ANNEX
NORWAY’S OIL AND GAS WEALTH
The oil and gas resources
1. Norway possesses significant oil and gas resources on the continental shelf below the North Sea,the Norwegian Sea (along the Atlantic Coast) and the Barents Sea (close to the polar circle). The oil andgas reserves amounted to 3.0 billion standard cubic meters of oil equivalent (scm oe) in 1997, of whichmore than half, or 1.8 billion scm oe, consisted of crude oil (including natural gas liquids or NGLs) andthe remainder of natural gas (Table A1).1 Although the Norwegian reserves are large compared to theother oil and gas producing countries around the North Sea (the United Kingdom, the Netherlands andDenmark), they represent only 1.1 per cent of the total oil and gas reserves in the world.2 By comparison,the Community of Independent States (CIS) and the eastern European countries control over one-fifth ofworld oil and gas reserves, and the Organisation of the Petroleum Exporting Countries (OPEC)three-fifths. Yet, Norway is the second largest oil exporter in the world, after Saudi Arabia, and is also amajor gas provider to western Europe — Norwegian gas accounts for 10 per cent of total gas consumptionin western Europe, with the remainder largely provided by Russia, Algeria and the Netherlands(Figure A1).3 This suggests that Norway maintains a very high rate of extraction compared to the othermajor oil and gas producing regions in the world.
2. Given the high extraction rate, the production has quickly matured. Most major oil discoveriesdate from the late 1960s and early 1970s in the North Sea and are close to depletion (Table A2).4 Hence,extraction activity has moved to newer fields which are smaller, notably in the Norwegian and Barents seaareas.5 On the other hand, the sharp increase in oil production since the mid-1980s has been coupled withrising estimates of the resources in fields under development, owing to improved exploration andextraction technology — including three-dimensional seismic mapping, the use of flexible drills andfloating platforms to develop “satellite” fields in the neighbourhood of existing infrastructures, and theinjection of gas or water to maintain pressure. In fact, the enhanced recovery in existing fields, rather thanthe discovery of new fields, has been the single most important source of growing reserves in the pastdecade. A main constraint on the use of enhanced recovery technology in the future, however, could be itshigh energy and hence CO2 emission intensity.
3. At current extraction rates and technology, oil reserves span 18 years and gas reserves 85 years,with oil production expected to peak in the early 2000s. Gas production will last for much longer than oilproduction (Figure A2)6 and the delivery infrastructure for natural gas from the Norwegian continentalshelf to the continent will be expanded accordingly.7 The prospects for exports of Norwegian gas toEurope are favourable as the delivery is deemed to be secure, with potential new buyers in eastern Europeseeking to diversify their supply from reliance on Russian gas. Natural gas is, moreover, a relatively cleanfuel and several countries substitute gas for coal and heavy oil use. Based on commitments in existingcontracts, export volumes should double from current levels by 2005, with Italy becoming a major newcustomer. By then, Norway is expected to supply an estimated 17 per cent of western Europe’s gasconsumption.

ECO/WKP(99)10
50
Table A1. World reserves of oil and gas1997
Oil Gas Total
Norway 1.8 1.1 1.2 0.9 3.0 1.0
Western Europe 2.9 1.8 4.7 3.4 7.6 2.5 Eastern Europe and CIS 9.4 5.8 56.7 40.5 66.1 21.9 Middle East 107.5 66.4 45.8 32.7 153.3 50.8
North America 4.3 2.7 6.6 4.7 10.9 3.6 Latin America 20.3 12.5 7.8 5.6 28.1 9.3
Africa 10.7 6.6 9.3 6.6 20.0 6.6 Asia and Oceania 6.7 4.1 7.1 5.1 13.8 4.6
OPEC 125.4 77.4 58.1 41.5 183.5 60.8
World 162.0 100.0 140.0 100.0 302.0 100.0
Source: Statistics Norway.
Per cent Billion scm oe
Billion scm oe
Per cent Per cent Billion scm oe
Figure A1. Production and net exports of crude oilMillion barrels per day, including NGLs, 1997
1. Natural gas liquids; production level in 1997 was 10.8 million scm compared to 176.8 million scm of crude oil.Source: Ministry of Petroleum and Energy.
0 2 4 6 8 10
Saudi Arabia
United States
CIS
Iran
Mexico
Venezuela
NORWAY
China
UAE
United Kingdom
A. Production
0 2 4 6 8
Saudi Arabia
NORWAY
Venezuela
CIS
Iran
UAE
Nigeria
Kuwait
Mexico
Algeria
B. Net exports
1
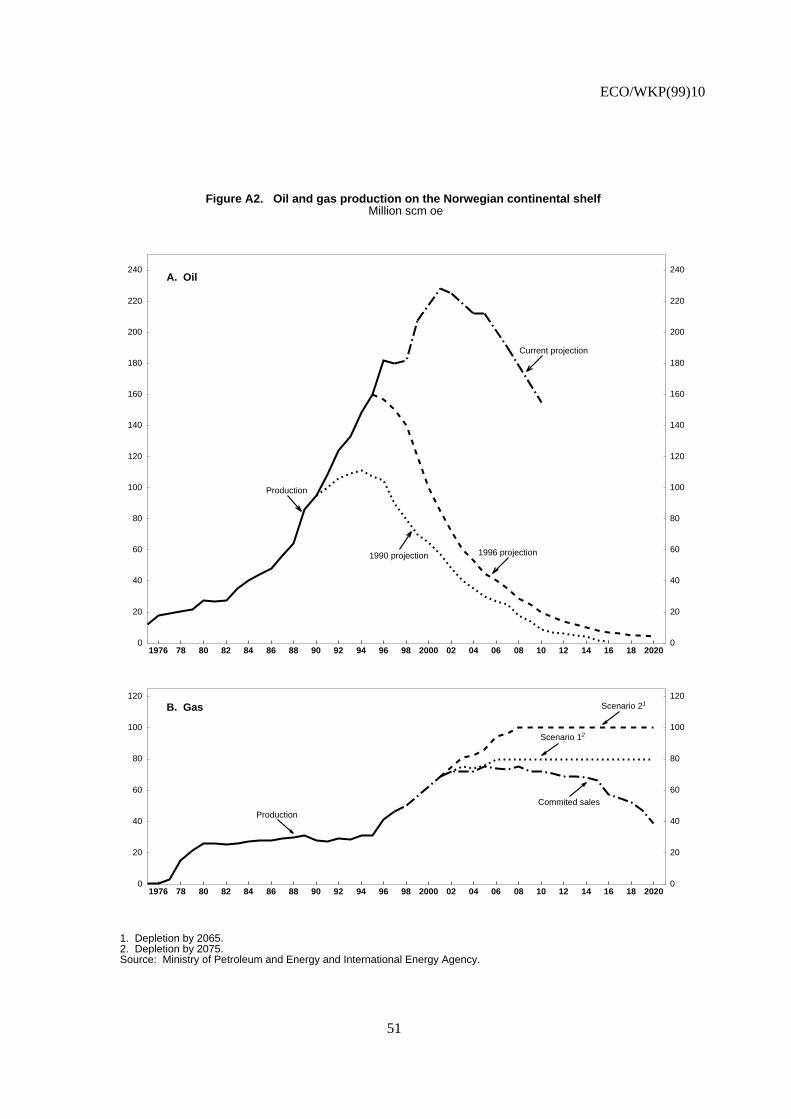
ECO/WKP(99)10
51
Figure A2. Oil and gas production on the Norwegian continental shelfMillion scm oe
1. Depletion by 2065.2. Depletion by 2075.Source: Ministry of Petroleum and Energy and International Energy Agency.
0
20
40
60
80
100
120
140
160
180
200
220
240
0
20
40
60
80
100
120
140
160
180
200
220
240A. Oil
1976 78 80 82 84 86 88 90 92 94 96 98 2000 02 04 06 08 10 12 14 16 18 2020
Production
1990 projection 1996 projection
Current projection
0
20
40
60
80
100
120
0
20
40
60
80
100
120B. Gas 1
2
1976 78 80 82 84 86 88 90 92 94 96 98 2000 02 04 06 08 10 12 14 16 18 2020
Production
Commited sales
Scenario 1
Scenario 2

ECO/WKP(99)10
52
Table A2. Petroleum resources on the Norwegian continental shelf1997
Total Composition, per cent of total
Billion Discovered Undiscoveredscm oe Produced Reserves Other1
Oil and gas2 12.8 18 25 29 28of which: North Sea 8.7 25 27 32 16 Norwegian Sea 2.9 2 24 29 45 Barents Sea 1.2 0 16 15 70
Oil2 6.6 26 29 23 23of which: North Sea 5.0 33 27 24 16 Norwegian Sea 1.3 5 40 20 35 Barents Sea 0.3 0 6 10 84
Gas 6.2 9 22 36 33of which: North Sea 3.6 15 27 42 16 Norwegian Sea 1.7 0 12 35 53 Barents Sea 0.9 0 19 16 65
1. Discovered resources outside fields in operation and expected enhanced recovery.2. Including NGLs.Source: Ministry of Petroleum and Energy.
The supply structure of oil and gas
4. Some 20 international oil companies are engaged in exploration and development activities onthe Norwegian continental shelf. Norway’s approach includes, however, the strong presence ofgovernment in the exploration and development of fields and majority ownership in two companies:Statoil (fully state owned) and Norsk Hydro (51 per cent state interest). The major official justification forthe strong state involvement is that it provides the government with an adequate level of experience andknow-how in setting oil and gas policy. Field participation by the Norwegian state takes place through theso-called State’s Direct Financial Interest (SDFI), which is operated by Statoil on the state’s behalf. Untilthe 14th licensing round, which took place in 1993, Statoil and SDFI were allocated a stake of at least50 per cent on every consortium. As a result, Statoil and SDFI were by far the biggest producers on thecontinental shelf.
5. Direct regulation of oil extraction by the government is possible in theory but, once investmentsare made, it is very costly to interrupt production as oil and gas reserves may be lost forever. In rare cases,for instance, in 1987, production was capped following the price drop in 1986. However, the arrangementbroke down in 1989 and was formally ended in 1990. Moreover, while the authorities do have thepossibility to postpone the issuing of permits for investments on fields in operation, this instrument is used

ECO/WKP(99)10
53
only occasionally to regulate demand pressure on the mainland economy. The pipelines on the shelf areowned by licensees of which Statoil and SDFI have in most cases the majority share — as with extractionuntil the 15th Licensing round in 1995.
6. While the production and sale of oil is largely determined on the spot market, gas exports aremarketed by the Gas Negotiation Committee (GFU), which since 1980 has acted as the sales agent forNorwegian gas.8 GFU members are the Norwegian companies Statoil (chair), Norsk Hydro and SagaPetroleum, who hold licenses for three-quarters of Norway’s total gas reserves. The GFU is responsiblefor preparing and conducting all negotiations, including price and volumes, for the sale of Norwegian gas.Prices are set as a weighted average of competing fuels in the destination market plus a mark-up provisionfor the cost of land transportation, storage, delivery and other services. The two largest customers are theRuhrgas consortium in Germany (42 per cent of deliveries) and Gaz de France (24 per cent).9 It isnoteworthy that gas contracts are not earmarked for a specific field, which has facilitated the set-up of theintegrated gas transportation grid on the shelf (Figure A3). The integrated network has generatedimportant economies of scale and has reduced the need for gas flaring on oil fields, as unused gas can bedelivered through the pipeline grid to other operators for enhanced oil recovery projects. It also created thepossibility of mixing gas from various fields in order to ensure a uniform quality, both over time andacross sales contracts. For this purpose, the Gas Supply Committee (GSC) was established in 1993. TheGSC includes representatives from the twelve largest licensees on the shelf. Its task is to ensure that gas— which is produced in a variety of fields with different characteristics and requires a substantial amountof treatment, processing and transportation — can be delivered to the customers in Europe according tostandardised quality specifications. The GSC formally acts as an advisor to the Ministry of Petroleum andEnergy with the Ministry selecting delivery fields and transportation mechanisms for each contract.
7. Norway plays a valuable and increasingly important role as a secure provider of natural gas inEurope. However, Norway will be faced with new challenges, with the opening up of energy markets inthe EU and the likelihood of significant change in the current structure of the EU gas market. While thecurrent set-up of co-ordinated gas sales and field allocation has generated important economies of scale,and raised the energy efficiency of oil and gas extraction and transportation, Norway will need to takecareful stock of its arrangements in this regard so as to reap the potential benefits of market liberalisation.In particular, the Norwegian authorities should assess the cost and benefits of alternative ways ofmanaging the gas transportation grid and negotiating gas contracts.
The taxation of oil and gas
8. The significant revenues the government draws from the activities on the continental shelf comefrom the special tax regime applying to oil companies, including the fully state-owned company Statoil.The present tax regime includes a standard 28 per cent corporate tax charged on profits net of depreciationallowance, a special surtax of 50 per cent on those profits minus an uplift and a royalty of 8 to 16 per centof gross sales on oil from fields cleared for development before 1986. In addition, an acreage charge islevied as a lump sum per square kilometre licensed and companies are also liable for the CO2 tax.10 Of lesssignificance, in quantitative terms, is the annual dividend pay-out of Statoil, which usually amounts to50 per cent of its after-tax operating profits. However, of increasing importance for public finances are theproceeds from the SDFI’s stakes in licences on the shelf (Figure 2, Panel A). On 1 January 1985, thegovernment created the State Direct Financial Interest which implied that a significant part of Statoil’sprofits henceforth accrued directly to the state. After this arrangement was implemented, all oil and gasextracted by Statoil had to be split into a part owned by the company and a part owned by the state, withStatoil formally acting as an operator on the state’s behalf. The purpose of this measure was to channel a

ECO/WKP(99)10
54
Figure A3. North sea oil and natural gas transportation systems
Source: Norwegian Petroleum Directorate.
GREAT BRITAIN
NORWAY
Statfjord
Murchison Snorre
GullfaksBrage
Troll MongstadStureKollsnes
Bergen
Kårstø
EtzelEmden
ZeebrüggeDunkerque
Teesside
CrudenBay
St. Fergus
Tommeliten
Cod
Ula
GydaEkofiskValhall
Hod
Forties
Sleipner
Brae
Heimdal
Frigg
Odin
Stavanger
Oseberg
Veslefrikk
Draupner
➤
➤
➤
➤
➤
➤
➤
➤
➤
Oil/condensate pipeline
Gaspipeline
ExistingUnderconstruction

ECO/WKP(99)10
55
larger part of the petroleum revenues directly to the government as well as to reduce the company’s abilityto increase the capital base and become too independent from the state.
9. The effective tax burden on the continental shelf is not out of line with that observed in other gasand oil production areas in the world. It is high compared to the mainland, reflecting the fact that offshorevalue added is largely a resource rent. The degree to which the current tax system captures the whole renthas been subject to some debate. A majority in the Green Tax Commission (1996) commented on severalweaknesses in the system which, over time, could induce operators on the continental shelf to avoidoffshore taxes through the establishment of subsidiaries on the mainland. They, therefore, recommendedto reassess the tax rules on the shelf regarding the valuation of financial assets and liabilities offshore andonshore. A minority in the Commission, however, noted that, in view of the complexity of the offshore taxregime, a major in-depth review of the regime would be required before any firm conclusions within thecontext of a green-tax proposal could be formulated. The minority, therefore, could not support therecommendations of the majority.
10. Due to price and volume volatility, the contribution of the state’s oil and gas proceeds to thebudget have varied substantially in the past two decades. Petroleum revenues were substantial in the firsthalf of the 1980s, of the order of 15 per cent of GDP and 20 per cent of total general governmentrevenues, as they were boosted by the high oil price in the wake of the second oil price shock. In thesecond half of the decade, the oil proceeds suffered considerably from the combined collapse of the oilprice and the United States dollar. With the coming on stream of new production facilities, includingthrough the SDFI, however, the government’s petroleum revenues had recovered strongly in recent years.Indeed, the state’s petroleum revenues soared from 3 per cent of GDP in 1994 to 8 per cent in 1997,before plummeting to an estimated 4 per cent of GDP in 1998 after the recent oil price collapse. The oiland gas proceeds are expected to pick up in the coming years, but should start a long-term decline fromthe middle of the next decade due to the fall in oil production.

ECO/WKP(99)10
56
NOTES
1. A standard cubic metre of oil equivalent (scm oe) has the same calorific value as 6.3 barrels of crude oiland 1 000 standard cubic metres of natural gas.
2. Discovered gas reserves are estimated at 2 805 billion cubic metres (bcm), over 40 per cent of the totalestimated reserves in Europe. Undiscovered resources are estimated at 2 410 bcm.
3. There is almost no onshore use of natural gas in Norway, except for one methanol production facility andapart from a small local distribution network near the Karstø gas-landing terminal, a mainlandtransportation and distribution network has not been developed.
4. The Troll field, which is located in the north-western part of Norway’s North Sea territory and roughlylevel with the coasts of Bergen and Stavanger, is the largest oil and gas field that has recently come onstream.
5. The average production costs in Norway are relatively high compared with other oil provinces in the world.The weighted average operating costs are US$4.2 per barrel of oil equivalent (including CO2 tax), comparedwith US$4.2, US$3.9 and US$3.6 on the British, Dutch and Danish parts of the production region. Averagecosts in Norway have been on a declining trend since 1986/87, when major gas fields, in particular the Trollfield, were brought on stream, but this trend may end in the coming decades. Moreover, while the reserveslocated in the main North Sea fields are generally of high quality — light crudes with low sulphur contentand a low CO2 content in the case of natural gas — some newer finds are of not so high quality.
6. White Paper St meld 46 (1997-98) Olje- og gassvirksomheten.
7. There are four main pipeline systems carrying gas to export markets: the Frigg pipeline to St. Fergus(Scotland), Statpipe/Norpipe from the North Sea via the Karstø terminal and the Ekofisk field to Emden,(Germany), Zeepipe from the Sleipner and Troll fields to Zeebrugge (Belgium) and Europipe to Emden(Germany). A new pipeline to Dunkirk in France became operational in 1998 to serve gas sales to Gaz deFrance. A third pipeline to Germany will be operational in 1999. An agreement reached in April 1997 withthe United Kingdom, moreover, opened up the possibility of interconnecting existing pipelines fortransportation of Norwegian gas to customers in third countries.
8. Only gas for own use, or if a better price can be obtained, can be sold outside the GFU, but there is noprecedent to date.
9. Gas sale contracts usually provide for the gas to be delivered at the border of the buyer’s country. Hence thesellers (licensees) also transport the gas. When a new field is developed this usually implies the constructionof a new pipeline and a terminal, and normally a joint venture with the same ownership structure as thefield is formed for this purpose in order to avoid conflicts of interest. Norway has no storage facilities forgas. Variations in demand are matched by variation in production, although there are storage arrangementswith Germany and France concerning one field (Troll). Pipeline tariffs are set by the government.
10. The royalty, the acreage charge and the CO2 tax are deductible from the corporate income tax and thespecial surtax. Investments are allowed to depreciate in six years, at a book value of 130 per cent of theactual value.
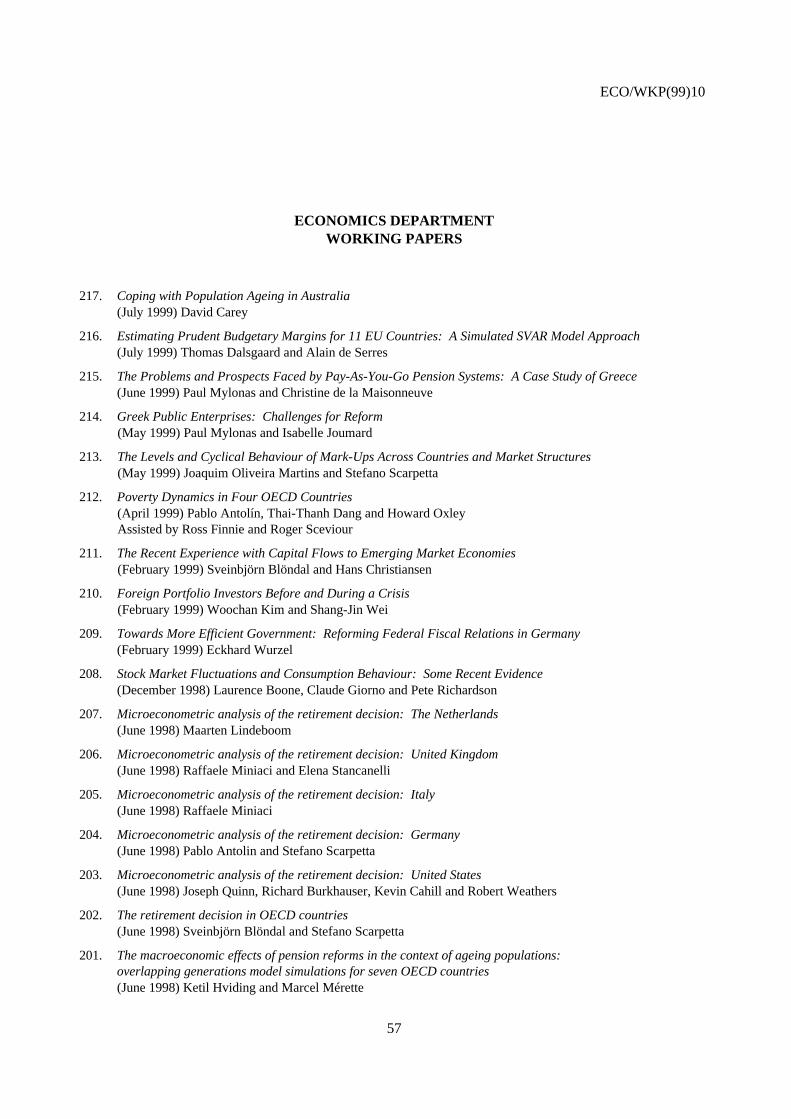
ECO/WKP(99)10
57
ECONOMICS DEPARTMENTWORKING PAPERS
217. Coping with Population Ageing in Australia(July 1999) David Carey
216. Estimating Prudent Budgetary Margins for 11 EU Countries: A Simulated SVAR Model Approach(July 1999) Thomas Dalsgaard and Alain de Serres
215. The Problems and Prospects Faced by Pay-As-You-Go Pension Systems: A Case Study of Greece(June 1999) Paul Mylonas and Christine de la Maisonneuve
214. Greek Public Enterprises: Challenges for Reform(May 1999) Paul Mylonas and Isabelle Joumard
213. The Levels and Cyclical Behaviour of Mark-Ups Across Countries and Market Structures(May 1999) Joaquim Oliveira Martins and Stefano Scarpetta
212. Poverty Dynamics in Four OECD Countries(April 1999) Pablo Antolín, Thai-Thanh Dang and Howard OxleyAssisted by Ross Finnie and Roger Sceviour
211. The Recent Experience with Capital Flows to Emerging Market Economies(February 1999) Sveinbjörn Blöndal and Hans Christiansen
210. Foreign Portfolio Investors Before and During a Crisis(February 1999) Woochan Kim and Shang-Jin Wei
209. Towards More Efficient Government: Reforming Federal Fiscal Relations in Germany(February 1999) Eckhard Wurzel
208. Stock Market Fluctuations and Consumption Behaviour: Some Recent Evidence(December 1998) Laurence Boone, Claude Giorno and Pete Richardson
207. Microeconometric analysis of the retirement decision: The Netherlands(June 1998) Maarten Lindeboom
206. Microeconometric analysis of the retirement decision: United Kingdom(June 1998) Raffaele Miniaci and Elena Stancanelli
205. Microeconometric analysis of the retirement decision: Italy(June 1998) Raffaele Miniaci
204. Microeconometric analysis of the retirement decision: Germany(June 1998) Pablo Antolin and Stefano Scarpetta
203. Microeconometric analysis of the retirement decision: United States(June 1998) Joseph Quinn, Richard Burkhauser, Kevin Cahill and Robert Weathers
202. The retirement decision in OECD countries(June 1998) Sveinbjörn Blöndal and Stefano Scarpetta
201. The macroeconomic effects of pension reforms in the context of ageing populations:overlapping generations model simulations for seven OECD countries(June 1998) Ketil Hviding and Marcel Mérette

ECO/WKP(99)10
58
200. The macroeconomics of ageing, pensions and savings: a survey(June 1998) Richard Kohl and Paul O’Brien
199. Marginal Effective Tax Rates on Physical, Human and R&D Capital(May 1998) Kathryn Gordon and Harry Tchilinguirian
198. The Norwegian Health Care System(May 1998) Paul van den Noord, Terje Hagen and Tor Iversen
197. APEC Trade Liberalisation: Its Implications(May 1998) Seunghee Han and Inkyo Cheong
196. The OECD Jobs Strategy : Progress Report on Implementation of Country Specific Recommendations(May 1998)
196. La Strategie de l’OCDE pour l’emploi : rapport sur l’état d’avancement de la mise en oeuvre des recommandations par pays(May 1998)
195. Trends in OECD Countries’ International Competitiveness(April 1998) Martine Durand, Christophe Madashi and Flavia Terribile
194. The European Union’s Trade Policies and their Economic Effects(April 1998) Peter Hoeller, Nathalie Girouard and Alessandra Colecchia
193. The Macroeconomic Implications of Ageing in a Global Context(March 1998) Dave Turner, Claude Giorno, Alain De Serres, Ann Vourc’h and Pete Richardson
192. Efficiency and Distribution in Computable Models of Carbon Emission Abatement(March 1998) Joaquim Oliveira Martins and Peter Sturm
191. Monetary Policy when Inflation is Low(March 1998) Charles Pigott and Hans Christiansen
190. Submission by the OECD to the G8 Growth, Employability and Inclusion Conference(March 1998)
189. Income Distribution and Poverty in Selected OECD Countries(March 1998) Jean-Marc Burniaux, Thai-Thanh Dang, Douglas Fore, Michael Förster,Marco Mira d’Ercole and Howard Oxley
188. Asset Prices and Monetary Policy(February 1998) Mike Kennedy, Angel Palerm, Charles Pigott and Flavia Terribile
187. NAIRU: Incomes Policy and Inflation(January 1998) Silvia Fabiani, Alberto Locarno, Gian Paolo Oneto and Paolo Sestito
186. OECD Submission to the Irish National Minimum Wage Commission(December 1997)
185. OECD Submission to the UK Low Pay Commission(December 1997)