fomc 19791120 g bpt 219791114
TRANSCRIPT

Prefatory Note
The attached document represents the most complete and accurate version available based on original copies culled from the files of the FOMC Secretariat at the Board of Governors of the Federal Reserve System. This electronic document was created through a comprehensive digitization process which included identifying the best-preserved paper copies, scanning those copies,1 and then making the scanned versions text-searchable.2 Though a stringent quality assurance process was employed, some imperfections may remain.
Please note that this document may contain occasional gaps in the text. These gaps are the result of a redaction process that removed information obtained on a confidential basis. All redacted passages are exempt from disclosure under applicable provisions of the Freedom of Information Act.
1 In some cases, original copies needed to be photocopied before being scanned into electronic format. All scanned images were deskewed (to remove the effects of printer- and scanner-introduced tilting) and lightly cleaned (to remove dark spots caused by staple holes, hole punches, and other blemishes caused after initial printing). 2 A two-step process was used. An advanced optimal character recognition computer program (OCR) first created electronic text from the document image. Where the OCR results were inconclusive, staff checked and corrected the text as necessary. Please note that the numbers and text in charts and tables were not reliably recognized by the OCR process and were not checked or corrected by staff.
CONFIDENTIAL (FR)
November 14, 1979
CURRENT ECONOMIC AND FINANCIAL CONDITIONS
By the StaffBoard of Governors
of the Federal Reserve System

TABLE OF CONTENTS
Section Page
DOMESTIC NONFINANCIAL DEVELOPMENTS II
Employment and production........................... ....... 1Personal income and consumer spending... * ............... 3Residential construction........................................ 8Business fixed investment....... ................................ 9Inventory investment........................................... 12Government sector.............o . 0 ...s..*oo .................. 15Price ........................................................... .... 17Productivity and labor costs.................... .............. 20
TABLES:
Changes in employment ............................. ........... 2Selected unemployment rates.................................. 2Personal income................. ................................. 4Retail sales............................ ............ ............. 7Auto sales........................................................ 7
Private housing activity................................. .............. 10Business investment spending..................................... 13
Capital goods orders............................................ 13Plant and equipment expenditures.................................. 14Plant and equipment surveys ...................................... 14
Business inventories... .......................... ............... 16Inventory-sales ratios ........................................... 16Recent changes in producer prices................................. 18
Recent changes in consumer prices............................. 18
Productivity and costs............................................ 22
Hourly earnings index............................................. 23
Major collective bargaining settlements........................... 23
CHARTS:
Real disposable personal income.............................. 5
Private housing starts.*.................... ............... 11
Tuesday spot prices for copper and silver ......................... 19

TABLE OF CONTENTS (cont.)
Section Page
DOMESTIC FINANCIAL DEVELOPMENTS III
Monetary aggregates and bank credit............................... 3Business sector finance.......................................... 10Government debt markets........................................... 12
Mortgage markets........................................ . 16Consumer credit................................................... 20
TABLES:
Selected financial market quotations. .............................. 2Monetary aggregates.......................... ....................... 4
Member bank reserves .............................. ............... 7Commercial bank credit................. ....................... 9
Gross offerings of corporate and foreign securities.............. ... 11Government security offerings............ ..................... 15
Interest rates and supply of mortgage fundsat selected savings and loans................................. 17
Secondary home mortgage market activity........................... 17
Consumer installment credit....................................... 21
CHARTS:
Selected measures of risk premia.................................. 13Consumer installment credit growth rates........................ 22
INTERNATIONAL DEVELOPMENTS IV
Foreign exchange markets......................................... 1
U.S. Eurodollar market borrowing costs........................... 5Foreign economic developments.................................. 16Individual country notes........................................ 17
TABLES:
Discount rates................. ... ...... ....... . ...... * ......... 2
Prime borrowers short-termborrowing costs in 1979.................... ..................... 6
U.S. merchandise trade deficit................................... 10
U.S. international transactions............. .... ...... .... 13
Real GNP and IP in major industrial countries............ ....... 18
Consumer and wholesale prices in major industrial countries........ 19Trade and current-account balances of major industrial countries... 20
CHARTS:
Weighted-average exchange value of the U.S. dollar................. 3
U.S. merchandise trade ..... ......... ........... ........* . ........ 11

November 14, 1979
SELECTED DOMESTIC NONFINANCIAL DATAAVAILABLE SINCE PRECEDING GREENBOOK
(Seasonally adjusted)
Latest Data Percent Change fromThree
Release Preceding Periods YearPeriod Date Data Period Earlier earlier
(At annual rate)
Civilian labor forceUnemployment rate (%) 1/Insured unemployment rate (%) 1/
Nonfarm employment, payroll (mil.)ManufacturingNonanufacturing
Private nonfarm:Average weekly hours (hr.) 1/Hourly earnings ($) 1/
Manufacturing:Average weekly hours (hr.) 1/Unit labor cost (1967=100)
Industrial production (1967=100)Consumer goodsBusiness equipmentDefense & space equipmentMaterials
Consumer prices all items (1967=100)All items, excluding food & energyFood
Producer prices: (1967=100)Finished goodsIntermediate materials, nonfoodCrude foodstuffs & feedstuffs
Personal income ($ bil.) 2/
Oct. 11-2-79Oct. 11-2-79Oct. 11-2-79Oct. 11-2-79Oct. 11-2-79Oct. 11-2-79
Oct. 11-2-79Oct. 11-2-79
103.56.03.0
90.221.069.2
35.56.28
-. 35.83.04.1
.25.3
35.76.26
Oct. 11-2-79 40.1 40.1Sept. 10-30-79 176.6 1.4
Sept.Sept.Sept.Sept.Sept.
Sept.Sept.Sept.
Oct.Oct.Oct.
10-16-7910-16-7910-16-7910-16-7910-16-79
10-26-7910-26-7910-26-79
11-1-7911-1-7911-1-79
152.3149.9172.494.0
156.2
223.1211.5237.1
223.3256.2251.1
6.312.1
9.87.71.5
13.012.010.7
12.522.45.8
Sept. 10-17-79 1955.2
1.65.72.92.0
-2.33.3
35.6 35.86.18 5.84
40.2 40.56.0 7.7
-. 8-5.0
2.17.4-. 8
12.611.14.1
14.719.5
6.8
2.5-. 65.35.63.3
12.09.99.8
12.115.710.3
10.5 11.3
(Not at annual rates)
Mfrs. new orders dur. goods ($ bil.)Capital goods industries
NondefenseDefense
Inventories to sales ratio: 1/Manufacturing and trade, totalManufacturingTrade
Sept.Sept.Sept.Sept.
Sept.Sept.Sept.
Ratio: Mfrs.' durable goods inven-tories to unfilled orders 1/ Sept.
10-31-7910-31-7910-31-7910-31-79
11-13-7911-31-7911-13-79
10-31-79
78.427.122.44.7
5.412.0
5.954.5
1.40 1.421.54 1.541.28 1.31
.556 .563
Retail sales, total ($ bil.)GAF 3/
Auto sales, total (mil. units.) 2/Domestic modelsForeign models
Oct. 11-9-79Oct. 11-9-79
Oct.Oct.Oct.
11-5-7911-5-7911-5-79
75.5 -1.716.4 -.8
9.4 -12.17.1 -17.42.4 8.5
4.3 9.43.0 10.1
-11.1-13.4-3.5
-15.8-23.2
18.4
Housing starts, private (thous.) 2/ Sept.Leading indicators (1967-100) Sept.
10-17-79 1,88110-30-79 141.3
-2.2 -7.1.6 -1.1
3.411.73.0
87.6
1.431.541.33
.548
8.317.313.043.2
1.421.521.32
.595
1/ Actual data used in lieu of percent changes for earlier periods.2/ At annual rate.7/ Excludes mail order houses.
II - T - I

DOMESTIC NONFINANCIAL DEVELOPMENTS
The third quarter ended with economic activity on a vigorous
note, with considerable strength in September outlays by both consumers
and businesses. In October, however, consumer demand eased considerably
as auto sales fell sharply and nonauto sales were flat in nominal terms. It
is difficult to determine at this point the effects of the Federal Reserve's
October 6 actions; however, there have been reports of a sharp curtail-
ment of housing activity in recent weeks and a significant tightening
of consumer credit. Through October inflation continued at about the
same rapid pace as earlier this year.
Employment and Production
Nonfarm payroll employment increased 300,000 in October, following
a rise of 85,000 in September. Most of the gain occurred in private service-
producing industries. Total factory employment, strike-adjusted, rose
somewhat in October, but remained 80,000 below its July peak. The
factory workweek--at 40.1 hours--was unchanged for a third straight month.
Since the October labor market survey week, automakers have announced
another 10,000 permanent layoffs,bringing the industry total to nearly
98,000; in addition, Ford and Chrysler plan to close plants in the second
week of November, temporarily idling 33,500 workers.
The unemployment rate edged up to 6 percent in October, the
upper end of the 5.6 to 6 percent range that has prevailed since the

II - 2
CHANGES IN EMPLOYMENT 1/(Thousands of employees; based on seasonally adjusted data)
19791978 QI QII QIII Sept. Oct.
- - - Average monthly changes - - -
Nonfarm payroll employment 2/ 334 302 196 73 83 306Strike adjusted 318 304 205 76 75 326
Manufacturing 69 64 -3 -36 -3 4Durable 57 56 3 -6 28 -56Nondurable 12 8 -6 -30 -31 60
Construction 39 48 16 1 -9 28Trade, Finance and Services 169 150 113 80 94 232
Private nonfarm production workers 256 230 111 9 46 308Manufacturing production workers 50 44 -19 -46 3 24
Total employment 3/ 275 329 -29 253 613 -220Nonagricultural 268 344 -2 206 535 -108
1/ Changes are from final month of preceding period to final month of periodindicated.
2/ Survey of establishments. Not strike adjusted, except where noted.3/ Survey of households.
SELECTED UNEMPLOYMENT RATES(Percent; based on seasonally adjusted data)
19791973 QI QII QIII Sept. Oct.
Total, 16 years and older 4.9 5.7 5.7 5.8 5.8 6.0
Teenagers 14.5 15.8 16.2 16.1 16.4 16.620-24 years old 7.8 8.7 8.8 9.2 9.2 9.5Men, 25 years and older 2.5 3.2 3.2 3.4 3.4 3.4Women, 25 years and older 4.0 4.9 4.9 4.8 4.6 4.9
White 4.3 5.0 4.9 5.1 5.1 5.2Black and other 8.9 11.4 11.6 10.8 10.6 11.7
Fulltime workers 4.3 5.2 5.2 5.4 5.4 5.5
White collar 2.9 3.4 3.3 3.4 3.3 3.5Blue collar 5.3 6.5 6.7 7.2 7.1 7.3

II - 3
middle of 1978. The number of unemployed persons rose nearly 200,000 in
October to 6.2 million, with the increases concentrated among adult
women and black workers. Jobless rates were essentially unchanged for
adult men and full-time workers. Total employment, as measured by the
household survey, declined 220,000, after a rise of more than 600,000 in
September. Monthly movements in this measure of employment have been
somewhat erratic in recent months, and the October level was not much
different than in July.
Industrial production was about unchanged in October, continuing
on the plateau it has held since the spring. A moderate rise occurred
in the production of consumer nondurable goods while strikes contributed
to a decline in the output of business equipment. Automobile assemblies
were unchanged in October; however, auto producers have announced plans
to significantly reduce production rates in November and December in the
face of lagging sales. Output of basic steel declined further in
October. Overall, manufacturing industries operated at about 85 percent
of capacity in October, close to the September rate and approximately
2 percentage points below the peak level reached in March. Since March,
most of the reduction in the utilization rates has reflected sharp declines
in operating rates for the motor vehicle and steel industries.
Personal Income and Consumer Spending
Personal income grew at a 7-1/2 percent annual rate in September,
roughly the same rate as in August. A pickup in the growth of private
wage and salary disbursements was offset by declines in property income,

II - 4
PERSONAL INCOME
(Based on seasonally adjusted annual rate data)
19791977 1978 QI QII QIII
- - Average monthly change, in billions
Total personal incomeNonagricultural incomeAgricultural income
Wage and salary disbursementsPrivate
Manufacturing
Other incomeTransfer payments
Total personal incomeCurrent dollarsConstant dollars 2/
Wage and salary disbursementsCurrent dollarsConstant dollars 2/
Memorandum:Real per capita disposable
income
August Sept.
of dollars - -
$13.9 $17.8 $15.1 $11.0 $16.7 $11.1 $12.112.6 17.11.2 .7
8.4 11.57.0 10.12.5 3.2
6.0 7.11.2 1.5
- - Percentage
11.54.5
11.24.2
4.5
15.3-.2
11.810.83.5
5.61.8
change,
11.4-.4
6.14.9.5
5.21.8
compound
12.9 11.4 8.93.6 .4 -4.2
12.8 12.7 8.03.5 1.5 -4.9
1.2 -2.3
18.5-1.8
8.57.61.0
8.76.3
annual
13.2 14.0-2.1 -1.9
5.7 10.54.3 9.9
-1.8 2.6
5.6 2.22.8 2.3
rates 1/ --
11.2 6.9-1.5 -5.7
8.4 5.6 10.2-4.0 -7.0 -2.8
-2.0 n.a. n.a.
7.5-5.5
1/ Changes over a period longer than one quarter are from final quarter of precedingperiod to final quarter of period indicated. Monthly percent changes at annual rates,not compounded.
2/ Deflated by the CPI for all urban consumers, seasonally adjusted.
1979

REAL DISPOSABLE PERSONAL INCOME(Billions of 1972 dollars)
I I I I I'I Il l I I I
DPI/PCE implicit deflator
- -- - - - DPI/CPI
- .
(1% -/ **%~~*~
%Nd
SI I I IiiilIIIIIII
1050.0
1000.0
950.0
900.0
850.0
800.0
750,0
1973 1975 1977 1979

II - 6
partly due to storm damage in the South. Despite sizable nominal gains,
income growth continues to lag inflation. Most measures of real income--
before or after tax--peaked at the turn of the year; however, the
extent of the subsequent decline is sensitive to the measure used for
deflation. For instance, disposable personal income deflated by the
consumer price index has fallen 2 percent from the peak; this contrasts
with a 1/2 percent drop for the same income series adjusted by the
implicit deflator for personal consumption.
Consumer demand was quite strong during the third quarter despite
the losses in real income. From June to September retail sales rose 6.9
percent (4.8 percent in real terms). In October, however, retail sales
declined 1.7 percent, as automobile purchases fell sharply. Excluding
autos and nonconsumption items, nominal retail sales were about unchanged
in October. Within this grouping, sales at general merchandise, apparel,
furniture, and appliance (GAF) stores, which are largely discretionary
items, declined 0.8 percent. In real terms, retail sales in October
probably fell more than 2-1/2 percent.
Unit auto sales were at a 9.4 million annual rate in October, the
slowest pace since the strike-affected fourth quarter of 1976. The
annual sales rate for domestic models fell nearly 1-1/2 million units to
a 7.1 million unit annual rate in part due to the ending of rebates
and price discounts which buoyed purchases in August and September.
Initial response to the 1980 models--introduced a month later than usual
because of overhangs of 1979 models--was considered disappointing by

II - 7
RETAIL SALES(Percent change from previous period;
based on seasonally adjusted data)
.. 1979 1979
QII QIII Aug. Sept. Oct.(p)
Total sales .5 4.1 3.3 2.6 -1.7
(Real) 1/ -2.0 2.1 3.0 1.5 n.a.
Total, less auto andnonconsumption items 2.4 4.1 1.9 2.3 -.1
GAF 2/ 2.4 5.4 3.2 .5 -. 8
Durable -2.7 4.9 6.0 3.6 -4.5Auto -7.1 3.6 8.8 4.5 -8.2Furniture & appliances 2.3 8.6 3.9 .7 -2.0
Nondurable 2.3 3.7 2.0 2.1 -.2Apparel .8 5.8 3.6 -2.9 -2.8Food 2.5 2.0 -1.2 4.2 -.6General merchandise 3/ 3.1 4.0 2.8 1.8 .5Gasoline 7.2 6.8 9.2 .7 1.6
1/ BCD series 59.2/ General merchandise, apparel, furniture and appliance stores.3/ General merchandise excludes mail-order nonstores; mail-order
sales are also excluded in the GAF composite sales summary.
AUTO SALES(Millions of units; seasonally adjusted annual rates)
1979QI QII QIII July Aug. Sept. Oct.
Total 11.5 10.6 10.8 10.6 11.0 10.7 9.4
Imports 2.4 2.6 2.3 2.5 2.2 2.2 2 . 4 (p)
Domestic 9.1 8.0 8.5 8.1 8.8 8.5 7.1
Small 3.7 3.9 3.5 3.8 3.3 3.6 3.2
Intermediate &Standard 5.4 4.1 4.9 4.4 5.4 4.9 3.9
Note: Components may not add to totals due to rounding.

II - 8
industry sources. In contrast, sales of foreign models--apparently
held down this summer by inventory shortages-rose by 200,000 units
(annual rate) in October.
Surveys of consumer confidence in October reported mixed
results. The Conference Board's composite index of consumer attitudes
rebounded strongly in October to the level reported last spring, although
it is still below the readings reported in late 1977 and early 1978. On
the other hand, the generally more reliable University of Michigan Survey
Research Center index of sentiment declined slightly, and is in the
general range reported during the last recession. There was no obvious
explanation for the divergent movements in the two surveys; however, the
wording of the questions in the surveys varies, and significant
differences between the two measures have occurred in the past. Both
surveys continued to report relatively favorable attitudes toward market
conditions for buying large durable goods and houses. But the Michigan
survey reported that attitudes about conditions for buying big ticket
items were somewhat less favorable among respondents interviewed after
the System's October 6 action than among those interviewed earlier.
Residential Construction
Notwithstanding tightening financial conditions during the late
summer, private housing starts edged up to a 1.9 million unit annual
rate in September--near the top of the range that has prevailed since
May. However, reports from several sources suggest that home sales and

II - 9
building activity late in October were severely curtailed by developments
associated with the System's recent policy actions. Potential home purchasers
were apparently discouraged by increased financing costs and diminished
credit availability--partly due to usury ceilings--while builders' costs
increased as a result of higher borrowing rates.
Demands for housing--spurred by the attractiveness of homes as
an investment in an inflationary environment--remained strong through
September. For the third quarter as a whole, existing home sales were
4 percent higher than the second quarter and only 1 percent below the
relatively high 1978 average. New-home sales were unchanged in September,
with the third quarter pace down by only 6 percent from the 1978 monthly
average. Single-family starts stayed at a 1.2 million annual rate in
September, marking 7 consecutive months of stability in this series.
Multifamily starts were up more than 10 percent, in part due to the usual
fiscal year-end bulge in government subsidized units (HUD, Section 8).
Business Fixed Investment
Spending for business capital equipment in September continued
to advance following the reduced levels of the spring, as shipments of
nondefense capital goods rose 1.6 percent. For the third quarter as a
whole, these shipments were up 5.7 percent--the highest rate of growth
in a year. In contrast to capital equipment, outlays for other invest-
ment items have shown less strength. Expenditures on nonresidential
construction from July to September were on a plateau about 4 percent above

II - 10
PRIVATE HOUSING ACTIVITY(Seasonally adjusted annual rates, millions of units)
1978 19791/ 1/ 2/
Annual QIV QII QIII July Aug. Sept.
TotalPermits 1.80 1.82 1.59 1.65 1.53 1.65 1.78Starts 2.02 2.08 1.83 1.82 1.79 1.81 1.88
Single-family
Permits 1.18 1.22 1.03 1.02 1.00 1.03 1.02Starts 1.43 1.49 1.26 1.24 1.22 1.24 1.25
SalesNew homes .82 .84 .71 .77 .78 .76 .76Existing homes 3.91 4.27 3.73 3.88 3.77 3.85 4.01
Multifamily
Permits .62 .60 .56 .64 .53 .62 .61Starts .59 .59 .57 .59 .57 .57 .63
Mobile home shipments .28 .29 .27 n.a. .28 .28 n.a.
1/ Regular monthly revision.2/ Preliminary estimates except permits which reflect first monthly revision.

II - 11
PRIVATE HOUSING STARTS(Seasonally adjusted annual rate)
Millions of units- 2.4
2.0
1.6
.NGLE-FAMILY1.2
MUTIFAMILY
1976 1977 1978 1979

II - 12
the second quarter average. Business spending on motor vehicles, moreover,
has declined as sales of heavy weight trucks fell off sharply in August
and September from the advanced July level.
Capital spending commitments continue to suggest some moderation
of the recent strong spending growth in the near term. Although new
orders for nondefense capital goods rose 10.8 percent from July to September,
they still remain below the first quarter level. Similarly, private
building and nonbuilding contracts in September remained near the levels
that have prevailed since the start of the year.
The McGraw-Hill survey of 1980 business capital spending plans
reports that business plans to increase fixed investment by 9.6 percent
in 1980. Adjusting this rise for the capital goods price increases
expected by the survey respondents, the results suggest no change in
real outlays after three years of substantial growth, which is broadly
consistent with the commitments data. For the most part, this survey
was teken before the October 6 Federal Reserve policy actions, which
could lead to some retrenchment in spending plans. Historically this
survey has had a tendency to underestimate spending growth during
cyclical expansions and overestimate during recessions.
Inventory Investment
Strong sales in the third quarter along with some production
adjustments, particularly in the automobile industry, have helped avoid
the development of any serious inventory overhangs. The book value of
all manufacturing and trade stocks increased at an exceptionally slow

II - 13
BUSINESS INVESTMENT SPENDING(Percent change from receding comparable period, based on seasonally adjusted data)
September 19781979 to
QI QII QIII July Aug. Sept. September 1979
Nondefense capital goodsshipments 5.2 -.6 5.7 3.3 2.8 1.6 13.1
Nonresidential constructionput-in-place 0.0 8.0 4.5 1.9 -0.1 -0.4 17.0
Building 0.6 10.9 5.4 2.1 -1.4 0.1 22.3
Nonbuilding -0.7 4.3 3.4 1.6 1.6 -1.1 10.7
CAPITAL GOODS ORDERS(Percent change from preceding comparable period, based on seasonally adjusted data)
September 19781979 to
QI QII QIII July Aug. Sept. September 1979
Nondefense capital goods 12.0 -7.0 .5 -7.0 4.6 5.9 13.0
Machinery 6.1 -5.2 2.2 -5.0 6.3 2.6 9.9
Nonmachinery 26.9 -10.7 -3.3 -11.4 0.7 13.9 20.5

II - 14
PLANT AND EQUIPMENT EXPENDITURES(Percent change from prior year)
Anticipated for 1979 Anticipated for 19801/
Commerce Department McGraw-HillAugust FallSurvey Survey
All business 13.2 9.6
Manufacturing 14.6 13.5
Durables 18.5 12.6
Nondurables 11.2 14.4
Nonmanufacturing 12.0 6.3
1/ Results are adjusted for systematic bias. Without this adjustment, the AugustCommerce survey showed a 15.2 percent increase.
PAST REPORTS OF PLANT AND EQUIPMENT SURVEYS(Percent change from prior year)
ActualYear
1957 6.2
1958 -15.9
1960 9.5
1961 -2.3
1970 5.5
1974 12.7
1975 0.3
1976 6.8
1977 12.7
1978 13.3
1/ Prior to 1976 thisIncorporated.
McGraw-HillFallSurvey
11.0
-6.7
10.0
-2.7
7.8
13.6
11.8
8.8
13.0
11.1
survey was taken by
1/Merrill Lynch
FallSurvey
9
-8
8
-5
10
12
10
3
14
10
Lionel D. Edie and Company,

II - 15
$4.8 billion annual rate in September. The book value of manufacturers
inventories increased at an annual rate of $20.5 billion in September,
well below the average rate during the first eight months of the year.
The inventory-sales ratio for all manufacturers remained at 1.54, the
level which has prevailed since June. Total trade stocks declined at a
$15.7 billion annual rate in September, the first reduction since October,
1976. A decline in retail inventories--concentrated in the automotive
area--more than offset a small increase at wholesale. The inventory-sales
ratio for all trade fell to 1.28.
The overall pattern of inventory investment recently has been
heavily influenced by sizable swings in automobile stocks. Excessive
inventories had accumulated by the end of July in the motor vehicle
industry due to this summer's gasoline shortages and price increases.
By the end of September, summer sales promotions and production cutbacks
had been largely successful in liquidating the July overhang at auto
dealers. In October, however, dealers' stocks of domestic autos rose
once again as sales weakened, and further production adjustments are
planned.
Government Sector
Reported federal budget totals for fiscal year 1979 indicate
that the unified budget deficit was $27.7 billion, down sharply from
$48.9 billion for the preceding fiscal year. Outlays totaled $493.6

II - 16
BUSINESS INVENTORIES(Billions of dollars; annual rate of change
in seasonally adjusted book values)
1978 1979
QI QII QIII Aug. Sept.
Manufacturing and trade 41.5 49.1 56.3 45.4 37.7 4.8
Manufacturing 18.1 30.2 35.0 25.8 25.8 20.5Durable 13.7 24.2 25.7 15.9 19.3 8.3Nondurable 4.4 6.0 9.3 10.0 6.5 12.2
Trade, total 23.5 18.9 21.3 19.5 11.8 -15.7Wholesale 12.8 13.2 4.7 15.1 7.0 3.4Retail 10.7 5.6 16.6 4.5 4.8 -19.1
r = Revised.p = Preliminary.
INVENTORY TO SALES RATIOS
1978 1979QI QII QIII Aug. Sept.
Manufacturing and trade 1.42 1.41 1.44 1.43 1.42 1.41
Manufacturing 1.52 1.49 1.55 1.55 1.54 1.54Durable 1.85 1.82 1.94 1.97 1.95 1.97Nondurable 1.15 1.11 1.11 1.10 1.09 1.09
Trade, total 1.33 1.33 1.33 1.31 1.32 1.28Wholesale 1.29 1.23 1.18 1.17 1.17 1.15Retail 1.45 1.43 1.48 1.44 1.46 1.41
r = Revised.p = Preliminary.

II - 21
billion, around $3 billion less than the Administration's July estimate.
This smaller growth resulted for larger-than-anticipated-loan-repayments
from farmers to the Commodity Credit Corporation, by a reduced fill rate
for the Strategic Petroleum Reserve, and by a delay in the processing
of small business and farm disaster loans. In addition, revenues were
higher than anticipated, reflecting stronger than expected income growth,
large final settlements on 1978 tax liabilities, and larger overwithholding
of 1979 income.
For fiscal year 1980, the Administration now is forecasting a
deficit of $33 billion, about $3 billion higher than the figure approved
by conferees on the Second Concurrent Budget Resolution. These estimates,
however, are considered by OMB to be highly tentative and are quite
sensitive to revenue assumptions about economic activity, energy related
outlays, and changes in tax laws.
Current hiring increases by State and local governments remain
quite moderate, as these units try to limit the operating deficits that
have re-emerged in this sector. Preliminary employment figures indicate
that State and local employment was about unchanged in October. Further
pressure has been placed on State and local governments by the tightening
of financial markets in October, as poor market conditions caused the
withdrawal or postponement of about one-fifth of scheduled new bond issues.

II - 18
RECENT CHANGES IN PRODUCER PRICES
(Percent change at compound annual rates; basedon seasonally adjusted data)1/
RelativeImportance 2/Dec. 1978
Finished goodsConsumer foodsConsumer nonfood
EnergyExc. energy
Capital equipment
Intermediate materials 3/
Exc. food and energy
Crude food materials
Crude nonfood
Exc. energy 4/
100.025.445.2
7.238.129.4
94.683.5
58.641.411.2
1978
9.211.98.48.08.58.0
8.38.9
18.315.621.3
Dec. 78- 1979Oct. 79 Aug. Sept. Oct.
12.35.9
18.469.59.18.8
13.914.621.369.910.51.7
17.122.022.681.2
8.53.3
12.5-1.119.456.19.1
14.3
16.9 16.7 18.4 22.413.3 10.8 12.2 20.1
10.9
25.517.6
-2.95.8
-31.0
17.535.1
3.2
5.833.752.5
Changes are from final month of preceding period to finalindicated. Monthly changes are not compounded.
month of period
2/ Relative importance weights are on a stage of processing basis, as a percentageof respective totals for finished goods, intermediate materials, and crudematerials.
3/ Excludes intermediate materials for food manufacturing and manufacturedanimal feeds.
4/ Also excludes agricultural nonfood materials.
RECENT CHANGES IN CONSUMER PRICES 1/(Percent change at compound annual rates; based
on seasonally adjusted data) 2/
Relativeimportance Dec. 78- 1979Dec. 1978 1978 Sept. 79 July Aug. Sept.
All items 100.0 9.0 13.2 11.7 12.6 13.0Food 18.2 11.8 9.6 1.5 .0 10.7Energy 3/ 8.5 8.0 46.7 51.0 38.5 32.4All items less foodand energy 3/ 73.3 8.5 10.7 8.7 12.2 12.0Commodities 35.9 7.6 8.4 7.8 7.8 7.7Services 37.4 9.4 12.3 12.0 14.4 13.2
Memoranda:Gasoline 4.2 8.5 61.6 60.3 47.8 41.8Homeownership 23.6 12.4 18.0 16.7 20.1 16.6
Based on index for all urban consumers.Changes are from final month of preceding period to finalindicated. Monthly changes are not compounded.Energy items: gasoline and motor oil, fuel oil and coal,Not seasonally adjusted.
month of period
gas and electricity.

II - 19
TUESDAY SPOT PRICES FOR COPPER AND SILVER
Copper
Dollars per lb.S 1.2r
1,10
1.00
.90
.80
I I I I I I I I I I 1 .70
Dollars per troy oz.--- 1 19.0
17.0
15.0
13.0
11.0
9.0
7.0
5,0
J F M A M J J
1979
Latest data plotted are November 6, 1979.
A S 0 N D
Silver

II - 20
Excluding food and energy, movements in the consumer price index
continue to be dominated by homeownership costs which rose at more than a
16 percent annual rate in September after a 20 percent rate of advance in
August. These large increases reflect rising house prices as well as
advances in mortgage interest rates. Price increases have accelerated in
recent months for several other categories, notably apparel, rent, and
public transportation; fuel prices were probably an important contributing
factor for the last two. In September the price increases for these
items was offset somewhat by declines in used car prices and a slowing in
new car price rises associated with incentive and rebate programs. Out-
side the consumer area, prices for metals and related products increased
on a broad front during September and early October; however, spot prices
for some nonferrous metals, including precious metals, generally levelled
off or declined through the end of October and early November.
Productivity and Labor Costs
Labor cost pressures remained intense last quarter because
of another relatively poor productivity performance. Output per hour in
the nonfarm business sector was virtually unchanged in the third quarter
of this year, following two quarters of decline. Productivity has
declined by 1-1/2 percent over the last year.
Hourly compensation in nonfarm business rose at an 8-1/4 percent
annual rate in the third quarter; this increase, combined with the small
productivity advance, drove unit labor costs up at an 8 percent annual

II - 22
PRODUCTIVITY AND COSTS
(Percent change from preceding period at compound annual rates;based on seasonally adjusted data)
1978 1979 1976:QIV- 1977:QIV- 1978:QIIIQIV QI QII QIII 1977:QIV 1978:QIV 1979:QIII
Output per hour
Total private business .3 -3.0 -2.2 .1 1.4 .8 -1,2Nonfarm business .8 -3.2 -4.1 .2 1.2 1.1 -1.6Manufacturing 2.0 -2.4 2.9 3.2 2.6 1,6 1.4Durable 1.2 -3.2 2.9 -.2 1.9 .9 .1Nondurable 3.4 -.9 2.7 8.6 3.6 2.6 3.4
Compensation per hour
Total private business 8.5 11.1 9.3 8.5 7.3 9.1 9.4Nonfarm business 8.8 10.4 7.9 8.2 7.5 9.1 8.8Manufacturing 9.3 10.3 9.8 8.0 8.0 8.7 9.4
Durable 9.6 10.3 9.7 8.0 8.3 8.4 9.4Nondurable 7.8 10.0 10.6 7.9 7.1 8.7 9.1
Unit labor costs
Total private business 8.1 14.6 11.8 8.3 5.8 8.3 10.7Nonfarm business 8.0 14.0 12.5 7.9 6.2 7.9 10.6Manufacturing 7.1 13.0 6.7 4.6 5.3 7.1 7.8
Durable 8.3 13.9 6.6 8.2 6.2 7.4 9.2Nondurable 4.2 11.0 7.7 -.7 3.4 6.0 5.5

II - 23
HOURLY EARNINGS INDEX 1/(Percent change at compound annual rates;based on seasonally adjusted data) 2/
Oct. 77- Oct. 78- 1979Oct. 78 Oct. 79 QI QII QIII Sept. Oct.
Total private nonfarm 8.3 7.7 8.5 7.1 8.4 10.3 3.6
Manufacturing 8.3 8.8 8.5 9.7 8.2 9.0 8.3Contract construction 7.1 6.6 7.7 7.6 6.5 6.6 1.0Transportation and publicutilities 7.5 8.5 8.6 3.5 15.6 11.4 2.1
Total trade 9.4 7.3 10.3 5.8 7.1 7.5 1.5Services 7.6 6.8 7.5 5.4 7.3 15.8 2.9
1/ Excludes the effect of interindustry shifts in employment and fluctuations inovertime pay in manufacturing.
2/ Monthly percent changes at annual rates, not compounded.
MAJOR COLLECTIVE BARGAINING SETTLEMENTS(Percent change at annual rates)
Average adjustment 19791975 1976 1977 1978 QI QII QIII
Wage-rate settlements (1,000 or more workers) 2/First year adjustments 10.2 8.4 7.8 7.6 4.8 9.0 6.6Average over life of contracts 1/ 7.8 6.4 5.8 6.4 6.6 7.0 4.8
Wage and benefit settlements (5,000 or moreworkers)First year adjustments 11.4 8.5 9.6 8.3 2.5 10.6 9.0Average over life of contracts 1/ 8.1 6.6 6.2 6.3 5.2 7.7 6.0
Effective wage-rate adjustments (1,000 ormore workers) 8.7 8.1 8.0 8.2 1.4 2.4 2.9Current settlements 2.8 3.2 3.0 2.0 .2 1.0 .8Prior settlements 3.7 3.2 3.2 3.7 .6 .9 1.0Escalator provisions 2.2 1.6 1.7 2.4 .6 .5 1.0
1/ Excluding cost-of-living adjustments.2/ The first-year change data do not reflect the pay increase received by a large number of
railroad workers in the first quarter of 1979 because their contracts were retroactive toJanuary 1978; under BLS practices this was reported as a second-year wage adjustment.

II - 24
rate to a level 10-1/2 percent higher than a year earlier. Wage rates
for nonfarm production workers, as measured by the index of average hourly
earnings, rose at a 3-1/2 percent annual rate in October to a level 7-3/4
percent above a year ago. Manufacturing wages increased at an 8-1/4
percent annual rate in October, about the same as in the third quarter,
while the increases for most other industries were smaller.
First-year wage-rate increases in major collective bargaining
settlements (1,000 or more workers) were 6.6 percent in the third quarter,
and have averaged 7-1/2 percent during the first 9 months of 1979, about
the same as the average for all of 1978. Over the life of the contracts,
annual wage advances excluding potential increases under cost-of-living
escalator (COLA) clauses were 4.8 percent in the third quarter, and
have averaged 6.1 percent so far this year--about the same as in 1978. In
larger units where data are reported on fringe benefits as well as wages,
settlements in the third quarter provide first-year increases of 9.0
percent--6.0 percent over the life of the contract (excluding COLAs).
"Effective" wage rate increases for workers covered by major contracts,
including deferred increases and COLA payments, have been relatively
moderate given the acceleration of prices; they were 2.9 percent in the
third quarter, bringing the increase to 6-3/4 percent (not at an annual
rate) over the first 9 months of 1979--about the same as the average for
the same period in 1978. COLA increases have accounted for about a
third of effective wage changes in major contracts so far this year--up
from one-fourth during the same period last year.

II - 17
Prices
Inflationary pressures, which have increased considerably
this year, have shown little sign of abating. Consumer prices rose at
an annual rate of 13 percent in September--about the same as since early
this year. An acceleration in food price increases offset a slight
easing in energy inflation. At the producer level, finished goods prices
rose at a 12 percent annual rate in October--less than the 17 percent
rate in September, largely due to a decline in consumer food prices.
Energy prices are still increasing about three times the overall
rate of inflation. At the consumer level, the index of directly purchased
energy items (e.g., gasoline, fuel oil, natural gas, and electricity) rose
at an annual rate of nearly 47 percent from December 1978 through September
of this year, compared with an 8 percent increase over all of 1978.
Moreover, the continued diffusion of energy price hikes throughout the
economy has been evident in sharp markups for petroleum-based products
such as industrial chemicals, fertilizers, plastics, and synthetic fibers.
Food prices, by contrast, have shown a mixed picture in recent
months. The food index rose at a 10-3/4 percent annual rate at retail in
September following a three month respite. However, at the producer
level a drop in meat prices contributed to a slight decline in finished
food prices in October after substantial increases in August and
September. At the farm level, feedgrain spot prices--a key determinant
of long-run livestock supplies and prices--declined through October,
reflecting an abundant harvest and a large carry-over of these grains from
previous crops.

III-T-1SELECTED DOMESTIC FINANCIAL DATA
Latest data Net Change from:Indicator Month Three Year
Period Level ago months ago ago
$ billions Per cent at annual rates
Monetary and credit aggregates1/Total reserves October 42.5 20.5 13.2 1.9Nonborrowed reserves October 40.5 0.9 5.0 0.2Money supplyM1 October 378.6 2.5 6.9 4.8M2 October 938.6 8.6 10.7 7.9M3 October 1,604.3 7.5 9.5 8.0
Time and savings deposits (less CDs) October 560.0 12.8 13.3 10.0CDs2/ October 91.1 3.0 6.4 2.5Thrift deposits (S&Ls + MSBs+ Credit Unions) October 665.7 6.0 7.8 6.0Bank credit October 1,134.0 8.0 13.9 13.5
Net Change from:Latest data Three
Indicator Per cent Month months YearPeriod or index ago ago ago
Market yields and stock pricesFederal funds wk. endg. 11/7/79 13.77 1.86 3.11 4.01Treasury bill (90 day) " 11/7/79 12.16 .93 2.79 3.31Commercial paper (90-119 day) " 11/7/79 14.26 1.83 4.22 4.25New utility issue Aaa " 11/9/79 11.50 1.28 2.10 2.20Municipal bonds (Bond Buyer) 1 day 11/8/79 7.27 .15 1.14 1.10FNMA auction yield (FHA/VA) 10/29/79 13.29 2.05 2.64 3.09Dividend price ratio (common
stocks) wk endg. 11/7/79 5.88 .62 .43 .44NYSE index (12/31/65=50) end of day 11/5/79 57.81 -5.58 -1.52 5.09
Net Change or Gross OfferingsLatest Year Year to Date
Period Data ago 1979 1978
Credit demandsBusiness loans at commercial banks 1/Consumer instalment credit outstanding 1/Mortgage debt outstanding (major holders)1/3/Corporate bonds (public offerings)Municipal long-term bonds (gross offerings)Federally sponsored agcy. (net borrowing)U.S. Treasury (net cash borrowing)
OctoberSeptemberAugustOctoberOctoberOctdberOctober
3.44.47.52.7e4.2e2.9e1.3e
3.53.79.91.73.21.96.5
42.629.559.622.5e35.4e19.7e19.7e
29.831.673.217.040.519.344.8
Seasonally adjusted.$ billions, not at annual ratesIncludes comm'l banks, S&Ls, MSBs, life ins. cos, FNMA, and GNMA.Estimated
A/2/
e -

III-1
DOMESTIC FINANCIAL DEVELOPMENTS
Interest rates have climbed and stock prices have fallen since the
System's October 6 policy announcement. Financial markets have been adjusting
not only to the System's one percentage point boost in the discount rate and
establishment of marginal reserve requirements on certain managed liabilities,
but also to the greater variability of money market interest rates associated
with the Desk's pursuit of a reserves operating target. The federal funds
rate averaged around 15 percent in the second half of October, but most
recently fed funds have traded around 13-1/2 percent, more than 1-1/2 percent-
age points higher than in early October. Treasury bill rates have climbed, on
balance, around 1-1/4 percentage points for 3- and 6-month maturities, while
commercial paper yields have increased by much larger amounts. Commercial
banks have raised the prime rate to 15-1/2 percent. Responding to the pres-
sures associated with both the rise in short-term rates and concerns about
further tightening actions, long-term yields also have moved substantially
higher. Bond yields have climbed 3/4 to 1-1/4 percentage points since early
October, and average rates on new home-mortgage commitments have risen by 1-1/2
percentage points. Stock prices generally have declined 8 to 10 percent.
Financial markets were very unsettled in the period immediately
following the October 6 announcement. The sharp increases in interest rates,
uncertainties about future interest rate movements, and the System's new
operating procedures made many security dealers reluctant to take positions.
Bid-asked and underwriting spreads widened, and prices were exceptionally
volatile on relatively thin trading in most markets. Investor caution was
evidenced by substantially wider risk premia, and a large number of scheduled

III-2SELECTED FINANCIAL MARKET QUOTATIONS
(percent)
1974 1978 197 1979 2/ Change from:1 / 1 / O1c FOMC Oct. Oct.
High Jan.4 Jan.3 Oct. 23 Nov. 13Oct. 5 FOMC 23
Short-term rates
Federal funds 1/
Treasury bills1-month
3-month6-month
1-year
Commercial paper1-month3-month6-month
Large negotiable CDa 3/1-month
3-month
6-month
Eurodollar deposit 1/1-month
3-month
Bank prime rate
Intermediate- and long-term rates
U.S. Treasury(constant maturity)3-year7-year
20-year
Municipal(Bond Buyer) 4/
Corporate AaaNew issue 5/Recently offered 6/
Primary conventionalmortgages 6/
13.55 6.69 10.59 11.91 15.14 13.46p 1.55 -1.68
9.88
9.63
9.759.54
12.2512.2512.00
12.5812.6412.30
5.816.16
6.456.55
6.626.686.70
6.626.76
7.01
8.939.309.499.68
10.3210.5710.62
10.3710.9311.51
10.4010.7010.6310.28
11.7311.8611.84
12.0912.5012.80
12.6013.0112.7612.19
13.9114.1314.14
14.5114.8915.07
12.3212.06
11.90
11.06
13.9414.0213.61
13.79
13.96
13.93
1.921.361.27.78
2.212.161.77
1.701.461.13
13.78 6.89 11.14 12.45 14.74 14.58 2.1314.01 7.25 11.81 12.79 15.14 15.43 2.64
12.00 7.75 11.75 13.50 15.00 15.50 2.00
8.848.528.69
7.387.728.00
9.619.239.00
10.019.679.44
11.9811.1910.44
11.02
10.7510.39
7.15 5.64 6.58 6.64 7.18 7.27
10.6110.52
1.011.08.95
.63
- - 10.22 11.05 11.50p 1.288.48 9.51 10.25 11.00 11.46p 1.21
10.03 9.00 10.38 11.35 11.75 12.85 1.50 1.10
1974 1978, 1979 FOMC Oct. Oct.7/ 7/ 7/ Oct. 23 Nov. 13
Low - jan.6 Jan.5- Oct. 5 ct 23 Nov 13 FOMC 23
Stock prices
Dow-Jones Industrial 577.60 807.43 821.42 897.61 806.83 814.08 -83.53 7.25NYSE Composite 32.89 51.34 54.74 63.39 56.70 58.59 -4.80 1.89AMEX Composite 58.26 125.20 154.98 235.15 195.76 213.33 -21.82 17.57NASDAQ (OTC) 54.87 103.13 119.92 152.29 132.61 137.14 -15.15 4.53
1/ Daily averages for statement week except where noted.2/ One-day quotes except as noted.3/ Secondary market.4/ One-day quotes for preceding Thursday.5/ Averages for preceding week.6/ One-day quotes for preceding Friday.7/ Calendar week averages.
-.28
-.95-.86
-1.13
.03-.11-.53
-.72
-.93
-1.14
-.16
.29
-. 96-. 44-. 05
.09
.45
.46

III-3
corporate and municipal security offerings were postponed. Market conditions
improved somewhat in late October and early November, however, when revised
data showed a slowing in the growth of the monetary aggregates.
M-1 grew at a 2-1/2 percent annual rate in October, a sharp fall-off
from September's 11-1/4 percent increase. The slowdown in M-1 also caused
a moderation in M-2 expansion. Growth in the interest-bearing component of
this aggregate was unchanged from September's rate, as rapid outflows from
savings accounts were offset by stronger flows into both small and large time
deposits included in M-2. Deposit flows at nonbank thrift institutions
weakened, contributing to a deceleration of M-3 growth.
Aggregate credit flows appear to have contracted in October, reflect-
ing the sharply higher interest rates, unsettled market conditions, and declin-
ing economic activity. Business borrowing at commercial banks and in the
commercial paper market moderated in October, while longer-term security
offerings were about unchanged from the previous month's pace. Household
borrowing likely decreased also; consumer credit expansion probably eased off
with the drop in auto purchases, and mortgage market borrowing was discouraged
both by sharply higher interest rates and by reduced availability of funds at
many lenders. The cancellation of several short-term financings reduced gross
credit demands of state and local borrowing units, but federal government
borrowing picked up.
Monetary Aggregates and Bank Credit
The cumulative impact of recent increases in interest rates, both
before and after the System's October 6 announcement, and the apparent slack-
ening in overall economic activity probably accounted for the sharp slowdown
in M-1 growth in October and early November. Diversion of demand deposits

III-4
MONETARY AGGREGATES(Seasonally adjusted annual rates of growth) 1/
Oct. '78
1978 1979 to
QIII QIV QI QI QIII Sept. Oct.e Oct. '79e
Major monetary aggregates1. M-1 7.9 4.1 -2.1 7.6 9.7 11.2 2.5 4.82. Currency 9.6 10.6 9.1 8.1 11.1 13.9 5.7 9.93. Demand deposits 7.3 1.7 -6.2 7.5 9.2 10.2 1.3 3.04. M-2 9.8 7.6 1.8 8.6 12.0 12.2 8.6 7.95. M-3 10.3 9.3 4.7 7.9 10.5 10.9 7.5 8.0
Bank time and savings deposits6. Total 11.3 12.3- 8.4 1.2 .0- 15.1 16.6 8.97. Other than large negotiable
CDs at weekly reporting banks 11.0 10.2 4.5 9.3 13.6 12.9 12.8 10.08. Savings deposits 2.9 0.2 -9.6 -3.1 5.5 0.0 -16.9 -3.79. Individuals 2/ 4.1 0.0 -9.4 -2.9 6.3 1.2 -15.7 -3.010. Other 3/ -10.1 0.0 -13.0 -8.1 -2.7 -8.3 -33.6 -12.011. Time deposits 17.9 18.2 15.6 18.5 19.2 21.2 32.0 20.912. Small time 4/ 12.7 15.8 16.5 36.3 26.9 17.9 28.9 27.313. Large time 4/ 26.9 22.4 13.6 -12.1 4.5 27.0 38.5 9.614. Time and savings deposits sub-
ject to rate ceilings (8+12) 6.9 7.0 2.2 15.1 15.9 9.0 6.2 10.1Deposits at nonbank thrift institutions 5/15. Total 11.1 11.6 8.8 6.8 8.4 8.9 6.0 8.316. Savings and loan associations 12.3 13.1 11.3 7.8 9.2 10.0 7.6 9.817. Mutual savings banks 6.8 7.8 4.6 3.1 2.2 4.2 1.7 3.418. Credit unions 13.7 10.1 0.8 8.3 19.3 12.7 4.2 9.5MEMORANDA: Monthly changes in billions of $19. Total U.S. govt. deposits 6/ 1.1 -0.4 -2.0 1.5 0.7 -0.1 -0.1 -0.420. Total large time deposits 7/ 2.9 4.7 1.3 -6.3 2.5 4.6 6.5 1.021. Nondeposit funds 1.6 2.2 5.3 5.0 5.6 2.1 n.a. n.a.22. Other 8/ 0.9 1.6 2.0 1.2 1.5 -3.8 n.a. n.a.23. Net due to related foreign
institutions 0.7 0.6 3.3 3.7 4.0 5.8 n.a. n.a.
e--estimated. n.a.--not available.1/ Quarterly growth rates are computed on a quarterly average basis.2/ Savings deposits held by individuals and nonprofit organizations.3/ Savings deposits of business, government, and others, not seasonally adjusted.4/ Small time deposits are time deposits in denominations less than $100,000. Large time
deposits are time deposits in denominations of $100,000 and above excluding negotiableCDs at weekly reporting banks.
5/ Growth rates computed from monthly levels are based on average of current and precedingend-of-month data.
6/ Includes Treasury demand deposits at commercial banks and Federal Reserve Banks andTreasury note balances.
7/ All large time certificates, negotiable and nonnegotiable, at all CBs.8/ Other nondeposit borrowings of commercial banks from nonbank sources include Federal
funds purchased and security RPs plus other liabilities for borrowed money (includingborrowings from the Federal Reserve), and loans sold, less interbank borrowings.

III-5
into ATS and New York NOW accounts is estimated to have reduced M-1 growth by
only 1/4 percentage point in October, about the same as in September.
M-2 expansion slowed to an 8-1/2 percent annual rate in October,
down from 12-1/4 percent in the previous month. Savings deposits at commer-
cial banks contracted at a record pace, as market interest rates reached
unprecedented levels. The publicity surrounding the rise in rates undoubtedly
enhanced awareness of the opportunity cost of holding liquid assets in savings
accounts. Offsetting the runoff in savings accounts, however, was an acceler-
ation in the small and large time deposit components of M-2. Small time
deposits grew at their fastest pace since June, likely reflecting larger net
inflows to record yielding MMCs.
Deposit inflows at nonbank thrift institutions weakened noticeably
in October and left M-3 growth at a 7-1/2 percent annual rate, the slowest
since May. MMCs and large CDs evidently continued to account for the growth
in deposits at S&Ls in October. MMCs outstanding increased $14 billion (NSA),
and at month end accounted for 24.6 percent of total S&L deposits outstanding.
Information available from a sample of S&Ls suggests that passbook deposits
declined appreciably in October, following the 26 percent (SAAR) runoff of
these accounts in September, and that small time deposits other than MMCs
also fell again last month. A portion of the latter decline is attributable
to early withdrawals from existing accounts, as it became profitable for more
savers to accept premature withdrawal penalties and reinvest at higher pre-
vailing yields.
Accompanying the reduced growth in October of deposits subject to
fixed ceilings at banks and thrifts was a pickup in the flow of funds into
alternative short-term investment outlets. Money market mutual fund shares
increased by $3.9 billion (NSA), the second largest monthly increase on

III-6
record and nearly twice the gain in September. Short-term unit investment
trust assets outstanding rose $1.4 billion in October, $200 million more than
in the previous month. In addition, noncompetitive tenders at 3- and 6-month
Treasury bill auctions were strong in October and in early November.
With the slowing of inflows to demand deposits and interest-bearing
accounts subject to rate ceilings, commercial banks had to increase their
reliance on managed liabilities in October to finance the expansion of bank
credit. Large time deposits rose by $6.5 billion, a sizable pickup from the
strong $4.6 billion gain in September. RP agreements with the nonbank public
expanded a further $1.9 billion. Net Eurodollar borrowings by member banks
from their foreign branches declined by $1.6 billion in October, but net of
weekend transactions it appears that member banks stepped up their reliance
on this source of funds.1 Conversations with representatives of large banks
suggest two explanations for the October strength in managed liabilities in
the face of newly imposed marginal reserve requirements. First, many banks
contend that they were not able to select and implement new liability manage-
ment strategies until the latter part of the month. Second, some banks
stepped up their use of managed liabilities in mid-October to compensate for
a temporary decline in nonreservable Treasury note balances.
Required reserves expanded at an 18-1/4 percent annual rate (SA) in
October, up from 12-1/2 percent in September (see table on page III-7).2
Average excess reserves were somewhat larger in October than in the previous
1/ Increased volatility in the federal funds market since October 6 seemsto have discouraged weekend Eurodollar transactions by large member banks.
These banks had been using the transactions regularly to increase their cash
items deductions and thereby to decrease their reservable deposits.2/ The new marginal reserve requirements resulted in required reserves
of $356 million in the week ending October 31. Growth rates of reservemeasures are not affected since they are adjusted to remove discontinuities
associated with regulatory changes in reserve requirements.

III-7
MEMBER BANK RESERVES
Seasonally
1. Required reserves
2. Total reserves
3. Nonborrowed reserves
4. Monetary base
Q1
adjusted
-2.9
-3.0
-3.4
5.6
QII
annual
-4.8
-5.0
-8.8
4.0
Monthly average
Borrowed reserves 989
Excess reserves 194
levels,
367
179
millions of
199
208
1/ Includes required reserves of Edge Act corporations. Reserve series havebeen adjusted to remove discontinuties associated with regulatory changesin reserve requirement ratios.
2/ Monthly averages are prorated averages of weekly data.£/ Preliminary.
1979QIII
rates of
6.0
6.3
8.2
9.8
Sept.
1!growth-
12.5
11.5
4.2
13.7
18.3
20.5
0.9
10.8
2/dollars-
1,341
190
2,024
270
--------- 'Oct */-

III-8
month, owing in part to a bulge early in the month when banks were highly
uncertain about the implications of the October 6 announcement. The growth
in nonborrowed reserves was minimal in October, contributing to a relatively
wide differential between fed funds and the discount rate over much of the
month, and to a substantial boost in discount window borrowings.1
Growth of bank credit slowed in October, reflecting a reduced expan-
sion of investments, a slower pace of business lending, and a decline in
security loans. Reductions in security holdings by dealers in the face of
declining security prices and the increase in borrowing costs likely contrib-
uted to the weakness in security loans; also, some banks reportedly pared
security loans to meet other borrowers' demands. A sizable portion of the
slowing of growth in business loans was due to a large reduction in holdings
of bankers acceptances. Excluding changes in acceptances, business lending
by banks only decelerated to an 18 percent annual rate in October, slightly
slower than the average pace in the first nine months of 1979.
Bank lending policies apparently tightened in October. Reports
suggest that standards of credit worthiness were applied more stringently and
that some banks became more reluctant to lend to new customers. Below-prime
lending at very large banks apparently dropped markedly following the October
announcement; the elimination of certain reserve-free managed liabilities prob-
ably has discouraged these lending practices. There is also some indication
1/ A spread between rates on reservable and nonreservable fed funds andRPs emerged in mid-October. Although initially much wider, it averagedbetween 25 and 50 basis points over the second half of the month.

III-9
COMMERCIAL BANK CREDIT(Per cent changes at annual rates, based on seasonally adjusted data) 1/
1. Total loans and investments 2/
2. Investments
3. Treasury securities
4. Other securities
5. Total loans 2/
6. Business loans
7. Security loans
8. Real estate loans
9. Consumer loans
1978QIII QIV
13.3 12.7
6.4 -1.8
1.2 -21.1
9.4 9.5
15.9 18.2
12.7 14.2
-16.7 -23.3
20.4 17.7
17.9 15.9
QIP
13.3
7.6
2.1
10.5
15.2
20.5
33.0
14.6
16.3
QIIP
11.9
5.4
3.8
6.2
14.2
16.6
38.1
13.0
12.4
1979QIIIP
15.8
8.5
1.7
12.1
18.2
22.7
8.7
14.7
7.5
Sept.P
21.7
14.2
14.0
14.2
24.2
25.9
26.1
14.5
9.4
Oct.e
8.0
6.4
2.5
8.3
8.5
14.1
-137.9
15.9
n.a.
12monthsendingOct.e
13.5
5.3
-2.8
10.0
16.6
19.5
6.1
15.7
n.a.
MEMORANDA:
10. Business loans net ofbankers acceptances
11. Commercial paper issued bynonfinancial firms 3/
12. Sum of items 6 & 11
13. Finance company loans tobusiness 4/
14. Sum of items 12 and 13
12.6 14.4 20.4 16.6 21.7 24.0 18.0 19.6
23.1 17.5
13.3 14.2
5.5 25.0
11.8 16.3
33.5
21.4
16.6
20.6
65.7
20.2
17.7
19.7
69.7
26.5
9. 4
23.3
48.5
27.9
-15.3
19.9
12.7 51.3
14.0 21.8
n.a.
n.a.
n.a.
n.a.
e-estimated. p-preliminary. n.a.-not available.Average of Wednesdays for domestic chartered banks and average of current and preced-ing ends of months for foreign-related institutions.Loans include outstanding amounts of loans reported as sold outright to a bank's ownforeign branches, unconsolidated nonbank affiliates of the bank, the bank's holdingcompany (if not a bank), and unconsolidated nonbank subsidiaries of the holding com-pany.Average of Wednesdays.Based on average of current and preceding ends of months.
III-10
of loan rate concessions for smaller businesses that are less able to absorb
higher interest charges.
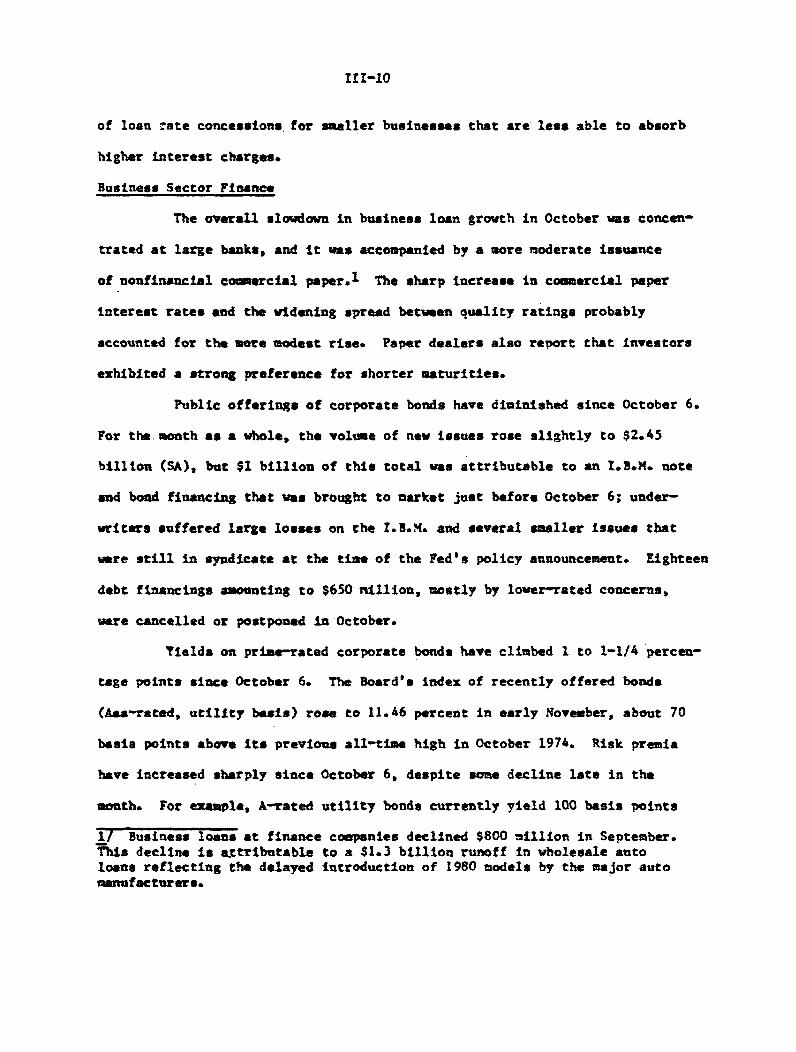
Business Sector Finance
The overall slowdown in business loan growth in October was concen-
trated at large banks, and it was accompanied by a more moderate issuance
of nonfinancial commercial paper.1 The sharp increase in commercial paper
interest rates and the widening spread between quality ratings probably
accounted for the more modest rise. Paper dealers also report that investors
exhibited a strong preference for shorter maturities.
Public offerings of corporate bonds have diminished since October 6.
For the month as a whole, the volume of new issues rose slightly to $2.45
billion (SA), but $1 billion of this total was attributable to an I.B.M. note
and bond financing that was brought to market just before October 6; under-
writers suffered large losses on the I.B.M. and several smaller issues that
were still in syndicate at the time of the Fed's policy announcement. Eighteen
debt financings amounting to $650 million, mostly by lower-rated concerns,
were cancelled or postponed in October.
Yields on prime-rated corporate bonds have climbed 1 to 1-1/4 percen-
tage points since October 6. The Board's index of recently offered bonds
(Aas-rated, utility basis) rose to 11.46 percent in early November, about 70
basis points above its previous all-time high in October 1974. Risk premia
have increased sharply since October 6, despite some decline late in the
month. For example, A-rated utility bonds currently yield 100 basis points
1/ Business loans at finance companies declined $800 million in September.This decline is attributable to a $1.3 billion runoff in wholesale autoloans reflecting the delayed introduction of 1980 models by the major automanufacturers.

III-11
GROSS OFFERINGS OF CORPORATE AND FOREIGN SECURITIES(Monthly totals or monthly averages, in millions of dollars)
1978 1979O Ct./ o. / fNo
Year HI QIII Sept. Oct. Nov.- Dec.--
Seasonally adjusted
Corporate securities--total 3,936 4,335 4,250 4,000 4,075 3,250 3,600
Publicly offered bonds 1,651 2,125 2,325 2,300 2,450 1,450 2,000
Privately placed bonds 1,422 1,555 900 1,000 1,000 1,000 1,000
Stocks 863 655 1,025 700 625 800 600
Not seasonally adjusted
Publicly offered bonds--total 1,651 2,280 2,025 2,000 2,650 1,500 1,700By quality /Aaa and Aa 853 1,225 1,250 1,025 1,550
Less than Aa 2/ 798 1,055 800 975 1,100
By type of borrowerUtility 610 700 575 750 1,265Industrial 3/ 526 635 825 950 1,310
Financial 515 945 550 300 75
Foreign securities--total-V 504 408 491 890 275 300 300
1/ Bonds categorized according to Moody's bond ratings.2/ Includes issues not rated by Moody's.3/ Includes equipment trust certificates.4/ Includes both publicly offered and privately placed issuesp/ Preliminary.f/ Forecast.
.°

III-12
more than Aaa-rated issues; this spread averaged 55 basis points in September
and climbed to a record 174 basis points in mid-October (see chart on page
III-13).
Stock prices declined sharply following the October 6 announcement,
reflecting investor concern that higher interest rates and reduced credit
availability will detract significantly from economic activity and corporate
profits over coming quarters. The fall in stock values prompted several
corporations to postpone or cancel scheduled equity offerings. The number of
margin calls increased substantially, but the volume of such calls was less
than that associated with the market plunge in October 1978, partly because
a rapid build-up in customer equity occurred as stock prices reached their
highs for the year just prior to October 6. Moreover, representatives of
major brokerage firms indicate that there has not been a notable increase in
the proportion of calls met by forced selling. Reportedly, many margin
account customers have voluntarily liquidated some or all of their stockhold-
ings because of the recent sharp increase in the cost of such borrowing. 1
Margin credit outstanding fell by $690 million during October, to $11.3 billion.
Government Debt Markets
As in other markets, the sharp upward movement in interest rates on
U.S. government securities following the October 6 announcement was accompanied
by a substantial increase in day-to-day and intra-day rate volatility. Single-
day fluctuations in Treasury bill rates of 25 or more basis points and changes
in long-term bond yields of 10 to 20 basis points were common, and bid-asked
1/ The interest rate charged by most brokerage firms for margin accountsusually is set at 1 to 2-1/2 percentage points above the "call money" loanrate. As a result, margin account customers are typically paying 16 to18-1/2 percent on their current borrowings.

III-13
SELECTED MEASURES OF RISK PREMIA(Weekly)
Medium-grade Comm. Paper Less High-grade Comm. PaperBasis points
S150
SI I 1 I I I 1 I I I I I I I I I I I I I I I I J 01978. 1979
Basis pointsA-rated Utility Bonds Less Aaa-rated Utility Bonds 200
150
100
50
0
1978
A-rated Indust. Bonds Less Aaa-rated Indust. Bonds
1978
1979Basis points
- 150
1979
Latest data shown: November 9, 1979.
I I I I I I I I I I I I I I I I I I 1 . I

III-14
spreads on Treasury bills widened.1 Since the publication of revised data
for the monetary aggregates in late October and more recent information
suggesting a deceleration in their rates of growth, most Treasury security
interest rates have retraced a portion of the recent sizable increases.
On the whole, primary government securities dealers appear to have
fared satisfactorily since the October 6 announcement, and there are no
reports of dealers experiencing portfolio losses that might threaten their
viability. Dealers that regularly report their holdings to the System
apparently suffered capital losses from net long positions in bills, but
these were offset by gains on net short positions in coupon issues (these
firms currently do not report their futures and forward market positions).
The Treasury raised $1.4 billion (NSA) of net new money in its
three-part quarterly financing package in late October. In addition, the
Treasury raised $1.5 billion with 15-year bonds, added about $700 million to
the outstanding supply of bills through its weekly auctions, and sold $2
billion of 167-day cash management bills in early November.2 Foreign official
holdings of bills have declined about $5.5 billion since early October, in
part reflecting the increase in the foreign exchange value of the dollar.
1/ Exchange-traded financial futures displayed substantial volatility aswell, and on several occasions reached previously established single-daytrading limitations: 50 basis points on bill futures (IMM) and one fullpoint on bond futures (CBOT). As a result, the CBOT doubled its one-daylimit on bond futures prices and both exchanges raised initial and main-tenance margin requirements.2/ The Treasury sold about $1.1 billion of mark-denominated 2-1/2- and 3-1/2-year notes in Germany in early November. The Treasury warehoused the pro-ceeds of these offerings with the System, thereby reducing its need forother borrowing to cover the Federal deficit.

III-15
GOVERNMENT SECURITY OFFERINGS(Monthly totals or monthly averages, in millions of dollars)
1978 1979
Year H1 QIIIe/ Sept.e/ Oct.e/ Nov.f/ Dec.f/
Seasonally adjusted
State and local governmentsecurities, gross offerings
TotalLong-termShort-term
5,8514,042
1,809
5,0873,3671,720
5,4783,5661,912
5,1853,1502,035
4,6704,250
420
5,1003,4001,700
4,700
3,2001,500
U.S. government securities,net offerings
1/U.S. Treasury-Sponsored agencies
State and local governmentsecurities, gross offerings
Total
Long-termShort-term
2,337 3,278 1,688 -979 1,372 8,245 -1,4881,930 2,219 734 130 3,184 2,886 2,661
Not seasonally adjusted
5,8514,0421,809
5,4093,5271,882
5,2463,3621,884
5,2502,7002,550
4,5004,200
300
5,0003,4001,600
3,8002,6001,200
U.S. government securities,net offerings
1/U.S. Treasury1/Sponsored agencies
2,337 1,966 2,168 -1,400
1,930 2,090 1,308 1,0913,520 10,200
3,474 2,500
Marketable issues only.Estimated.Forecasted.
7002,100

III-16
Borrowing by federally sponsored credit agencies increased to $3.2
billion (SA) in October, more than four times the pace of the third quarter.
The housing agencies raised an increased volume of funds with which to support
the mortgage market, and the Farm Credit System responded to enlarged agricul-
tural credit demands associated with sizable grain harvests.
State and local government security narket conditions also were
unsettled following the October 6 announcement. With short- and long-term
yields climbing as much as one percentage point, large losses on syndicate and
dealer positions were widely reported. Secondary market trading was thin, and
$1.8 billion of scheduled issues were cancelled or postponed. Short-term note
offerings fell sharply, as interest rate ceilings forced a number of cancella-
tions. 1 Ceilings were a less significant factor for long-term offerings, and
these totaled $4.25 billion (SA) in October, one of the largest totals thus
far this year.
Mortgage Markets
Mortgage market conditions have tightened substantially since the
System's October 6 policy actions. For example, average interest rates at
sampled S&Ls on new commitments for 80 percent conventional home nortgages
have risen 1-1/2 percentage points to 12.85 percent. At this level, usury
ceilings have become more binding for certain lenders in nearly two dozen
states. Secondary market yields on mortgage instruments also have climbed
1/ Over three-fourths of the cancellations were HUD housing project notes.HUD first raised and then abandoned its self-imposed interest rate ceilingon such project notes, but the agency still rejected all bids at its mostrecent auction on the grounds that the interest rates were excessive.

III-17
INTEREST RATES AND SUPPLY OF MORTGAGE FUNDSAT SELECTED S&Ls
Conventional home mortgagesAverage rate on Basis point 1/ 2/new commitments change from Spread Percent of S&Lsfor 80% loans month or (basis with mortgage funds
Period (percent) week earlier points) in short supply1979--High 12.85 - +172 88
Low 10.38 - +64 54
1979--June 11.04 +35 +154 79July 11.09 +5 +157 75Aug. 11.09 0 +160 77
Sept. 7 11.20 +7 +150 7814 11.30 +10 +143 8621 11.35 +5 +143 8428 11.35 0 +138 82
Oct. 5 11.35 0 +116 8212 11.45 +10 +66 8319 11.75 +30 +75 8426 12.00 +25 +64 84
Nov. 2 12.80 +80 +138 859 12.85 +5 +139 88
1/ Average mortgage rate minus average yield on recently offered Aaa utility bonds.
2/ Percent reporting supply of funds slightly or substantially below normal seasonal
patterns.SECONDARY HOME MORTGAGE MARKET ACTIVITY
FNMA auctions of forward purchase commitments Yields on GNMA-Conventional Government-underwritten guaranteed
mortgage-backed
Amount Yield Amount Yield securities for($ millions) to ($ millions) to immediate
Period Offered Accepted FNMA1/ Offered Accepted FNMA1/ delivery2454 172
36 2813.8010.92
11.99
1,035 44837 19
12.75 1,017
13.80 1,035
13.29 11.7710.42 9.51
361 11.66
448 12.60
321 13.29
Nov. 513
10.6511.0211.2111.7711.58
11.7311.51
1/ Average gross yield before deducting fee of 38 basis points for mortgage servicing.
Data, based on 4-month FNMA purchase commitments, reflect the average accepted bid
yield for home mortgages, assuming a prepayment period of 12 years for 30-year loan
without special adjustment for FNMA commitment fees and related stock requirements.
Mortgage amounts offered by bidders relate to total eligible bids received.2/ Average net yields to investors assuming prepayment in 12 years on pools of 30-year
FHA-VA mortgages carrying the prevailing ceiling rate on such loans.
1979--HighLow
1979-Oct.

III-18
sharply since early October. Yields on pass-through securities have risen,
on balance, about one percentage point.1
A special FHLBB survey of 125 large S&Ls in late October indicated
that a substantial and widespread firming of nonrate terms on home mortgage
commitments also occurred after October 6. Nearly one-fourth of the surveyed
S&Ls stopped making new commitments, and an additional one-half ceased issuing
commitments for certain types of loans or borrowers. About one-fifth of
respondents stopped making firm-rate commitments, and one-fifth increased
downpayment requirements (generally to 25 percent or more). In terms of new
commitment activity, three-fourths of surveyed S&Ls reported that the volume
of commitments made during the 15 days ending October 26 was substantially
smaller than during the same period last year; this is more than double the
proportion reporting a cutback in activity before October 6.
In September, net mortgage acquisitions at S&Ls remained at a
relatively weak $3.5 billion pace but outstanding mortgage commitments
increased by about $1 billion to $32.8 billion (SA). Confronted with weaker
deposit flows in October, S&Ls stepped up their reliance on FHLBs to meet
existing mortgage commitments. Outstanding FHLB advances increased by $1.7
billion (SA) in October, more than double the September rise and one of the
biggest net changes since April 1978.
To help relieve pressure on member institutions and on the residen-
tial mortgage markets, the FHLBB agreed in October on a proposed rule to ease
1/ GNMA dealers apparently have been reluctant to issue commitments to pur-chase or sell loans for delayed delivery. The recent volatility of the GNMAmarket, as well as heightened concern about the willingness and ability ofsome market participants to follow through on their commitments have contrib-uted to these conditions. More dealers have enacted or boosted margin require-ments on forward delivery transactions.

III-19
restrictions on outside borrowings. 1 The FHLBB also indicated that it intends
to maintain a policy of assisting member associations in meeting net deposit
withdrawals and current loan commitments, but district FHLBs are closely
reviewing requests for advances to finance new commitments for housing. In
addition, effective November 1, the minimum liquidity requirement for insured
S&Ls was lowered from 6 to 5-1/2 percent; the industry average liquidity ratio
at the end of September was 9.1 percent (SA), well above the 1974 low of 7.6
percent. FHLBs will probably continue to encourage S&Ls to reduce liquidity
before coning to the advances window.
The recent sharp increase in short-term interest rates has widened
the unfavorable spread for warehousing mortgage loans, thereby contributing
to a lower level of loan origination activity at mortgage companies. With
mortgage bankers acting to hedge against exceptional uncertainties, bidding
in FNMA's forward commitment auctions has been extremely heavy and resulted
in cumulative increases of 163 and 181 basis points for FHA/VA and conventional
loans, respectively. Construction financing also has become much more costly,
and less readily available in numerous areas. In response to the increase
in mortgage yields and tightened mortgage market conditions, the ceiling rate
on FHA/VA home loans was boosted--effective October 26--from 10-1/2 to 11-1/2
percent. Even so, discounts averaged more than 10 points in FNMA's October
29 commitment auction.
1/ Insured S&Ls currently are allowed to borrow an amount equal to as much as10 percent of deposits from outside sources; these include security RPs, bankloans, and commercial paper. The limitation is 15 percent when mortgage-backedbonds are included. The proposed rule would increase the maximum outsideborrowing to 20 percent of assets.

III1-20
Consumer Credit
A surge in automobile lending and a large increase in revolving
credit balances caused the growth of consumer installment credit to accelerate
in September. For the third quarter as a whole, however, growth slowed to a
13 percent annual rate versus 15 percent in the first six months of the year.
Adjusted for inflation, consumer credit expanded only slightly in the first
half of 1979 and declined in the third quarter. This pattern is similar to
the early months of the last two economic contractions (see chart on page
III-22). Delinquency rates at commercial banks rose to 2.50 percent in the
third quarter, the highest quarterly level in four years.
In October, consumer credit flows reportedly were affected by a
general tightening in nonrate terms, as some lenders adopted more stringent
loan approval criteria, confined loans to established customers, raised
downpayments, and shortened maturities. Finance rates also were raised in
some areas, but increases are precluded by statutory ceilings in many states.1
Credit union deposit growth was 12-3/4 percent in September, about
in line with the average pace this year. Loan-to-share ratios at these
intermediaries continued to increase, and credit union liquidity declined
further. The Central Liquidity Fund (CLF), managed by the NCUA and owned by
its member credit unions, began operating on October 1. The maximum borrow-
ing capacity of the CLF is 12 times its subscribed capital stock and surplus,
and it will borrow initially through the Federal Financing Bank. After about
one month of operation, the CLF's legal borrowing limit was only about $150
million. It will likely be several more months before the CLF acquires
enough capital to meet any substantial liquidity demands from credit unions.
1/ The maximum new-car loan rate is currently below the bank prime lending
rate in 31 states.

III-21
CONSUMER INSTALLMENT
19791977 1978 QI QII QIII Aug. Sept.
Change in outstandingsBillions of dollarsPercentBank share (percent)
ExtensionsBillions of dollarsBank share (percent)
LiquidationsBillions of dollarsRatio to disposable income
Delinquency rate at banks30 days or more (percent)
Automobile Credit
Change in outstandingsBillions of dollarsPercent
35.318.252.9
44.819.453.1
254.1 298.346.4 47.8
218.8 253.516.8 17.5
2.37 2.41
41.015.043.1
39.914.147.8
37.312.832.7
29.410.035.4
53.418.034.2
314.1 324.2 332.3 331.0 343.647.1 47.9 45.9 46.0 46.0
273.1 284.3 294.9 301.6 290.317.4 17.7 18.0 18.3 17.6
2.25 2.42 2.50 2.47 2.59
15.2 19.6 18.9 13.2 12.1 7.1 21.922.5 23.6 18.5 12.3 11.0 6.4 19.6
ExtensionsBillions of dollars 75.6 89.0 92.4 93.7 94.2 92.0 101.2
1/ Quarterly and monthly dollar figures and related percentadjusted annual rates.
changes are seasonally
1 /CREDIT
Total

CONSUMER INSTALLMENT CREDIT GROWTH RATES(Seasonally adjusted annual rates)
Percent
1 I I I I I
Current dollar series-
/ r IIIII
S gIII
I
I I/ S
'I
I'
/ '
1971 1972 19731971 1972 1973 1974
S! -S--. Constant dollar series
1975 1976 1977 1978 1979
* Series break due to inelusion of gasolie companies.1/ Deflated by consumer price index.
-S
1969 1970
c

INTERNATIONAL DEVELOPMENTS
Foreign exchange markets. Exchange market reactions to the October 6
measures were generally favorable for the dollar. From its low reached at the
beginning of October through November 13 the value of the dollar on a weighted-
average basis rose about 4 percent, first in anticipation of, and then in
reaction to, the Federal Reserve's actions. The dollar rose against all major
foreign currencies, with the yen under considerable downward pressure, and the
pound declining in late October.
In early November exchange markets have focussed on developments in Iran; there
was little net impact on the dollar, but the vulnerability of Japan to potential
oil price developments led to a further weakening of the yen, while the virtual
self-sufficiency of the U.K. in oil brought some recovery of the pound. The
decision on November 14 to freeze all Iranian assets in U.S. banks generated
further uncertainties in exchange markets with some downward pressure on the
dollar.
The depreciation of the yen against the dollar since October 6 (and
since the beginning of October) has been more than 8-1/2 percent and over 25
percent since the beginning of the year. During the past five weeks, as uncer-
tainties associated with the oil situation and the Japanese elections weakened
the yen, the Bank of Japan raised its discount rate one percentage point
The U.K. pound has declined 4 percent on balance since early October,
with the recovery in early November offsetting much of the earlier losses.
The primary source of downward pressure on the pound was the lifting on

IV -2
October 24 of all exchange controls on U.K. residents' foreign exchange trans-
actions
Since the beginning of October, several central banks have raised
their discount rates and tightened money market conditions, citing concern
over inflationary developments at home and worldwide. With the recent relative
weakness of the Swiss franc against the mark, the Swiss National Bank not only
raised its discount rates, but also reduced its negative interest charges on
deposits held by foreigners from 10 percent to 2-1/2 percent per quarter.
France also took measures to restrain cerdit expansion. The result of the
tightening of monetary policy abroad, was to reduce slightly the differential
between U.S. 3-month interest rates and an average of foreign rates, although
this differential had widened considerably since the summer and remains over
3-1/2 percentage points.
Discount Rates
Current Date Previous DateRate Effective Rate Effective
Belgium 10.0 Oct. 4, 1979 9.0 June 13, 1979United States 12.0 Oct. 8, 1979 11.0 Sept. 18, 1979Italy 12.0 Oct. 8, 1979 10.5 Sept. 4, 1979Canada 14.0 Oct. 25, 1979 13.0 Oct. 9, 1979Germany 6.0 Nov. 1, 1979 5.0 July 13, 1979Netherlands 8.5 Nov. 1, 1979 8.0 July 13, 1979Japan 6.25 Nov. 2, 1979 5.25 July 24, 1979Switzerland 2.0 Nov. 5, 1979 1.5 July 14, 1977

STRICTLY CONFIDENTIAL (FR)
Class II- FOMC
November 13, 1979
WEIGHTED AVERAGE EXCHANGE VALUE OF THE U.S. DOLLARr-,--
Daily Series
11 1111 11 11 11 1 1 1 1 1 1 11 I I I I I 1 1 1 1 1 1 1 i l 1111 11 11 1 11 1 11 1 1 1i l I IIIIIIIIII 1
March 1973 =100S90
AS m7oo
189
t88
86
IV - 3
Chart 1
August September 1979 October November-
I 190

IV - 4
Financial market uncertainties prior to the October measures were also
reflected in the gold price, which rose spectacularly in late September and
reached nearly $450 per ounce around the beginning of October. Thereafter, the
speculative burst receded. The price of gold fell below $400 an ounce and
tended to remain there, although it fluctuated from day to day over a much
greater range than usual. In part the instability in the gold price was related
to market participants; uncertainties about future inflation and interest rates,
but potential changes in U.S. gold-sales policies also added uncertainty to the
marketplace. On October 17, there was a sharp break in the price after the
Treasury announced that it was replacing its regular monthly auction of a
fixed quantity of gold with auctions at varied times with varied quantities
offered. Another sharp decline occurred after the Treasury announced an
auction of 1.25 million ounces of gold for November 1.
Since the October 6 FOMC meeting, the System has acquired more than
$550 million equivalent of marks and Swiss francs, primarily through corre-
spondents. The System's outstanding swap commitments in marks have been reduced
to approxaimately $3.3 billion and the Swiss franc swap drawing was completely
repaid. The Treasury acquired a small quantity of marks early in October.
On November 5, the U.S. Treasury announced a further issue of DM-denominated
securities at 2-1/2 and 3-1/2 year maturities yielding 8.55 and 8.50 percent,
respectively. Payment for about DM 2 billion ($1.1 billion) was received on
November 12 and the proceeds were warehoused with the System. A further issue
of about DM 2 billion will be made in January.

IV - 5
U.S. and Eurodollar market borrowing costs. Since the second
quarter of this year the cost of short-term credit to nonbank borrowers
has risen more in the Eurodollar market than in the United States, par-
ticularly when compared with the cost of bank loans in the United States
for borrowers who qualify for the prime rate or rates below prime. The
changes in comparative borrowing costs reportedly are inducing some
borrowers to try to shift from Eurodollar pricing terms to terms based
on the U.S. prime rate. Since the beginning of November differentials
between Eurodollar and U.S. interest rates have moved back slightly
towards pre-midyear levels.
In the first and second quarters of 1979, the cost to prime
nonbank borrowers of 90-day loans from banks in the Eurodollar market was
above the cost of financing through commercial paper or bankers accep-
tances in U.S. financial markets, but was below the cost of bank credit
in the United States. The attached table shows costs to prime borrowers
of 90-day funds in terms of ranges, reflecting the lack of uniformity in
spreads on Eurodollar loans and commercial paper issues, in acceptance
commissions, and in compensating balance requirements on U.S. bank loans;
the ranges shown are believed to encompass costs faced by most borrowers
in each market.
As measured by the midpoints of the ranges, the cost of short-
term Eurodollar bank loans in the first half of this year exceeded the
cost of issuing commercial paper by about 70-75 basis points, and was
also generally higher than the cost of acceptance financing although by
a smaller differential. In contrast, Eurodollar credit was considerably

IV - 6
Prime Borrowers' Short-term Borrowing Costs in 1979(average of daily rates; percent per annum)
90-day borrowing
Eurodollar bank loan: atLIBOR, with spread upto 1/2%
U.S.: commercial paper, withdealer spread up to 1/87.
U.S.: bankers' acceptances,with commission up to 1%
U.S.: bank loan, at primerate with 5% compensatingbalances
Excess of midpoint of Euro-dollar loan range over mid-point of range for:
Commercial paperBankers acceptancesBank loan
Average cost range in periodWeek ending
QI QII Sept. Nov. 2 Nov. 9
10.99 to 10.75 to 12.74 to 15.76 to 15.74 to11.49 11.25 13.24 16.26 16.24
10.43 to 10.24 to 12.14 to 14.90 to 14.97 to10.56 10.37 12.27 15.03 15.10
10.48 to 10.46 to 12.22 to 14.83 to 14.93 to11.48 11.46 13.22 15.83 15.93
11.75 to 11.72 to 12.90 to 15.10 to 15.30 to12.37 12.34 13.58 15.89 16.11
.75
.26-.82
.70
.04-1.03
.79
.27-.34
1.05.68.50
.95
.56.28
Note: Commercial paper and bankers acceptance rates, normally quoted on a bankdiscount basis, have been converted to investment yield equivalents in computingthe borrowing costs shown above.

IV - 7
less costly than borrowing from a bank in the United States, by a margin
of about 80-105 basis points. The cost range shown here for the U.S.
bank loan is not representative for those borrowers who were able to
borrow at rates below the prime rate and who also were not required to
hold compensating balances. However, even the upper bound of the Euro-
dollar loan cost range was below the prime rate itself by 25 to 50 basis
points in the first half of this year. That differential suggests that
Eurodollar credit was the cheaper source of finance even for the majority
of those borrowers who could borrow from a U.S. bank at less than the
prime rate.
Since the second quarter, the prinicpal change in borrowing
cost differentials has been the greater rise in the cost of Eurodollar
credit relative to the cost of credit in U.S. markets in general and at
U.S. banks in particular. This change was most pronounced in the weeks
following the Federal Reserve measures of October 6. In the Eurodollar
market the London interbank offer rate (LIBOR), the base rate on which
loans are priced, in the week ending November 2 averaged 5 percentage
points higher than the second quarter average. This increase was about
1/2 percentage point more than the increase in the U.S. commercial paper
rate, and 5/8 percentage point more than the rise in the coat
range for acceptance financing, over the same period. Market reports
state that the greater rise in 90-day Eurodollar rates was caused by the
intensification of expectations in the Eurodollar market that Eurodollar
interest rates would move higher over the forthcoming several months.
This change in expectations led many banks to try to lengthen the average

IV - 8
maturity of their deposits by increasing the percentage of the total
consisting of deposits of 90 days and longer maturities while reducing
the portion consisting of very short maturities, thereby intensifying the
upward pressures on the rates for the longer maturities while mitigating
the upward pressures on the shorter rates.
Because of these recent changes and because the U.S. prime rate
has lagged behind the increases in open-market rates in the United States,
the relationship between the cost of Eurodollar credit and the cost of
bank credit in the United States has changed markedly since mid-summer.
The relatively lower cost of Eurodollar credit became less evident in the
third quarter and disappeared in October; by the week of November 2 the
midpoint of the cost range for Eurodollar loans averaged 50 basis points
higher than the midpoint of the cost range for U.S. bank loans, a rever-
sal of the relationship that was customary for several years prior to a
few weeks ago.
Since about the first of November there has been some tendency
for the relationships between Eurodollar interest rates and U.S. interest
rates to revert back to the pattern seen prior to last July. Eurodollar
rates have leveled out while U.S. rates have edged up, so that the rela-
tively higher cost of Eurodollar credit in the week ending November 9 was
reduced about 10-20 basis points from the previous week's average. How-
ever, it would appear that for most prime borrowers Eurodollar credit is
still significantly more costly than bank credit in the United States.
With the change in rate relationships, some large U.S. banks report that
in recent weeks there has been a shift to prime-rate financing from

IV - 9
financing that those banks had been extending themselves under various
arrangements, or which had been extended by U.S. agencies and branches of
foreign banks, at rates linked to Eurodollar rates.

IV - 10
The U.S. merchandise trade deficit was $28 billion at an
annual rate in the third quarter (international accounts basis), down
from $31 billion in the second quarter. This improvement occurred
despite a large increase in the value of petroleum imports.
Agricultural exports increased sharply in the third quarter.
They are expected to continue at about $38 billion (annual rate) through
June 1980. Non-agricultural exports also grew substantially (by 8 per
cent). Large gains were recorded for exports of industrial materials
(particularly chemicals), civilian aircraft, and machinery.
The increase in imports in the third quarter was almost
entirely due to higher petroleum prices. The value of non-oil imports
was close to the second quarter level. Increases in imports of industrial
materials and consumer goods were offset by declines in foods and other
commodities. The value of foreign car imports was about the same as in
the second quarter.
U.S. Merchandise Trade, International Accounts Basis(billions of dollars, seasonally adjusted anhual rates)
EXPORTSAgric.Nonagric.
IMPORTSPetroleumNonpetroleum
BALANCE
NOTE: Detailsr/ Revised*/ The monthly International Accounts figures are only rough estimates and
are subject to considerable revision.
1978 1 9 7 8 1 9 7 9__
Year 12 4Q 12 Aug. r* Set.*
141.9 146.0 1573 165.4 1712 190.3 1949 187.929.9 31.7 31.3 30.6 30.9 38.4 37.4 39.1
112.0 114.2 126.0 134.8 140.2 151.9 157.5 148.8
176.1 1780 182.7 189.9 202.0 218.2 225.6 223.742.3 43.5 43.2 46.6 51.6 66.5 66.6 71.8133.8 134.5 139.5 143.3 150.4 151.7 159.0 151.9
-34.2 -32.0 -255 -24.5 -3.9 -27.8 -30. -35.8
may not add to totals because of rounding.
International Accounts figures are only rough estimates andto considerable revision.
- - --- ~ ~----~-~~~-~~~--

11/2/79IV - 11
U.S. Merchandise TradeInternational Accounts Basis
Monthly Data - -
Quarterly Data -
'.
ot
Billions of dollars, seasonally adjusted,
IS
IMPORTS /;
19761977 1979

IV - 12
The volume of imported oil was 8.6 million barrels per day
in the third quarter, compared with 8.7 and 9.3 million barrels per
day in the second and first quarters respectively. Oil import prices
rose nearly 30 per cent to average $20.97 per barrel in the third
quarter. Both higher contract prices and larger spot market purchases
contributed to the increase in average price.
The cost of imported oil is likely to continue to go up in
the fourth quarter. During the past three weeks several countries,
accounting for about two-thirds of U.S. oil imports, have announced
contract price increases of between 6 and 13 per cent. In addition, a
larger percentage of U.S. imports is likely to be purchased on the higher
priced spot market because of the cutoff in imports from Iran and because
other producing countries are channeling a larger percentage of their
output from the contract to the spot market. The volume of U.S. oil
imports in the fourth quarter may also reflect any stock build-up due
to anticipated OPEC price increases or fears of cutbacks in Iranian
production.
Turning now to capital movements in the third quarter, sub-
stantial foreign and U.S. intervention to support the dollar was
reflected in changes in foreign and U.S. reserve assets. The holdings
of the G-10 countries and Switzerland in the United States grew by
almost $5 billion net in the third quarter in contrast to a decline
of $18.5 billion net in the first half of 1979, U.S. reserve assets

U.S. International Transactions(in millions of dollars; receipts, or increase in liabilities, +)
1. Trade balance 1/2. Merchandise exports3. Merchandise imports
4. Change in net foreign positions of bankingoffices in U.S. (excl. liab.to foreign official inst.)
Through interbank transactions with5. a) Own offices in foreign countries6. b) Unaffiliated banking offices in foreign countries
Through nonbank transactions7. a) Claims on nonbanks in foreign countries (increase,-)8. b) Liabilities to private nonbanks in foreign
countries (inc. custody liab.)
9. Private securities transactions,net (excl. U.S. Treas. Oblig.)10. Foreign net purchases of U.S. corp. bonds11. Foreign net purchases of U.S. corp. stocks12. U.S. net purchases (-) of foreign securities
13. Foreign net purchases of US. Treasury obligations 2/
14. Change in foreign official reserve assets in U.S. (increase +)
By Area15. G-10 countries and Switzerland16. OPEC17. All other countries
By Type18. U.S. Treasury securities19. Other 3/
20. Change in U.S. reserve assets (increase -)
21. All other transactions and statistical discrepancy
1978 1978 1979 979Year Year Q4 Ql Q2 3 Jly Au. Sept.
.-30873 -34,187 -6.369 -6.115 -7.716 -6.962 -1.418 -2.557 -2,987120,816 141,884 39,315 41,
3 4 8 42,792 '47,580 15,685 16,239 15,656
-151,689 176,071 -45,684 -47,463 -50,508 -54,542 -17,103 -18,796 -18,643
-3.909 -14,924 -13.697 14,558 4,921 700 -1,353 9.531 -7.478
-2,718 4,940 -3,221 15,291 6,790 7,920 -1,629 16,647 -7,098-2,204 -4,520 -6,423 743 -1,190 -2,243 2,288 -4,956 425
-424 -16,431 -4,829 -1,018 -2,005 -5,123 -1,871 -2,171 -1,0811,436 1,089 776 -458 1,327 147 -140 11 276
-3,068 -688 -116 -537 -77 -1.959 -465 -563 -9311,112 1,117 504 * 278 6 -52 -47 1051,326 1,686 297 424 274 142 -2 127 17
-5,506 -3,491 -919 -961 -629 -2,107 -411 -643 -1,053
534 .2.251 1.546 2.564 -239 1,577 1,386 227 -36
35,448 31,471 16,853
-8.257 -10.293 5.354 3,815 634 905
29,414 29,955 15,574 -7,101 -11,613 4,818 3,562 239 1,0175,743 -1,074 1,073 -1,645 248 1,453 888 1,383 -818
291 2,590 206 489 1,072 -917 -635 -988 706
30,266 23,869 13,309 -7,965 -12,799 4,980 3,253 987 7405,182 7,602 3,544 -292 2,506 374 562 -353 165
-237 662 200 -3,008 4/ 446 2.712 1.223 0 1,489
2,105 15,416 1,583 795 12,958 -1.421 -3,186 -7,273 9.038
MEMO:Current Account (bil. $. seasonally adj., annual rates) T14.1 -13.9 -1.3 1.7 -3.9 n.a. n.a. n.a. n.a,
International accounts basis, seasonally adjusted.Includes U.S. Treasury notes publicly issued to private foreign residents.Includes deposits in banks, commercial paper, bankers' acceptances, and borrowing underrepurchases agreements.Includes $1,103 million of newly allocated. SDR's.Less than $500,00.
RESTRICTED

IV - 14
declined $2.7 billion in the third quarter.
In October, exchange rate pressures reversed again,
; holdings of the
G-10 countries and Switzerland at the FRBNY fell by $2.5 billion.
OPEC holdings in the United States increased approximately
$1.5 billion in the third quarter, compared with a very small increase
in the second quarter, and a decrease in the first quarter.
Net private capital flows in the third quarter also reflected
the reappearance of downward pressure on the value of the dollar. In
contrast to the large net private inflows recorded earlier in 1979, the
sumr of net private capital flows reported by banks and securities
dealers was very small in the third quarter. Although banks in the
United States continued to raise additional funds from offshore banks,

IV - 15
this was offset by increased lending to foreign nonbanks, particularly
by U.S. agencies and branches of foreign banks.
In the three weeks following the Board's October 6 actions,
the net Eurodollar borrowings of member banks from their branches
averaged $2.4 billion less than in the two week base period. This
decline is more than accounted for by a reduction in weekend borrowing
of clearinghouse funds from own branches. As a result of this reduction
in weekend Eurodollar activity, reserve liabilities against demand
deposits increased by more than $.6 billion.
Partial data indicate that the recent rapid growth of U.S.
nonbank dollar-denominated deposits in foreign banking offices may have
slowed in September. Such deposits in the foreign branches of member
banks dropped by $2 billion in September, although the Eurodollar CD
holdings of open-ended money market mutual funds and short-term unit
investment trusts grew by $1.7 billion in September and again in October.
U.S. (nonbank) residents' Eurodollar assets held in the two forms above
increased from about $17 billion to roughly $30 billion in the first
three quarters of 1979.

IV -16
Foreign Economic Developments. Economic growth abroad, supported
primarily by private domestic demand, was generally strong in the second
quarter. Real GNP in Japan, currently the most vigorous of the major
economies, continued to expand steadily. Germany's GNP rebounded sharply
after a temporary lull in the first quarter. Real output recovered in both
the United Kingdom and France after having declined in the preceding quarter.
However, in Canada a deterioration in the balance of goods and services,
and sluggish personal consumption, led to a fall in real GNP in the second
quarter. GNP also declined in Italy, primarily because of strikes. Data
on industrial production during the third quarter suggest some recent
moderation in the average rate of GNP growth in these countries.
Inflation continues at a high rate in nearly all major foreign
countries. A partial exception is Germany, where both consumer and whole-
sale prices rose at markedly slower rates in the third quarter than they
had earlier in the year. Retail prices rose at a much slower rate in
August and September in the United Kingdom, after having accelerated sharply
in July as a result of an increase in the rate of value added taxation (VAT).
In Japan, the most recent data indicate a continuation of large increases in
wholesale and consumer prices, due in part to the depreciation of the yen
and higher oil prices. Inflationary pressures show no signs of easing in
Canada and France, and in Italy inflation rose in the latest two months
through September.
In the face of continuing high inflation rates, and following the
increase in the U.S. discount rate in early October, discount rates have
been increased in Belgium, Canada, Germany, Italy, the Netherlands, Japan
and Switzerland. For further information of these actions, see page IV-2
above.

IV - 17
The current-account deficits of Germany and Japan widened at a
rapid rate in the third quarter, mainly because of higher oil prices. The
large reduction in the U.K. current-account deficit in the third quarter
reflected primarily a decline in the value of imports from the abnormally
high level in the second quarter. Recent trade deficits in France and
Italy suggest that their current-account surpluses will be reduced from
last year. The small third-quarter Canadian trade surplus indicates that
the current-account deficit will probably not be reduced below the second-
quarter level.
Individual Country Notes. In Japan, the strength in domestic
demand in the first two quarters appears to be continuing. While industrial
production declined in September, most leading indicators of private invest-
ment activity suggest little diminution so far of the resurgence of invest-
ment seen earlier in the year. Despite a progressive tightening of monetary
conditions during the year, corporate credit appears to have remained gen-
erally available.
In the past year the role of sustaining real GNP growth in Japan
has shifted away from government expenditure and net exports and toward
private domestic demand. In the fourth quarter of 1978 and the first
quarter of this year, both private consumption and fixed investment strength-
ened significantly. Although second-quarter growth rates for these two
components declined somewhat, both were still stronger than other sectors of
the economy. Government expenditure, on the other hand, has advanced more
slowly than expected. In the external sector, the strong upward trend in
real imports has continued, with real exports showing some recent signs of
strength after sharp declines during 1978 and early 1979.

Real GNP and Incustrial Production in Major Industrial Countries(percentage change from previous period, seasonally adjusted)
1978 1979 19791976 1977 1978 Q3 Q4 Q1 Q2 Q3 May Jun Jul Aug Sept
Canada: GNP 5.4 2.4 3.4 1.1 0.7 1.6 -0.7 n.a. * * * * *IP 5.1 4.0 5.3 1.8 2.6 1.4 -1.2 n.a. 0.1 -1.1 2.4 -0.2 n.a.
France: GDP 4.5 3.1 3.7 0.0 1.7 -0.2 0.6 n.a. * * * * *IP 9.5 2.0 1.9 -0.3 1.8 0.0 0.3 n.a. 1.5 -0.8 3.1 0.0 n.a.
Germany: GNP 5.5 2.6 3.5 1.0 0.8 0.5 2.0 n.a. * * * * *IP 7.9 2.7 2.0 3.2 0.8 0.3 2.5 1.3 1.6 0.0 3.2 -3.9 0.8
Italy: GDP 5.9 2.0 2.6 0.6 2.9 0.9 -0.6 n.a. * * * * *IP 12.4 1.1 1.9 1.0 6.1 1.7 -3.3 1.0 -3.1 -4.2 3.1 0.0 5.9
Japan: GNP 6.4 5.4 5.b 0.8 1.7 1.7 1.5 n.a. * * * * *IP 11.1 4.2 6.2 1.3 2.2 1.8 2.4 2.3 2.1 0.2 1.1 0.9 -0.7
United Kingdom: GDP 2.9 2.2 2.6 1.1 -0.1 -1.5 2.4 n.a. * * * * *IP 1.9 3.8 3.7 0.8 -1.4 -0.4 5.3 -2.4 .9 2.0 -1.0 -4.?. -1.4
United States: GNP 5.9 5.3 4.4 0.9 1.4 0.3 -0.6 0.6 * * * * *
IP 10.7 5.9 5.8 1.9 1.9 1.0 -0.1 0.1 1.1 0.3 -0.1 -0.7 0.5
* GNP data are not published on monthly basis.

Consumer and Wholesale Prices in Major Industrial Countries(percentage change, from previous period or as indicated)
Latest 3 Monthsfrom:
Previous1978 1979 3 Months Year Latest
1976 1977 1978 Q2 Q3 Q4 Q1 Q2 Q3 (at Ann. Rate) Ago Month
Canada: CPI 7.5 8.0 8.9 2.4 2.5 1.6 2.3 2.6 2.0 8.1 8.7 SeptWPI 5.1 7.9 9.2 2.8 2.1 3.3 4.5 3.1 2.7 11.2 14.3 Sept
France: CPI 9.6 9.5 9.2 2.9 2.7 2.1 2.2 2.8 3.2 13.6 10.7 SeptWPI 7.4 5.6 4.3 1.9 1.9 2.9 4.4 3.8 2.8 11.8 14.6 Sept
Germany: CPI 4.6 3.9 2.6 0.9 0.0 0.1 2.1 1.6 1.2 3.4 5.2 OctWPI 5.8 1.8 -0.3 0.3 -0.6 0.1 3.4 3.3 1.7 7.1 8.8 Sept
Italy: CPI 16.8 18.4 12.1 3.0 2.4 3.0 3.9 3.8 3.3 13.9 14.6 SeptWPI 22.9 17.4 8.4 2.3 1.8 2.2 4.4 4.6 4.3 18.2 16.4 Sept
Japan: CPI 9.7 8.3 4.3 2.0 0.8 0.2 -0.2 2.2 0.9 3.4 3.1 OctWPI 5.0 1.9 -2.5 -0.3 -1.7 -0.6 1.9 4.1 4.9 20.0 12.8 Oct
United Kingdom: CPI 16.6 15.8 8.3 2.7 1.7 1.7 3.1 3.7 6.7 29.6 16.C SeptWPI 17.3 19.8 9.1 1.8 1.9 1.7 2.7 4.0 5.0 17.4 14.4 Oct
United States: CPI 5.7 6.5 7.6 2.6 2.4 2.0 2.5 3.4 3.3 13.9 11.7 Sept
WPI 4.6 6.1 7.8 3.0 1.5 2.3 3.6 3.6 3.0 13.7 13.7 Oct
_ __ __ ___ _ i ___

Trade and Current-Account Balances of Major Industrial Countries a/
(billions of U.S. dollars; seasonally adjusted)
1978 1979 19791977 1978 Q2 Q3 Q4 Q1 Q2 Q3 Jul Aug Sept
Canada: Trade 2.7 3.1 0.6 0.6 0.7 0.5 0.4 0.5 0.0 -0.1 0.6Current Account -4.1 -4.6 -1.1 -1.2 -1.5 -1.4 -1.5 n.a. * * *
France: Trade- -2.4 0.6 0.2 0.2 0.1 0.3 -0.4 -1.4 -0.2 -0.7 -0.4Current Account b / -3.3 3.8 1.4 1.2 1.3 0.6 0.7 n.a. * * *
Germany: Trade 16.5 20.f 4.9 5.4 5.6 4.3 3.8 n.a. 0.7 1.0 n.a.Current Account c / 4.3 8.9 1.8 0.2 4.8 1.4 -1.1 -4.1 -1.1 -1.7 -1.3
Italy: Trade -2.8 -0.2 0.3 -0.8 0.5 -0.4 -0.7 -1.2 -1.0 0.2 -0.3Current Accountc / 2.5 6.4 1.7 2.5 1.7 1.1 n.a. n.a. * * *
Japan: Trade 17.4 24.7 6.8 6.7 3.9 2.7 1.9 -0.9 -0.2 -0.2 -0.5Current Account 10.9 16.5 4.8 4.5 1.7 0.3 -0.7 -3.8 -1.3 -1.1 -1.4
United Kingdom: Trade / -3.0 -2.2 -0.3 -0.7 -0.1 -3.2 -2.3 -0.4 0.0 -0.9 -0.2
Current Account- 0.7 2.0 0.7 0.6 1.2 -2.3 -2.3 -0.7 0.0 -0.2 -0.2
United States: Trade -30.9 -34.2 -7.9 -8.0 -6.4 -6.1 -7.7 -7.0. -1.4 -2.6 -3.0
Current Account -14.1 -13.9 -3.4 -3.2 -0.3 0.4 -1.0 n.a. *
a/ The current account includes goods, services, and private and official transfers.
b/ French annual data is not seasonally adjusted.c/ Not seasonally adjusted.d/ Monthly data do not add to quarterly totals because of rounding.* Comparable monthly current account data are not published.

IV - 21
Another large increase in wholesale prices occurred in October
(a 1.1 percent gain over the September level), even though the pass-through
of early summer oil price increases had been largely completed. The strong
upward trend in consumer prices has also continued, but at a somewhat more
moderate rate than in previous months, partly reflecting seasonal factors.
The rapid expansion in Germany in the second quarter was gener-
ated by a rebound in the construction sector, which expanded by 17.5 percent
(quarterly rate) after a substantial decline in the first quarter arising
from a severe winter. Partly in response to this rapid expansion, construc-
tion costs have risen 10 percent above their level a year ago, whereas the
CPI has increased about 5 percent.
The increase in Germany's growth rate in the first half of this
year resulted from expanding domestic demand. Private consumption and invest-
ment in equipment have shown sustained strength in the first two quarters,
increasing at 1.5 and 2.5 percent quarterly rates respectively. Government
expenditure increased at a 1.5 percent average quarterly rate, while net
foreign demand for goods and services has declined.
Preliminary indicators suggest a continuation of strength in de-
mand into the third quarter. Industrial production in the three months
through September was 1.3 percent above the preceding three-month period.
The rate of unemployment in September fell slightly to 3.6 percent (s.a.)
and remained at this low level in October. Moreover, German officials at a
recent OECD meeting estimated that GNP grew 1-1/4 percent in the third quarter.
In the latest three months through October, the CPI was 5.3 percent
above its level last year. In a month-to-month comparison, however, the CPI
has been almost flat since July.

IV - 22
When the Bundesbank raised both its discount and Lombard rates
by 1 percentage point on November 1, it also increased rediscount quotas
by DM 4 billion.
The pattern of economic activity in Italy this year has been
distorted by widespread strike activity, mostly in the second quarter, when
GDP fell by 0.6 percent after rising nearly 1 percent in the first quarter.
On the basis of estimates, it appears that personal consumption has been
the strongest component of demand so far this year, although business in-
vestment has also shown signs of strength. The trade balance has made a
negative contribution to GDP growth in the first three quarters of the year.
Activity in July started to rebound from the effects of the strikes, and
industrial production rose 9 percent between June and September.
After several months in which inflation had moderated, consumer
prices in Italy rose in September by 2.5 percent (n.s.a.), the largest
monthly increase this year, and there are early indications that it will
also rise by about 2 percent in October. Higher administered prices of
petroleum products and electricity are a major reason for the acceleration
of inflation, and the government's recent decision to raise taxes on gasoline
is adding further upward impetus to the price level.
On October 6, the Bank of Italy increased its discount rate from
10.5 percent to 12 percent. Later in the month the ceilings on bank credit
were extended for the period October 1, 1979, to July 31, 1980. Both
measures are designed to counter the rise in the inflation rate and were
taken in the face of rising interest rates abroad, which had discouraged
foreign borrowing by Italian banks.

IV - 23
In the United Kingdom much of the increase in real GDP in the
second quarter reflected a recovery of the output lost through adverse
weather conditions and industrial disputes in the first quarter. In fact,
there has been little change in the level of real output between the last
half of 1978 and the first half of 1979. Recent business surveys, a fall
in industrial production of 2.4 percent in the third quarter, and a re-
duction in third-quarter real consumption expenditures of 3.5 percent in-
dicate that there has been a significant decline in real output in the
third quarter.
While real GDP was essentially unchanged between the first half
of this year and the last half of 1978, real final domestic demand rose by
roughly 1-1/2 percent over the same period. This increase reflected a 3 per-
cent rise in consumer spending, a nearly 2 percent fall in gross fixed
capital formation, and an unchanged level of government current expenditures.
With total output unchanged, the expansion in domestic demand was accommo-
dated by an increase in real imports of goods and services of 13 percent
from the last half of 1978 to the first half of this year. The volume of
exports of goods and services, on the other hand, fell in the same period
by 3 percent.
Inflation has accelerated sharply this year in the United Kingdom.
The year-over-year inflation rate jumped from 11.5 percent in June to 15.5
percent in July, when the June 12 increase in the VAT was reflected in the
CPI. However, in August and September consumer prices rose on average by
only about 1 percent on a month-to-month basis.

IV - 24
On October 24 all exchange controls (except on the purchase of
Rhodesian securities) were abolished in the United Kingdom. This action,
which followed liberalization of outward direct investment and portfolio
investment in EEC currencies in June and July, means that U.K. residents
now have full freedom to engage in all kinds of foreign currency trans-
actions.
In France, output growth was less than 1 percent (s.a.a.r.) in the
first half year, considerably below the 3.7 percent annual rate of growth
in 1978. On the basis of trade data, surveys and policy developments, the
sources of strength are likely to be the same in 1979 as in 1978, namely, ex-
ports and consumption. In the first half of this year export volume grew by
8 percent over the same period last year, undoubtedly making it the strongest
source of demand. Real import growth, however, exceeded that of exports,
amounting to over 12 percent in the first half of this year compared to the
first half of last year. Real private consumption growth is likely to be
weaker this year than in 1978 as a result of the July increase in employee
social security contributions, the rapid pass-through of energy price in-
creases, and the stagnation in the level of employment.
Investment has been an area of concern to the authorities for the
past several years. Despite attempts to stimulate this sector, including the
partial relaxation of price controls, income tax deductions for equity
purchases by individuals, and a $1-1/3 billion investment incentive program
(in April), private investment will probably remain weak this year.
In the week of October 1, the authorities expanded the coverage of
credit controls in an attempt to hold monetary growth to 11 percent for 1980.
Export financing, housing, and infrastructure investment credits will be
subject to greater control than heretofore. In response to interest rate
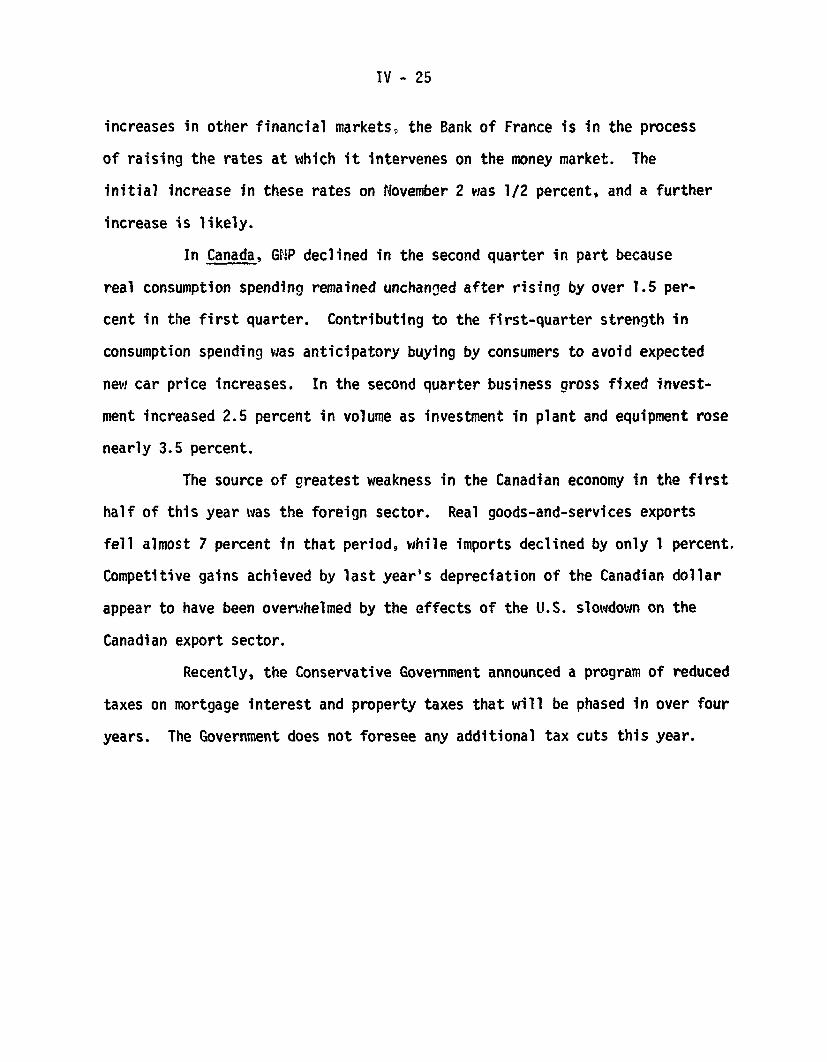
IV - 25
increases in other financial markets, the Bank of France is in the process
of raising the rates at which it intervenes on the money market. The
initial increase in these rates on November 2 was 1/2 percent, and a further
increase is likely.
In Canada, GNP declined in the second quarter in part because
real consumption spending remained unchanged after rising by over 1.5 per-
cent in the first quarter. Contributing to the first-quarter strength in
consumption spending was anticipatory buying by consumers to avoid expected
new car price increases. In the second quarter business gross fixed invest-
ment increased 2.5 percent in volume as investment in plant and equipment rose
nearly 3.5 percent.
The source of greatest weakness in the Canadian economy in the first
half of this year was the foreign sector. Real goods-and-services exports
fell almost 7 percent in that period, while imports declined by only 1 percent.
Competitive gains achieved by last year's depreciation of the Canadian dollar
appear to have been overwhelmed by the effects of the U.S. slowdown on the
Canadian export sector.
Recently, the Conservative Government announced a program of reduced
taxes on mortgage interest and property taxes that will be phased in over four
years. The Government does not foresee any additional tax cuts this year.