fomc 19830329 g bpt 119830323
TRANSCRIPT

Prefatory Note
The attached document represents the most complete and accurate version available based on original copies culled from the files of the FOMC Secretariat at the Board of Governors of the Federal Reserve System. This electronic document was created through a comprehensive digitization process which included identifying the best-preserved paper copies, scanning those copies,1 and then making the scanned versions text-searchable.2 Though a stringent quality assurance process was employed, some imperfections may remain.
Please note that this document may contain occasional gaps in the text. These gaps are the result of a redaction process that removed information obtained on a confidential basis. All redacted passages are exempt from disclosure under applicable provisions of the Freedom of Information Act.
1 In some cases, original copies needed to be photocopied before being scanned into electronic format. All scanned images were deskewed (to remove the effects of printer- and scanner-introduced tilting) and lightly cleaned (to remove dark spots caused by staple holes, hole punches, and other blemishes caused after initial printing). 2 A two-step process was used. An advanced optimal character recognition computer program (OCR) first created electronic text from the document image. Where the OCR results were inconclusive, staff checked and corrected the text as necessary. Please note that the numbers and text in charts and tables were not reliably recognized by the OCR process and were not checked or corrected by staff.

Confidential (FR) Class II FOMC
March 23, 1983
SUMMARY AND OUTLOOK
Prepared for the Federal Open Market CommitteeBy the staff of the Board of Governors of the Federal Reserve System

DOMESTIC NONFINANCIAL DEVELOPMENTS
Recent developments. Incoming data confirm that the economy has
begun to recover from the prolonged contraction. Although the weather
buffeted the monthly readings, production and employment showed moderate
gains on balance between December and February. Consumer spending was
well maintained, and residential construction was surprisingly strong.
Inflation rates remain low and have been held down, in part, by the
decline in the price of imported oil.
The index of industrial production rose for the third consecutive
month in February and has recovered 1-3/4 percent since its November trough;
this rate of increase is moderate when compared with the typical initial
production rebounds in previous postwar cycles. An upswing in the produc-
tion of consumer durable goods, particularly autos, has contributed sig-
nificantly to the turnaround. Producers of materials and construction
supplies also have begun to post gains while defense production has con-
tinued to rise. In contrast, output of business equipment declined in
both January and February with particularly sharp cutbacks in oil and
gas-well drilling. The decline in drilling activity is likely to con-
tinue to be a drag on production in March. In addition, auto assemblies
this month are scheduled to drop 10 percent below the February pace of
6.3 million units (annual rate). Several other industries, such as
steel, have reported increases in production in March.
Nonfarm payroll employment showed a net gain of 150,000 between
December and February. The number of jobs in the manufacturing sector,
which probably was little affected by weather-related distortions, in-
creased 90,000 over the two-month span; the rise largely reflected
rehiring in the auto and related metals industries. The civilian un-
employment rate stood at 10.4 percent in both January and February,
down from the high of 10.7 percent in December. The drop in jobless-
ness, however, was due to an unusually sharp contraction in the labor
force rather than a surge in the household survey measure of employment.
Consumer spending continued to move up in early 1983, although at
a slower rate than in the fourth quarter of last year. Sales of domestic
autos, which have been supported by interest-rate subsidies, boosted
spending last quarter, but remained at the December rate of just over 6
million units through early March. Outlays for other consumer goods
(excluding gasoline), however, continued to increase moderately in
nominal terms in both January and February; sales at general merchandise,
apparel, and furniture and appliance stores in February were 2-1/2
percent above the fourth-quarter average.
Housing starts strengthened considerably from 1.3 million units
(annual rate) in December to 1.7 million units in January. And, despite
some unfavorable weather, starts edged higher in February with a par-
ticularly large gain in starts of multi-family units. However, it
seems likely that starts will drop off a bit in the near term; although
inventories of new unsold units remain lean in most parts of the country,
real borrowing costs are still relatively high.
In the business sector, near-term indicators of spending remain
weak. Shipments of nondefense capital goods edged down again in February,
and new orders in this category also fell sharply, although most of the
decline occurred in the aircraft industry in which bookings are often
I-3
volatile. In contrast, outlays for nonresidential construction rose in
January, but some of that surge may have been related to favorable
weather. Spending for office buildings remained weak, which is consis-
tent with the continued rise in national office vacancy rates. In
addition, with oil prices falling, petroleum drilling activity dropped
dramatically during February to the lowest level since mid-1979.
Business inventories were liquidated at a $23 billion rate in
constant-dollar terms during January, continuing the rapid rate of decu-
mulation seen in the fourth quarter of 1982. In particular, several
durable manufacturing industries made further progress in reducing
inventory overhangs. Stocks in the retail sector were little changed
and, outside of the automotive sector, edged down relative to sales.
In February, dealers' stocks of domestic autos rose a little, but at
the present selling rate, they represent a relatively comfortable 61-
days' supply.
Wage increases for production workers have averaged 4-1/2 percent
at an annual rate in the past three months, down from a 6-1/2 percent rate
during much of 1982. Several recent union settlements appear to reflect a
recognition of the need to cut labor costs as well as a more general decline
in inflation expectations. The wage concessions negotiated last month in
steel should provide some relief to that beleaguered industry and should set
a precedent for moderation in other metals and container industries.
The recent sharp drop in crude petroleum prices has further damped
overall inflation rates. The consumer price index was unchanged between
December and February, and producer prices for finished goods fell
nearly 1 percent over the same period. These favorable inflation read-
ings reflect the fact that the weakness in world petroleum markets already
had begun to pull down the cost of imported oil before the recent price
decline was announced by OPEC. As a result, the CPI measure of gasoline
prices dropped 3-1/4 percent in January and another 6-3/4 percent in Feb-
ruary. As usual, firming in economic activity has been reflected in
a rebound in the prices of industrial commodities from their depressed
levels of last year. But these items exert little direct inflationary
pressure because they constitute only a very small share of the cost
of final products.
Outlook. The staff now estimates that real GNP will rise at a
4 percent annual rate during the first quarter. The gain, in large
part, reflects an anticipated sharp reduction in the rate of inventory
liquidation. Real final sales are expected to grow at a 2 percent an-
nual rate compared with a 5-1/2 percent gain in the final quarter of
1982; much of this deceleration was the result of a marked slowdown
in federal CCC purchases. A moderate rise in consumer spending and
substantially higher outlays for residential construction are antic-
ipated to contribute to the rise in real spending, more than offsetting
declines in business fixed investment. With the further slide in oil
prices, inflation, as measured by the gross domestic business product
fixed-weighted index, is estimated to drop to 2-3/4 percent at an
annual rate in the first quarter; however, with shifts in the compo-
sition of expenditures, the GNP implicit price deflator is expected
to show a rise of almost 4 percent.
The monetary policy assumptions underlying the staff projection
are little changed from the last Greenbook. From its February-March
base, M2 is assumed to grow somewhat above the mid-point of the FOMC's
7 to 10 percent range through 1983, assuming only modest further
shifts into money market deposit accounts from outside M2, and at about
an 8 percent rate in 1984. Interest rates are expected to remain near
current levels or to decline somewhat--especially in long-term markets--
as the rate of price increase stays low and inflation expectations
continue to improve.
The principal change in the staff's fiscal policy assumptions is
the addition of a "jobs bill", costing about $4-1/2 billion; outlays
under this authority are expected to be spread over three years, and
are largely offset by minor revisions in other categories of spending,
especially unemployment compensation. On balance, the unified budget
deficit is estimated at around $200 billion for both fiscal years
1983 and 1984.
Real GNP is projected to continue to grow at about a 4 percent
annual rate during 1983, and then, as the recovery in economic activity
becomes more broadly-based, to rise a bit faster in 1984. The drawdown
of business inventories is anticipated to end in the second quarter of
1983, and subsequent restocking is expected to be cautious. But demand
in other sectors should then provide more support to economic growth.
Consumer spending will receive a boost this year from lower energy
costs and the final stage of the 1981 tax cut, and during 1984 is
projected to about keep pace with the 3-1/4 percent rise in real

disposable income. Housing starts are expected to drop back a bit
from their current level of 1-3/4 million units (annual rate), but
the trend in outlays for residential construction should be gen-
erally upward over the projection period; starts are expected to
average 1.6 million units in 1983 and 1.8 million units in 1984. In
addition, by late this year, two sectors that currently are a drag on
economic activity--business investment and exports--are projected
to begin to show improvement. Rising production should halt the
slide in capital spending in late 1983, but the subsequent recov-
ery in business investment is expected to occur almost entirely in
outlays for equipment. An improvement in foreign economic activity,
is anticipated to begin to boost exports in the second half of this
year; a projected decline in the exchange rate should further support
export volume in 1984.
Labor demand is projected to continue to expand only gradually,
in line with the moderate economic recovery projected, and the civilian
labor force is expected to rebound after its unusual decline in the
first quarter of 1983. As a result, the civilian jobless rate is
projected to hover near 10-1/2 percent through the middle of this
year and then to decline slowly, remaining above 9 percent at the end
of 1984.
The wide margins of slack in labor and product markets that recede
only slowly throughout the projection period are the most important factor
in our expectation of further improvement in wage and price inflation
this year. In addition, consistent with the price reduction announced by
OPEC, the staff now assumes that the unit value of imported oil--which
includes both crude and refined products--will move down an additional
$1 per barrel to $28 by the second quarter of 1983 from $31 per
barrel in the fourth quarter of 1982. The weakness in world oil
prices already has lowered domestic inflation and should spill over
into smaller increases in wages and other costs of production this
year. The depreciation of the dollar, however, is expected to generate
upward pressure on domestic prices, particularly in 1984. On balance,
the gross domestic business product fixed-weighted price index is
projected to rise at a 3-3/4 percent annual rate over the four quarters
of 1983 and to remain at that rate in 1984.
Detailed data for these projections are shown in the tables that
follow.

March 23, 1983
STAFF GNP PROJECTIONS
Percent changes, annual rate- - - ---- ------------ --'- -"------- - - - - - -- - - - - - - -- - - - - - -- - - - - - -
Nominal GNP Real GNP
Gross domesticbusiness productfixed-veightedprice index
---------------- ~---------------------
Total Excluding foodand energy
2/2/83 3/23/83 2/2/83 3/23/83 2/2/83 3/23/83 2/2/83 3/23/83 2/2/83 3/23/83
Annual changes:
1981 <1> 11.6 11.61982 <1> 4.1 4.11983 6.1 6.61984 7.8 8.0
Quarterly changes:
1982 QI <1> -1.0Q2 <1> 6.8Q3 <1> 5.8Q4 <1> 1.7
-1.06.85.82.6
1.9 1.9-1.8 -1.7
1.8 2.54.1 4.4
-5.1 -5.12.1 2.1
.7 .7-2.5 -1.1
3.5 4.12.6 3.53.9 4.53.9 4.4
7.8 8.07.8 7.98.4 8.49.0 8.9
9.6 9.65.9 5.94.3 3.93.9 3.8
4.4 4.43.8 3.85.9 5.94.7 4.3
3.3 2.74.2 3.74.2 4.03.9 3.9
3.8 3.83.8 3.73.9 3.73.9 3.6
9.4 9.46.9 6.94.8 4.63.8 3.7
4.9 4.54.5 4.94.0 3.93.7 3.6
3.7 3.63.8 3.63.9 3.63.7 3.5
Two-quarter changes: <2>
1982 Q2 <1> 2.8 2.8Q4 <1> 3.7 4.2
1983 Q2Q4
1984 Q2Q4
-1.6 -1.6-. 9 -. 2
7.2 8.2 3.0 3.87.7 7.7 3.9 4.5
7.8 7.9 4.2 4.48.7 8.6 4.5 4.9
Four-quarter changes: <3>
1981 Q4 <1> 9.6 9.61982 Q4 <1> 3.3 3.5
1983 Q41984 Q4
4.2 4.2 5.6 5.6 1.1 1.15.3 5.1 5.1 5.0 1.3 1.3
3.8 3.2 4.7 4.74.1 3.9 3.8 3.7
.2 -. 2-. 3 -. 3
3.8 3.7 3.8 3.6 -.5 -.63.9 3.6 3.8 3.6 -.6 -.5
.7 .7 8.9 8.9-1.2 -.9 4.8 4.7
7.5 7.9 3.5 4.18.3 8.3 4.4 4.6
3.9 3.63.8 3.7
9.3 9.35.4 5.3
4.3 4.23.8 3.6
.9 .92.4 2.4
-.1 -.5-1.1 -1.1
<1> Actual.<2> Percent change from two quarters earlier.<3> Percent change from four quarters earlier.
Unemploymentrate
(percent)
1983 QIQ2Q3Q4
1984 QIQ2Q3Q4
7.6 7.69.7 9.710.8 10.39.9 9.5
8.8 8.89.4 9.410.0 10.010.7 10.7
10.9 10.410.9 10.510.8 10.310.6 10.2
10.4 9.910.1 9.69.8 9.49.5 9.1
March 23, 1983
CONFIDENTIAL - FR
CLASS II FOMC
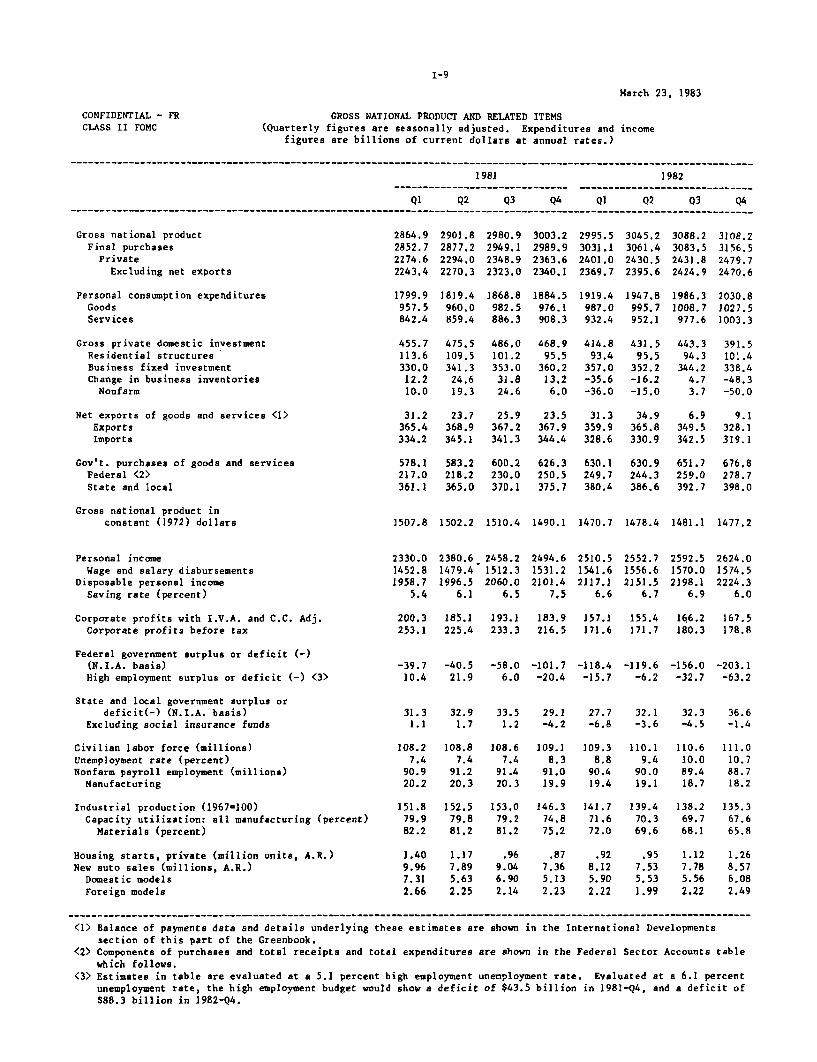
GROSS NATIONAL PRODUCT AND RELATED ITEMS(Quarterly figures are seasonally adjusted. Expenditures and income
figures are billions of current dollars at annual rates.)
1981 1982
Q1 Q2 Q3 Q4 Q1 Q2 Q3 Q4
Gross national product 2864.9 2901.8 2980.9 3003.2 2995.5 3045.2 3088.2 3108.2Final purchases 2852.7 2877.2 2949.1 2989.9 3031.1 3061.4 3083.5 3156.5
Private 2274.6 2294.0 2348.9 2363.6 2401.0 2430.5 2431.8 2479.7Excluding net exports 2243.4 2270.3 2323.0 2340.1 2369.7 2395.6 2424.9 2470.6
Personal consumption expenditures 1799.9 1819.4 1868.8 1884.5 1919.4 1947.8 1986.3 2030.8Goods 957.5 960.0 982.5 976.1 987.0 995.7 1008.7 1027.5Services 842.4 859.4 886.3 908.3 932.4 952.1 977.6 1003.3
Gross private domestic investment 455.7 475.5 486.0 468.9 414.8 431.5 443.3 391.5Residential structures 113.6 109.5 101.2 95.5 93.4 95.5 94.3 101.4Business fixed investment 330.0 341.3 353.0 360.2 357.0 352.2 344.2 338.4Change in business inventories 12.2 24.6 31.8 13.2 -35.6 -16.2 4.7 -48.3Nonfarm 10.0 19.3 24.6 6.0 -36.0 -15.0 3.7 -50.0
Net exports of goods and services <1> 31.2 23.7 25.9 23.5 31.3 34.9 6.9 9.1Exports 365.4 368.9 367.2 367.9 359.9 365.8 349.5 328.1Imports 334.2 345.1 341.3 344.4 328.6 330.9 342.5 319.1
Gov't. purchases of goods and services 578.1 583.2 600.2 626.3 630.1 630.9 651.7 676.8Federal <2> 217.0 218.2 230.0 250.5 249.7 244.3 259.0 278.7State and local 361.1 365.0 370.1 375.7 380.4 386.6 392.7 398.0
Gross national product inconstant (1972) dollars 1507.8 1502.2 1510.4 1490.1 1470.7 1478.4 1481.1 1477.2
Personal incomeWage and salary disbursements
Disposable personal incomeSaving rate (percent)
Corporate profits with I.V.A. and C.C. Adj.Corporate profits before tax
Federal government surplus or deficit (-)(N.I.A. basis)High employment surplus or deficit (-) <3>
State and local government surplus ordeficit(-) (N.I.A. basis)
Excluding social insurance funds
Civilian labor force (millions)
Unemployment rate (percent)Nonfarm payroll employment (millions)Manufacturing
Industrial production (1967=100)Capacity utilization: all manufacturing (percent)
Materials (percent)
Housing starts, private (million units, A.R.)New auto sales (millions, A.R.)
Domestic models
Foreign models
2330.01452.81958.7
5.4
2380.61479.41996.5
6.1
2458.21512.32060.0
6.5
2494.61531.22101.4
7.5
2510.51541.62117.1
6.6
2552.71556.62151.5
6.7
2592.51570.02198.1
6.9
2624.01574.52224.3
6.0
200.3 185.1 193.1 183.9 157.1 155.4 166.2 167.5253.1 225.4 233.3 216.5 171.6 171.7 180.3 178.8
-39.7 -40.5 -58.0 -101.7 -118.4 -119.6 -156.0 -203.110.4 21.9 6.0 -20.4 -15.7 -6.2 -32.7 -63.2
31.3 32.9 33.5 29.1 27.7 32.1 32.3 36.61.1 1.7 1.2 -4.2 -6.8 -3.6 -4.5 -1.4
108.27.4
90.920.2
151.879.982.2
1.409.967.312.66
108.87.4
91.220.3
152.579.881.2
1.177.895.632.25
108.67.4
91.420.3
153.079.281.2
109.18.3
91.019.9
146.374.875.2
109.38.8
90.419.4
141.771.672.0
110.19.4
90.019.1
139.470.369.6
110.610.089.418.7
138.269.768.1
111.010.788.718.2
135.367.665.8
.96 .87 .92 .95 1.12 1.269.04 7.36 8.12 7.53 7.78 8.576.90 5.13 5.90 5.53 5.56 6.082.14 2.23 2.22 1.99 2.22 2.49
-- - - - - - - - - - - - - - -- - - - - - - - - - - - - - - - - - - - - - - - --------------------------'------------
<1) Balance of payments data and details underlying these estimates are shown in the International Developmentssection of this part of the Greenbook.
<2> Components of purchases and total receipts and total expenditures are shown in the Federal Sector Accounts table
which follows.<3> Estimates in table are evaluated at a 5.1 percent high employment unemployment rate. Evaluated at a 6.1 percent
unemployment rate, the high employment budget would show a deficit of $43.5 billion in 1981-Q4, and a deficit of
$88.3 billion in 1982-Q4.

March 23, 1983
CONFIDENTIAL - FRCLASS II FOMC
PERCENT CHANGES IN GROSS NATIONAL PRODUCTAND RELATED ITEMS
(Annual rates compounded quarterly)
1981- --- ---- ---- ---- ----
1982---
- - - - -- - - - - -
QI Q2 Q3 Q4 Ql Q2 Q3 Q4--------------------------------------------------------------------------
Constant (1972) Dollars
Gross national productFinal purchases
PrivateExcluding net exports
Personal consumption expendituresGoodsServices
Gross private domestic investmentResidential structuresBusiness fixed investment
Gov't. purchases of goods and servicesFederalNational defenseState and local
-1.5 2.2 -5.3 -5.1-4.0 1.0 -2.3 .2-4.0 .4 -4.4 1.0-2.8 2.2 -3.6 .9
-2.7 2.9 -3.3 2.5-5.1 4.0 -6.2 2.0
.1 1.7 .0 3.0
25.0 14.91.0 -17.48.0 1.1
6.9-31.9
9.3
-22.6-25.3
.6
-36.5-10.2-5.0
2.1-.9.2.6
2.52.52.4
15.012.9
-11.8
5.2 -4.1 3.6 7.0 -2.9 -5.312.2 -3.2 14.8 20.4 -5.5 -13.58.0 11.5 7.6 10.1 -7.9 21.41.3 -4.6 -2.7 -.8 -1.1 .4
.7 -1.1-1.3 5.4-3.5 3.9-.9 4.1
7.9 -37.3-5.3 39.3-7.6 -6.0
8.4 12.023.1 32.813.0 2.0-. 2 -. 4
Disposable personal income
Current Dollars
3.7 .6 4.8 1.2 -1.9 3.1 1.3 .3
Gross national productFinal purchases
PrivateExcluding net exports
Personal consumption expendituresGoodsServices
Gross private domestic investmentResidential structuresBusiness fixed investment
Gov't. purchases of goods and servicesFederalNational defenseState and local
Disposable personal income
Personal incomeWage and salary disbursements
Corporate profits with I.V.A. and C.C. Adj.Corporate profits before tax
Nonfarm payroll employmentManufacturing
Nonfarm business sectorOutput per hourCompensation per hourUnit labor costs
GNP implicit deflator <1>Gross domestic business product
fixed-weighted price index <2>Excluding food and energy
Consumer price index (all urban)
19.6 5.314.6 3.514.8 3.513.4 4.9
13.0 4.414.7 1.011.1 8.3
52.2 18.511.5 -13.416.7 14.5
11.4 3.0 -1.0 6.8 5.8 2.610.4 5.7 5.6 4.1 2.9 9.89.9 2.5 6.5 5.0 .2 8.19.6 3.0 5.2 4.4 5.0 7.8
11.3 3.4 7.6 6.1 8.1 9.39.7 -2.6 4.5 3.6 5.3 7.713.2 10.3 11.0 8.7 11.2 11.0
9.2-27.014.3
-13.3-20.88.4
-38.8-8.4-3.5
17.2 11.4 -39.19.4 -4.9 33.6
-5.3 -8.7 -6.6
13.7 3.6 12.2 18.6 2.4 .6 13.8 16.320.9 2.2 23.5 40.7 -1.4 -8.3 26.3 34.215.4 22.1 10.8 36.7 -1.8 26.4 15.6 15.49.7 4.4 5:7 6.2 5.0 6.7 6.5 5.5
12.3 7.9 13.4 8.3 3.0
13.0 9.0 13.712.0 7.5 9.2
6.7 8.9 4.9
6.1 2.6 6.9 6.4 4.95.1 2.7 3.9 3.5 1.2
49.3 -27.1 18.4 -17.7 -46.712.2 -37.1 14.8 -25.8 -60.5
-4.3 30.8.2 21.6
3.2-3.3
1.8 1.0 .8 -1.8 -2.4 -1.7 -2.9 -2.81.3 2.8 .1 -8.1 -9.0 -7.2 -7.8 -9.8
4.9 -1.3 -.3 -3.5 .611.8 7.1 9.0 7.3 7.76.6 8.6 9.3 11.2 7.1
10.9
10.48.4
10.5
6.8
8.69.48.5
9.0
9.311.012.1
8.8
7.48.67.1
4.3
4.45.33.0
.86.15.2
4.6
3.85.95.3
3.56.63.1
5.0
5.95.27.7
2.05.63.5
3.7
4.34.71.9
Industrial production 8.4 1.9 1.4 -16.6 -11.8 -6.5 -3.4 -8.2
<1> Excluding Federal pay increases, rates of change were: 1981-Q1,
1982-Q1, 4.2 percent; 1982-Q4, 3.3 percent.
<2> Uses expenditures in 1972 as weights.
10.8 percent; 1981-Q6, 7.8 percent;
........... ........... ----- ..... ---____ .. .. ... .. .. ... .. ... .. .. . .. . .. .. ... .. .. ... .. ..
--- ------------------------------------------------------- ---------------

March 23, 1982
CONFIDENTIAL - FRCLASS II FOMC
GROSS NATIONAL PRODUCT AND RELATED ITEMS(Quarterly figures are seasonally adjusted. Expenditures and income
figures are billions of current dollars at annual rates.)
------------------------- Projected-----------------1983 1984
01 Q2 Q3 Q4 Q1 02 Q3 QA----------------------------------------------------------------------------------------------------------------
Gross national productFinal purchasesPrivate
Excluding net exports
Personal consumption expenditures
GoodsServices
Gross private domestic investmentResidential structuresBusiness fixed investmentChange in business inventories
Nonfarm
Net exports of goods and services <1>ExportsImports
Gov't. purchases of goods and servicesFederal <2>State and local
3169.43203.92520.62507.0
2053.51033.21020.3
419.0118.4335.1-34.5-34.5
13.6328.8315.2
683.3279.5403.8
3232.43233.92547.02549.1.
2084.91043.21041.7
462.7127.9336.3-1.5-1.5
-2.1326.0328.1
686.9276.9410.0
3291.93281.92580.92598.2
2128.01064.01064.0
480.2132.4337.8
10.010.0
-17.3333.0350.3
701.0285.7415.3
3354.23337.22621.22646.8
2169.51083.51086.0
494.3136.9340.417.017.0
-25.6343.5369.0
716.0295.0421.0
3419.23394.22668.82699.2
2209.51101.51108.0
514.7142.9346.825.025.0
-30.4353.9384.3
725.4298.4427.0
3484.63454.62719.62749.8
2248.01119.01129.0
531.8147.9353.930.030.0
-30.2368.5398.7
735.0302.4432.6
3555.33521.32775.92801.7
2287.01136.01151.0
548.7151.9362.834.034.0
-25.8386.1411.9
745.4307.2438.2
3631.83593.82832.62855.1
2327.01154.01173.0
566.1154.9373.2
38.038.0
-22.5404.9427.4
761.2317.4443.8
Gross national product inconstant (1972) dollars 1492.2 1505.2 1521.7 1538.3 1555.0 1571.5 1589.9 1609.6
rsonal incomeWage and salary disbursements
Disposable personal incomeSaving rate (percent)
Corporate profits with I.V.A. and C.C. Adj.Corporate profits before tax
Federal government surplus or deficit (-)(N.I.A. basis)High employment surplus or deficit (-) <3>
State and local government surplus ordeficit (-) (N.I.A. basis)
Excluding social insurance funds
Civilian labor force (millions)Unemployment rate (percent)
Nonfarm payroll employment (millions)Manufacturing
Industrial production (1967-100)Capacity utilization: all manufacturing (percent)
Materials (percent)
Housing starts, private (million units, A.R.)New auto sales (millions, A.R.)
Domestic modelsForeign models
2646.01597.72244.9
5.8
2692.11622.52285.3
6.1
2739.61650.92338.5
6.3
2785.81681.62377.1
6.0
2833.21711.72417.8
5.9
2881.41743.22458.3
5.9
2932.51774.82501.0
5.9
2991.21813.12550.6
6.1
183.0 196.1 204.7 212.4 213.6 221.7 235.5 246.5173.3 185.9 191.3 192.1 189.3 193.4 203.4 210.7
-184.4 -177.5 -199.5 -204.9 -197.0 -192.6 -189.6 -193.3-41.1 -31.3 -55.4 -61.9 -53.4 -51.1 -52.2 -59.3
38.7 41.0 44.7 47.5 48.6 50.4 52.5 55.1-.5 .4 2.6 3.9 3.3 3.6 4.1 5.1
110.6 111.2 111.6 112.1 112.6 113.1 113.6 114.110.4 10.5 10.3 10.2 9.9 9.6 9.4 9.1
88.8 89.3 89.8 90.5 91.2 91.9 92.6 93.418.2 18.5 18.8 19.0 19.3 19.7 20.0 20.3
137.468.567.1
139.969.468.5
142.570.370.2
145.471.471.9
147.872.073.1
150.372.874.3
153.073.775.6
156.074.777.1
1.65 1.55 1.60 1.65 1.70 1.75 1.80 1.858.60 8.40 8.90 9.30 9.30 9.20 9.50 9.706.20 6.20 6.60 6.90 7.00 7.10 7.20 7.302.40 2.20 2.30 2.40 2.30 2.10 2.30 2.40
<1> Balance of payments data and details underlyingsection of this part of the Greenbook.
these estimates are shown in the International Developments
<2> Components of purchases and total receipts and total expenditures are shown in the Federal Sector Accounts tablewhich follows.
> Estimates in table are evaluated at a 5.1 percent high employment unemployment rate. Evaluated at a 6.1 percentunemployment rate, the high employment budget would show a deficit of $89.3 billion in 1983-Q4, and a deficit of$91.0 billion in 1984-Q4.
-- -- - -- - -- -- - -- - -- -- - -- - -- - -- -- - -- - -- -- - -- - -- - - -- - -- - - -- - -- - -- -- - -- - -- -

March 23, 1983CONFIDENTIAL - FRCLASS II FOMC PERCENT CHANGES IN GROSS NATIONAL PRODUCT
AND RELATED ITEMS(Annual rates compounded quarterly)
--------------------------------------------------------------------------------- ce-------------------------------------------- Projected---------------------..
1983 1984------------------------------------------------------
Ql Q2 Q3 Q4 Ql Q2 Q3 Q4
Constant (1972) Dollars
Gross national productFinal purchasesPrivate
Excluding net exports
Personal consumption expendituresGoodsServices
Gross private domestic investmentResidential structuresBusiness fixed investment
Gov't. purchases of goods and servicesFederalNational defenseState and local
Disposable personal income
4.1 3.51.9 .43.2 1.33.3 3.3
4.5 4.43.0 3.62.9 3.63.8 3.5
1.9 2.7 4.1 3.63.0 2.3 4.7 3.6
.7 3.1 3.6 3.6
31.5 33.0 12.7 9.2 13.9 10.6 10.0 10.879.9 31.3 10.5 10.0 14.0 10.1 6.5 3.6-4.7 -1.2 -.4 .8 4.8 5.5 7.4 9.7
-3.3 -3.4 3.7 3.4 1.1 1.8 2.1 2.5-8.7 -9.6 8.8 6.9 .4 2.3 3.0 4.17.6 12.7 11.7 7.8 6.8 6.2 4.7 5.3.6 1.1 .5 1.1 1.7 1.4 1.4 1.4
1.1 3.8 5.2 2.4 2.8 3.0 3.0 4.1
Current Dollars
Gross national productFinal purchases
PrivateExcluding net exports
Personal consumption expendituresGoodsServices
Gross private domestic investmentResidential structuresBusiness fixed investment
Gov't. purchases of goods and servicesFederalNational defenseState and local
Disposable personal income
Personal incomeWage and salary disbursements
Corporate profits with I.V.A. and C.C. Adj.Corporate profits before tax
Nonfarm payroll employmentManufacturing
Nonfarm business sectorOutput per hourCompensation per hourUnit labor costs
GNP implicit deflator <1>Gross domestic business product
fixed-weighted price index <2>Excluding food and energy
Consumer price index (all urban)
Industrial production
8.1 8.2 7.66.1 3.8 6.16.8 4.2 5.46.0 6.9 7.9
4.5 6.3 8.5 8.02.2 3.9 8.2 7.57.0 8.7 8.8 8.5
31.2 48.7 16.0 12.3 17.6 14.0 13.3 13.385.7 36.2 14.8 14.3 18.7 14.7 11.3 8.1-3.9 1.4 1.8 3.1 7.7 8.4 10;4 12.0
3.9 2.1 8.5 8.8 5.4 5.41.1 -3.7 13.3 13.7 4.7 5.5
10.3 17.1 17.0 15.5 11.3 9.35.9 6.3 5.3 5.6 5.8 5.3
3.8 7.4 9.6 6.8 7.0 6.9 7.1 8.2
3.4 7.2 7.3 6.9 7.0 7.0 7.3 8.2
6.0 6.4 7.2 7.6 7.4 7.6 7.5 8.9
42.4 31.8 18.8 15.9 2.2 16.1 27.3 20.0
-11.6 32.4 12.2 1.7 -5.8 9.0 22.4 15.1
.5 1.9 2.6 2.8 3.2 3.2 3.3 3.5
.6 5.4 6.2 6.3 6.5 6.8 6.9 7.0
4.9 3.0 2.75.6 4.5 4.3.7 1.5 1.6
4.5
3.74.94.1
1.56.04.4
3.4
3.83.64.2
6.4 7.5 7.6 8.4 6.8 6.9 7.4 8.1
<1> Excluding Federal pay increases, the rates of change are:1984-Q1, 3.4 percent; 1984-Q4 3.1 percent.
<2> Uses expenditures in 1972 as weights.
1983-Q1, 3.8 percent; 1983-04, 2.9 percent;--- -- -- -- -- -- -- --- -- -- -- -- -- -- --- - - -- -- -- -- -- --- -- -- -- -- -- -- --- -- -- -- -- -- -- --

I-13
March 23, 1983
CONFIDENTIAL - FRCLASS II FOMC
GROSS NATIONAL PRODUCT AND RELATED ITEMS(Expenditures and income figures are billions of current dollars.)
---Projected---1977 1978 1979 1980 1981 1982 1983 1984
Gross national productFinal purchases
PrivateExcluding net exports
Personal consumption expendituresGoodsServices
Gross private domestic investmentResidential constructionBusiness fixed investmentChange in business inventoriesNonfarm
Net exports of goods and services <1>ExportsImports
Gov't. purchases of goods and servicesFederal <2>State and local
1918.31895.31501.51505.5
1204.4657.0547.4
324.195.8
205.223.021.9
-4.0182.7186.7
393.8143.4250.4
Gross national product inconstant (1972) dollars
Personal incomeWage and salary disbursements
Disposable personal incomeSaving rate (percent)
Corporate profits with I.V.A. and C.C.Adj.Corporate profits before tax
Federal government surplus or deficit(-)(N.I.A. basis)High employment surplus or deficit(-)
State and local government surplus ordeficit (-) (N.I.A. basis)
Excluding social insurance funds
Civilian labor force (millions)Unemployment rate (percent)
Nonfarm payroll employment (millions)Manufacturing
Industrial production (1967=100)Capacity utilization: all manufacturing (percent)
Materials (percent)
Housing starts, private (million units, A.R.)New auto sales (millions, A.R.)Domestic models
Foreign models
2163.9
2137.41705.51706.6
1346.5728.5618.0
386.6111.2248.926.525.4
-1.1218.7219.8
431.9153.6278.3
2417.82403.51929.11915.9
1507.2813.5693.7
423.0118.6290.2
14.38.6
13.2281.4268.1
474.4168.3306.0
2633.12643.12104.72079.5
1667.2884.7782.5
402.3103.2309.2-10.0-5.7
25.2339.2314.0
538.4197.2341.2
2937.72917.32320.42294.3
1843.2969.1874.1
471.5104.9346.120.515.0
26.1367.3341.3
596.9228.9368.0
3059.33083.12435.72415.2
1971.11004.8966.3
420.396.2348.0-23.8-24.3
20.5350.8330.3
647.4257.9389.4
3262.03264.22567.42575.3
2109.01055.91053.0
464.0128.9337.4-2.2-2.2
-7.8332.8340.7
696.8284.3412.5
1369.7 1438.6 1479.4 1474.0 1502.6 1476.9 1514.4
1540.4983.2
1314.05.9
1732.71106.31474.0
6.1
1951.21237.61650.2
5.9
2160.41356.11824.1
5.8
2415.81493.92029.1
6.4
2569.91560.72172.7
6.5
2715.91638.22311.4
6.1
3522.73491.02749.22776.4
2267.91127.61140.2
540.3149.4359.231.831.8
-27.2378.4405.6
741.7306.3435.4
1581.5
2909.61760.72481.9
6.0
167.3 192.4 194.8 181.6 190.6 161.5 199.0 229.3194.7 229.1 '252.7 242.4 232.1 175.6 185.6 199.2
-45.9 -29.5, -16.1 -61.4 -60.0 -149.3 -191.6 -193.1-20.5 -16.0 -2.0 -17.2 4.5 -29.4 -47.4 -54.0
28.0 30.3 30.4 28.1 31.7 32.2 43.0 51.610.1 10.0 6.6 .9 -.1 -4.1 1.6 4.0
99.0 102.3 105.0 106.9 108.7 110.2 111.4 113.37.1 6.1 5.8 7.1 7.6 9.7 10.4 9.5
82.5 86.7 89.8 90.4 91.1 89.6 89.6 92.3
19.7 20.5 21.0 20.3 20.2 18.8 18.6 19.8
138.181.982.7
1.9611.139.072.06
146.184.485.6
2.0011.29
9.292.00
152.585.687.4
1.7210.688.362.32
147.079.180.0
150.978.479.9
138.669.868.9
141.369.969.4
151.873.375.0
1.30 1.10 1.06 1.61 1.779.04 8.56 8.00 8.80 9.426.62 6.24 5.77 6.47 7.152.42 2.32 2.23 2.32 2.27
Developments section of this
Federal Sector Accounts table
<1> Balance of payments data underlying these estimates are shown in the Internationalpart of the Greenbook.
<2> Components of purchases and total receipts and total expenditures are shown in thewhich follows.

I-14 March 23, 1983
CONFIDENTIAL - FR PERCENT CHANGES IN GROSS NATIONAL PRODUCTCLASS II FOMC AND RELATED ITEMS
--Projected--1977 1978 1979 1980 1981 1982 1983 1984
Constant (1972) Dollars
Gross national product 5.5 5.0 2.8 -.4 1.9 -1.7 2.5 4.4Final purchases 5.1 4.9 3.5 .5 1.0 -.5 1.9 3.5
Private 6.0 5.6 4.0 .0 1.0 -1.0 1.9 3.8Excluding net exports 6.5 5.5 2.9 -1.1 1.8 -.1 2.8 3.8
Personal consumption expenditures 5.0 4.5 2.7 .3 1.8 1.0 2.8 3.4Goods 5.1 4.2 1.9 -1.5 1.9 .3 3.3 3.4Services 4.9 4.8 3.7 2.4 1.7 1.8 2.2 3.3
Gross private domestic investment 16.1 10.5 -.2 -11.8 8.3 -12.8 7.6 12.6Residential structures 18.6 2.8 -5.3 -20.1 -4.9 -10.2 32.2 11.4Business fixed investment 11.7 12.8 7.3 -2.2 3.6 -3.7 -4.3 3.8
Gov't. purchases of goods and services 1.5 2.0 1.3 2.3 .9 1.5 2.0 1.9Federal 3.7 -.1 1.8 4.3 3.7 5.4 4.3 2.8National defense .8 .4 2.6 4.0 4.9 6.9 9.4 7.4State and local .2 3.3 1.1 1.1 -.8 -1.0 .4 1.3
Disposable personal income 4.0 4.9 2.7 .2 2.5 1.1 2.2 3.2
Current Dollars
Gross national product 11.7 12.8 11.7 8.9 11.6 4.1 6.6 8.0Final purchases 11.1 12.8 12.4 10.0 10.4 5.7 5.9 6.9
Private 11.7 13.6 13.1 9.1 10.2 5.0 5.4 7.1Excluding net exports 13.2 13.4 12.3 8.5 10.3 5.3 6.6 7.8
Personal consumption expenditures 11.1 11.8 11.9 10.6 10.6 6.9 7.0 7.5Goods 9.8 10.9 11.7 8.8 9.5 3.7 5.1 6.8Services 12.7 12.9 12.2 12.8 11.7 10.5 9.0 8.3
Gross private domestic investment 25.7 19.3 9.4 -4.9 17.2 -10.9 10.4 16.4Residential structures 33.1 16.1 6.6 -13.0 1.7 -8.3 34.0 15.9Business fixed investment 17.9 21.3 16.6 6.5 12.0 .5 -3.0 6.5
Gov't. purchases of goods and services 8.8 9.7 9.8 13.5 10.9 8.5 7.6 6.5Federal 11.0 7.1 9.6 17.1 16.1 12.6 10.2 7.8
National defense 8.0 8.0 11.5 17.5 17.0 16.1 15.2 12.6State and local 7.5 11.2 9.9 11.5 7.9 5.8 5.9 5.6
Disposable personal income 10.0 12.2 12.0 10.5 11.2 7.1 6.4 7.4
Personal income 10.7 12.5 12.6 10.7 11.8 6.4 5.7 7.1Wage and salary disbursements 10.5 12.5 11.9 9.6 10.2 4.5 5.0 7.5
Corporate profits with I.V.A. and C.C.Adj. 21.1 15.0 1.3 -6.8 5.0 -15.3 23.2 15.2Corporate profits before tax 17.1 17.7 10.3 -4.0 -4.3 -24.3 5.7 7.3
Nonfarm payroll employment 3.9 5.1 3.6 .6 .8 -1.6 .0 3.0
Manufacturing 3.6 4.2 2.6 -3.6 -.6 -6.6 -1.2 6.5
Nonfarm business sectorOutput per hour 2.2 .6 -1.3 -.9 1.4 .1 3.0 1.7
Compensation per hour 7.5 8.6 9.3 10.2 9.7 7.2 5.2 4.6Unit labor costs 5.2 8.0 10.7 11.2 8.1 7.1 2.2 2.9
GNP implicit deflator 5.8 7.4 8.6 9.3 9.4 6.0 4.0 3.4Gross domestic business product
fixed-weighted price index <1> 6.1 8.0 9.9 10.1 9.6 5.9 3.9 3.8
Excluding food and energy 6.3 7.8 8.6 8.6 9.4 6.9 4.6 3.7
Consumer price index (all urban) 6.5 7.7 11.3 13.5 10.3 6.2 3.3 4.1
Industrial production 5.9 5.8 4.4 -3.6 2.6 -8.1 1.9 7.4
----------------------> Uses expenditures in 1972 as ------eights.---(1> Uses expenditures in 1972 as weights.

March 23, 1983FEDERAL SECTOR ACCOUNTS
I FRB Staff EstimatesFiscal FY1983 FT1984e CT198/ Calendar quartersa unadjusted data
Year Admln. F.R. Admin. F.R. CY F.R. 1982 1983 19841982* 1/ Board 1/ Board 1982* Board III* IV* I II III IV I II III
Unified budget receipts 617.8 597.5 599.4 659.7 650.6 608.8 604.9 149.3 137.0 139.7 170.9 151.8 142.5 151.9 187.8 168.4Unified budget outlays 728.4 805.2 800.8 848.5 849.1 739.5 807.7 185.5 205.3 197.9 196.9 200.7 212.2 210.6 222.9 203.3
Surplus/deficit(-), unified budget -110.6 -207.7 -201.4 -188.8 -198.5 -130.7 -202.8 -36.2 -68.3 -58.2 -26.0 -48.9 -69.7 -58.7 -35.1 -34.9
Surplus/deficit(-), off-budgetagencies
2 -17.3 -17.0 -16.0 -14.0 -15.1 -14.9 -17.3 -6.0 -1.1 -2.7 -5.7 -6.5 -2.4 -3.3 -4.3 -5.0
Combined deficit to be financed -127.9 -224.8 -217.4 -202.8 -213.6 -145.6 -220.1 -42.3 -69.4 -60.9 -31.7 -55.4 -72.1 -62.0 -39.4 -39.9
Means of financing combined deficit:Net borrowing from public 134.9 215.0 210.6 203.0 212.2 161.3 208.6 57.5 62.0 53.8 38.6 56.2 60.0 62.7 48.6 40.9Decrease in cash operating balance -10.7 9.4 11.3 0.0 -2.4 -7.8 7.3 -18.4 9.6 5.3 -7.6 4.0 5.6 2.5 -5.3 -5.2Otber
3 3.8 0.4 -4.5 -0.2 3.8 -7.9 4.2 3.2 -2.2 1.8 0.7 -4.8 6.5 -3.1 -3.8 4.2
Cash operating balance, end of period 29.4 20.0 18.1 20.0 20.5 19.8 12.5 29.4 19.8 14.5 22.1 18.1 12.5 10.0 15.3 20.5
Meos Sponeored agency borrowing4
20.3 18.2 5.5 21.2 20.2 16.9 10.1 5.8 -0.4 -2.8 4.1 4.6 4.2 4.0 6.0 6.0
NIA SudgetSeasonally adjusted annual rates
Receipts 618.2 627.9 633.2 685.6 682.5 614.2 642.2 613.7 616.1 629.8 644.8 642.1 652.3 677.9 691.9 707.8Expenditures 739.7 829.0 824.3 877.3 878.5 763.4 833.8 769.7 819.2 814.2 822.3 84).6 857.2 874.9 884.4 897.4
Purchases 250.1 279.0 280.2 302.5 300.8 257.9 284.3 259.0 278.7 279.5 276.9 285.7 295.0 298.4 302.4 307.2
Defense 173.0 199.4 198.8 229.0 225.7 178.6 205.8 182.7 189.3 194.0 201.8 209.9 217.6 223.5 228.5 233.3Nondefenee 77.1 79.6 81.4 73.5 75.0 79.3 78.5 76.3 89.4 85.5 75.1 75.8 77.4 74.9 73.9 73.9
Al other expenditures 489.6 550.0 544.1 574.8 577.7 505.5 549.5 510.7 540.5 534.7 545.4 555.9 562.2 576.5 582.0 590.2
Surplus/deficit(-) -121.5 -201.1 -191.1 -191.7 -196.0 -149.3 -191.6 -156.0 -203.1 -184.4 -177.5 -199.5 -204.9 -197.0 -192.6 -189.6
High Employment (H.1.) surplus/deficit(-)evaluated at H.E. unemployment rate of:
5.1 percent -18.8 n.e. -47.7 n.a. -50.6 -29.4 -47.4 -32.7 -63.2 -41.1 -31.3 -55.4 -61.9 -53.4 -51.1 -52.26.1 percent -43.0 an.. -73.6 n.a. -83.6 -54.2 -73.9 -57.5 -88.3 -66.7 -57.5 -82.0 -89.3 -82.0 -80.6 -82.7
*-actual s-eatimated n.a.-not available
1. The Budget of the United States Government Fiscal Year 1984, January 1983.2. Includes Federal Financing Bank, Postal Service Fund, Rural Electrification
and Telephone Revolving Fund, Rural Telephone Bank and (beginning in FY1982) theStrategic Petroleum Reserve.3. Checks issued less checks paid, accrued items and other transactions.
NOTE: Quarterly figures may not add to yearly totals due to rounding.
4. RB ataff estimates and actuals include Federal Home Loan Banks, FPlMC(excluding participation rtificates), FMA (excluding mortgage backedsecurities), Federal Land Banks, Federal Intermediate Credit Banks forCooperatives, and Student Loan Marketing Association marketable debt on apayment basis. RB and Administration estimates are not strictly comparable.

DOMESTIC FINANCIAL DEVELOPMENTS
Recent developments. Growth in the monetary aggregates remained
strong in February and, for M1 and M2, was also apparently substantial in
March. The new money market deposit accounts (MMDAs) and super NOW ac-
counts continued to rise rapidly but, in both cases, some deceleration has
occurred, partly in response to the decline in offering rates to levels
closer to market rates. Growth of narrow money in February was at a 21-1/4
percent annual rate; M2 grew at a 23-3/4 percent annual rate, down moder-
ately from the January pace. The velocities of both M1 and M2 appear to
have declined in the first quarter at rates unusual under prevailing eco-
nomic circumstances.
Despite sizable runoffs in large time deposits and institution-only
money market mutual funds, M3 grew at a 13-1/4 percent annual rate in
February. It is likely, however, that this growth slowed substantially
in March. For the banking sector, growth of core deposits remained large
through February as the surge of MMDAs and growth in transaction deposits
substantially outweighed the runoff of savings and small time deposits.
For the period November to February, which embraces the introduction of
the new accounts, the difference between core deposit growth and the draw-
down of savings and small time deposits was composed, in about equal pro-
portions, of a reduction in large time deposits, on the one hand, and
increases in bank holdings of Treasury securities and advances of funds to
foreign branches, on the other. Similarly, thrift institutions reduced
their managed liabilities and increased their liquid assets.
The strengthening of economic activity in the first quarter appears
to have boosted business profits, while funding needs were curtailed by
I-16

I-17
continued inventory liquidation and anemic fixed investment spending.
External financing by nonfinancial firms seems to have remained close to
the reduced pace of the fourth quarter of 1982. The composition of long-
term financing shifted as gross issuance of corporate bonds fell well
below the large volume of late last year, while firms took advantage of
the rise in stock prices to increase issuance of equities. Short-term
business credit expanded a bit in February as commercial paper and commer-
cial bank loans rose slightly but, for the quarter as a whole, short-term
borrowing probably remained weak.
Credit flows to the household sector picked up substantially around
the turn of the year but it is difficult to assess the extent to which
that strength has been sustained. Consumer installment credit outstanding
accelerated in January but in February bank loans to consumers were flat,
and there is currently little sign of any pickup in March. In the mort-
gage market, new loan commitments at savings and loan associations appear
to be remaining near the higher rate achieved at the end of last year.
Some of this activity reflects refinancing of existing mortgages, as aver-
age interest rates have declined further, but the rise in housing starts
and sales is associated with an upturn in net new mortgage lending as well.
Nevertheless, with the pace of economic activity still near recession
lows, public sector demands for credit remain the dominant factor in credit
markets. The Treasury has raised a massive amount of new funds in the
first quarter, with marketable borrowing from the public totaling almost
$55 billion. Although state and local sector borrowing in the bond market
receded from the fourth quarter pace, issuance in the first quarter has
remained strong.

I-18
Despite the rapid growth of the monetary aggregates and the large
borrowing needs by the public sector, credit markets rallied early in the
intermeeting period in response to the Humphrey-Hawkins report. The com-
mercial bank prime rate was lowered by another one-half point. Declines
in key short-term market rates were erased later in the intermeeting peri-
od as market participants became concerned once again that growth in the
aggregates would, at the least, forestall further easing by the System.
However, long-term rates, on balance, remain below their levels at the
time of the last FOMC meeting, reflecting the oil price declines and other
favorable inflation developments.
Outlook. It is likely that the pattern of financing requirements
that emerged during the first quarter of the year will continue to prevail
through midyear with governmental borrowing looming large in aggregate
credit flows. Net borrowing by the nonfinancial business sector is likely
to rise somewhat as inventory liquidation ends, but rising profits should
hold down external financing requirements. In the household sector, the
more rapid pace of new housing construction and house sales will bolster
the demand for mortgage credit, while a shift from "creative financing" to
more conventional mortgage financing patterns can be expected to expand
activity by traditional mortgage lending institutions. Near-term growth
in consumer credit, however, is likely to be small owing to the sluggish
recovery in spending for consumer durables.
In contrast, the Treasury is expected to borrow about $40 billion
in credit markets in the second quarter--a sharp divergence from its usual
seasonal pattern as spring tax collections are reduced by last year's
reduction in tax rates and other provisions of the 1981 tax bill. The

I-19
pace of borrowing in the municipal bond market will probably also continue
strong in coming months.
On balance, credit demands and supplies seem consistent with general
stability of short-term interest rates near their present levels, although
some transitory movements can be expected as attention remains focused on
growth in the monetary aggregates. The intermediate- and longer-term sec-
tors of debt markets should be buoyed by continued good news on inflation
and improvements in inflation expectations. Likely slow progress by the
Congress in resolving major budget issues may, however, impose limits on
these security price gains.

INTERNATIONAL DEVELOPMENTS
Recent developments. Since the February FOMC meeting the
dollar's weighted average exchange value has shown a slight appreciation,
on balance. It declined marginally early in the period, then turned
around after mid-February as a series of oil price cuts and a protracted,
disorderly negotiation within OPEC raised fears about the worsening debt
situation of oil-producing LDCs. Late in the period actual and expected
increases in short-term dollar interest rates, together with declines in
official rates in several European countries, helped to strengthen the
dollar further.
Much of the focus of exchange market participants during the period
was not on dollar exchange rates, but on cross-rates among EMS member
currencies. After the early March elections in Germany and France,
speculation on an EMS realignment intensified, culminating in the
March 21 announcement of a 5-1/2 percent revaluation of the mark, a 2-1/2
percent devaluation of the French franc, and a 1-1/2 percent revaluation
of the Belgian franc. (All other EMS currencies' parities were also
changed.)
. The
Bank of France had operated in the Euro-French franc deposit market to
drive very short-term rates to astronomical heights, while the Belgians
had raised official lending rates by 2-1/2 percentage points and imposed
new exchange controls. On the other hand, Germany announced on March 17
a 1 percentage point reduction in its official lending rates. The
Netherlands, Switzerland, and Austria followed with reductions of central
I-20
I-21
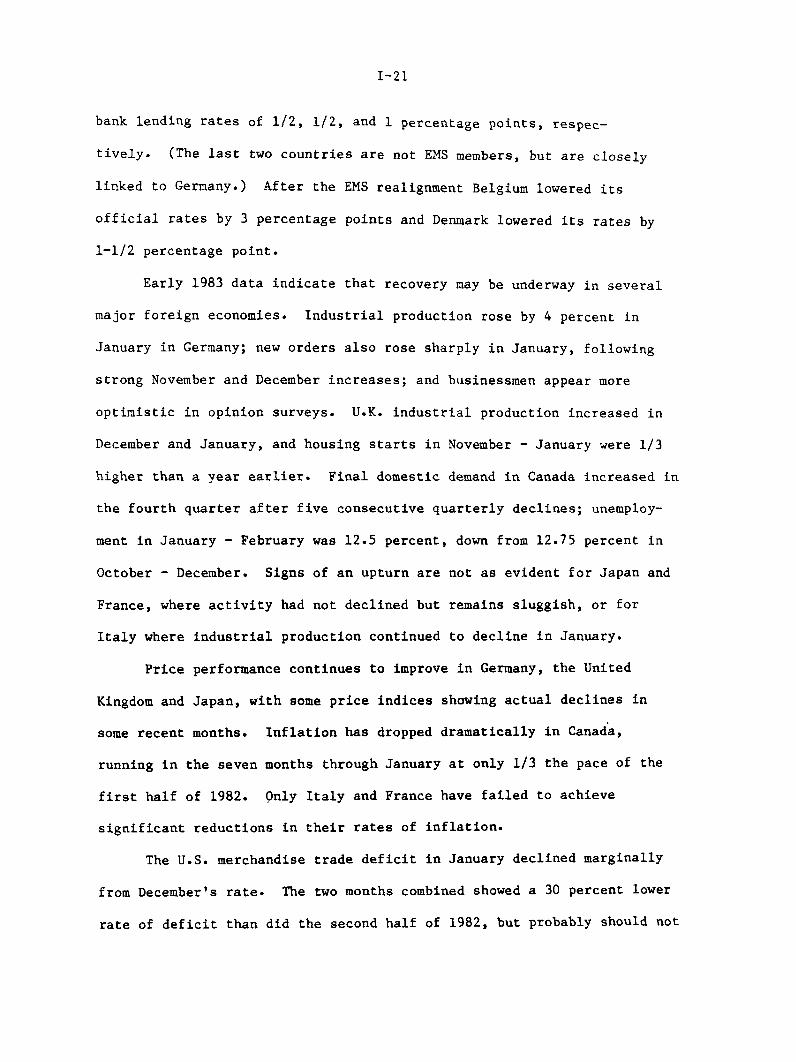
bank lending rates of 1/2, 1/2, and 1 percentage points, respec-
tively. (The last two countries are not EMS members, but are closely
linked to Germany.) After the EMS realignment Belgium lowered its
official rates by 3 percentage points and Denmark lowered its rates by
1-1/2 percentage point.
Early 1983 data indicate that recovery may be underway in several
major foreign economies. Industrial production rose by 4 percent in
January in Germany; new orders also rose sharply in January, following
strong November and December increases; and businessmen appear more
optimistic in opinion surveys. U.K. industrial production increased in
December and January, and housing starts in November - January were 1/3
higher than a year earlier. Final domestic demand in Canada increased in
the fourth quarter after five consecutive quarterly declines; unemploy-
ment in January - February was 12.5 percent, down from 12.75 percent in
October - December. Signs of an upturn are not as evident for Japan and
France, where activity had not declined but remains sluggish, or for
Italy where industrial production continued to decline in January.
Price performance continues to improve in Germany, the United
Kingdom and Japan, with some price indices showing actual declines in
some recent months. Inflation has dropped dramatically in Canada,
running in the seven months through January at only 1/3 the pace of the
first half of 1982. Only Italy and France have failed to achieve
significant reductions in their rates of inflation.
The U.S. merchandise trade deficit in January declined marginally
from December's rate. The two months combined showed a 30 percent lower
rate of deficit than did the second half of 1982, but probably should not

I-22
be viewed as establishing a new trend. Both exports and imports
increased in January, but much of the increase in exports was concen-
trated in wheat, civilian aircraft, and petroleum products, all of which
were affected by special, temporary factors. Oil imports fell in January
to 4.4 million barrels per day, considerably below the 5.5 mbd in the
fourth quarter of 1982, and the lowest rate since last May. Oil import
prices declined to an average $30.48 per barrel, but largely did not
reflect price declines since early 1983. Imports of manufactured goods
were sharply higher in January, but these tend to be quite erratic on a
monthly basis and for December - January combined were lower than during
much of 1982.
In the U.S. international capital accounts there continued to be
net outflows of banking funds through early March. U.S. banking offices
added to their net advances to foreign offices, in part reflecting the
effects of inflows of funds into MMDAs at U.S. banking offices, discussed
in the last Greenbook. Foreign net purchases of U.S. corporate stocks
were sizable in December and January, totaling about $2 billion for the
two months combined. Public issues of bonds by U.S. corporations in
foreign and international markets remained strong in February and March.
Foreign lending by U.S.-chartered banks slowed dramatically further
in the second half of 1982. Claims, mainly interbank, on G-10 countries
and offshore banking centers actually declined by $2 billion in the
second half after increasing by $7 billion in the first. Claims on
non-OPEC developing countries increased by only $3 billion in the second
half, with those on Latin America rising by only $1 billion. (There was
an actual decline in claims on Latin America in the fourth quarter.)

I-23
Recently signed loans for Mexico, Brazil, and Argentina will tend to
raise bank claims on Latin America in 1983, but banks are likely to try
to reduce exposures in that area wherever feasible.
Outlook. After declining somewhat in 1982, fourth quarter to
fourth quarter, economic activity in major foreign industrial economies
as a group seems to be picking up, and we have revised upward slightly
our 1983 growth rate projection, to just over 2 percent. The staff's
inflation forecast for foreign countries now is for a significant further
improvement in 1983 and 1984. With growth in major foreign countries
projected at substantially less than in the United States, with many
developing countries tightly constrained by their external financing
difficulties, and reflecting the past (and continuing) strength of the
dollar, we are projecting 1983 U.S. trade and current account deficits of
about $65 and $35 billion, respectively, which we expect will widen sub-
stantially in 1984. These are essentially unchanged from the last
Greenbook -- the influence of slightly lower oil prices is about offset
by the effects of a higher projected path for the dollar's exchange
value. The current exchange rate forecast alters the timing of the
dollar's projected depreciation, in light of the strength of the dollar
during the first quarter, the somewhat lower U.S. current account deficit
now expected in the first half of this year, and the relative firmness of
dollar interest rates. Most of the dollar's projected decline is now
expected to occur in the second half of 1983 and into 1984.

CONFIDENTIAL (FR)CLASS II FOMC
March 23, 1983
OUTLOOK FOR U.S. NET EXPORTS AND RELATED ITEMS
(BILLIONS OF DOLLARS, SEASONALLY ADJUSTED ANNUAL RATES)
1982 1983-P 1984-PANN. ANN. ANN.
1. GNP NET EXPORTS
CURRENT $, NET
EXPORTS OF G+S
IMPORTS OF G+S
CONSTANT 72 $, NET
EXPORTS OF G+S
IMPORTS OF C+S
TERMS OF TRADE (1972-100) 1/
2. U.S. MERCHANDISE TRADE BALANCE 2/
EXPORTS (EXCL. MILITARY)AGRICULTURALNONAGRICULTURAL
IMPORTS
PETROLEUM AND PRODUCTSNONPETROLEUM
3. U.S. CURRENT ACCOUNT BALANCE
OF WHICH:FET INVESTMENT INCOME
4. FOREIGN OUTLOOK - TEN INDUSTRIALCOUNTRIES 3/
REAL GNP, Z CHANCE, ANNUALRATES
CONSUMER PRICES, 2 CHANCE,ANNUAL RATES
20.5350.8330.3
31.8148.1116.3
83.4
-7.8332.8340.7
21.9138.1116.2
82.3
-27.2378.4405.6
23.7149.3125.6
78.5
7.0349.5342.5
27.5147.5120.0
83.0
9.0328.1319.1
27.2138.8111.6
82.7
1983-P 1983-P 1983-P 1983-PQ1 02 Q3 Q4
13.6328.8315.2
27.2138.3111.1
83.8
-2.1326.0328.1
21.7136.1114.4
83.5
-17.3333.0350.3
19.1137.7118.5
81.9
-25.6343.5369.0
19.6140.3120.7
80.1
1984-P 1984-P 1984-P 1984-p
Ql Q2 Q3 04
-30.4353.9384.3
19.9142.7122.8
79.3
-30.2368.5398.7
21.3146.5125.2
79.0
-25.8386.1412.0
24.9151.4126.5
78.3
-22.5404.9427.4
28.5156.5128.0
77.5
-36.3 -63.8 -88.9 -50.0 -48.5 -43.1 -56.5 -72.8 -82.9 -88.3 -88.8 -89.1 -89.3
211.0 193.3 219.8 209.3 192.3 192.9 190.4 192.4 197.4 204.0 213.2 224.3 237.737.4 35.8 38.5 33.6 32.3 34.4 35.7 36.2 36.8 37.4 38.2 38.9 39.7173.6 157.5 181.3 175.8 160.0 158.5 154.7 156.3 160.6 166.6 175.0 185.4 198.0
247.3 257.1 308.7 259.3 240.8 235.9 246.8 265.3 280.4 292.3 302.0 313.4 327.061.2 58.8 69.9 65.8 62.8 53.5 54.1 61.2 66.4 68.1 68.5 70.0 73.2186.1 198.3 238.7 193.5 178.0 182.4 192.8 204.1 213.9 224.1 233.6 243.4 253.8
-8.1 -35.9 -59.4 -20.9 -24.4 -15.8 -29.2 -44.7 -54.0 -61.1 -62.2 -58.3 -56.0
28.7 28.7 31.4 28.3 28.3 28.7 27.4 28.7 30.0 28.9 28.5 32.7 35.3
0 1.4 2.8 -2.1 1.4 2.2 2.1 1.7 2.8 3.2 3.0 3.0 3.5
8.1 6.1 5.7 6.0 6.0 5,9 6.0 5.8 5.8 5.7 5.6 5.4 5.3
1/ CNP EXPORT IMPLICIT DEFLATOR DIVIDED BY GNP IMPORT IMPLICIT DEFLATOR2/ INTERNATIONAL ACCOUNTS BASIS3/ GEOMETRIC WEIGHTS USED-TO AGGREGATE FOREIGN REAL GCP AND CONSUMER PRICES- PERCENT SHARE IN TEN-COUNTRY TOTAL MULTILATERAL TRADE.GERMANY (20.82), JAPAN (13.67). FRANCE (13.12), UNITED KINGDOM (11 .S)CAKADA(9.1%), ITALY (9.0%), THE NET1FRLANDS (8.3%), BELGIUM (6.47)SWEDEN (4.2%), SWITZERLAhn (3.62)
P/ PROJECTED