fomc 19800205 g bpt 119800130
TRANSCRIPT
Prefatory Note
The attached document represents the most complete and accurate version available based on original copies culled from the files of the FOMC Secretariat at the Board of Governors of the Federal Reserve System. This electronic document was created through a comprehensive digitization process which included identifying the best-preserved paper copies, scanning those copies,1 and then making the scanned versions text-searchable.2 Though a stringent quality assurance process was employed, some imperfections may remain.
Please note that this document may contain occasional gaps in the text. These gaps are the result of a redaction process that removed information obtained on a confidential basis. All redacted passages are exempt from disclosure under applicable provisions of the Freedom of Information Act.
1 In some cases, original copies needed to be photocopied before being scanned into electronic format. All scanned images were deskewed (to remove the effects of printer- and scanner-introduced tilting) and lightly cleaned (to remove dark spots caused by staple holes, hole punches, and other blemishes caused after initial printing). 2 A two-step process was used. An advanced optimal character recognition computer program (OCR) first created electronic text from the document image. Where the OCR results were inconclusive, staff checked and corrected the text as necessary. Please note that the numbers and text in charts and tables were not reliably recognized by the OCR process and were not checked or corrected by staff.

CONFIDENTIAL (FR)
January 30, 1980
SUMMARY AND OUTLOOK
By the StaffBoard of Governors
of the Federal Reserve System
Confidential (FR) Class II FOMC
SUMMARY AND OUTLOOK
Prepared for the Federal Open Market Committee
By the staff of the Board of Governors of the Federal Reserve System

DOMESTIC NONFINANCIAL DEVELOPMENTS
Summary
Economic activity apparently continued to move upward at a slug-
gish pace as 1979 drew to a close. Upward price pressures, however,
intensified. There are as yet no major economic indicators available
for January.
Industrial production increased 0.3 percent in December, about
offsetting the declines of the previous two months. Production of
business equipment and nondurable goods rose, but output of motor vehi-
cles and parts continued to decline leaving the year-end level of this
output about 25 percent below that of December 1978. Auto assemblies
were at an annual rate of 6.8 million units in December, and they appear
to be running at about a 6 million rate in January, considerably less
than the recent rate of sales.
The rise in industrial production during December was accompanied
by an increase in manufacturing employment of 110,000, with gains fairly
widespread. This followed four months of decline, but still left
factory employment below its peak level of last July. The factory
workweek rose 0.2 hour to 40.3 hours. Hiring in the service-producing
industries continued at about the strong pace of previous months. The
unemployment rate edged up to 5.9 percent, thus remaining within the
narrow range that has prevailed during the last 18 months. A report on
January employment will be included in the Greenbook Supplement.
Retail sales in nominal terms are indicated to have increased in
November and December, after falling in October. For the quarter as a
whole, retail sales are estimated to have edged down when measured in
I-1

I-2
constant dollars. While consumer buying has been robust for nondurable
goods and also for services--an item not reported in retail sales--
purchases of durable goods weakened in the fourth quarter. This was
largely due to weakness in the automobile market. Sales of new autos
were at an annual rate of 9.8 million units in the fourth quarter, the
lowest since late 1975. Sales strengthened somewhat late in the quarter
both for domestic cars and imports, and sales of domestic cars remained
at this higher level early in 1980 under the continuing influence of
sales incentives.
Real disposable income is estimated to have been unchanged in
the fourth quarter, and thus the increase in real personal consumption
was associated with a decline in the saving rate to a historically low
level of 3.3 percent. This was the lowest rate since the Korean War,
and it appears to reflect efforts by households to maintain expected
living standards.
In real estate markets activity declined substantially. Private
housing starts were at a 1.5 million annual rate in December, virtually
unchanged from November, but down 16 percent from the pace during the
summer. Permits fell even more sharply than starts over the same time
period. Moreover, the total number of homes sold declined, and the rise
in prices of existing homes sold slowed considerably while average prices
of new homes sold actually showed a decline.
Business fixed investment expenditures, in constant dollars, fell
at an annual rate of 7 percent in the fourth quarter; to some extent
this decline reflects weaker motor vehicle purchases by businesses and
strike activity at some makers of durable equipment. Orders for

I-3
nondefense capital goods rose appreciably in the fourth quarter, but
remained below their level during the first quarter. The sharp rise in
orders in December was concentrated among aircraft and parts. The
Commerce Department's December survey of planned capital spending indi-
cates a nominal increase of 10.9 percent in 1980, compared with the 14.7
percent rise now estimated for 1979. Given expectations of inflation,
the survey implies an increase in real terms in 1980 of only one per-
cent. However, in the past the survey has overstated spending in re-
cession years.
Inventory investment has shown a tendency to moderate since early
summer. Stocks of autos have generally declined since July and most
trade establishments have continued conservative inventory policies.
At manufacturers, there was a sizable inventory increase at producers
of aircraft and missiles during the last several months.
Consumer prices increased more rapidly in December than in other
recent months, with the acceleration primarily attributable to a spurt
in food and energy prices. Over the year, the CPI rose 13.3 percent,
a marked speedup from the 9 percent rise during 1978. The major part
of this difference was accounted for by the faster rise of energy prices
and homeownership costs as measured in the CPI. However, there was also
some acceleration in prices outside these sectors.
Outlook
For the current quarter, the staff projects a slight reduction in
real GNP, of perhaps 1 percent at an annual rate. In the last Greenbook
the staff had projected a sharper downward adjustment, and this month's
upward revision is based partly on stronger-than-expected recent data on
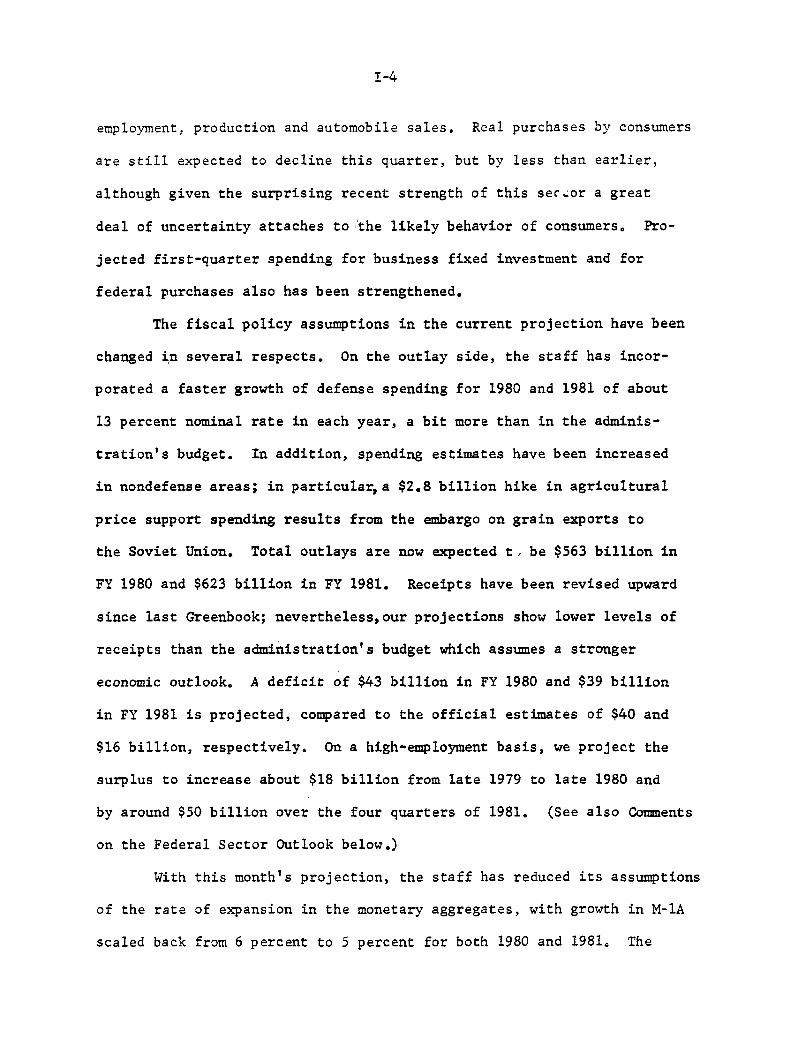
employment, production and automobile sales. Real purchases by consumers
are still expected to decline this quarter, but by less than earlier,
although given the surprising recent strength of this sector a great
deal of uncertainty attaches to the likely behavior of consumers. Pro-
jected first-quarter spending for business fixed investment and for
federal purchases also has been strengthened.
The fiscal policy assumptions in the current projection have been
changed in several respects. On the outlay side, the staff has incor-
porated a faster growth of defense spending for 1980 and 1981 of about
13 percent nominal rate in each year, a bit more than in the adminis-
tration's budget. In addition, spending estimates have been increased
in nondefense areas; in particular, a $2.8 billion hike in agricultural
price support spending results from the embargo on grain exports to
the Soviet Union. Total outlays are now expected to be $563 billion in
FY 1980 and $623 billion in FY 1981. Receipts have been revised upward
since last Greenbook; nevertheless,our projections show lower levels of
receipts than the administration's budget which assumes a stronger
economic outlook. A deficit of $43 billion in FY 1980 and $39 billion
in FY 1981 is projected, compared to the official estimates of $40 and
$16 billion, respectively. On a high-employment basis, we project the
surplus to increase about $18 billion from late 1979 to late 1980 and
by around $50 billion over the four quarters of 1981. (See also Comments
on the Federal Sector Outlook below.)
With this month's projection, the staff has reduced its assumptions
of the rate of expansion in the monetary aggregates, with growth in M-1A
scaled back from 6 percent to 5 percent for both 1980 and 1981. The

assumption of slower growth in money, given the staff's GNP projection,
results in a higher level of projected interest rates. Nevertheless,
rates are still expected to move slowly downward during 1980.
A number of key factors continue to point toward the probability
of a recession during 1980, including the transfer of household pur-
chasing power to OPEC, probable efforts by households to increase their
saving rates from current extremely low levels, credit restraint--
especially in the housing sector--and the dampening effect of excess
productive capacity on investment spending. Over the four quarters of
1980, the staff projects a decline in GNP of around 2-1/4 percent, about
the same as the projection in the last Greenbook. A relatively mild
decline in economic activity now is expected during the first half of
this year, as consumer outlays are expected to soften gradually, buoyed
in part by larger-than-usual tax refunds. However, greater weakness
is expected in the second half of the year and the trough of the re-
cession is tentatively projected in early 1981.
A sluggish recovery is projected to begin around midyear 1981.
By that time housing activity should benefit from a slight easing in
mortgage rates--permitting underlying strength of demand to emerge--and
consumption should again begin to keep pace with income gains following
a gradual rise in saving rates into the 5 percent area. But with both
fiscal and monetary policy continuing restrictive, real GNP is projected
to increase only slightly during the four quarters of 1981, by less
than 1 percent.

I-6
The contraction in labor demand associated with these projected
developments is expected to lift the unemployment rate to almost 8 per-
cent by late 1980 and about 8-3/4 percent by late 1981.
Pressures on wages and hourly compensation are still expected to
be intense in 1980, as the effects of a weakening labor market are off-
set by attempts to recover past losses in real wages. With productivity
performance expected to remain poor in the near term, a rapid further
rise in unit labor costs will persist in 1980. The inflation rate, as
measured by the fixed-weighted price index for gross domestic business
product, is projected to accelerate in the first half of the year to
almost 10-1/2 percent. As slack in labor and product markets grows,
wage and price increases can be expected to moderate, although additional
payroll taxes scheduled for early 1981 will limit the deceleration.
Inflation rates of about 9 percent are projected for late 1980 and
around 8 percent toward the end of 1981.
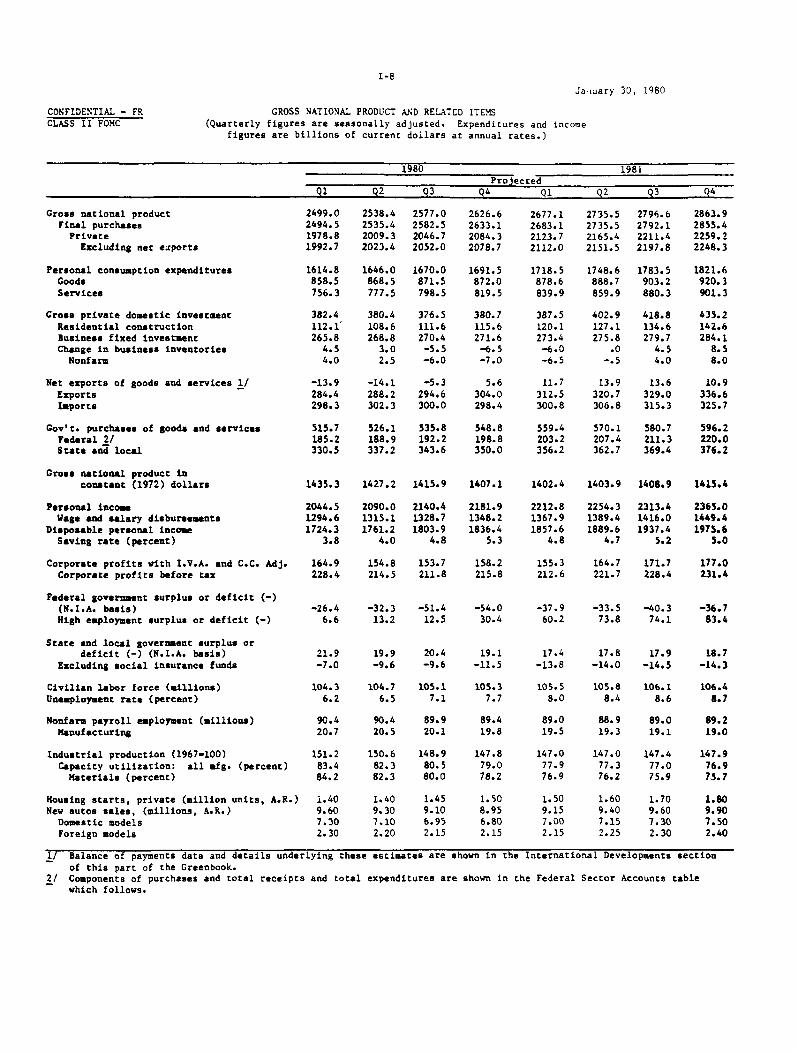
Detailed data for these projections are shown in the tables that
follow.

STAFF GNP PROJECTIONS
Percent changes, annual rateGross domesticbusiness productfixed-weighted
price index UnemploymentExcluding food rate
Nominal GNP Real GNP Total and energy (percent)1/3/80 1/30/80 1/3/80 1/30/80 1/3/80 1/30/80 1/3/80 1/30/80 1/3/80 1/30/80
Annual changes:1978 1/1979 1/19801981
12.0 12.011.4 11.37.8 8.19.3 8.1
Quarterly changes:1979-Q1 1/ 10.61979-Q2 1/ 6.71979-Q3 1/ 12.01979-Q4 1/ 10.7
1980-Q1 4.71980-Q2 6.01980-Q3 8.01980-Q4 9.4
1981-Q11981-Q21981-Q31981-Q4
9.510.010.010.8
Two-quarter changes:1979-Q4 1/ 11.41980-Q2 5.41980-Q4 8.71981-Q2 9.81981-Q4 10.4
3/Four-quarter changes:1978-Q4 1/ 13.41979-Q4 1/ 10.01980-Q4 7.01981-Q4 10.1
10.66.7
11.910.3
7.26.56.27.9
7.99.09.2
10.0
11.16.87.18.59.6
13.49.97.09.0
Actual.Percent change from two quarters earlier.Percent change from four quarters earlier.
4.42.3
-1.3.2
1.1-2.3
3.11.5
-3.7-3.4-1.6
-. 3
.41.21.62.0
2.3-3.5-1.0
.81.8
4.8.9
-2.31.3
4.42.3-. 7
-1.0
1.1-2.3
3.11.4
-. 8-2.2-3.1-2.4
-1.3.4
1.41.9
2.3-1.5-2.8
-. 51.6
4.8.8
-2.2.6
7.69.7
10.29.1
10.010.110.4
9.6
10.511.0
9.59.3
9.38.98.38.3
9.910.7
9.49.18.2
8.610.010.0
8.7
7.69.6
10.08.9
10.010.110.4
9.2
10.310.5
9.89.2
9.08.58.07.9
9.710.4
9.58.78.0
8.69.99.98.3
-
J
January 30, 1980
CONFIDENTIAL - FRCLASS II FOMC
GROSS NATIONAL PRODUCT AND RELATED ITEMS(Quarterly figures are seasonally adjusted.
figures are billions of current dollarsExpenditures and income
at annual rates.)
1980 1981
ProjectedQ1 Q2 Q3 Q4Q 1 Q2 Q3 Q4
Gross national productFinal purchasesPrivate
Excluding net exports
Personal consumption expendituresGoodsServices
Gross private domestic investmentResidential constructionBusiness fixed investmentChange in business inventories
Nonfarm
Net exports of goods and services 1/ExportsImports
Gov't. purchases of goods and servicesFederal 2/State and local
Gross national product inconstant (1972) dollars
Personal incomeWage and salary disbursements
Disposable personal incomeSaving rate (percent)
Corporate profits with I.V.A. and C.C. Adj.Corporate profits before tax
Federal government surplus or deficit (-)(N.I.A. basis)High employment surplus or deficit (-)
State and local government surplus ordeficit (-) (N.I.A. basis)
Excluding social insurance funds
Civilian labor force (millions)Unemployment rate (percent)
Nonfarm payroll employment (millions)Manufacturing
Industrial production (1967-100)Capacity utilization: all mfg. (percent)Materials (percent)
Housing starts, private (million units, A.R.)New autos sales, (millions, A.R.)
Domestic modelsForeign models
2499.02494.51978.81992.7
1614.8858.5756.3
382.4112.1'265.8
4.54.0
-13.9284.4298.3
2538.42535.42009.32023.4
1646.0868.5777.5
380.4108.6268.83.02.5
-14.1288.2302.3
2577.02582.52046.72052.0
1670.0871.5798.5
376.5111.6270.4-5.5
-6.0
-5.3294.6300.0
2626.62633.12084.32078.7
1691.5872.0819.5
380.7115.6271.6-6.5-7.0
5.6304.0298.4
2677.12683.12123.72112.0
1718.5878.6839.9
387.5120.1273.4
-6.0-6.5
11.7312.5300.8
2735.52735.52165.42151.5
1748.6888.7859.9
402.9127.1275.8
.0-. 5
13.9320.7306.8
2796.62792.12211.42197.8
1783.5903.2880.3
418.8134.6279.7
4.54.0
13.6329.0315.3
2863.92855.42259.22248.3
1821.6920.3901.3
435.2142.6284.1
8.58.0
10.9336.6325.7
515.7 526.1 535.8 548.8 559.4 570.1 580.7 596.2185.2 188.9 192.2 198.8 203.2 207.4 211.3 220.0330.5 337.2 343.6 350.0 356.2 362.7 369.4 376.2
1435.3 1427.2 1415.9 1407.1 1402.4 1403.9 1408.9 1415.4
2044.51294.61724.3
3.8
2090.01315.11761.2
4.0
2140.41328.71803.9
4.8
2181.91348.21836.4
5.3
2212.81367.91857.6
4.8
2254.31389.41889.6
4.7
2313.41416.01937.4
5.2
2365.01449.41975.6
5.0
164.9 154.8 153.7 158.2 155.3 164.7 171.7 177.0228.4 214.5 211.8 215.8 212.6 221.7 228.4 231.4
-26.4 -32.3 -51.4 -54.06.6 13.2 12.5 30.4
21.9 19.9 20.4 19.1-7.0 -9.6 -9.6 -11.5
-37.9 -33.5 -40.3 -36.760.2 73.8 74.1 83.4
17.4 17.8 17.9 18.7-13.8 -14.0 -14.5 -14.3
104.3 104.7 105.1 105.3 105.5 105.8 106.1 106.46.2 6.5 7.1 7.7 8.0 8.4 8.6 8.7
90.4 90.4 89.9 89.420.7 20.5 20.1 19.8
151.283.484.2
150.682.382.3
148.980.580.0
147.879.078.2
1.40 1.40 1.45 1.509.60 9.30 9.10 8.957.30 7.10 6.95 6.802.30 2.20 2.15 2.15
89.0 88.9 89.0 89.219.5 19.3 19.1 19.0
147.0
77.976.9
147.077.376.2
147.4
77.075.9
147.976.975.7
1.50 1.60 1.70 1.809.15 9.40 9.60 9.907.00 7.15 7.30 7.502.15 2.25 2.30 2.40
ion1/ Balance of payments data and details underlying these estimates are shown in the International Developments sectof this part of the Greenbook.
2/ Components of purchases and total receipts and total expenditures are shown in the Federal Sector Accounts tablewhich follows.

CONFIDENTIAL - FRCLASS II FOMC
PERCENT CHANGES IN GROSS NATIONAL PRODUCTAND RELATED ITEMS
(Annual rates compounded quarterly)
January 3, 1980
1980 1981Projected
Q1 Q2 Q3 Q4 Q1 Q2 Q3 Q4
Constant (1972) dollars
Gross national productFinal purchasesPrivate
Excluding net exports
Personal consumption expendituresGoodsServices
Gross private domestic investmentResidential structuresBusiness fixed investment
Gov't. purchases of goods and servicesFederalState and local
Disposable personal income
-.8 -2.2 -3.1 -2.4 -1.3 .4 1.4-.6 -2.0 -2.0 -2.3 -1.4 -.4 .8
-1.8 -2.7 -2.6 -2.7 -1.8 -.7 .8-2.9 -3.2 -3.2 -3.6 -2.3 -.9 .9
-2.0 -2.1 -3.0 -3.6 -2.3 -1.2 .4-5.4 -5.7 -7.1 -8.2 -5.3 -3.3 -.92.1 2.1 1.8 1.5 1.0 1.0 1.8
-8.7-19.6-2.0
-9.5-19.9
-3.8
4.7 .612.2 2.4
.5 -. 4
.1 -1.3
-11.9.9
-5.8
-4.7 -2.1 7.5 7.7 8.44.2 6.4 15.6 15.9 16.1
-6.3 -5.3 -4.0 -1.8 -. 6
.7 .72.8 2.9-. 5 -. 1
.7 -1.6 -4.0 -1.4 2.5 .4
Current dollars
Gross national productFinal purchases
PrivateExcluding net exports
Personal consumption expendituresGoodsServices
Gross private domestic investmentResidential structuresBusiness fixed investment
Gov't. purchases of goods and servicesFederalState and local
Disposable personal income
Personal incomeWage and salary disbursements
Corporate profits with IVA & C.C. Adj.Corporate profits before tax
Nonfarm payroll employmentManufacturing
Nonfarm business sector
Output per hourCompensation per hourUnit labor costs
6.5 6.26.7 7.66.3 7.66.3 5.8
7.9 7.98.1 7.87.6 7.85.3 6.6
9.0 9.28.0 8.58.1 8.87.7 8.9
10.09.48.99.5
9.0 8.0 6.0 5.2 6.5 7.2 8.25.8 4.7 1.4 .2 3.1 4.7 6.7
12.8 11.7 11.2 10.9 10.3 9.9 9.8
-. 9-11.6
7.1
-2.1-11.9
4.6
13.3 8.3 7.619.9 8.2 7.29.9 8.4 7.8
-4.0 4.5 7.3 16.9 16.7 16.611.5 15.1 16.5 25.4 25.8 26.02.4 1.8 2.7 3.6 5.8 6.4
10.1 8.014.5 9.2
7.7 7.3
7.9 7.68.5 7.77.5 7.6
11.117.5
7.6
11.3 8.8 10.0 7.4 4.7 7.1 10.5 8.1
9.1 9.2 10.0 8.0 5.8 7.7 10.9 9.27.9 6.5 4.2 6.0 6.0 6.4 7.9 9.8
-33.8 -22.3 -2.8 12.2 -7.1 26.5 18.1 12.9-30.1 -22.2 -4.9 7.8 -5.8 18.2 12.6 5.5
.9 .2 -2.1 -2.2 -1.7 -.6 .4 .9-3.8 -4.4 -6.2 -6.5 -6.1 -4.6 -3.5 -2.5
-.6 -1.2 .010.1 9.1 8.710.8 10.4 8.7
.2 .6 1.4 1.28.5 11.5 8.1 8.48.3 10.8 6.6 7.1
GNP implicit deflator 1/Gross domestic business product
fixed-weighted price index 2/Excluding food and energy
Consumer price index (all urban)
Industrial production
8.9 9.7 10.6
10.5 9.8 9.27.9 8.8 8.2
11.7 9.2 9.2
-2.3 -1.6 -4.4 -3.0 -2.2 .0 1.2 1.5
1/ Excluding Federal pay increases, the rates of change are: 1980-Q1, 8.19.3 percent; 1981-Q4, 7.3 percent.
2/ Uses expenditures in 1972 as weights.
percent; 1980-Q4, 10.0 percent; 1981-Q1,
CONFIDENTIAL - FRCLASS II FOMC
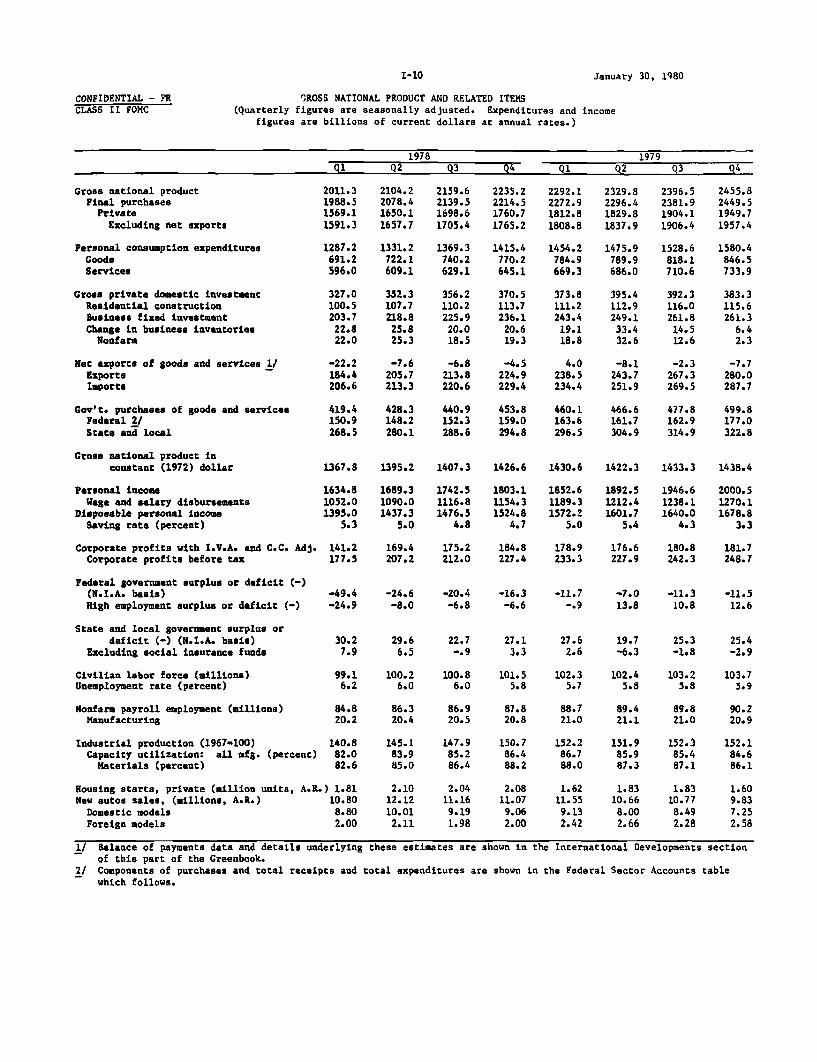
I-10 January 30, 1980
GROSS NATIONAL PRODUCT AND RELATED ITEMS(Quarterly figures are seasonally adjusted. Expenditures and income
figures are billions of current dollars at annual rates.)
1978 1979Q1 Q2 Q3 Q4 Q1 Q2 Q3 Q4
Gross national productFinal purchasesPrivate
Excluding net exports
Personal consumption expendituresGoodsServices
Gross private domestic investmentResidential constructionBusiness fixed investmentChange in business inventoriesNonfarm
Net exports of goods and services 1/ExportsImports
Gov't. purchases of goods and servicesFederal 2/State and local
Gross national product inconstant (1972) dollar
Personal incomeWage and salary disbursements
Disposable personal incomeSaving rate (percent)
2011.31988.51569.11591.3
1287.2691.2596.0
327.0100.5203.7
22.822.0
-22.2184.4206.6
419.4150.9268.5
2104.22078.41650.11657.7
1331.2722.1609.1
352.3107.7218.825.825.3
-7.6205.7213.3
428.3148.2280.1
2159.62139.51698.61705.4
1369.3740.2629.1
356.2110.2225.920.018.5
-6.8213.8220.6
440.9152.3288.6
2235.22214.51760.71765.2
1415.4770.2645.1
370.5113.7236.1
20.619.3
-4.5224.9229.4
453.8159.0294.8
2292.12272.91812.81808.8
1454.2784.9669.3
373.8111.2243.419.118.8
4.0238.5234.4
460.1163.6296.5
2329.82296.41829.81837.9
1475.9789.9686.0
395.4112.9249.133.432.6
-8.1243.7251.9
466.6161.7304.9
2396.52381.91904.11906.4
1528.6818.1710.6
392.3116.0261.814.512.6
-2.3267.3269.5
477.8162.9314.9
2455.82449.51949.71957.4
1580.4846.5733.9
383.3115.6261.36.42.3
-7.7280.0287.7
499.8177.0322.8
1367.8 1395.2 1407.3 1426.6 1430.6 1422.3 1433.3 1438.4
1634.81052.01395.0
5.3
Corporate profits with I.V.A. and C.C. Adj. 141.2Corporate profits before tax 177.5
1689.31090.01437.3
5.0
1742.51116.81476.5
4.8
1803.11154.31524.8
4.7
1852.61189.31572.2
5.0
1892.51212.41601.7
5.4
1946.61238.11640.0
4.3
2000.51270.11678.8
3.3
169.4 175.2 184.8 178.9 176.6 180.8 181.7207.2 212.0 227.4 233.3 227.9 242.3 248.7
Federal government surplus or deficit (-)(N.I.A. basis)High employment surplus or deficit (-)
State and local government surplus ordeficit (-) (N.I.A. basis)
Excluding social insurance funds
Civilian labor force (millions)Unemployment rate (percent)
Nonfarm payroll employment (millions)Manufacturing
Industrial production (1967-100)Capacity utilization: all mfg. (percent)Materials (percent)
-49.4 -24.6 -20.4 -16.3 -11.7 -7.0 -11.3 -11.5-24.9 -8.0 -6.8 -6.6 -.9 13.8 10.8 12.6
30.2 29.67.9 6.5
27.6 19.7 25.3 25.42.6 -6.3 -1.8 -2.9
99.1 100.2 100.8 101.5 102.3 102.4 103.2 103.76.2 6.0 6.0 5.8 5.7 5.8 5.8 5.9
84.8 86.3 86.9 87.8 88.7 89.4 89.8 90.220.2 20.4 20.5 20.8 21.0 21.1 21.0 20.9
140.882.082.6
Housing starts, private (million units, A.R.) 1.81New autos sales, (millions, A.R.) 10.80
Domestic models 8.80Foreign models 2.00
145.183.985.0
2.1012.1210.012.11
147.985.286.4
2.0411.169.191.98
150.786.488.2
2.0811.079.062.00
152.286.788.0
1.6211.559.132.42
151.985.987.3
1.8310.668.002.66
152.385.487.1
1.8310.778.492.28
152.184.686.1
1.609.837.252.58
1/ Balance of payments data and details underlying these estimates are shown in the International Developments sectionof this part of the Greenbook.
2/ Components of purchases and total receipts and total expenditures are shown in the Federal Sector Accounts tablewhich follows.
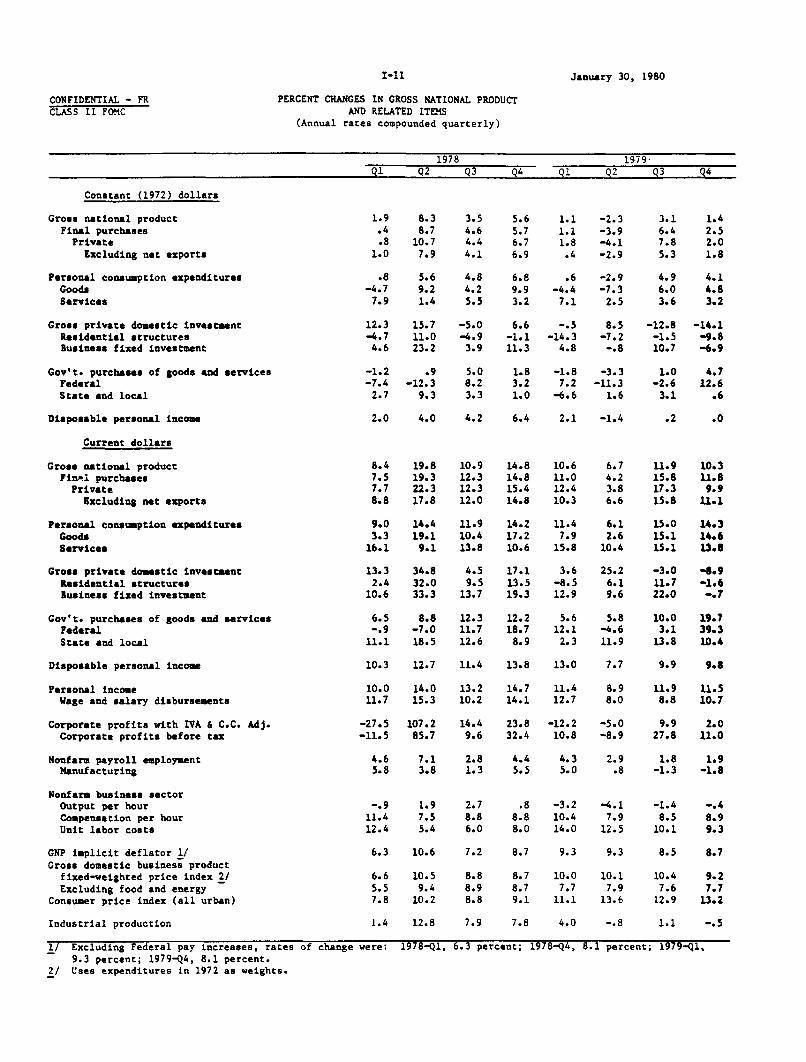
I-11 January 30, 1980
CONFIDENTIAL - FR PERCENT CHANGES IN GROSS NATIONAL PRODUCTCLASS II FOMC AND RELATED ITEMS
(Annual rates compounded quarterly)
1978 1979Q1 Q2 Q3 Q4 Q1 Q2 Q3 Q4
Constant (1972) dollars
Gross national product 1.9 8.3 3.5 5.6 1.1 -2.3 3.1 1.4Final purchases .4 8.7 4.6 5.7 1.1 -3.9 6.4 2.5Private .8 10.7 4.4 6.7 1.8 -4.1 7.8 2.0
Excluding net exports 1.0 7.9 4.1 6.9 .4 -2.9 5.3 1.8
Personal consumption expenditures .8 5.6 4.8 6.8 .6 -2.9 4.9 4.1Goods -4.7 9.2 4.2 9.9 -4.4 -7.3 6.0 4.8Services 7.9 1.4 5.5 3.2 7.1 2.5 3.6 3.2
Gross private domestic investment 12.3 15.7 -5.0 6.6 -. 5 8.5 -12.8 -14.1Residential structures -4.7 11.0 -4.9 -1.1 -14.3 -7.2 -1.5 -9.8Business fixed investment 4.6 23.2 3.9 11.3 4.8 -.8 10.7 -6.9
Gov't. purchases of goods and services -1.2 .9 5.0 1.8 -1.8 -3.3 1.0 4.7Federal -7.4 -12.3 8.2 3.2 7.2 -11.3 -2.6 12.6State and local 2.7 9.3 3.3 1.0 -6.6 1.6 3.1 .6
Disposable personal income 2.0 4.0 4.2 6.4 2.1 -1.4 .2 .0
Current dollars
Gross national product 8.4 19.8 10.9 14.8 10.6 6.7 11.9 10.3FinAi purchases 7.5 19.3 12.3 14.8 11.0 4.2 15.8 11.8
Private 7.7 22.3 12.3 15.4 12.4 3.8 17.3 9.9Excluding net exports 8.8 17.8 12.0 14.8 10.3 6.6 15.8 11.1
Personal consumption expenditures 9.0 14.4 11.9 14.2 11.4 6.1 15.0 14.3Goods 3.3 19.1 10.4 17.2 7.9 2.6 15.1 14.6Services 16.1 9.1 13.8 10.6 15.8 10.4 15.1 13.8
Gross private domestic investment 13.3 34.8 4.5 17.1 3.6 25.2 -3.0 -8.9Residential structures 2.4 32.0 9.5 13.5 -8.5 6.1 11.7 -1.6Business fixed investment 10.6 33.3 13.7 19.3 12.9 9.6 22.0 -.7
Gov't. purchases of goods and services 6.5 8.8 12.3 12.2 5.6 5.8 10.0 19.7Federal -.9 -7.0 11.7 18.7 12.1 -4.6 3.1 39.3State and local 11.1 18.5 12.6 8.9 2.3 11.9 13.8 10.4
Disposable personal income 10.3 12.7 11.4 13.8 13.0 7.7 9.9 9.8
Personal income 10.0 14.0 13.2 14.7 11.4 8.9 11.9 11.5Wage and salary disbursements 11.7 15.3 10.2 14.1 12.7 8.0 8.8 10.7
Corporate profits with IVA & C.C. Adj. -27.5 107.2 14.4 23.8 -12.2 -5.0 9.9 2.0Corporate profits before tax -11.5 85.7 9.6 32.4 10.8 -8.9 27.8 11.0
Nonfarm payroll employment 4.6 7.1 2.8 4.4 4.3 2.9 1.8 1.9Manufacturing 5.8 3.8 1.3 5.5 5.0 .8 -1.3 -1.8
Nonfarm business sectorOutput per hour -.9 1.9 2.7 .8 -3.2 -4.1 -1.4 -.4Compensation per hour 11.4 7.5 8.8 8.8 10.4 7.9 8.5 8.9Unit labor costs 12.4 5.4 6.0 8.0 14.0 12.5 10.1 9.3
GNP implicit deflator 1/ 6.3 10.6 7.2 8.7 9.3 9.3 8.5 8.7Gross domestic business product
fixed-weighted price index 2/ 6.6 10.5 8.8 8.7 10.0 10.1 10.4 9.2Excluding food and energy 5.5 9.4 8.9 8.7 7.7 7.9 7.6 7.7
Consumer price index (all urban) 7.8 10.2 8.8 9.1 11.1 13.6 12.9 13.2
Industrial production 1.4 12.8 7.9 7.8 4.0 -.8 1.1 -.5
1/ Excluding Federal pay increases, rates of change were: 1978-Q1, 6.3 percent; 1978-Q4, 8.1 percent; 1979-Q1,9.3 percent; 1979-Q4, 8.1 percent.
2/ Uses expenditures in 1972 as weights.

I-12
CONFIDENTIAL - FRCLASS II FOMC
GROSS NATIONAL PRODUCT AND RELATED ITEMS(Expenditures and income figures are billions of current dollars.)
January 30, 1980
Projected1974 1975 1976 1977 1978 1979 1980 1981
Gross national productFinal purchasesPrivate
Excluding net exports
Personal consumption expendituresGoodsServices
Gross private domestic investmentResidential constructionBusiness fixed investmentChange in business inventories
Nonfarm
Net exports of goods and services 1/ExportsImports
Gov't. purchases of goods and servicesFederal 2/State and local
Gross national product inconstant (1972) dollars
Personal incomeWage and salary disbursements
Disposable personal incomeSaving rate (percent)
Corporate profits with I.V.A. and C.C. Adj.Corporate profits before tax
Federal government surplus or deficit(N.I.A. basis)High employment surplus or deficit (-)
State and local government surplus ordeficit (-) (N.I.A. basis)
Excluding social insurance funds
Civilian labor force (millions)Unemployment rate (percent)
Nonfarm payroll employment (millions)Manufacturing
Industrial production (1967-100)Capacity utilization: all manufacturing (percent)
Materials (percent)
Housing starts, private (million units, A.R.)New auto sales, (millions, A.R.)
Domestic modelsForeign models
11412.91404.01101.31095.3
889.6498.3391.3
214.655.1
150.68.9
10.8
6.0137.9131.9
302.7111.1191.5
1528.81539.61201.21180.8
979.1541.5437.5
190.951.5150.2-10.7-14.3
20.4147.3126.9
338.4123.1215.4
1702.21692.11330.81322.8
1089.9601.3488.5
243.068.1
164.910.012.1
8.0163.3155.4
361.3129.7231.6
1899.51877.61481.41491.3
1210.0660.1549.8
303.391.9
189.421.920.7
-9.9175.9185.8
396.2144.4251.8
2127.62105.21669.61679.9
1350.8730.9619.8
351.5108.0221.122.321.3
-10.3207.2217.5
435.6152.6283.0
2368.52350.21874.11877.6
1509.8809.8700.0
386.2113.9253.9
18.416.6
-3.5257.4260.9
476.1166.3309.8
2560.22561.42029.82036.7
1655.6867.6787.9
380.0112.0269.1-1.1-1.6
-6.9292.8299.7
531.6191.3340.3
2768.32766.52189.92177.4
1768.0897.7870.3
411.1131.1278.2
1.71.3
12.5324.7312.2
576.6210.5366.1
1217.8 1202.3 1273.0 1340.5 1399.2 1431.1 1421.4 1407.7
1154.9764.6984.6
7.3
1255.5805.9
1086.77.7
1381.6890.0
1184.55.8
1531.6984.0
1305.15.0
1717.41103.31458.4
4.9
1923.11227.51623.2
4.5
2114.21321.61781.4
4.5
2286.41405.71915.1
4.9
83.6 95.9 126.8 150.0 167.7 178.5 157.9 167.2126.9 120.4 156.0 177.1 206.0 237.0 217.6 223.5
-10.7 -70.6 -53.6 -46.3 -27.7 -10.5 -41.0 -37.19.0 -19.2 -14.3 -19.3 -11.6 9.1 15.7 72.9
7.6 6.2 17.9 26.8 27.4 24.4 20.3 17.9-2.9 -6.2 2.3 7.3 4.2 -2.2 -9.4 -14.2
91.0 92.6 94.8 97.4 100.4 102.9 104.8 105.95.6 8.5 7.7 7.0 6.0 5.8 6.9 8.4
78.3 77.0 79.4 82.4 86.4 89.5 90.0 89.020.1 18.3 19.0 19.7 20.5 21.0 20.3 19.2
129.383.887.1
117.872.973.4
1.34 1.168.91 8.667.49 7.081.42 1.58
130.579.581.1
1.5410.128.631.50
138.281.982.7
1.9911.139.072.06
146.184.485.6
2.0211.299.272.02
152.2 149.6 147.385.7 81.3 77.387.1 81.2 76.2
1.7210.708.222.48
1.44 1.659.24 9.517.04 7.242.20 2.27
1/ Balance of payments data underlying these estimates arepart of the Greenbook.
shown in the International Developments section of this
2/ Components of purchases and total receipts and total expenditures are shown in the Federal Sector Accounts tablewhich follows.
- - -- ---
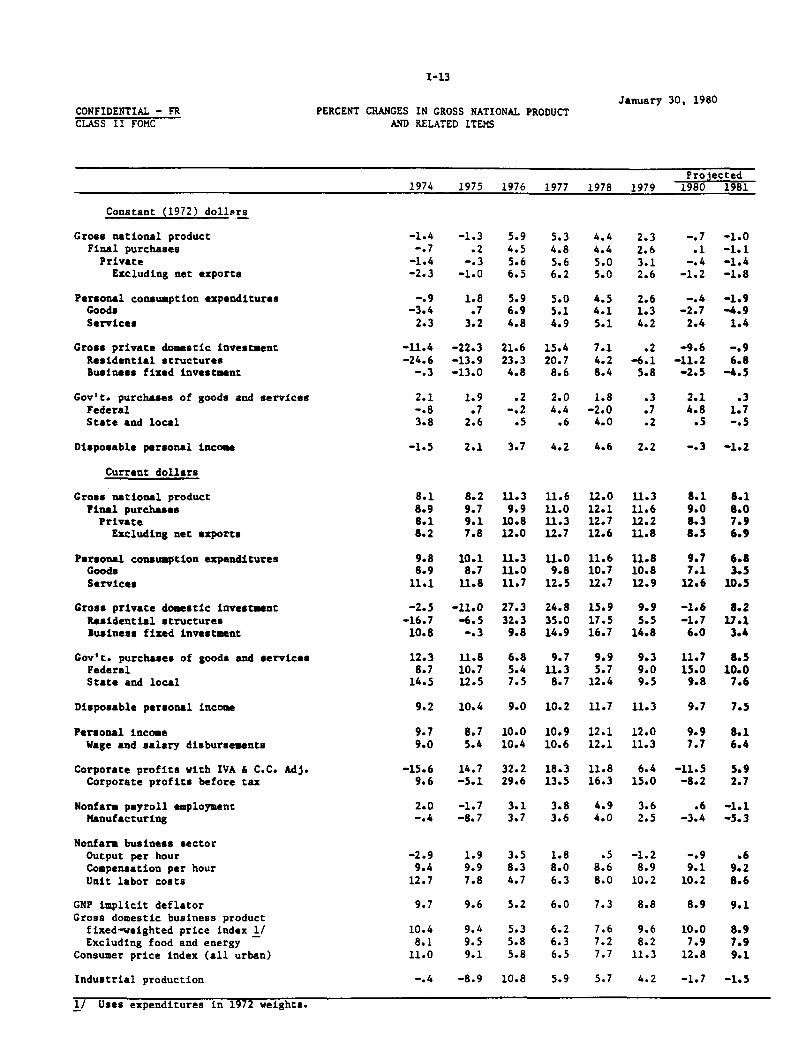
CONFIDENTIAL - FR
CLASS II FOMC
PERCENT CHANGES IN GROSS NATIONAL PRODUCTAND RELATED ITEMS
January 30, 1980
Projected1974 1975 1976 1977 1978 1979 1980 1981
Constant (1972) dollars
Gross national productFinal purchasesPrivate
Excluding net exports
Personal consumption expendituresGoodsServices
Gross private domestic investmentResidential structuresBusiness fixed investment
Gov't. purchases of goods and servicesFederalState and local
Disposable personal income
Current dollars
Gross national productFinal purchasesPrivateExcluding net exports
Personal consumption expendituresGoodsServices
Gross private domestic investmentResidential structuresBusiness fixed investment
Gov't. purchases of goods and servicesFederalState and local
Disposable personal income
Personal incomeWage and salary disbursements
Corporate profits with IVA & C.C. Adj.Corporate profits before tax
Nonfarm payroll employmentManufacturing
-1.4-. 7-1.4-2.3
-1.3.2
-. 3-1.0
-. 9 1.8-3.4 .7
2.3 3.2
-11.4-24.6
-. 3
-22.3-13.9-13.0
5.3 4.4 2.3 -. 74.8 4.4 2.6 .15.6 5.0 3.1 -. 46.2 5.0 2.6 -1.2
-1.0-1.1-1.4-1.8
5.9 5.0 4.5 2.6 -.4 -1.96.9 5.1 4.1 1.3 -2.7 -4.94.8 4.9 5.1 4.2 2.4 1.4
21.6 15.4 7.1 .2 -9.623.3 20.7 4.2 -6.1 -11.24.8 8.6 8.4 5.8 -2.5
-. 96.8
-4.5
2.1 1.9 .2 2.0 1.8 .3 2.1 .3-.8 .7 -.2 4.4 -2.0 .7 4.8 1.73.8 2.6 .5 .6 4.0 .2 .5 -.5
-1.5 2.1 3.7 4.2 4.6 2.2 -.3 -1.2
11.39.9
10.812.0
9.8 10.18.9 8.7
11.1 11.8
-2.5-16.7
10.8
-11.0-6.5-.3
12.3 11.88.7 10.7
14.5 12.5
11.611.011.312.7
12.012.112.712.6
11.311.612.211.8
11.3 11.0 11.6 11.811.0 9.8 10.7 10.811.7 12.5 12.7 12.9
27.3 24.8 15.932.3 35.0 17.59.8 14.9 16.7
9.711.3
8.7
9.7 6.87.1 3.5
12.6 10.5
9.9 -1.65.5 -1.7
14.8 6.0
9.95.7
12.4
8.217.1
3.4
11.7 8.515.0 10.09.8 7.6
9.2 10.4 9.0 10.2 11.7 11.3 9.7 7.5
9.7 8.79.0 5.4
10.0 10.9 12.1 12.010.4 10.6 12.1 11.3
9.9 8.17.7 6.4
-15.6 14.7 32.2 18.3 11.8 6.4 -11.5 5.99.6 -5.1 29.6 13.5 16.3 15.0 -8.2 2.7
2.0 -1.7 3.1 3.8 4.9 3.6 .6 -1.1-.4 -8.7 3.7 3.6 4.0 2.5 -3.4 -5.3
Nonfarm business sectorOutput per hourCompensation per hourUnit labor costs
-2.9 1.99.4 9.9
12.7 7.8
3.5 1.8 .5 -1.2 -. 9 .68.3 8.0 8.6 8.9 9.1 9.24.7 6.3 8.0 10.2 10.2 8.6
GNP implicit deflatorGross domestic business product
fixed-weighted price index 1/Excluding food and energy
Consumer price index (all urban)
Industrial production
9.7 9.6 5.2 6.0 7.3 8.8 8.9 9.1
10.4 9.48.1 9.5
11.0 9.1
-. 4 -8.9 10.8 5.9 5.7 4.2 -1.7 -1.5
1/ Uses expenditures in 1972 weights.
6.2 7.66.3 7.26.5 7.7
9.68.2
11.3
10.0 8.97.9 7.9
12.8 9.1
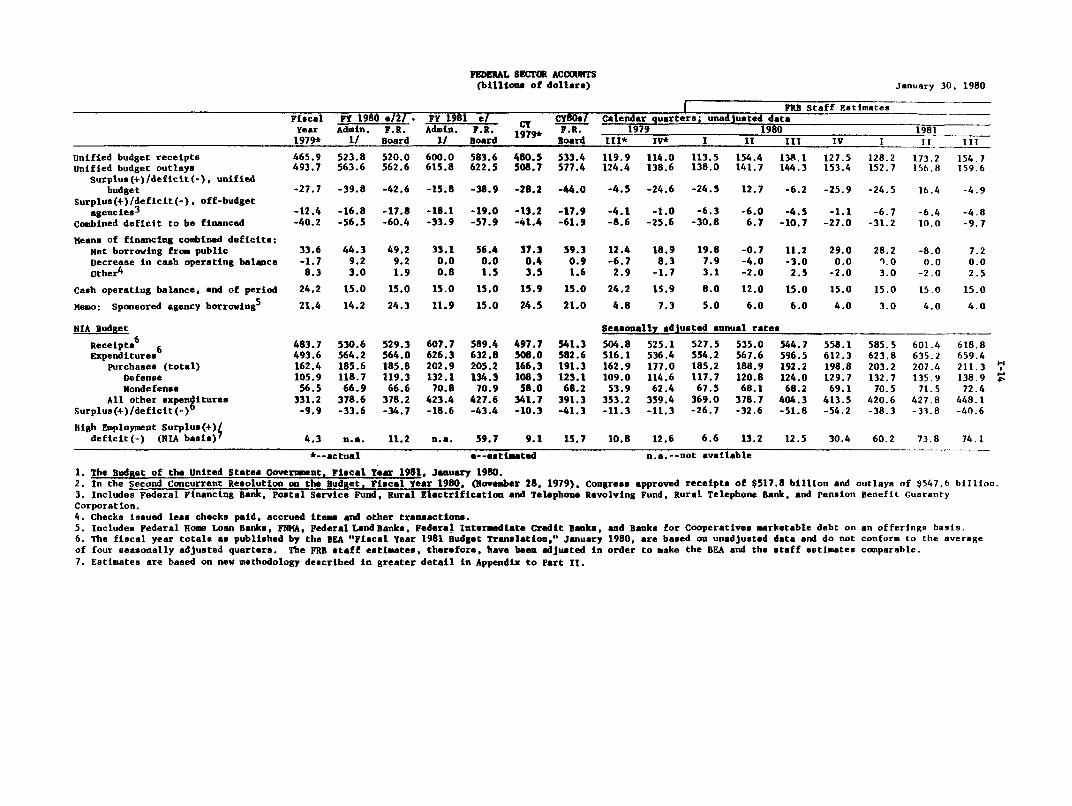
FEDERAL SECTOR ACCOUNTS(billions of dollars) January 30, 1980
I FRB Staff EstimatesFiscal FY 1980 e/2/ . FY 1981 e/ CY80/ Calendar quarters; unadjusted dataYear Admin. F.R. Admin. F.R. 1979 F.R. 1979 1980 19811979* 1/ Board 1/ Board Board III* IV* I II III IV I II 111
Unified budget receipts 465.9 523.8 520.0 600.0 583.6 480.5 533.4 119.9 114.0 113.5 154.4 138.1 127.5 128.2 173.2 154.7Unified budget outlays 493.7 563.6 562.6 615.8 622.5 508.7 577.4 124.4 138.6 138.0 141.7 144.3 153.4 152.7 156.8 159.6
Surplus(+)/deflcit(-), unifiedbudget -27.7 -39.8 -42.6 -15.8 -38.9 -28.2 -44.0 -4.5 -24.6 -24.5 12.7 -6.2 -25.9 -24.5 16.4 -4.9
Surplus(+)/deficit(-), off-budgetagencies
3 -12.4 -16.8 -17.8 -18.1 -19.0 -13.2 -17.9 -4.1 -1.0 -6.3 -6.0 -4.5 -1.1 -6.7 -6.4 -4.8
Combined deficit to be financed -40.2 -56.5 -60.4 -33.9 -57.9 -41.4 -61.9 -8.6 -25.6 -30.8 6.7 -10.7 -27.0 -31.2 10.0 -9.7
means of financing combined deficits:Net borrowing from public 33.6 44.3 49.2 33.1 56.4 37.3 59.3 12.4 18.9 19.8 -0.7 11.2 29.0 28.2 -8.0 7.2Decrease in cash operating balance -1.7 9.2 9.2 0.0 0.0 0.4 0.9 -6.7 8.3 7.9 -4.0 -3.0 0.0 1.0 0.0 0.0Other
4 8.3 3.0 1.9 0.8 1.5 3.5 1.6 2.9 -1.7 3.1 -2.0 2.5 -2.0 3.0 -2.0 2.5
Cash operating balance, and of period 24.2 15.0 15.0 15.0 15.0 15.9 15.0 24.2 15.9 8.0 12.0 15.0 15.0 15.0 15.0 15.0
Memo: Sponsored agency borrowing5
21.4 14.2 24.3 11.9 15.0 24.5 21.0 4.8 7.3 5.0 6.0 6.0 4.0 3.0 4.0 4.0
NIA Budget Seasonally adjusted annual rates
Receipts6 6 483.7 530.6 529.3 607.7 589.4 497.7 541.3 504.8 525.1 527.5 535.0 544.7 558.1 585.5 601.4 618.8Expenditures 493.6 564.2 564.0 626.3 632.8 508.0 582.6 516.1 536.4 554.2 567.6 596.5 612.3 623.8 635.2 659.4
purchases (total) 162.4 185.6 185.8 202.9 205.2 166.3 191.3 162.9 177.0 185.2 188.9 192.2 198.8 203.2 207.4 211.3Defense 105.9 118.7 119.3 132.1 134.3 108.3 123.1 109.0 114.6 117.7 120.8 124.0 129.7 132.7 135.9 138.9Nondefense 56.5 66.9 66.6 70.8 70.9 58.0 68.2 53.9 62.4 67.5 68.1 68.2 69.1 70.5 71.5 72.4
All other expen itures 331.2 378.6 378.2 423.4 427.6 341.7 391.3 353.2 359.4 369.0 378.7 404.3 413.5 420.6 427.8 448.1Surplus(+)/deficit(-) -9.9 -33.6 -34.7 -18.6 -43.4 -10.3 -41.3 -11.3 -11.3 -26.7 -32.6 -51.8 -54.2 -38.3 -33.8 -40.6
High Employment Surplus(+)deficit(-) (NIA basis) 4.3 n.a. 11.2 n.a. 59.7 9.1 15.7 10.8 12.6 6.6 13.2 12.5 30.4 60.2 73.8 74.1
*--actual e--eatimated n.a.--not available
1. The Budget of the United States Government, Fiscal Year 1981, January 1980.2. In the Second Concurrent Resolution on the Budget, Fiscal Year 1980, (November 28, 1979), Congress approved receipts of $517.8 billion and outlays of $547.6 billion.3. Includes Federal Financing Bank, Postal Service Fund, Rural Electrification and Telephone Revolving Fund, Rural Telephone Bank, and Pension Benefit GuarantyCorporation.4. Checks issued less checks paid, accrued items and other transactions.5. Includes Federal Home Loan Banks, FNMA, Federal Land Banks, Federal Intermediate Credit Banks, and Banks for Cooperatives marketable debt on an offerings basis.6. The fiscal year totals as published by the BEA "Fiscal Year 1981 Budget Translation," January 1980, are based on unadjusted data and do not conform to the averageof four seasonally adjusted quarters. The FRB staff estimates, therefore, have been adjusted in order to make the BEA and the staff estimates comparable.
7. Estimates are based on new methodology described in greater detail in Appendix to Part II.

COMMENTS ON THE FEDERAL SECTOR OUTLOOK
The staff's fiscal outlook has been revised this month to reflect
information contained in the President's budget proposals. For fiscal
year 1981, federal spending on a unified basis is expected to be $622-1/2
billion, about $6-1/2 billion more than the administration's estimate.
Differences between the staff and administration forecasts of unemploy-
ment and interest rate levels account for much of this divergence of
spending. In addition, Congress is not expected to accept all of the
President's proposals to reduce spending, especially for hospital cost
containment. In the defense area, we assume a rapid buildup in procure-
ment contracts, with our spending estimates running moderately higher
than those of the administration. Receipts are projected by the staff
at $584 billion in fiscal year 1981, about $16 billion below the budget
estimate. This difference reflects the effect on incomes of the staff's
slower projected economic recovery. Hence, the staff's expenditure and
revenue estimates suggest a unified budget deficit in fiscal year 1981
of around $39 billion.
For the current fiscal year, the staff's outlay forecasts are not
substantially different from the administration's estimates. Relative
to the last Greenbook, we have revised outlays upward to $562-1/2 billion
in order to reflect the Russian grain embargo, higher defense outlays,
the postponement of some FmHA asset sales and larger interest payments
on the public debt. Receipts also have been revised upward to an
estimated total of $520 billion, about $6 billion above the previous
forecast. The staff's stronger near term forecast of personal income
is responsible for much of this gain. The recent strength in receipts,
I-15

I-16
however, may be moderated somewhat in the spring by a large increase
in refunds ($10 billion more than the previous year) resulting from
the sizable rise in overwithholding experienced in 1979. The resulting
deficit for the current fiscal year is now expected to be $43 billion.
The high-employment budget estimates have been revised this
month in order to reflect the Council of Economic Advisers downward
revision of potential GNP. In addition, beginning this month the
estimates have been computed using a new procedure developed by an inter-
agency committee that included the Board's staff. (See Appendix A for
more information on this method.) The new high-employment budget
estimates show an increasing surplus, rising about $18 billion during
the four quarters of 1980, and around $50 billion during 1981. The move
toward restraint in 1981--when scaled by potential GNP--is among the
largest of the postwar period.

DOMESTIC FINANCIAL DEVELOPMENTS
Summary
Monetary expansion has continued at a moderate pace and credit
conditions have remained firm recently. Short-term market rates of
interest are unchanged to up 1/2 of a percentage point, on balance,
since the January 9 FOMC meeting. In the taxable bond markets, yields
have risen 1/2 to 3/4 of a percentage point, evidencing investor concerns
about future inflation and credit market pressures in light of stronger
than anticipated economic indicators and possible increases in federal
defense spending.
It appears that M-1 has been growing a bit less than 4 percent,
at an annual rate, during January, a little above the pace of the preced-
ing three months. High market rates of interest have continued to retard
growth of the interest-bearing components of the broader aggregates.
Despite a reportedly good reception of the new 2-1/2 year certificates
and further substantial sales of 6-month MMCs, bank time and savings
deposits subject to rate ceilings are estimated to have little more than
matched the 10-1/2 percent growth rate of December; in the second and
third quarters of 1979 growth averaged around 15 percent. At S&Ls and
MSBs, deposits appear to have grown in January at about the same weak
pace as in December--in the neighborhood of 5 percent. Large sums con-
tinue to flow into non-deposit investments. Noncompetitive bill tenders
and money market mutual fund growth have been at record levels this month.
The additional data that have become available recently confirm
that there was a marked drop in aggregate credit flows in the final quarter
of 1979. Borrowing by both nonfinancial businesses and households is now
I-17
I-18
estimated to have declined by one-fourth from the rate of the third quar-
ter, and foreigners appear to have repaid debt, on net.
The fragmentary data available for January suggest that there
may have been some pickup in bank credit growth, which averaged only 3
percent (annual rate) in the final quarter of last year. In particular,
figures for large banks through January 16 point to a fairly brisk growth
of business loans, although this partly reflects the impact on the monthly
average level of a surge in late December. Issuance of commercial paper
by nonfinancial firms meanwhile slowed in the first half of January, and
public bond issuance remained quite moderate.
Perhaps because institutions had so drastically adjusted their
lending policies earlier, the primary home mortgage market has been stable
of late even though corporate bond rates have been rising to new highs.
If anything, there have been signs of some easing of home mortgage credit
conditions this month; interest rates on new loan commitments have been
lowered slightly by S&Ls in certain areas, and surveys indicate some
liberalization of nonrate terms. The federal override of usury ceilings
has alleviated credit availability constraints in a number of states,
but high interest rates reportedly are holding down loan demand in those
markets as elsewhere. The volume of new commitments extended by S&Ls in
December was down from the already sharply reduced November level, and
commitments outstanding again fell substantially.
Security issuance by states and localities diminished somewhat
in January owing to a drop-off in long-term debt offerings. The lighter
calendar may have contributed to the relative strength of the municipal
bond market--the ratio of tax-exempt to taxable bond yields is currently

I-19
around an all-time low. The Treasury, on the other hand, was a substan-
tial borrower, raising $4.4 billion in January through issuance of market-
able debt. More than one-half of this was accomplished by additions to
regular bill auctions. Sponsored agency borrowing, though sizable, was
well below the record fourth quarter pace.
Outlook
With aggregate demand apparently more bouyant than anticipated,
short-term interest rates appear likely to remain close to their present
levels over the next few months. Bond yields might retrace some of their
recent increase, however, if there is decisive evidence of a weakening
in economic activity or if there is some relaxation of current interna-
tional tensions. Any fall in bond yields would, in turn, reinforce the
recent tendency toward an easing of residential mortgage credit conditions.
On the whole, however, credit markets probably will r main quite
taut in the near term. On the supply side, commercial banks and thrift
institutions are expected to continue experiencing relatively sluggish
growth of core deposits, and life insurers may face further sizable policy
loan requests. Investors generally are likely to remain risk-averse,
requiring relatively large quality rate-spreads and liquidity premiums.
Business borrowing may pick up a bit from the reduced fourth
quarter pace; the staff's GNP projection points to some weakening in
corporate cash flows, and firms face substantial tax payments. Business
loan demand at banks probably will be somewhat stronger than in the fourth
quarter, although any major rally in the bond markets might prompt a
greater shift toward long-term debt issuance.

I-20
Household borrowing, on the other hand, most likely will de-
crease from the fourth quarter level. Installment credit growth should
remain sluggish, in line with the weak outlook for consumer durables
spending. Even with some possible easing in mortgage credit conditions,
the recent drop in loan commitments and unfavorable income trends suggest
that home mortgage flows will decline somewhat further.
In the government sector, state and local bond offerings probably
will rebound in the next few months, with the volume of housing revenue
bonds continuing large. Treasury borrowing will be fairly sizable; sub-
stantial amounts of new cash likely will be raised in regular bill auctions
as well as in the quarterly refunding and other coupon financings.

INTERNATIONAL DEVELOPMENTS
Summary. On balance the trade-weighted average foreign exchange
value of the dollar has risen slightly since the end of 1979; the dollar
declined about 1 per cent in the first week of January but then recovered.
Exchange market developments have been dominated by growing political
tensions abroad, and those tensions have also been the prime factor in
the wild gyrations of the price of gold and other precious metals.
Among foreign currencies the pound showed particular strength until late
in the month,
.U.S. intervention activity consisted
of net sales of $500 million, mainly against DM which was used to repay
swap debt.
Economic activity in foreign industrial countries continued strong
well into the fourth quarter of last year, according to most indicators,
with only a few countries showing signs of an actual slowdown. However,
price data continued to indicate a widespread experience of high infla-
tion rates, reflecting the pervasive effect of high oil import prices.
Larger oil imports have also been instrumental in a sharp decline in the
aggregate trade surplus of the six largest foreign industrial countries,
from about $45 billion in 1978 to under $5 billion in 1979.
A few items of new information on U.S. international transactions
have become available since the last Greenbook. U.S. banks reported a
net capital inflow of $3-3/4 billion in November, about the same amount
as in October, but partial data suggest that these inflows did not
continue into December. For the January-November period net capital
inflows reported by banks amounted to about $25 billion, compared with a
I-21
I-22
net outflow of about $15 billion reported for the full year 1978. The
1979 bank-reported inflow was partly offset by rising placements of
funds offshore by U.S. nonbanks, with the rate of such placements
slowing in the fourth quarter, according to partial data.
Official foreign assets in the United States declined again in
November - assets of G-10 countries and Switzerland were down by $8
billion,
. These swaps were reversed in December and early
January. Assets of the OPEC countries in the United States rose only
slightly in November and December though the OPEC current account rose
to a quarterly rate of $20 billion by the second half of 1979, double
the first-half rate. U.S. reserve assets rose by $1.3 billion in
November, chiefly reflecting the proceeds of the sale of Treasury
mark-denominated notes. A further sale of $1.2 billion equivalent was
made in January.
The trade deficit in December was reported at a $37 billion annual
rate (Census basis), considerably higher than the relatively low November
rate, but for the fourth quarter as a whole the trade deficit was about
the same as it had been since the first quarter. Exports were flat in
December but up substantially for the quarter. Imports of oil were up
in December and for the fourth quarter as a whole; the volume of imports
was about the same in the fourth quarter - 8.7 mbd - as in the second
and third quarters, but the import price reached $25 per barrel in
December, up from about $14 per barrel in the first quarter.

I-23
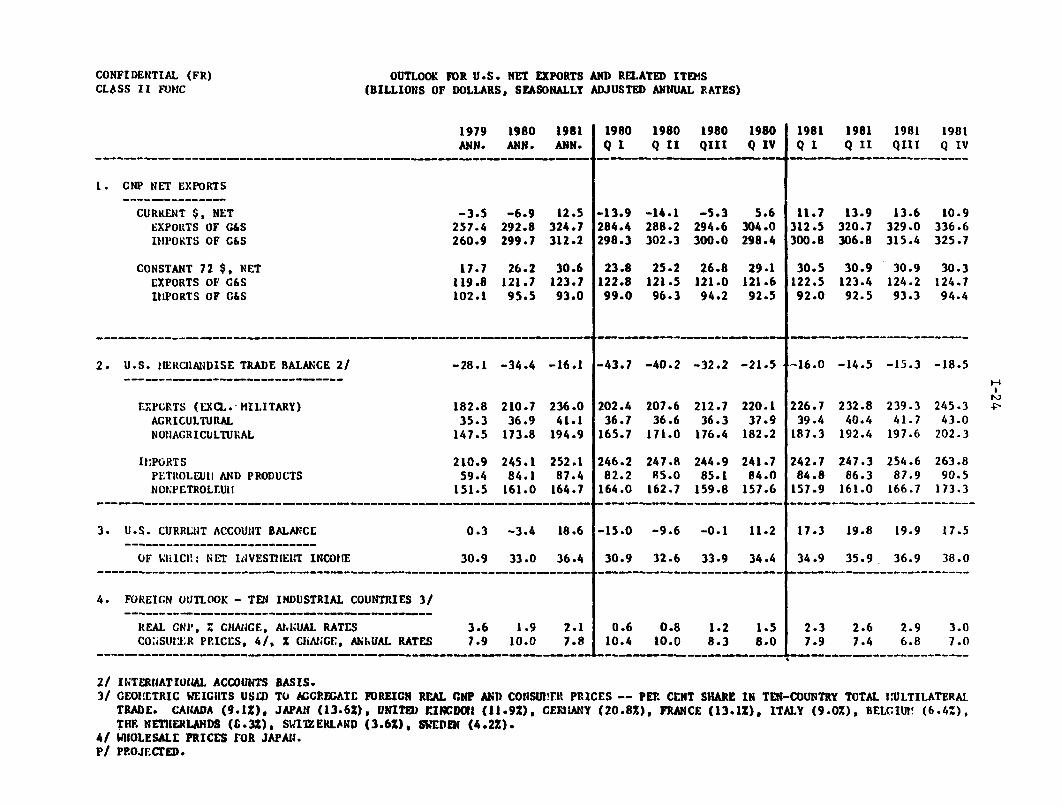
Outlook. Over the past month revisions of underlying assumptions
and special factors have had the effect of raising the projection of the
1980 trade deficit since the last Greenbook considerably - to about
$35 billion - but have reduced the 1981 deficit rate to about $16 billion.
The current account projection for this year is for a small deficit, but
with surpluses of some size emerging by the fourth quarter and continuing
through next year. The main change in the economic profile is the
steeper decline in U.S. activity after mid-1980, while on the foreign
side slightly more strength has been projected for 1980 and carried
into 1981. Moreover, the projection of exports for 1980 has been
reduced to reflect the cancellation of sales to the U.S.S.R. and the
cessation of U.S. gold sales. The outlook for the trade-weighted average
dollar has been shaded down in the near term compared with last month's
estimate, but the dollar is projected to regain this ground toward the
end of this year and early next year as the steadiness of U.S. monetary
policy and the improvement in the U.S. trade and current account have
their effect.
CONFIDENTIAL (FR)CLASS II FOMC
OUTLOOK FOR U.S. NET EXPORTS(BILLIONS OF DOLLARS, SEASONALLY
1979 1980 1981ANN. ANN. ANN.
AND RELATED ITEMSADJUSTED ANNUAL RATES)
1980 1980 1980 1980
QI Q II QIII Q IV1981 1981 1981 1981Q I Q II QIII Q IV
1. GNP NET EXPORTS
CURRENT $, NET -3.5 -6.9 12.5 -13.9 -14.1 -5.3 5.6 11.7 13.9 13.6 10.9EXPORTS OF G&S 257.4 292.8 324.7 284.4 288.2 294.6 304.0 312.5 320.7 329.0 336.6IMPORTS OF G&S 260.9 299.7 312.2 298.3 302.3 300.0 298.4 300.8 306.8 315.4 325.7
CONSTANT 72 $, NET 17.7 26.2 30.6 23.8 25.2 26.8 29.1 30.5 30.9 30.9 30.3EXPORTS OF G&S 119.8 121.7 123.7 122.8 121.5 121.0 121.6 122.5 123.4 124.2 124.7IMPORTS OF G&S 102.1 95.5 93.0 99.0 96.3 94.2 92.5 92.0 92.5 93.3 94.4
2. U.S. MERCHANDISE TRADE BALANCE 2/ -28.1 -34.4 -16.1 -43.7 -40.2 -32.2 -21.5 -16.0 -14.5 -15.3 -18.5
EXPORTS (EXCL. MILITARY) 182.8 210.7 236.0 202.4 207.6 212.7 220.1 226.7 232.8 239.3 245.3AGRICULTURAL 35.3 36.9 41.1 36.7 36.6 36.3 37.9 39.4 40.4 41.7 43.0NONAGRICULTURAL 147.5 173.8 194.9 165.7 171.0 176.4 182.2 187.3 192.4 197.6 202.3
IMPORTS 210.9 245.1 252.1 246.2 247.8 244.9 241.7 242.7 247.3 254.6 263.8PETROLEUM AND PRODUCTS 59.4 84.1 87.4 82.2 85.0 85.1 84.0 84.8 86.3 87.9 90.5NONPETROLEUM 151.5 161.0 164.7 164.0 162.7 159.8 157.6 157.9 161.0 166.7 173.3
3. U.S. CURRENT ACCOUNT BALANCE 0.3 -3.4 18.6 -15.0 -9.6 -0.1 11.2 17.3 19.8 19.9 17.5
OF WHICH: NET IVESTMENT INCOME 30.9 33.0 36.4 30.9 32.6 33.9 34.4 34.9 35.9 36.9 38.0
4. FOREIGN OUTLOOK - TEN INDUSTRIAL COUNTRIES 3/
REAL GNP, % CHANGE, ANNUAL RATES 3.6 1.9 2.1 0.6 0.8 1.2 1.5 2.3 2.6 2.9 3.0CONSUMER PRICES, 4/, % CHANGE, ANNUAL RATES 7.9 10.0 7.8 10.4 10.0 8.3 8.0 7.9 7.4 6.8 7.0
-- - -- -- -- -- - - - - - - i- - - - - - -- -
2/ INTERNATIONAL ACCOUNTS BASIS.3/ GEOMETRIC WEIGHTS USED TO AGGREGATE FOREIGN REAL GNP AND CONSUMER PRICES -- PER CENT SHARE IN TEN-COUNTRY TOTAL MULTILATERAL
TRADE. CANADA (9.1%), JAPAN (13.6%), UNITED KINGDOM (11.9%), GERMANY (20.8%), FRANCE (13.1%), ITALY (9.0%), BELGIUM (6.4%),THE NETHERLANDS (8.3%), SWITZERLAND (3.6%), SWEDEN (4.2%).
4/ WHOLESALE PRICES FOR JAPAN.P/ PROJECTED.