fomc 19830209 g bpt 219830202
TRANSCRIPT

Prefatory Note
The attached document represents the most complete and accurate version available based on original copies culled from the files of the FOMC Secretariat at the Board of Governors of the Federal Reserve System. This electronic document was created through a comprehensive digitization process which included identifying the best-preserved paper copies, scanning those copies,1 and then making the scanned versions text-searchable.2 Though a stringent quality assurance process was employed, some imperfections may remain.
Please note that this document may contain occasional gaps in the text. These gaps are the result of a redaction process that removed information obtained on a confidential basis. All redacted passages are exempt from disclosure under applicable provisions of the Freedom of Information Act.
1 In some cases, original copies needed to be photocopied before being scanned into electronic format. All scanned images were deskewed (to remove the effects of printer- and scanner-introduced tilting) and lightly cleaned (to remove dark spots caused by staple holes, hole punches, and other blemishes caused after initial printing). 2 A two-step process was used. An advanced optimal character recognition computer program (OCR) first created electronic text from the document image. Where the OCR results were inconclusive, staff checked and corrected the text as necessary. Please note that the numbers and text in charts and tables were not reliably recognized by the OCR process and were not checked or corrected by staff.

Confidential (FR) Class II FOMC
February 2, 1983
RECENT DEVELOPMENTS
Prepared for the Federal Open Market CommitteeBy the staff of the Board of Governors of the Federal Reserve System

TABLE OF CONTENTS
Section Page
DOMESTIC NONFINANCIAL DEVELOPMENTS II
Industrial production and employment............................ 1Inventory investment ......................... .................. 6Personal income and consumer spending........................... 9Housing ........ ...... .................... .................. 13Business fixed investment............................ ......... 13Federal government ............................................ 19State and local government............................ .... 20Inflation and labor costs...................................... 21
TABLES:
Industrial production.......................................... 3Capacity utilization rates: manufacturing and materials......... 3Changes in employment........................................... 5Selected unemployment rates............................ ........ .. 5Changes in manufacturing and trade inventories.................. 8Inventories relative to sales................................... 8Personal income ............................................... 10Retail sales..................... .................... ........ 11Auto sales ............................................ ......... 11Private housing activity.......................... ........ 14Business capital spending indicators........................ ..... 15Business capital spending commitments........................... 15Surveys of plant and equipment expenditures .................... 18
Error history of annual surveys............................... 18Selected measures of inflation.................................. 22
Selected measures of inflation in the nonfarm business sector... 23Negotiated first-year wage rate adjustments under new
major collective bargaining settlements ...................... 25
CHARTS:
Industrial production and capacityutilization .... .................................. .......... 2
Recent behavior of manufacturing andtrade inventories and sales.................................. 7
Private housing starts................................ ........ 14
Nonresidential commercial structures and vacancy ratesfor commercial office space................................... 17
Effective wage change in major union contracts.................. 26
DOMESTIC FINANCIAL DEVELOPMENTS III
Monetary aggregates and bank credit............................. 3Business finance........................... ..... .......... 7Government finance
Federal sector....... .... .................................. 9
State and local sector.............................. ..... 11

DOMESTIC FINANCIAL DEVELOPMENTS III
Mortgage markets....................... ......... 13Consumer credit................................................ 17
TABLES:
Monetary aggregates............. .............................. 2Commercial bank credit and short- and intermediate-term
business credit...... .................... . .............. 4
Gross offerings of securities by U.S. corporations.............. 6Sources and uses of funds by nonfinancial corporations.......... 7Treasury and agency financing...... ............................ 10State and local government securities offerings................. 12Consumer installment credit............ ........................ 16
CHART:
Mortgage-bond yield spreads.................................... 14
APPENDIX A: Money market deposit account and super NOWaccount developments .......................... III-A-1
INTERNATIONAL DEVELOPMENTS IV
Foreign exchange markets ...................................... 1U.S. international financial transactions........................ 5U.S. merchandise trade.......................................... 10Foreign economic developments.................................... 14
Update on major debt negotiations.............................. 24
TABLES:
International banking data....................................... 5
U.S. official reserve assets.................................... 7Summary of U.S. international transactions........................ 9U.S. merchandise trade........................................... 10Oil imports ...................................................... 11
Major industrial countriesReal GNP and IP............................................... 21Consumer and wholesale prices................................... 22
Trade and current-account balances........................... 23
CHARTS:
Weighted-average exchange value of the U.S. dollar............... 2Selected exchange rates......................................... 2

February 2, 1983
SELECTED DOMESTIC NONFINANCIAL DATA(Seasonally adjusted)
Latest data Percent change fromThree
Period Release Data Preceding periods Yeardate period earlier earlier
(At annual rate)
Civilian labor forceUnemployment rate (%) 1/Insured unemployment rate (%) 1/
Nonfarm employment, payroll (mil.)ManufacturingNonmanufacturing
Private nonfarm:Average weekly hours (hr.) 1.Hourly earnings ($) 1/
Manufacturing:Average weekly hours (hr.) 1/Unit labor cost (1967=100)
Industrial production (1967=100)Consumer goodsBusiness equipmentDefense & space equipmentMaterials
Dec. 1-7-83Dec. 1-7-83Nov. 1-24-83Dec. 1-7-83Dec. 1-7-83Dec. 1-7-83
Dec. 1-7-83Dec. 1-7-83
Dec. 1-7-83Dec. 1-28-83
Dec.Dec.Dec.Dec.Dec.
Consumer prices all item (1967-100) Dec.All item, excluding food & energy Dec.Food Dec.
Producer prices: (1967-100)Finished goodsIntermediate materials, nonfoodCrude foodstuffs & feedstuffs
Personal income ($ bil.) 2/
1-14-831-14-831-14-831-14-831-14-83
1-21-831-21-831-21-83
Dec. 1-14-83Dec. 1-14-83Dec. 1-14-83
111.110.85.3
88.518.170.4
34.67.83
38.9231.4
134.7141.4144.1116.0128.4
293.5280.2288.0
285.9317.6237.3
.910.75.3
-2.2-3.2-2.0
34.77.78
38.9-2.1
-.92.6
-4.125.4-4.7
-3.3-1.7-1.7
Dec. 1-18-83 2,636.8 7.1
1.010.2
4.7-3.4-9.4-1.8
1.98.63.9
-2.3-7.8-.8
34.8 35.07.72 7.46
38.8 39.13.0 4.0
-7.6-5.6
-17.023.7
-10.9
-6.1-.4
-19.58.4
-7.6
1.1 3.9.1 4.5.6 3.0
4.7 3.51.8 .2
-6.6 1.4
6.1 5.6
(Not at annual rates)
Mfgre. new orders dur. goods ($Capital goods industriesNondefenseDefense
bil.)Dec.Dec.Dec.Dec.
Inventories to sales ratio: 1/Manufacturing and trade, totalManufacturingTrade
Ratio: Mfgrs.' durable goods inven-tories to unfilled orders 1/
Retail sales, total ($ bil.)GAF 3/
Auto sales, total (al. units.) 2/Domestic modelsForeign models
Plant & Equipment expen. '($ bil.)4/Total nonfarm businessManufacturingNonmanufacturing
2-1-832-1-832-1-832-1-83
Nov. 1-12-83Dec. 2-1-83Nov. 1-12-83
2-1-83
78.7 11.533.1 30.912.5 145.520.6 2.0
1.51 1.551.76 1.771.30 1.35
.617 .636
Dec. 1-12-83 92.3 -. 4Dec. 1-12-83 19.2 1.1
198319831983
Housing starts, private (thous.) 2/ Dec.Leading indicators (1967-100) Dec.
1-4-831-4-831-4-83
1-12-831-12-831-12-83
8.7 -8.56.1 -10.82.6 -2.4
315.69119.52196.16
1-18-83 1,222 13.01-28-83 132.8 1.5
7.534.4
188.31.5
3.019.1
121.4-7.0
1.52 1.511.71 1.771.33 1.29
.638 .611
3.3 6.63.8 3.3
2.9 19.5-1.7 25.215.8 7.8
- -1.3- -
-2.6-- -. 6
8.2 38.52.0 4.5
1/ Actual data used in lieu of percent changes for earlier periods.1/ At annual rate.3/ Excludes mail order houses.4/ Planned-Commerce November and December 1982 Survey.
II - T - 1

DOMESTIC NONFINANCIAL DEVELOPMENTS
Economic activity declined in the fourth quarter, but appeared
to be leveling off at year-end. Much of the drop in real GNP reflected
a large inventory liquidation in November. However, industrial production
stabilized in December, and recent data suggest that final demands have
firmed: housing activity continued to improve, consumer spending picked
up in late autumn, and the downward momentum in spending for capital
equipment appeared to be easing. The rate of inflation continued to improve
in December, and was below 5 percent in 1982 by virtually all measures.
Industrial Production and Employment
Industrial output edged down just 0.1 percent in December after
average monthly declines of almost 1 percent during the autumn. Output of
final products rose 0.3 percent. An upturn in auto assemblies and a rise
in output of defense equipment as well as a sharp increase in oil- and gas-
well drilling in December were offset by additional cutbacks in industries
with burdensome inventories. Output of durable home goods, business equip-
ment, and metals was curtailed further, although by a bit less than in
preceding months.
Early indications suggest that industrial production may have
turned up in January. The presumed improvement presumably was driven by
auto assemblies, which increased 10 percent to a 5.6 million unit annual
rate, as well as a sharp rise in raw steel production. Moreover, other
indicators suggest that activity in the industrial sector has strengthened:
new claims for unemployment insurance declined further during January,
and automakers announced recalls of workers in anticipation of a further
II-1

II-2
INDUSTRIAL PRODUCTION AND CAPACITY UTILIZATION
Industrial Production Index, 1967=100, Ratio Scale
Business Equipment
Manufacturing Capacity Utilization
200
180
160
140
120
100
Percent
100
80
60
1972 1974 1976 1978 1980 1982

II-3
INDUSTRIAL PRODUCTION
(Percentage change from preceding period;based on seasonally adjusted data)
1982 1982Q2 Q3 Q4 Oct. Nov. Dec.
---- annual rate------- ----monthly rate----
Total -6.5 -3.4 -8.6 -1.1 -.7 -.1
Final products -3.0 -3.0 -8.5 -1.0 -.7 .3Consumer goods -7.3 2.6 -7.6 -.8 -.8 .2
Durable 27.9 3.6 -20.4 -3.4 -1.6 1.9Nondurable 1.0 2.3 -2.6 .1 -.5 -.4
Business equipment -22.3 -17.2 -19.5 -2.7 -1.2 -.3Defense and space equipment 4.8 7.8 16.5 2.1 1.6 2.1
Construction supplies -8.6 8.7 -7.9 -1.5 -.3 -.8
Materials -11.1 -6.0 -10.0 -1.3 -1.1 -.4Durable goods -11.2 -7.3 -19.2 -3.0 -1.1 -.6Nondurable goods -10.0 -4.3 3.0 -.5 -1.4 .0Energy materials -12.5 -5.3 -5.6 1.4 -.6 -.5
CAPACITY UTILIZATION RATES: MANUFACTURING AND MATERIALS(Percent, seasonally adjusted)
1975 1978-80 1982Low High Average Oct. Nov. Dec.
Manufacturing industries 69.0 87.2 69.8 68.0 67.4 67.3
Primary processing 68.2 90.1 66.5 65.1 64.1 63.8Advanced processing 69.4 86.2 71.6 69.5 69.1- 69.1
Motor vehicles & parts 51.3 94.5 53.0 49.6 48.9 52.3
Materials producers 69.4 88.8 69.0 66.7 65.9 65.5
Durable goods materials 63.6 88.4 63.4 60.0 59.3 58.8Raw steel 68.0 100.7 48.7 41.1 39.0 37.8
Nondurable goods materials 67.2 91.6 72.6 72.2 71.1 70.9Energy materials 84.8 88.8 79.6 77.7 77.1 76.7

II-4
scaling up of assemblies. In addition, the recent increases in spot and
futures prices of industrialmaterials, particularly for copper and
other nonferrous metals, have been associated with reports of increased
demand. These positive signs were consistent with the survey of purchasing
managers that reported a firming of activity during January.
Despite the leveling off of production, nonfarm payroll employ-
ment in December fell 165,000--about the same as the average decline so
far in this recession--and the workweek was unchanged at a depressed
level. However, job losses in manufacturing slowed to a third of the
average monthly drop earlier in the year; rehiring at auto plants partly
offset continued weakness in machinery, and cutbacks in the metals indus-
tries were not as severe as in recent months. Employment at retail
stores fell another 65,000 in December; the cumulative loss of jobs
since the 1981 peak is about the same in relative terms as during the
1974-75 contraction. Construction employment continued to fall, partly
reflecting the decline in nonresidential building, which began last
summer; however, the overall weakness in construction employment may be
overstated because the establishment survey does not pick up new firms
that often are formed as residential construction recovers.
The unemployment rate rose one-tenth of a percentage point in
December to 10.8 percent, after revision to the seasonal adjustment
factors. The overall jobless rate is now 1.8 percentage points higher
than the 1975 peak rate, but the differential is larger for adult men
and smaller for adult women. The particularly high jobless rate for
adult men partially reflects the cumulative effect of the prolonged
weakness in the industrial sector during the last three years. Since

II-5
CHANGES IN EMPLOYMENT 1(Thousands of employees; based on seasonally adjusted data)
Peakto Peak
trough2 to 19821975 present2 Aug. Sep. Oct. Nov. Dec.
-Percent- --Average monthly changes-
Nonfarm payroll employment3 -2.8 -3.1 -233 -45 -407 -176 -166Strike adjusted -2.8 -3.1 -226 -40 -410 -182 -169Manufacturing -11.6 -14.4 -141 -100 -247 -142 -49
Durable -13.6 -18.1 -140 -93 -234 -111 -22Nondurable -10.0 -8.5 -1 -7 -13 -31 -27
Construction -17.6 -17.1 -28 -16 -27 -8 -30Trade -1.5 -1.8 -65 -58 -51 -51 -93Finance and services n.a. n.a. 7 43 -20 56 32Total government n.a. -4.3 37 91 -21 -11 4
Private nonfarm productionworkers -4.7 -4.3 -282 -85 -374 -190 -204
Manufacturing productionworkers -14.7 -19.9 -113 -81 -231 -129 -33
Total employment4 -2.3 -1.6 95 -140 -367 -40 -43Nonagricultural -2.3 -1.8 111 -74 -417 -93 12
1. Average change from final month of preceding period to final month of periodindicated.2. Peak is specific to individual series.3. Survey of establishments. Strike-adjusted data noted.4. Survey of households.
SELECTED UNEMPLOYMENT RATES(Percent; based on seasonally adjusted data)
1975 1982
peak2 Q1 Q2 Q3 Q4 Oct. Nov. Dec.
Total, 16 years and older 9.0 8.8 9.4 10.0 10.7 10.5 10.7 10.8
Teenagers 20.9 21.9 22.7 23.8 24.3 24.1 24.2 24.520-24 years old 15.5 13.9 14.5 15.1 16.1 15.8 16.3 16.0Men, 25 years and older 5.8 6.5 7.1 7.8 8.6 8.5 8.6 8.8Women, 25 years and older 7.5 6.6 7.2 7.3 7.9 7.6 7.9 8.2
White 8.4 7.7 8.3 8.8 9.5 9.3 9.6 9.7Nonwhite 9.2 16.0 17.0 17.7 18.6 18.4 18.5 18.8
Fulltime workers 4.5 8.6 9.3 9.8 10.6 10.5 10.6 10.8

II-6
the beginning of the recession, the overall labor-force participation
rate has remained relatively flat, in contrast to its earlier secular
rise. The number of discouraged workers rose another 200,000 in the
fourth quarter of 1982 and has climbed 800,000 since the second quarter
of 1981.
Inventory Investment
Recent adjustments in production and employment have reflected
efforts by firms to liquidate inventories in the face of the low level of
sales and high real credit costs. In November, these efforts were re-
inforced by an upturn in sales, and manufacturing and trade inventories
were slashed at an annual rate of $35.4 billion in 1972 dollars. Never-
theless, even though inventory holdings at the end of November were no
larger than in early 1981, sales had fallen to much lower levels, and
the response to this situation will continue to be a critical factor in
the near-term outlook for production.
Manufacturers reduced inventories at an annual rate of $18
billion in real terms during November, with liquidations reported for
virtually all key durable goods industries. Preliminary reports indicate
that manufacturers continued to liquidate inventories at a rapid rate in
December. Factory stocks were 3-1/4 percent below early 1981 levels,
but with shipments still 12 percent below the pace in the same period,
inventory-sales ratios remained only slightly below the peak levels of
last October. Producers of nonelectrical machinery and primary metals
continued to face the most serious imbalances between sales and inventories.
In the wholesale trade sector, where inventory changes have been
volatile, stocks were reduced in November at a $5.7 billion annual rate

II-7
THE RECENT BEHAVIOR OFMANUFACTURING AND TRADE INVENTORIES AND SALES
Manufacturing and Trade Inventories January 1981=1.0-and Sales ($1972)
Sales and Shipments
1980
1.04
Inventories
1.02
1.00Nov.
.98
I _ .96
I 1 \! V \/ \ .94I \ -
\Nov.
'II/ .92
III ll I .90
19821981

II-8
CHANGES IN MANUFACTURING AND TRADE INVENTORIES(Billions of dollars at annual rates)
19821980 1981 Q2 Q3 Q4 Oct.(r) Nov.(r) Dec.(p)
Book Value Basis
Total 38.4 37.5 -.1 10.6 n.a. -14.1 -68.1 n.a.Manufacturing 23.0 19.1 -19.8 -10.6 -23.1 -9.2 -29.0 -31.3
Durable 14.1 13.8 -7.1 -6.0 -20.4 -11.4 -30.2 -19.7Nondurable 8.9 5.4 -12.7 -4.6 -2.7 2.2 1.3 -11.6
Wholesale trade 10.6 6.7 15.7 2.3 n.a. .4 -14.6 n.a.Retail trade 4.9 11.6 4.1 18.9 n.a. -5.3 -24.5 n.a.
Automotive -2.0 3.5 1.4 14.1 n.a. -11.1 -21.2 n.a.
Constant Dollar Basis
Total -1.7 7.1 -3.2 3.4 n.a. -8.4 -35.4 n.a.Manufacturing .9 2.6 -7.3 -5.0 n.a. -7.5 -18.0 n.a.Wholesale trade .5 1.5 2.8 1.3 n.a. 2.9 -5.7 n.a.Retail trade -3.0 3.1 1.3 7.1 n.a. -3.8 -11.8 n.a.Automotive -2.6 .7 1.2 5.5 n.a. -5.4 -9.9 n.a.
INVENTORIES RELATIVE TO SALES 1
1974-75 1982Cyclical Cyclical 1982
Peak2 Peak2 Q2 Q3 Q4(p) Oct.(r) Nov.(r) Dec.(p)
Book Value Basis
Total 1.64 1.55 1.49 1.51 n.a. 1.55 1.51 n.a.Manufacturing 1.95 1.81 1.73 1.71 1.75 1.78 1.77 1.76
Durable 2.51 2.52 2.35 2.36 2.45 2.51 2.47 2.45Nondurable 1.39 1.18 1.12 1.09 1.12 1.12 1.13 1.13
Wholesale trade 1.24 1.27 1.18 1.23 n.a. 1.27 1.24 n.a.Retail trade 1.57 1.46 1.40 1.45 n.a. 1.43 1.37 n.a.
Automotive 2.17 2.02 1.69 2.01 n.a. 1.86 1.56 n.a.
Constant Dollar Basis
Total 1.76 1.81 1.73 1.76 n.a. 1.81 1.77 n.a.Manufacturing 2.18 2.20 2.10 2.10 n.a. 2.20 2.17 n.a.Wholesale trade 1.40 1.51 1.42 1.47 n.a. 1.51 1.47 n.a.Retail trade 1.49 1.49 1.45 1.50 n.a. 1.48 1.43 n.a.Automotive 2.05 2.01 1.79 2.01 n.a. 1.91 1.59 n.a.
1. Ratio of end-of-period inventories to average monthly sales for the period.2. Highs are specific to each series and are not necessarily coincident.(r) Revised estimates.(p) Preliminary estimates.

II-9
in constant dollars. The stock-sales ratio fell a bit from October's
cyclical peak, but still remained very high.
Liquidation of retail trade inventories increased sharply in
November. A rapid runoff of stocks held by auto dealers accounted for
most of the decline, as auto sales were buoyed by financing concessions.
These concessions were extended to all domestic models at the beginning
of 1983, and, with January's cautious production schedules, dealer inven-
tories were apparently brought below 60 days supply, traditionally con-
sidered a comfortable level. Aside from autos, general merchandise stocks
were reduced in November, but inventory holdings were still much out of
line with sales.
Personal Income and Consumer Spending
Personal income grew somewhat faster in December than in the
previous four months, reflecting a boost from farm support payments. In
the private nonfarm sector, however, income growth remained very weak as
payrolls were about unchanged for the fifth consecutive month. For the
fourth quarter as a whole, personal income was supported by the growth of
unemployment insurance payments as well as the increase in farm income;
the number of claimants receiving regular unemployment insurance benefits
rose through early November, and the new Federal Supplemental Compensation
Program extended the period of eligibility for most claimants. Because of
the sharp cutback in aggregate hours worked, private wages and salaries
declined in the fourth quarter for the first time since the first quarter
of 1975. In addition, falling interest rates reduced the growth of interest
income.

II-10
PERSONAL INCOME(Based on seasonally adjusted data)
19821981 1982 Q1 Q2 Q3 Q4 Oct. Nov. Dec.
- - percentage changes at annual rates 1 - -
Total personal incomeWage and salary
disbursementsPrivate
Disposable personal incomeNominalReal
Total personal income
Wage and salary disbursementsPrivateManufacturing
Other incomeTransfer payments
Less: personal contributionsfor social insurance
Disposable personal incomeNominalReal
10.4 5.2 2.6 6.9 6.4 4.8 6.6 4.5
8.4 2.7 2.8 4.0 3.5 .6 1.1 .08.7 2.0 2.1 3.7 3.2 -1.0 -2.4 -1.6
10.4 5.8 3.0 6.7 9.0 4.7 5.9 4.52.6 .6 -1.9 3.1 1.3 -.2 -2.1 3.6
- - changes in billions of dollars2 - -
7.1
1.8
17.9 11.6 7.0 15.9 10.3 13.2 14.3 9.8 15.5
8.8 3.6 4.0 6.8 2.47.1 2.2 2.7 5.6 1.61.1 -.8 -.2 .9 -1.7
1.3-1.1-2.3
1.4-2.5-4.3
.0-1.7-1.6
2.4.9
-1.0
10.3 8.5 4.2 9.5 8.1 11.9 12.9 9.7 13.22.9 3.9 1.3 3.1 5.5 5.7 9.4 6.0 1.6
1.2 .5 1.3 .4 .2 .0 .0 -. 1
15.2 11.0 7.1 10.4 15.71.7 1.1 .5 -.4 2.4
10.8 10.8 8.3 13.31.9 -1.8 3.2 4.4
Memorandum:Personal saving rate 6.4 6.5 6.6 6.7 6.9 5.8 6.2 5.5 5.8
1. Changes over periods longer than one quarter are measured from final quarter ofpreceding period to final quarter of period indicated.are compounded rates of change; monthly changes are not2. Average monthly changes are from the final month of
Changes for quarterly periodscompounded.the preceding period to the
final month of period indicated; monthly figures are changes from the preceding month.

II-11
RETAIL SALES(Percent change from preceding period;based on seasonally adjusted data)
Q2 Q3 Q4---quarterly rate--
Total sales 2.8 .0 3.0
1982Oct. Nov. Dec.-- monthly rate--
1.1 2.6 -.4
(Real) 1
Total, less autos andnonconsumption items
Total, less autos,nonconsumption items,and gasoline
GAF 2
Durable goodsAutomotiveFurniture &appliances
2.3 -1.2 2.4
.8 1.6 1.1
1.5 1.4 1.2
1.3 -.1 1.2
7.1 -3.6 7.211.4 -5.3 12.1
2.6 -1.3 1.7
.6 2.8 -. 4
.7 .4 .7
.7 .3 .8
.5 2.2 1.1
1.3 7.9 -1.82.9 12.5 -4.1
.9 1.9 2.2
Nondurable goodsApparelFoodGeneral merchandise 3
Gasoline
.9-1.82.02.1-4.8
1.0.3.4.5.4
.3-1.2
.11.5-.5
1. BCD series 59. Data are available approximately three weeks followingthe retail sales release.2. General merchandise, apparel, and furniture and appliance stores.3. General merchandise excludes mail-order nonstores; mail-order salesare also excluded in the GAF composite sales summary.
(Millions ofAUTO SALES
units; seasonally adjusted annual rates)
1982 1983
Q2 Q3 Q4 Oct. Nov. Dec. Jan.1
Total 7.5 7.8 8.6 7.6 9.5 8.7 n.a.
Foreign-made 2.0 2.2 2.5 2.3 2.6 2.6 n.a.
U.S.-made 5.5 5.6 6.1 5.3 6.8 6.1 6.3
Small 2.5 2.6 2.8 2.3 3.3 2.9 n.a.
Intermediate& standard 3.0 2.9 3.3 2.9 3.6 3.3 n.a.
Note: Components may not add to totals due to rounding.1. First 20-days.

II-12
Despite little income growth, consumer demand has been fairly
robust in recent months. Domestic auto sales averaged 6-1/2 million
units at an annual rate in November and December, benefiting from finan-
cing concessions on 1982 models. But 1983-model cars also have been
selling at a fairly brisk pace, representing the bulk of the 6.3 million
units sold in the first three weeks of January, as financing concessions
were extended to cover 1983 models as well. Demand for imported auto-
mobiles remained at a high 2.6 million unit annual pace in December,
capturing a record 29.6 percent share of all auto sales.
Outside the automotive area, retail sales for consumer goods
increased 0.7 percent in December, and increased in real terms as well.
Sales of general merchandise, furniture, and appliances advanced almost
2 percent in December; this was only partially offset by less spending
at apparel outlets and gasoline stations. Recent spending patterns are
consistent with the Michigan Survey that found an improvement in consumers'
appraisals of buying conditions for automobiles, houses, and large con-
sumer durables; more than half of the respondents thought it was a
good time to buy a car within the next year, the highest positive
response since 1978. Nevertheless, it is difficult to draw inferences
on the underlying demand for autos, because respondents in the Michigan.
Survey often react positively to special price concessions.
With consumption perking up toward year-end and payroll income
relatively flat, the personal saving rate dropped from an average of 6.7
percent in the first three quarters of the year to 5.8 percent in the
fourth quarter. The saving rate averaged about 6 percent during the last
5 years.

II-13
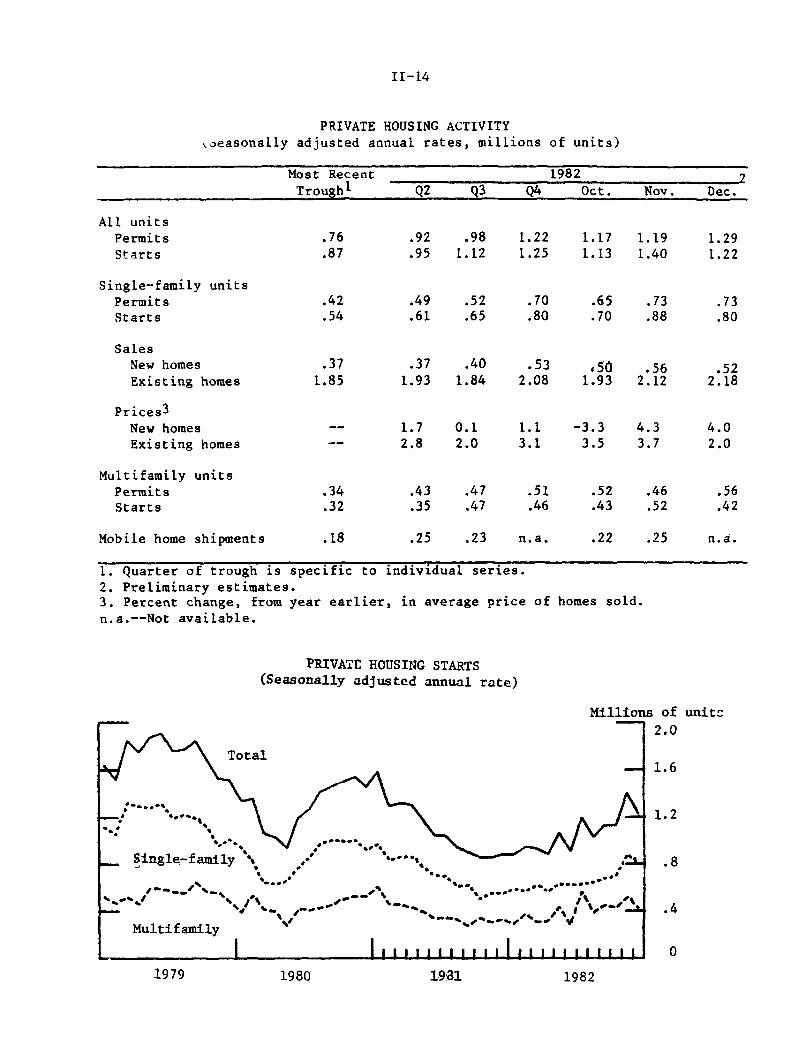
Housing
Activity in the housing market generally continued to trend up
as the cost of mortgage credit drifted lower. In December, private housing
starts fell a bit following a surge in November, but for the fourth quarter
as a whole, starts were nearly 45 percent above the cyclical low at the end
of 1981. All of the fourth quarter rise was for single-family units, as
starts of multifamily units edged down from the exceptional third-quarter
rate. At the same time, the number of building permits issued for resi-
dential construction rose further in December, mostly for multifamily
units; the advance in building permits has outpaced housing starts, as
happens from time to time during the early phases of housing recoveries.
Sales and prices of both new and existing houses have trended
up in recent months. Despite a decline in December, new home sales
in the fourth quarter were 43 percent above the recent cyclical low;
sales of existing homes were 12 percent higher. At the same time, the
average price of new homes sold edged up 1 percent from a year earlier;
existing home prices were up about 3 percent. However, both figures
may be influenced by changes in mix, quality, and financing concessions.
Business Fixed Investment
Real business fixed investment declined sharply again in the
fourth quarter of 1982, bringing the rate of investment 8.4 percent
below its peak attained in the fourth quarter of 1981. The decline
was concentrated in producers' durable equipment, although the value
of nonresidential construction fell a bit over the second half of
last year and now appears to be in a downswing as well. This contraction
II-14
PRIVATE HOUSING ACTIVITYSeasonally adjusted annual rates, millions of units)
Most Recent 1982 2Trough1 Q2 Q3 Q4 Oct. Nov. Dec.
All unitsPermits .76 .92 .98 1.22 1.17 1.19 1.29Starts .87 .95 1.12 1.25 1.13 1.40 1.22
Single-family unitsPermits .42 .49 .52 .70 .65 .73 .73Starts .54 .61 .65 .80 .70 .88 .80
SalesNew homes .37 .37 .40 .53 ,50 .56 .52Existing homes 1.85 1.93 1.84 2.08 1.93 2.12 2.18
Prices 3
New homes -- 1.7 0.1 1.1 -3.3 4.3 4.0Existing homes -- 2.8 2.0 3.1 3.5 3.7 2.0
Multifamily unitsPermits .34 .43 .47 .51 .52 .46 .56Starts .32 .35 .47 .46 .43 .52 .42
Mobile home shipments .18 .25 .23 n.a. .22 .25 n.a.
1. Quarter of trough is specific to individual series.2. Preliminary estimates.3. Percent change, from year earlier, in average price ofn.a.--Not available.
homes sold.
PRIVATE HOUSING STARTS(Seasonally adjusted annual rate)
Millions of units
2.0
- 1.6
J 1.2
.8.. _**
.4
IL1LL 0
1980 19311979 1982

II-15
BUSINESS CAPITAL SPENDING INDICATORS(Percentage change from preceding comparable period;
based on seasonally adjusted data)
1982Q2 Q3 Q4 Oct. Nov. Dec.
Nondefense capital goodsshipments -3.1 -3.5 -3.7 -4.0 .3 -1.0
Addendum: Sales of heavy-weight trucks (thousands) 1 173 168 162 129 162 194
Nonresidential construction 1.8 .2 -1.0 -1.8 1.2 -1.2
1. Annual rate.
BUSINESS CAPITAL SPENDING COMMITMENTS(Percentage change from preceding comparable period;
based on seasonally adjusted data)
1982Q2 Q3 Q4 Oct. Nov. Dec.
Nondefense capital goods orders 4.9 -4.4 2.4 -.4 -.1 2.0
Machinery -4.2 -5.1 2.9 -1.3 -3.3 7.3
Addenda: Ratio of currentdollar unfilled ordersto shipments
Total 5.84 5.73 5.82 5.90 5.82 5.85Machinery 4.25 4.04 4.18 4.35 4.11 4.16
Nonresidential building permits -14.9 -10.5 n.a. -23.0 10.7 n.a.

II-16
in construction has been fairly widespread, as spending for non-office
commercial buildings, public utility structures (for example, generating
plants), and oil- and gas-well drilling (GNP basis) all dropped somewhat.
Recent near-term indicators, while still depressed, have shown
some signs of revival. Orders for nondefense capital goods rose 2 percent
in December, and in the fourth quarter were almost 2.4 percent above the
third-quarter pace. In December, orders were about 3 percent below
shipments, a significant improvement from a gap that averaged 9 percent
for the first 11 months of 1982. A narrowing of the gap is a positive
sign because an increase in orders above the level of shipments will
eventually lead to an upturn in shipments as well.
In contrast, near-term indicators of nonresidential structures
suggest further declines in the months ahead. While construction of
commercial office buildings--about one-fifth of nonresidential structures--
continued to rise through most of 1982, it registered a decline in December.
In addition, vacancy rates jumped to a high level in the second half of
1982 and permits for nonresidential construction remained very low,
despite a 10.7 percent increase in November.
The annual Commerce Department Survey of plant and equipment
spending plans for 1983, taken in November and December, points to con-
tinued weakness this year. Businesses intend to lower nominal capital
spending by 1.3 percent in 1983. This translates into a 5.2 percent
real decline, given the respondents' inflation expectations of around 4
percent for capital goods, and follows a 4.8 percent real decline in

II-17
NONRESIDENTIAL COMMERCIAL STRUCTURESAND VACANCY RATES FOR COMMERCIAL OFFICE SPACE
Expenditures for NonresidentialStructures--Commercial Buildings Billions of $72
* Source: Building Owners & Managers Association.

II-18
SURVEYS OF PLANT AND EQUIPMENT EXPENDITURES(Percent change from prior year)
CommerceDepartmentJan. 1983
Planned for 1983
McGraw-Hill2
Fall 1982Merrill-Lynch2
Fall 1982
All Business
Manufacturing
Durables
Nondurables
NonmanufacturingMining
TransportationUtilitiesTrade and Services
Communications andother
-.5-3.3-6.3-.41.3-4.8-2.08.4.1
-1.3-2.6-1.0-3.9-.602.51.0-3.9.5
.9 -1.1
1. Growth in actual expenditures reported in the January Commerce Survey.2. Not strictly comparable to Commerce Survey.3. Includes only commercial category.4. Includes commercial and other.5. Includes communication only.
ERROR HISTORY OF ANNUAL SURVEYS 1
2 2Year Commerce Department McGraw-Hill Merrill-Lynch
1970* 3.8 2.8 1.51971 -.5 .5 1.11972 .2 -2.6 .11973 .1 -2.2 -2.81974* -.7 .9 -1.01975* 4.3 11.5 9.71976 -1.3 2.0 -3.91977 -1.4 .3 .81978 -3.2 -2.2 -3.11979 -3.9 -5.2 -6.11980* 1.3 .2 -1.91981* 1.7 3.2 -1.71982* 6.9 8.9 6.8
Mean Absolute Error 2.3 3.3 3.1
1. Anticipated less actual percent change.2. Fall Survey taken in October and November of 1982.* Recession year
11982Survey(Actual)
-2.1-2.5-.7-4.1-1.8
-13.5-10.4-3.84.63
-1.7-.1-1.31.1
-2.810.1-5.5-5.1
-10.24
-7.0 15.3

II-19
1982. Both the Merrill-Lynch and McGraw-Hill fall surveys are roughly
consistent with the Commerce survey. However, these capital spending
surveys generally overstate the weakness in investment at business cycle
troughs.
Federal Government
A sharp increase in federal purchases helped to boost the growth
of real final sales in the last quarter of 1982. Despite a deceleration
of defense spending from its rapid growth earlier in the year, total
federal purchases rose 28 percent at an annual rate. Most of the increase
reflected a further rise in Commodity Credit Corporation purchases to a
record level.
The federal government budget deficit was about $68 billion in
the final quarter of 1982, on a unified basis, compared with $48 billion
a year earlier (quarterly rates, not seasonally adjusted). The larger
deficit reflected a sharp rise of about $11 billion in expenditures and
a falloff in revenues of about $9 billion over the four-quarter period.
Almost half of the drop in revenues resulted from sagging corporate
taxes. In addition to the record CCC purchases, outlays were boosted by
sizable increases in defense and transfer payments.
In its "lame duck" session, Congress established basic funding
levels for the federal government for all of fiscal year 1983, partially
through appropriations bills and, for the remainder of government, through
a second continuing resolution. In total, last minute Congressional actions
appear to have raised outlays about $10 billion above levels consistent
with the earlier Congressional Budget Resolution; about a third of this amount
may be attributable to extended supplemental unemployment benefits and

II-20
the new highway program latter, of course, was offset by a tax in-
crease).
The Administration submitted a FY1984 budget at the end of
January. The document indicated that the Administration now anticipates
a FY1983 deficit of $208 billion and projects a $189 billion deficit for
1984. Details of the budget will be provided in the supplement to this
Greenbook.
Among other items, the budget requests an FY1984 freeze on
cost-of-living adjustments in federal government pay and benefits and
certain other programs and adopts the recommendations of the National
Commission on Social Security Reform that were submitted January 20. To
improve the ability of the social security system to meet its obligations
over the remainder of the decade, this Commission recommended (1) a six-
month deferral of the July 1983 cost-of-living adjustment, (2) partial
taxation of benefits received by upper income households, (3) acceleration
of payroll tax increases, and (4) a number of other changes, including
coverage for new Federal workers. According to the Commission report,
these recommendations are expected to inject about $170 billion into the
trust fund from 1983 through 1989.
State and Local Government
Real purchases of goods and services by state and local govern-
ments rose slightly in the fourth quarter, remaining almost unchanged
over the year as a whole. This contrasts with the steady decline in
real purchases over 1981. The increase during the fourth quarter of
1982 was concentrated in construction, which rose 9.4 percent at an
annual rate in real terms. In contrast, compensation, the largest

II-21
component of state and local government purchases, fell slightly in
real terms.
Inflation and Labor Costs
The consumer price index was about unchanged near year-end,
rising 0.1 percent in November and falling 0.3 percent in December. For
the year as a whole, the CPI rose 3.9 percent, less than half the 1981
pace. Producer prices of finished goods rose even less rapidly, 3-1/2
percent in 1982. Sharp declines in mortgage rates held down the CPI
last year, and weak markets for food and energy contributed to price
deceleration. But the reduction in inflation also occurred in many
other sectors. Prices of consumer commodities other than food, energy,
houses, and used cars rose 4 percent last year, the smallest increase
since 1972. Service prices, excluding energy items and homeownership
costs, advanced 7 percent last year, about 3-1/2 percentage points
less than their 1980-81 average.
In the investment sector, the easing of inflation also was
striking. Producer prices of capital equipment rose 4 percent, the
slowest pace since 1972. Construction prices, which are not reflected
adequately in the PPI or CPI, also slowed dramatically last year; the
price index for nonresidential structures advanced 3.4 percent over
the four quarters of last year, down from about 7-1/2 percent in 1981,
while prices for residential structures were actually flat for the
first time in more than a decade.
Labor costs also slowed further last year as wage increases
moderated in response to reduced inflation, high unemployment, and efforts

II-22
(Percentage chaSELECTED MEASURES OF INFLATION
Sat annual rates; based on seasonally adjusted data)1
Relativeir- rtance-ec. 1981 1980 1981 1982
1982Q3 Q4 Nov.
BEA vixed-IWeighted Price Indexes
GNPPersonal consumption
Fixed inves t aent
Business fixed investmentResidential structures
Gross business product
Consumer Price Index
10.310.99.3
10.27.7
5.05.32.74.3
.0
5.97.32.84.3
.1
10.3 8.9 4.8 5.9 4.7
CPI, All itemsFoodEnergyHomeownershipAll items less food,ener y, and homeowner-shipUsed carsOther commodities 2
Other services 2
CPI, Experimental 3
Producer Price Index
PPI, Finished goodsConsumer foodConsumer energyOther consumer goodsCapital equipment
PPI, Int. Materials4
PPI, Crude MaterialsFoodEnergyOther
100.016.611.126.1
49.83.3
19.926.6
100.0
100.021.912.744.620.8
94.7
50.733.615.7
12.410.218.116.5
9.918.38.1
10.3
8.94.3
11.910.1
9.420.3
6.110.6
3.93.11.31.4
6.010.94.06.9
4.2.6
5.5.4
6.116.0
3.98.4
1.1.6
-4.0-9.9
5.819.64.05.1
.8
.8-6.8-9.7
2.424.4
.64.5
-3.3-1.7-7.7
-20.5
6.117.83.92.9
10.8 8.5 5.0 6.4 5.2 5.4 3.1
11.87.5
27.810.411.4
7.11.4
14.17.19.2
12.4 7.3
8.626.97.5
-14.022.8
-11.4
3.52.1-.15.04.0
4.2-7.433.33.33.8
4.8-.98.47.04.3
7.6-1.934.36.63.4
.8
.9-8.9
.56.8
.3 2.4 1.8 6.1 .4
1.42.4
-7.6
-26.49.45.5
-6.55.1
-8.6
11.719.8
-15.4
-8.0-14.6-11.0
1. Changes are from final month ofindicated, except BEA measures arefinal quarter of period indicated;
preceding period to final month of periodfrom final quarter of preceding period tomonthly changes at simple annual rates and
quarterly changes at compound rates.2. Includes the home maintenance and repair items of homeownership costs.3. BLS experimental index for "All items"-CPI-U-X1-which uses a rentalequivalence measure for homeownership costs.4. Excludes materials for food manufacturing and animal feeds.
Dec.r

II-23
SELECTED MEASURES OF LABOR COSTS IN THE NONFARM BUSINESS SECTOR(Percentage change at annual rates; based on seasonally adjusted data)
1982 Last Six1980 1981 1982 Q2 Q3 Q4 Months
Hourly earnings index, wages of production workers1June 1982-Dec. 1982
Total private nonfarm
ManufacturingContract constructionTransportation and
public utilitiesTradeServices
9.6 8.4 5.9
10.9 8.8 6.17.7 8.1 4.9
9.3 8.5 5.98.8 7.1 4.89.5 9.1 6.5
6.4 6.2 4.5
6.6 6.4 2.92.3 3.4 4.8
6.0 4.5 5.76.4 4.5 4.67.6 8.5 5.0
Employment cost index, wages and salaries of all persons2 ,3,41982-Q3 to
1982-Q4
TotalBy occupation:
White collarBlue collarService workers
By bargaining status:UnionNonunion
9.0 8.8 6.5
8.7 9.1 6.99.6 8.6 5.78.1 8.3 7.6
10.9 9.6 7.28.0 8.5 5.3
Major collective bargaining settlements, first-year
4.8 7.2 n.a.
5.3 8.0 n.a.3.8 6.6 n.a.8.3 6.3 n.a.
5.8 8.2 n.a.3.7 8.7 n.a.
wage adjustments
Contracts with COLAsContracts without COLAs
8.0 8.0 2.211.7 10.6 7.0
1982-Q2 to1982-Q4Labor costs and productivity, all persons1
Compensation per hourOutput per hourUnit labor costs
10.6.3
10.2
8.8 6.6-.1 1.98.9 4.6
6.1 6.6 6.0.8 3.4 2.7
5.2 3.1 3.2
1982-Q3 to1982-Q4Employment cost index, compensation
2 ,4 ,5
Compensation per hour 9.8 9.8 6.9 5.4 8.1 n.a.
1. Changes are from final quarter of preceding period to final quarter of periodindicated. Quarterly changes at compound rates.2. Changes are from final month of preceding period to final month of period indicated.Quarterly changes at compound rates.3. Seasonally adjusted by FRB staff.4. Changes for 1982 are for year to date (1981-Q4 to 1982-Q3) at annual rates.5. Not seasonally adjusted.
5.2
4.15.6
5.04.26.3
6.1
6.55.27.3
7.16.2
Y V 1 I

II-24
by employers to restore profits. Labor productivity posted a gain of 2.7
percent (annual rate) in the fourth quarter, and rose 1.9 percent over the
four quarters of 1982. While advances in productivity often occur near
cyclical troughs in overall activity, the recent increases in output per
hour appear somewhat better than would have been expected given the anemic
productivity performance of the 1970's and the drop in output last year.
Virtually all wage measures slowed to around 6 percent in
1982, compared with 8 to 10 percent in the preceding year. Wages for
production workers, as measured by the hourly earnings index, decelerated
to 4-1/2 percent in the fourth quarter, following a 6-1/2 percent pace
earlier in the year. The slowing was especially noticeable in manufac-
turing where concessions in some industries, such as autos, had eliminated
annual improvement factors and some cost-of-living adjustments. Earnings
of white-collar workers also began to slow in 1982. Hourly compensation--
which includes fringe benefits as well as wages and salaries--rose at a 6
percent annual rate in the fourth quarter, bringing the four-quarter in-
crease in 1982, at 6-1/2 percent, to the lowest rate since the period of
wage and price controls in 1972.
Recent trends in collective bargaining point to further improve-
ment in wage trends this year. The slowing last year in overall wage
increases for the 8-1/2 million workers covered by major union contracts
involving 1,000 or more workers, from 9.5 percent in 1981 to 6.7 percent,
was attributable to both reduced COLAs and to smaller new settlements.
New settlements in 1982 were dominated by wage concessions made
early in the year. For the year as a whole, unionized workers negotiated

II-25
wage increases that averaged 3.8 percent in the first contract year;
when they last bargained almost 3 years ago, the same parties received
first-year wage adjustments of 7.9 percent. Much of the deceleration in
union wages last year occurred because almost half of bargaining workers
received no scheduled wage increases, although most will receive COLAs.
In addition, many workers--particularly auto workers and truckers--who
reached agreements in 1982 will receive no annual improvement factor over
the life of their contracts; this should moderate union wage change over
the next two years.

II-26
EFFECTIVE WAGE CHANGE IN MAJOR UNION CONTRACTS(Percent)
"Contribution of:COLA '''
New Settlements 12Prior Settlements
..... ...
..... . . .
6
3
1976 1977 1978 1979 1980 1981 1982
NEGOTIATED IRST-YEAR WAGE RATE ADJUSTMENTS UNDERNEW MAJOR COLLECTIVE BARGAINING SETTLEMENTS1
(Percent change)
1980 1981 1982
All Industries 9.5 9.8 3.82Number of workers (thousands) 3,791 2,382 3,257
Contracts with COLAs 8.0 8.0 2.2Number of workers 2,295 659 2,162
Contracts without COLAs 11.7 10.6 7.0Number of workers 1,496 1,723 1,095
Distribution (percent)
Decreases 0 5 2No wage changes 0 3 430-4 percent 4 3 74-8 percent 25 9 238-12 percent 52 55 2112 percent and over 18 26 3
1. Contracts covering 1,000 or more workers; estimates exclude potentialgains under cost-of-living clauses.2. These same parties received first-year increases of 7.9 percent in priorsettlements.

III-T-1
SELECTED FINANCIAL MARKET QUOTATIONS1
(Percent)
1981 1982 1983 Change from:FOMC FOMC FOMC FOMC
highs Oct. 5 Dec. 21 Feb. 1 Oct. 5 Dec. 21Short-term rates
Federal funds2
Treasury bills3-month6-month1-year
Commercial paper1-month3-month
Large negotiable CDs3
l-month3-month6-month
Eurodollar deposits 2
1-month3-month
Bank prime rateTreasury bill futuresMar. 1983 contractSept. 1983 contract
Intermediate- and long-term rates
U.S. Treasury (constant3-year10-year30-year
Municipal (Bond Buyer)
Corporate--Aaa utilityRecently offered
20.06
17.0115.9315.21
18.6318.29
18.9019.0118.50
19.8019.56
21.50
14.2014.07
maturity)16.5915.8415.21
13.30
17.72
10.77
8.149.189.66
10.2310.42
10.3310.7210.98
11.2311.59
13.50
8.9310.56
11.6211.6.11.81
10.484
13. 27e
8.69 8.4 7 p
7.908.018.11
8.168.268.30
8.48 8.358.43 8.43
8.598.628.78
8.488.689.02
9.44 9.05p9.56 9.33p
11.50 11.00
7.85 8.288.63 8.86
9.8710.5410.53
9.9410.7810.95
S&L fixed-rate mort-gage commitment 18.63 15.135 13.635 13.105 -2.03 -.53
1981 1982 1983 Percent change from:FOMC 1981 FOMC
highs Dec. 21 Feb.l highs Dec. 21Stock PricesDow-Jones Industrial 1,024.05 1030.26 1059.79 3.5 2.9NYSE Composite 79.14 79.74 82.61 4.4 3.6AMEX Composite 380.36 328.48 359.78 -5.4 9.5NASDAO (OTC) 223.47 228.52 248.15 11.0 8.6
1. One-day quotes except as noted. 4. One-day quotes for preceding Thursday.2. Averages for statement week closest to3. Secondary market.
date shown. 5. One-day quotes for preceding Friday.p--preliminary. e--estimated.
-2.30
.02-. 92
-1.36
-1.88-1.99
-1.85-2.04-1.96
-2.18-2.26
-2.50
-. 65-1.70
-1.68-.91-.86
-. 82
-1.15
-.22
.26
.25
.19
-.130
-.11.06.24
-.39-. 23
-.50
.43
.23
-.39
.16
10.054 9.664
11.96e 12.12p

DOMESTIC FINANCIAL DEVELOPMENTS
Growth in the monetary aggregates was exceptionally rapid in January,
with expansion in M2 surpassing previous records by a wide margin. Move-
ments in the aggregates were distorted by shifts into the newly authorized
money market deposit accounts and, to a lesser extent, super NOW accounts.
The heavily promoted MMDAs, in many cases offered at yields far above mar-
ket interest rates, prompted large shifts among the components of M2, and
evidently attracted substantial amounts of funds from large time deposits
and other market instruments.
Market interest rates have changed relatively little on balance since
the December FOMC meeting. After moving down at first, rates more recently
have firmed as market expectations of a further cut in the discount rate
were damped by the rapid growth in the aggregates, increased focus on
federal financing requirements, and some signs of strengthening in the
economy. Lagging behind other rates, both the bank prime lending rate to
business and the mortgage commitment rate at S&Ls dropped about 50 basis
points. In consumer credit markets, the automobile finance companies
extended their reduced-rate lending programs to cover all 1983 models as
well as leftover 1982 vehicles.
The Treasury has continued to raise large amounts of funds, as feder-
al cash needs in the current quarter rival the record fourth-quarter volume.
Borrowing by state and municipal units slackened somewhat in January with
the passing of certain year-end borrowing deadlines, but has remained strong
by pre-1982 standards. Nonfinancial businesses continued to lengthen the
maturity structure of their debt last month, issuing new bonds in the domes-
tic and Euro- markets while repaying part of their shorter-term debt. In
III-1

III-2MONETARY AGGREGATES
(Based on seasonally adjusted data unless otherwise noted) 1
L9Z_ 1983 QIV '81
toQ2 Q3 Q4 Nov. Dec. Jan.P QIV '82
Jan. '82
to
Jan. '83P
-Percentage change at annual rates--
Money stock measures1. Ml2. (Ml) 2
3. M24. M3
Selected components5. Currency
3.3(4.5)
9.510.7
3.5(4.6)9.8
12.1
16.1(14.4)8.88.3
16.9(17.5)11.6
9.6
8.8(9.1)7.31.3
12.0(4.8)31.013.1
8.5(8.4)
9.810.3
7.7(7.6)11.410.2
9.3 6.9 6.8 3.7 10.0 10.9 7,9 8.2
6. Demand deposits
7. Other checkable deposits
8. M2 minus Ml (9+10+11+14)
9. Overnight RPs and Eurodollars, NSA3
10. General purpose and broker/dealermoney market mutual fund shares, NSA
11. Commercial banks12. savings deposits, SA, plus
MMDAs, NSA13. small time deposits14. Thrift institutions15. savings deposits, SA, plus
MMDAs, NSAZ16. small time deposits
17. M3 minus M2 (18+21+22)
18. Large time deposits19. at commercial banks, net 5
20. at thrift institutions21. Institution-only money market
mutual.fund shares, NSA22. Term RPs, NSA
MEMORANDA:23. Managed liabilities at commercial
banks5 (24+25)24. Large time deposits, gross 6
25. Nondeposit funds6
26. Net due to related foreigninstitutions, NSAo
27. Other6 ,7
28. U.S. government deposits at comercialbanks
8
-5.8 -1.4 11.9 10.7 10.1 -3.5 1.0 0.1
19.6 11.4 41.2 52.2 8.3 48.5 33.7 30.1
11.5 11.7 6.6 9.9 6.8 37.0 10.2
-8.4 15.2 23.8 31.3 -40.7 78.9 24.8
21.4 31.7 9.9 16.3 -58.5 -112.9 26.417.2 12.2 8.5 9.1 32.6 103.7 12.3
2.0 -9.7 35.0 35.4 169.8 482.7 9.023.8 21.3 -1.8 -0.9 -23.0 -73.6 13.86.0 6.4 3.6 7.4 6.6 17.6 4.5
0.6 -7.8 32.6 31.0 89.6 241.6 8.98.1 11.7 -6.8 -1.4 -25.1 -77.3 2.8
16.9 23.8 5.6 0.0 -27.2 -75.3 12.9
19.1 19.6 0.4 -7.419.9 21.4 -6.2 -20.215.5 11.5 30.4 49.2
-27.5-35.0
5.5
12.6
12.5
3.823.2
65.24.66.5
61.1-4.3
-82.6-91.4-48.9
15.2 104.0 31.1 13.4 -58.3 -52.9 40.1 26.86.2 -25.7 28.8 84.3 3.6 -3.6 -5.7 3.1
-Average monthly change in billions of dollars--
1.6 -4.1 -4.0 -13.85.7 -6.5 -7.0 -13.4
-4.1 2.4 3.0 -0.4
-4.4 -0.70.3 3.2
3.1-0.1
n.a.-28.2n.a.
2.32.9
-0.6
-2.9 n.a. -1.72.5 n.a. 1.1
n.a.-5.5n.a.
n.a.n.a.
-2.5 0.2 0.3 -3.8 1.7 4.0 0.0
1. Quarterly growth rates are computed on a quarterly average basis. Dollar amounts shown under memoranda for
quarterly changes are calculated on an end-month-of-quarter basis.2. Ml seasonally adjusted using alternative model-based procedure applied to weekly data.3. Overnight and continuing contract RPs issued to the nonbank public by commercial banks, net of amounts heldby money market mutual funds, plus overnight Eurodollar deposits issued by Caribbean branches of U.S. memberbanks to U.S. nonbank customers. Excludes retail RPs, which are in the small time deposit component.4. Beginning December, 1982, growth rates are for savings deposits, seasonally adjusted, plus money marketdeposit accounts (MMDAs), not seasonally adjusted. Savings deposits excluding MMDAs declined at commercialbanks at annual rates of 20.5 percent . December and 28.3 percent in January. At thrift institutions, savingsdeposits excluding HMDAs declined dur ; December and January at annual rates of 12.1 percent and 62.4 percent,respectively.5. Net of large-denomination time deposits held by money market mutual funds and thrift institutions.6. Adjusted for shifts of assets and liabilities to International Banking Facilities (IBFs) which affectedflows from December 1981 to September 1982.7. Consists of borrowings from other than commercial banks in the form of federal funds purchased, securitiessold under agreements to repurchase and other liabilities for borrowed money (including borrowings from theFederal Reserve and unaffiliated foreign banks), loans sold to affiliates, loan RPs and other minor items.Data are partially estimated.8. Consists of Treasury demand deposits at commercial banks and Treasury note balances.p--Preliminary.n.a.--not available.

III-3
the closing months of 1982, households stepped up their installment borrow-
ing and arrangement of commitments for home mortgage loans; with this
momentum and the further decline in credit costs, it seems likely that net
credit flows to this sector continued to expand moderately in January.
Monetary Aggregates and Bank Credit
Recent money stock behavior has been influenced greatly by the intro-
duction of the MMDA in mid-December and the super NOW account in early
January.1 Owing to heavy promotional activity and above-market offering
rates that have dropped moderately from initial levels, depository institu-
tions have received massive inflows to MMDAs, which by late January reached
$200 billion in total. Commercial banks have garnered about 60 percent of
these deposits.
Super NOW accounts--introduced on January 5 with less fanfare and
substantially lower interest rates than MMDAs, as well as hefty fees on
small or medium-sized accounts-appear to have attracted smaller, though
still significant, inflows. Super NOWs totaled about $16 billion in the
second statement week after their introduction. This buildup partly
reflected reallocations within M1, and inflows to super NOWs from outside
M1 were roughly offset by outflows from M1 balances into MMDAs. Still,
Ml expansion picked up to an estimated 12 percent annual rate in January
after a dip in December to just below the double-digit pace of the preced-
ing four months, a rebound which suggests that the underlying demand for
Ml remains strong.
M2 growth soared to a record 31 percent annual rate in January as
a result of sizable inflows to MMDAs from non-M2 sources. Nevertheless,
1. MMDA and super NOW account developments are discussed in greater detail
in Appendix A.

III-4
COMMERCIAL BANK CREDIT AND SHORT- AND INTERMEDIATE-TERM BUSINESS CREDIT(Percentage changes at annual rates, based on seasonally adjusted data)1
1982 QIV '81to
Q2 Q3 04 Oct. Nov. Dec. QIV '82
-Colmercial Bank Credit--
1. Total loans and investmentsat banks2 ,3 8.0 5.8 6.3 6.8 1.5 10.5 7.8 4
2. Investments 3 4.7 4.8 15.9 12.1 9.0 26.1 6.5
3. Treasury securities 4.9 8.3 43.0 41.6 40.2 42.7 13.5
4. Other securities3 4.8 3.0 2.5 -2.5 -7.1 17.3 3.1
5. Total loans2 ,3 9.1 6.2 3.0 4.9 -1.0 5.1 8.2
6. Business loans 2 , 3 15.0 9.0 -. 2 6.7 -7.3 .0 11.7
7. Security loans -26.8 63.6 37.2 85.0 -39.7 66.7 15.9
8. Real estate loans 6.6 2.8 4.9 3.6 4.4 6.4 5.9
9. Consumer loans 2.8 3.0 4.6 2.5 1.9 9.5 3.3
--Short- and Intermediate-Ters Business Credit--
10. Total short- and intermediate-term business credit (*um of
lines 14, 15 and 16)' 13.2 9.2 n.a. -1.5 -9.9 n.a. n.a.
11. Business loans net of bankersacceptances3 15.9 9.0 .6 6.6 -4.5 -.3 12.1
12. Comercial paper issued by non-financial firms' 16.8 -6.0 -59.9 -71.4 -69.4 -48.4 1.0
13. Sum of lines 11 6 123 16.0 7.0 -7.1 -3.4 -12.6 -5.6 10.7
14. Line 13 plus loans at foreignbranches3 ,6 15.8 8.3 -7.3 -3.5 -12.9 -5.6 11.3
15. Finance company loans to business7 1.5 15.8 n.a. -5.7 -24.4 n.a. n.a.
16. Total bankers acceptances outstanding7 10.2 6.6 n.a. 14.7 27.4 n.a. n.a.
1. Average of Wednesdays for domestically chartered banks and average of current and preceding ends of months forforeign-related institutions.2. Loans include outstanding amounts of loans reported as sold outright to a bank's own foreign branches, uncon-solidated nonbank affiliates of the bank, the bank's holding company (if not a bank), and unconsolidated nonbanksubsidiaries of the holding company.3. Adjusted for shifts of assets and liabilities to International Banking Facilities (IBFs) which affected flowsfrom December 1981 to September 1982.4. Growth of bank credit from the FOMC's December-January base through the fourth quarter of 1982, not adjustedfor shifts of assets from domestic offices to ISFs, was at an annual rate of 7.1 percent. Adjusted for suchshifts after January, growth over this period was 7.6 percent.5. Average of Wednesdays.6. Loans at foreign branches are loans made to U.S. firms by foreign branches of domestically chartered banks.7. Based on average of current and preceding ends of month.n.a--Not available.
III-5
inflows to MMDAs from outside M2 were small relative to shifts originating
within the nontransactions component of M2. Substantial amounts were trans-
ferred from retail RPs and 7- to 31-day deposits that had been widely used
as "bridge" accounts for MMDAs, but other small time deposits, passbook
savings accounts, and shares in money market mutual funds all declined
markedly as well. Outflows from the M2-type money funds amounted to about
$25 billion between the mid-December introduction of MMDAs and late January.
M3 growth, though projected to have picked up to a 13 percent annual
rate in January from the weak December pace, was well below M2 growth in
both months, as large time deposits and shares in institution-only MMMFs
contracted sharply. Declines in large time deposits partly reflected
direct shifting to MMDAs and partly curtailment of CD issuance by deposi-
tory institutions in response to the surge in "core" deposits. 1 Some of
the decline in institutional MMMFs may also have resulted from transfers
to MMDAs, but it seems more likely that investors were reacting primarily
to the higher returns available on competing market instruments, particu-
larly during late December. More recently, with money fund yields improv-
ing again relative to other market rates, institution-only funds have rea-
lized a moderate net inflow.
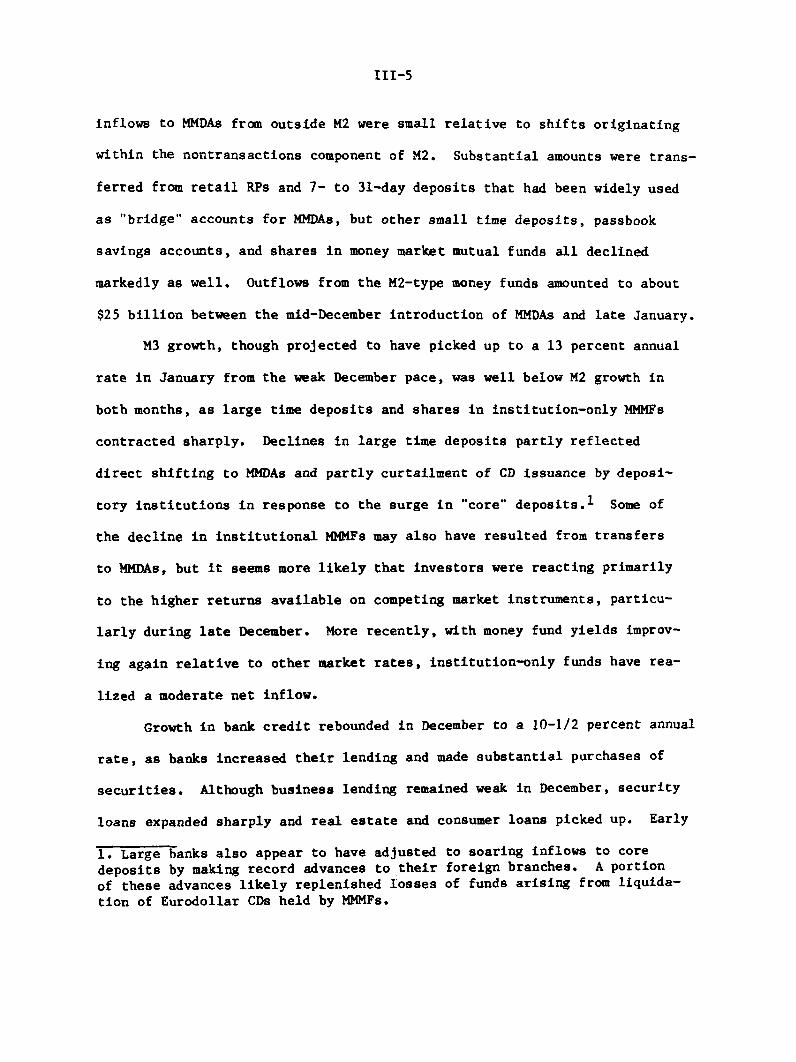
Growth in bank credit rebounded in December to a 10-1/2 percent annual
rate, as banks increased their lending and made substantial purchases of
securities. Although business lending remained weak in December, security
loans expanded sharply and real estate and consumer loans picked up. Early
1. Large banks also appear to have adjusted to soaring inflows to core
deposits by making record advances to their foreign branches. A portion
of these advances likely replenished losses of funds arising from liquida-
tion of Eurodollar CDs held by MMMFs.

III-6
GROSS OFFERINGS OF SECURITIES BY U.S. CORPORATIONS
(Monthly totals or monthly averages, millions of dollars)
1982 1983
P P P fHi Q3 Q4 Nov. Dec. Jan.
---------------Seasonally adjusted----------------
Corporate securities--total
Securities sold in U.S.
Publicly offered bondsl
Privately placed bonds
Stocks 2
Securities sold abroad3
6,247 9,436 10,879 11,515 11,012
4,8672,184
5932,090
8,4105,008
9172,485
1,380 1,026
10,1206,610
6002,910
10,3506,550
7003,100
759 1,165
10,8756,875
7003,300
9,900
7,9004,700
7002,500
137 2,000
----Domestic offerings, not seasonally adjusted----
Publicly offered bonds--total 1
By industryUtilityIndustrialFinancial
By quality 4
Aaa and AaA and.BaaLess than BaaNo rating (or unknown)
Memo items:Convertible bondsOriginal discount bonds
Par valueGross proceeds
2,348 4,574
816520
1,012
825937173413
113
1,020345
9701,9711,633
1,8351,836
235668
5,140 5,000 4,000 3,800
1,3601,9401,840
1,9002,265
550425
1,2302,4101,360
1,5102,340
620530
1,0301,2051,765
1,5801,625
465330
649
650 1,094229 184
235 2,800209 124
2,040 2,251 3,045 2,800 3,800 2,300Stocks--total2
By industryUtilityIndustrialFinancial
610967463
728 1,080969 1,465554 500
p--preliminary, f--forecast.1. Total reflects gross proceeds rather than par value of original discount bonds.
2. Includes equity issues associated with debt/equity swaps.
3. Notes and bonds, not seasonally adjusted.
4. Bonds categorized according to Moody's bond ratings.
7001,600
500
1,8001,700
300

III-7
indications are that bank credit growth remained strong in January, led by
further large acquisitions of securities, especially Treasuries.
Business Finance
Net funds raised in markets by nonfinancial corporations plunged in
the fourth quarter of 1982, according to preliminary estimates, as firms
curtailed expenditures for fixed capital and liquidated inventories at a
brisk pace. With yields in stock and bond markets down considerably from
mid-1982, businesses concentrated their fund-raising in the longer-term
securities markets, issuing large amounts of long-term debt and equity.
At the same time, business loans at banks contracted during the final two
months of 1982, and outstanding commercial paper, which had begun to
decline in August, continued to run off sharply through year-end.
SOURCES AND USES OF FUNDS BY NONFINANCIAL CORPORATIONS(Billions of dollars, seasonally adjusted annual rates)
1980 1981
1. Capital expenditures 220.5 260.92. less U.S. internal funds & IVA1/ 185.6 222.63. equals Financing Gap 34.9 38.3
4. plus Other uses of funds, net1/ 60.8 54.35. equals External financing needs 95.7 92.6
6. Net funds raised in markets 95.7 92.6Net equity issues 12.9 -11.5Bonds 42.7 35.7
Mortgages 2.0 -1.1Loans & short-term paper 38.1 69.6
* Rounds to 0. p--preliminary.1. Excludes net foreign earnings retained abroad.
In January, flotation of long-term securities
growth in bank loans appears to have resumed,
cial paper market continued to decline.
1982p
24423113
7790
904493737
Q1
240.9228.512.3
95.7108.0
108.0-5.333.9-.3
79.7
Q2
247.5227.520.0
73.994.0
94.05.0
29.4-.7
60.3
198203
263.2234.828.3
69.698.0
98.00.059.4-.138.7
-PQ4
232233-1
3938
381558
1-36
remained relatively strong and
while borrowing in the commer-

III-8
Domestic bond offerings dropped off in January, but a sharp increase
in bonds sold abroad appears to have left total issuance for the month
about unchanged from December. Fewer domestic issues in January carried
maturities of 20 years or longer; a relatively large number of issues
had maturities under 10 years, suggesting that both borrowers and lenders
remain cautious about the longer term. Part of the shortening of maturi-
ties reflected a larger proportion of offerings by financial firms, which
typically rely more on intermediate-term instruments. In addition, maturi-
ties in the Eurobond market typically are less than 10 years.
Many of the issues sold abroad recently have permitted buyers to
defer a significant portion of the payment for six to eight months. 1 Ini-
tial payments for such bonds have ranged in most cases between 10 and 30
percent of their face value. The value placed by investors on the deferral
privilege has been reflected in lower yields than could be obtained on regu-
lar issues in the U.S. market. Recent reports in the financial press, indi-
cating that several partly paid bond offerings have sold quite slowly, sug-
gest that their popularity may be limited, however.
Major indexes of stock prices have moved up 3 to 10 percent since the
December meeting of the FOMC, with several reaching record highs during the
intermeeting period. Since the start of the recent bull market in mid-
August, stock averages have climbed 40 to 55 percent. Gross offerings of
stocks in December reached $3.3 billion on a seasonally adjusted basis,
before subsiding a bit in January. Higher stock prices have also continued
1. Because buyers of partly paid bonds can walk away from the obligationby forfeiting their initial payment, the issuers of these bonds might haveto refinance the deferred portion in the next few months, but only if inter-est rates rise substantially.

to encourage convertible bond offerings, especially by lower-rated firms
seeking to minimize financing costs.
Government Finance
Federal sector. Treasury net marketable borrowing during the fourth
quarter totaled almost $59 billion to help meet a combined budget deficit
of $69 billion. An anticipated first-quarter deficit of $66 billion is
expected to generate another $52 billion of marketable borrowing, with the
remainder likely to be financed by about $1-1/2 billion of nonmarketable
issues and a reduction of about $9-1/2 billion in the Treasury's cash bal-
ance. The staff's estimate of marketable borrowing for the first quarter
is about $7 billion below the Treasury's estimate because of differences
in forecasts of the unified budget deficit.
Nonmarketable borrowing has increased significantly in recent months.
It had declined more than $6 billion in the first three quarters of 1982,
but rose $3-1/2 billion in the fourth quarter. Much of the unusually large
volume of nonmarketable borrowing has come from special issues in which
state and local governments temporarily invest receipts from refinancing
operations. These operations picked up significantly in the fourth quarter,
primarily because interest rates declined sufficiently to make refinancing
more attractive to state and local governments. At current municipal inter-
est rate levels, refinancings are expected to be strong again in the first
quarter.
In the fourth quarter, the Treasury also raised $700 million in new
cash through savings bonds, and a like amount is expected in the first
quarter. The renewed growth of savings bonds appears to be attributable

III-10
TREASURY AND AGENCY FINANCING1
(Total for period; billions of dollars)
1982 1983Dec. Q4 Jan.p Q1f
Treasury financing
Combined surplus/deficit(-) -18.1 -69.4 -12.1 -65.7
Means of financing deficit:
(1) Net cash borrowingfrom the public 29.9 62.0 7.9 53.6
Marketable borrowings/repayments(-) 29.1 58.6 7.2 52.2Bills 18.3 33.9 -3.5 18.5Coupons 10.8 24.7 10.7 33.7
Nonmarketable .8 3.4 .7 1.4
(2) Decrease in the cashbalance -14.6 9.6 2.3 9.6
Memo: Cash balanceat end of period 19.8 19.8 17.5 10.2
(3) Other 2 2.8 -2.2 1.9 2.5
Federally sponsored creditagencies net cash borrowing3 1.3 -.1 -.9 .7
FHLB -1.1 -1.6 -1.4 -2.5
FNMA 3.2 2.8 1.0 2.5
Farm Credit Banks -.8 -1.4 -.5 .5
Other * .1 * .2
p--preliminary.f--forecast.*--less than 100 million.1. Numbers reported on a not seasonally adjusted, payment basis.2. Includes checks issued less checks paid, accrued items and othertransactions.3. Includes debt of Federal Home Loan Banks, the Federal Home LoanMortgage Corporation, Federal National Mortgage Association, theFederal Farm Credit Bank System, and the Student Loan MarketingAssociation. Excludes mortgage pass-through securities issued byFNMA and FHLMC.

III-11
to the new program under which rates paid on savings bonds held to maturity
are linked to the average yield on 5-year Treasury notes.
In December, federally sponsored credit agencies borrowed an estimated
$1.3 billion, after running off debt in October and November. FNMA borrowed
over $3 billion in December, using about $1.7 billion to finance new mort-
gage purchases and the remainder to increase its liquid assets. The FHLBs,
in contrast, again paid down debt in December as thrift institutions contin-
ued to repay outstanding advances. Lending by the Federal Farm Credit Banks
remained weak in the final month of the year, and these agencies also reduced
their outstanding debt. This pattern of agency activity appears to have
continued in January, with only FNMA raising new money and with the FHLBs
likely paying off about $1.5 billion in debt.
State and local sector. Prompted by declining interest rates and
approaching deadlines on issuance of certain types of securities, borrow-
ing by state and local governments was extraordinarily heavy in the fourth
quarter of 1982. Flotation of long-term securities crested to a record
$9.8 billion in December as many issuers rushed to the market in anticipa-
tion of the scheduled January 1 date for a federal requirement that all
municipal bonds be issued in registered form. In mid-December this date
was postponed for six months, and borrowing slackened in the weeks immedi-
ately following. Gross issuance during January as a whole was still esti-
mated to be quite strong at $5.3 billion, seasonally adjusted, as the fun-
damental factors of lower interest rates and weakness in revenues asserted
themselves. In recent weeks, there have been a number of reports of bigger-
than-expected budget deficits of state and local governments. Nonetheless,
market access evidently has not been impaired, and yield spreads have
remained moderate.

III-12
STATE & LOCAL GOVERNMENT SECURITIES OFFERINGS(Monthly totals or monthly averages, billions of dollars)
1981 1982 1983
e eYear Year Q4 Nov. Dec. Jan.
-------------- Seasonally adjusted ------------
Total 6.45 9.70 12.30 11.90 13.50 9.30Long-term 3.65 6.35 8.70 8.30 9.80* 5.30Short-term1 2.80 3.35 3.60 3.60 3.70 4.00
------------ Not seasonally adjusted -----------
Total 6.45 9.70 12.15 12.95 12.10 7.00Long-term 3.65 6.35 9.15 9.65* 9.40 4.00
Refundings .10 .35 .80 .70 .50 .20Mortgage revenue .53 1.00 1.00 .75 1.00 .40
Short-term1 2.80 3.35 3.00 3.30 2.70 3.00
e--estimate *--record volume1. These numbers do not include tax-exempt commercial paper.
Revenue issues continued to dominate activity in the tax-exempt mar-
ket, accounting for about three fourths of total volume in December and
January, a proportion very near the average for the past three years. The
largest single category in December was mortgage revenue bonds. Issuers
of these obligations were anxious to use up their annual volume limitations
which cannot be carried over into the next calendar year. Issues to finance
hospitals and public utilities also were sizable. Taken together, these
three revenue bond categories made up about 45 percent of total tax-exempt
securities volume in 1982.
Individuals remain the main category of purchasers of new municipal
issues. Net new purchases of long-term securities by individuals through
bond funds--unit investment trusts (UITs) and open-end mutual funds--came
to about $2-1/4 billion in December. Sales of UITs were a record $13-1/4
billion in 1982, almost three times the previous $5.3 billion record set in

III-13
1981. By contrast, commercial banks and property/casualty insurance com-
panies--the traditional institutional investors in tax-exempts--have shown
little interest in such investments over the past two years.
Mortgage Markets
Despite quite recent reports of an upturn in rates in several regions,
the average interest rate on new commitments for long-term, fixed-rate con-
ventional home mortgages at S&Ls has fallen by about 1/2 percentage point
since the December FOMC meeting to 13.10 percent--nearly 4 percentage points
below the recent high last July and 5-1/2 points below the cyclical peak in
the fall of 1981.
As rates have declined, the volume of applications for federally
underwritten as well as conventional home loans generally has risen. New
mortgage commitments issued by S&Ls rose to $8.9 billion in December, after
seasonal adjustment, and the stock of commitments outstanding climbed to
$29.5 billion--the highest since late 1979. The surge in activity, of
course, reflects refinancing of outstanding high-rate loans as well as
funding of real estate construction and home sales transactions. On a net
basis, mortgage-related assets at S&Ls (mortgage loans and mortgage pass-
through securities combined) increased $1.5 billion in December, and the
rise for the fourth quarter as a whole was nearly double that of the pre-
vious quarter.
The past several months saw a substantial narrowing of the gap between
average commitment and closing rates on conventional home loans at institu-
tional lenders. This gap had reached unprecedented proportions in 1981 and
early last year, reflecting not only time lags between commitment and clos-
ing, but also the inclusion in the closing rate series of adjustable-rate

III-14
MORTGAGE-BOND YIELD SPREADS
GNMA less Treasury Bonds Basis points300
1250
- = 200
_ / V -- .150100
I i 1... __ .......1_.... __L..... __I. .. _L __. _ _ o_L 0
Conventional Mortgage less Corporate Bonds-- 500
400
. 300
....200
S__\ \\ 100/ t
1973 196 1..99 .I..1.... .. 92. 1001973 1976 1979 1982

III-15
loans (generally with initial rates below those on fixed-rate contracts)
and fixed-rate loans made at below-market rates--such as builder buy-downs,
"blends," and loans made from the proceeds of tax-exempt mortgage revenue
bonds. The recent narrowing of the gap reflects timing to some degree,
but also signals a decline in the importance of adjustable-rate mortgages
and presumably also of below-market-rate financing. The proportion of
adjustable-rate loans among loans closed at institutional lenders fell in
December for the fourth consecutive month. Moreover, as market rates have
plummeted, the need for blended-rate arrangements and builder buy-downs has
weakened and the competitive advantage of funds raised earlier by municipal-
ities through mortgage revenue bonds has dwindled.
Although yields have declined sharply since late 1981 on long-term,
fixed-rate mortgages and on mortgage pass-through securities, they have
come down less than yields on bonds of similar quality and maturity, and
spreads between mortgage rates and bond rates have widened accordingly.
In fact, the spread between yields on new issues of GNMAs and 10-year Trea-
sury bonds has trended upward since 1978; over the same period, the spread
between rates on new commitments for conventional home mortgages and yields
on recently offered corporate bonds has widened by roughly the same amount.
These long-run changes in yield spreads occurred as net investment
in mortgage-related assets by thrift institutions fell to historically low
levels, in both absolute terms and as a share of the market. While the
persistence of such large yield spreads might suggest a mortgage credit
"availability" problem, the rise in both the GNMA-Treasury and the mortgage-
corporate bond yield spreads more likely has been associated with increases
in the price charged by investors for the prepayment (call) option owned

III-16
CONSUMER INSTALLMENT CREDIT
1980 1981 1982Q2 Q3 Oct. Nov. Dec.P
- - - - - - Percent
Change in outstandingstotal
By type:Automobile creditRevolving creditAll other1
rate of growth, SAAR - - - -
0.5 6.4 4.8 2.1 -1.2 9.1 10.5
0.42.5
-0.3
8.2 5.88.1 10.44.1 1.5
0.5 -0.76.4 2.11.7 -2.9
Change in outstandings --
totalBy type:Automobile creditRevolving creditAll other1
By major holder:Commercial banksFinance companiesAll other
- - - - - - Billions of dollars, SAAR - - - - -
1.4 19.1 15.7 6.9 -3.9 30.3 35.3
0.51.4
-0.4
-7.28.40.2
9.6 7.4 0.7 -0.94.7 6.2 3.9 1.35.6 2.1 2.4 -4.2
2.313.1
4.5
-0.110.25.6
0.6 -0.60.7 -4.75.6 1.4
-- - - - - - - - Percent,
21.81.37.2
10.813.65.8
13.2
NSA- - - - - - - - -
Interest ratesAt commercial banks2
New cars, 36 mos.Personal, 24 mos.Credit cards
At auto finance cos. 3
New carsUsed cars
14.3015.4717.31
16.5418.0917.78
14.83 16.1719.10 20.00
17.2018.9018.41
17.0818.9318.73
n.a.n.a.n.a.
15.9717.9918.75
n.a.n.a.n.a.
15.19 17.68 16.66 12.82 12.5720.83 20.93 20.76 20.68 20.63
1. Includes primarily personal cash loans, home improvement loans and salesfinance contracts for non-automotive consumer durable goods.
2. Second quarter figure represents average of "most common" rates chargedduring the first week of May; third quarter figure is for first week of August;November figure is for first week of the month.3. Average rate for all loans of each type made during the period, regardlessof maturity.n.a.--not available.p--preliminary.
17.12.15.0

III-17
by mortgage borrowers--an option that had grown in value as interest rate
uncertainty increased. The prices that investors will pay for prepayable
(FHA/VA and conventional) and assumable (FHA/VA) fixed-rate mortgages
reportedly have declined relative to prices they will pay for investments
with greater yield certainty--as evidenced by preferences of pension funds
and life insurance companies for deep-discount mortgage securities that
have a relatively low probability of early refinancing.
Consumer Credit
Consumer installment credit outstanding rose during November at an
annual rate of 9 percent, by far the fastest pace in more than a year.
Automobile credit, which increased at a 17 percent annual rate on the
strength of price reductions and special financing concessions offered
by auto manufacturers, accounted for over two thirds of the expansion.
Incoming information suggests that consumer installment lending may have
strengthened a bit further in December. Commercial banks maintained their
more vigorous pace of lending, and auto finance companies broadened their
below-market financing programs begun a month or two earlier. A spot
check on February 1 of commercial banks by five Federal Reserve banks indi-
cated that average interest rates on most types of consumer loans (except
credit card borrowings) have fallen as much as 1 percentage point since
the last full survey in early November.
In early January, all four U.S. auto manufacturers announced new
special programs lasting through the end of March that offer financing at
11.9 percent to buyers of almost all 1982 and 1983 models. The special
rate is about 5 percentage points below typical rates prior to the pro-
gram. General Motors is offering financing through GMAC while Chrysler,

III-18
Ford and AMC--in addition to providing credit through finance subsidi-
aries--are subsidizing customer financing at participating creditors.
Under the latter arrangement, customers pay an 11.9 percent finance charge;
the auto company makes up the difference, in a lump sum payment to the
creditor, between the reduced customer rate and a standard finance rate
for automobile credit.1
Despite continued high unemployment rates and only modest increases
in disposable personal income, indicators of repayment difficulties on
consumer installment debt have remained little changed from previous low
levels. During the fourth quarter, on average, and for 1982 as a whole,
1.67 percent of automobile credit contracts at finance companies were
delinquent by 30 days or more. This was the lowest delinquency rate at
these firms for any year on record, and compared with 1.90 percent in 1981.
Other installment loan delinquency series are not yet available for the
fourth quarter. Personal bankruptcy cases filed during the fourth quarter
of 1982 rose by only about 1 percent from the third quarter pace, continu-
ing the trendless performance of the past two years. Delinquency rates on
mortgage loans, however, remain in a marked uptrend.
1. Automobile dealers also participate in the finance rate subsidy by for-
going some or all of the share of finance charge revenue they normallyobtain for arranging financing with banks or finance companies. One likelyconsequence of requiring dealers to give up finance charge income is lessflexibility in price bargaining with customers who wish to obtain 11.9 per-cent financing. Thus, the favorable effect of lower financing costs on
auto demand may be offset somewhat by less accommodative pricing of cars.

Appendix A*
MONEY MARKET DEPOSIT ACCOUNT AND SUPER NOW ACCOUNT DEVELOPMENTS
The growth and composition of the monetary aggregates havebeen profoundly influenced by the introduction of the money marketdeposit account (MMDA) and the super NOW account. Both of theseinstruments are ceiling free for accounts that maintain an averagebalance of $2,500.1 The MMDA has limited transaction capabilitiesallowing up to six automatic, preauthorized or telephone transfersper month (three of the six transfers can be by draft).2 The superNOW account is fully transactional and is available to individuals,governmental units, and certain not-for-profit organizations.3 Forboth of the new accounts institutions can guarantee a rate for up toa month, and the MMDA can even be issued with a specific term tomaturity of up to 30 days.
Commercial banks and thrift institutions have marketed the MMDAaggressively. As early as November of last year many institutionswere offering high yielding "bridge" accounts to attract depositsbefore the official introduction of the MMDA on December 14.4 Withthe shifting of balances from "bridge" accounts and the heavy promo-tion of the MMDA itself, the new accounts grew rapidly in Decemberand inflows continued to be robust through late January. As shown inthe upper panel of table A-1, balances in MMDAs averaged $190 billionin the week ending January 19.
One factor obviously contributing to the buildup in MMDAs hasbeen the relatively high interest rates offered on these accounts.Based on data collected from a sample of institutions, it is estima-ted that the average effective yield on MMDAs was about 10-1/2 percentat commercial banks and around 11 percent at thrifts as of the end ofDecember. These rates were about 2 to 2-1/2 percentage points abovethe average yield posted by money market mutual funds at that time.Information available as of late January indicates that average yieldson MMDAs had fallen by about one percentage point, but the differential
1. At the discretion of the institution, the average balance can bedetermined over any period up to one month.2. There is no limit on the number of withdrawals made in person.3. On March 1, 1983, the Depository Institutions Deregulation Com-mittee will consider a proposal to make available to all businessesa fully transactional account that pays explicit interest.4. Retail RPs and 7- to 31-day accounts were the most popular "bridge"accounts.* Prepared by Frederick T. Furlong, Economist, Banking Section,Division of Research and Statistics.
III-A-1

III-A-2
between commercial banks and thrift institutions continued, and bothtypes of institutions were paying in excess of money market mutualfund yields.
Despite the somewhat higher average rate on MMDAs at thriftinstitutions, commercial banks appear to have attracted a relativelylarge proportion of the MMDA market when compared to their share ofcombined savings, small time deposits and MMDAs. The lower panel oftable A-1 indicates that in early January 60 percent of the MMDA bal-ances were held at commercial banks, even though these depositoriesaccounted for less than half of savings, small time, and MMDA bal-ances. 1 A comparison of the first two columns of the lower panel oftable A-1 also suggests that larger institutions as a group had adisproportionately large share of MMDAs. However, given that MMDAscan be issued in large denominations and to business customers, italso may be useful to compare MMDA shares with total deposit shares,including large CDs, shown in the third column. In light of thiscomparison, it is less clear that banks had an advantage over thriftsor that large institutions systematically outperformed smaller insti-tutions.2
The growth in super NOWs, which were introduced on January 5,has been dwarfed by the flows into MMDAs. For the week of January 19,super NOWs averaged about $15-1/2 billion (see table A-2), with overhalf of the increase occurring in the first two days that the accountwas offered. Based on information from the Reserve Bank ContactGroup and other sources, it appears that interest rates on super NOWsaveraged one to two percentage points below rates on MMDAs. Such adifferential is in line with what would be expected given the differ-ence in reserve requirements on a transaction account and the MMDA.As with the MMDA, thrifts apparently were offering higher rates thancommercial banks on super NOWs in January.
The attractiveness of the super NOW for many depositors likelyis limited by hefty service charges that many institutions are applyingto the new account. Such fees can take the form of monthly maintenancecharges that can be $20 or more (though are typically less), chargesper transaction, or a combination of the two. In many cases, theseservice charges are waived if account balances are above some threshold
1. Figures on table A-1 exclude credit union deposits; these institu-tions have only a small fraction of deposits classified as MMDAs.2. It should be noted that in January there was quite a large differ-ence in the growth.rates of combined savings, small time deposits, andMMDAs at commercial banks and thrifts. Part of this difference couldbe due to commercial banks getting a large share of the large-denomina-tion time deposits that may have been converted into MMDAs. However,it also is possible that commercial banks captured the bulk of thenondeposit funds that were shifted to MMDAs.

III-A-3
level, such as $5,000 or $10,000. Given the size of some of theseservice charges and the fact that individuals generally cannot deductthe fees for income tax purposes, it is possible that an ordinary NOWaccount with no fees would be preferred by many depositors.
As in the case of MMDAs, commercial banks account for most ofthe super NOW balances. However, the commercial bank share of superNOWs may be less than would be expected given the concentration oftransaction balances at these institutions. As indicated in tableA-2, the ratio of super NOWs to total OCD in the week of January 12was only about 8 percent at banks, compared with 18 percent at thriftinstitutions. The proportion of OCD held in super NOWs also was quitedifferent among thrift institutions. The rather high ratio for creditunions most likely reflects the ability of these institutions to offerceiling-free share draft accounts even prior to the DepositoryInstitutions Deregulation Committee's decision to authorize a superNOW. As a result, many credit unions already were paying more than5-1/4 percent on transaction deposits and these balances automaticallywould be reported as super NOWs. Some of the growth in super NOWs atS&Ls, on the other hand, could be related to the relatively largevolume of funds that these institutions maintained in sweep arrange-ments involving ordinary NOWs and retail RPs or money market mutualfunds.1 Reports from the Reserve Bank Contact Group indicate that someinstitutions did not plan to continue offering sweeps for transactionaccounts, while some others were encouraging customers with sweeparrangements to convert to a super NOW.
1. The Federal Home Loan Bank Board estimates that funds in sweeparrangements linking NOW accounts to retail RPs or to money marketfunds amounted to about $5-1/2 billion in November, 1982. About $1
billion of the total was in NOW accounts and the remaining $4-1/2billion primarily was in retail RPs.

III-A-4
Table A-1
Money Market Deposit Accounts($ billions, weekly average,
not seasonally adjusted)
Commercial Thrift AllDate banks institutions institutions
1982 Dec. 15 4.6 4.2 8.822 35.5 23.5 59.029 54.2P 33.3P 87.5P
1983 Jan. 5 73.3P 46.7P 120.0P12 97.5P 62.7P 160.2P19 n.a. n.a. 190.0P
n.a.--Not available.p-preliminary.
MMDA Market Shares as ofthe week of January 12, 19831
(percent)
Percent Percentof savings, of totalsmall time, deposits at
Percent of and MMDAs at CBs andtotal MMDAs CBs and thrifts thrifts
Commercial banks 60.9 48.9 65.1
Banks with deposits of:
less than $100 million 11.5 15.8 16.1$100 million to $500 million 13.1 11.4 13.2$500 million to $1 billion 5.2 4.0 5.4greater than $1 billion 31.1 17.7 30.3
Thrift institutions 38.72 51.1 34.9
Thrifts with deposits of:
less than $100 million 3.5 7.1 4.7$100 million to $500 million 11.3 16.0 10.7$500 million to $1 billion 5.7 7.4 5.0greater than $1 billion 18.2 20.6 14.5
1. Excludes credit unions and foreign branches and agencies.2. Credit unions are estimated to have accounted for .4 percent of MMDAs,which would bring the thrift share to 39.1 percent.

III-A-5
Table A-2
Super NOW Accounts1
Commercial Thrift institutions Allbanks S&Ls MSBs CUs Total institutions
Weekly average level($ billions, NSA)
1983-Jan. 12 6.8 2.6 0.4 1.9 4.9 11.7
19 n.a. n.a. n.a. n.a. n.a. 15.6
Percent of OCD2
1983-Jan. 12 8.1 15.6 7.8 34.0 18.0 10.5
19 n.a. n.a. n.a. n.a. n.a. 14.1
n.a.-not available.1. All data are preliminary.2. Thrift OCD are measured on a gross basis.

INTERNATIONAL DEVELOPMENTS
Foreign Exchange Markets
Since the December FOMC meeting the weighted average value of the
dollar has appreciated by roughly 2-1/2 percent on balance, as shown by
the chart on the next page. The dollar declined by several percent
through early January to a trough 8-1/2 percent below its peak in early
November. Most of the depreciation over that two-month period was
attributed to upward revisions in market expectations about the size of
prospective U.S. trade and current account deficits. By the beginning of
January, however, market expectations that the Federal Reserve would
allow monetary conditions to ease further appeared also to be contrib-
uting to the dollar's slide. During the second half of January the
dollar appreciated by more than 5 percent as the absence of a discount
rate reduction and the focus of attention on large prospective U.S.
budget deficits led to a sharp rise in market perceptions of the prob-
ability that dollar interest rates would not decline further in the near
term.
On a bilateral basis, the dollar has appreciated by more than 5
percent against the pound since the December FOMC meeting, while rising 3
percent against the mark and changing little on balance against the yen.
Since early-November the dollar has declined by nearly 15 percent against
the yen and 5 percent against the mark, while rising nearly 10 percent
against the pound. The pound has been weakened by the failure of the
OPEC countries to reach a production agreement that might have arrested
the downward pressure on oil prices. Part of the recent weakening of the
mark relative to the yen has been associated with a growing sense that
IV-1

IV-2
WEIGHTED AVERAGE EXCHANGE VALUE OF THE U.S. DOLLAR March 1973=100-127
,ECTED EXCHANGE RATES.ly series
1982

IV-3
the German general elections on March 6 may not give a clear majority
vote to the current conservative government.
Except in the United Kingdom, interest rates abroad have declined
or remained steady since the December FOMC meeting. Official lending
rates have been lowered by 1 percentage point in Sweden and 1/2 percent-
age point in the Netherlands. The depreciation of the mark and the yen
against the dollar during the second half of January dampened market
expectations of imminent reductions in the German and Japanese discount
rates. The depreciation of the pound led the Bank of England to tighten
monetary conditions, pushing sterling interest rates up by about 1 per-
centage point since mid-December. Gold prices have risen from around
$440 an ounce in mid-December to around $500 an ounce at the beginning of
February.
. The Irish pound has joined the
Belgian franc at the bottom of the EMS, with both currencies presently
trading around their lower intervention limits against the Netherlands
guilder. The weakening of the Irish pound has been related to the
decline of sterling, reflecting the close trading links between the Irish
and British economies.

IV-4
On January 26 the Treasury repaid at maturity the balance of its
Swiss-franc denominated Carter notes. The remaining mark-denominated
Carter notes will mature in May and July.

IV-5
U.S. International Financial Transactions
Over the period from December to mid-January U.S. banking offices
(including IBFs) have made net advances to their foreign offices of
about $13 billion (see line la below), more than reversing the inflow
in October and November. Over 75 percent of this large outflow was
reported by U.S. chartered banks (line 1b below), and more than fifty
percent of the total outflow of funds by U.S. chartered banks was
attributable to the nine largest money center banks.
1. U.S. Offices' BankingPositions Vis-a-vis Own
Foreign Offices
(a) Total
(b) U.S.-Chartered Banks
(c) Foreign-Chartered Banks
2. Credit Extended to U.S. Non-
bank Residents by ForeignBranches of U.S. banks 2/
(a) Total
(b) New York Banks Only
3. Eurodollar Holdings of U.S.
Nonbank Residents 3/
International Banking Data(billions of dollars)Monthly Averages 1/
1980 198 1Dec. Dec. I Mar. June
6.5-15.2
21.7
4.22.7
60.8
9.2-8.918.1
13.28.8
93.6
10.7-2.813.5
16.62.8
13.8
13.8 14.29.1 9.7
982Sept
5.9-5.010.9
Nov. Dec.
10.7-1.812.6
16.1 15.711.4 11.0
8.1-3.111.2
1983Jan. 4/
-5.2-13.58.3
15.7 16.211.2 11.8
104.1 116.0 111.5 116.5 p/ n.a n.a.
1/ Average of Wednesdays, net due to own foreign office (+)
2/ Daily Averages.3/ End of month.4/ Through January 19.p/ Preliminary estimate based on reports by foreign branches of U.S. Banks.
- -

IV-6
Changes in the pattern of financial flows related to the
introduction of the new money market deposit accounts (MMDAs) in
mid-December probably are reflected in the recent outflow. Part of
the flow was probably caused by investors directly or indirectly
substituting these new accounts for part of their holdings of foreign
branch Eurodollar liabilities (such as Eurodollar CDs), inducing
U.S. banks to replace these funds at their foreign offices.
Available data indicate that some indirect substitution has occurred:
about one-fourth of the 13 percent decline in the assets of money
market mutual funds over the period from December to mid-January
reflected a $6.5 billion drop in their holdings of Eurodollar assets.
In addition, although the new account does not appear to have been
structured to be directly competitive with Eurodollar instruments,
there may have been some direct shifts of Eurodollar deposits to MMDAs.
In addition, several banks have indicated that they have placed the
proceeds of MMDA related inflows in the Eurodollar interbank market.
Such placements currently offer more attractive yields than domestic
liquid assets such as Treasury securities or overnight Federal Funds.
This increase in the use of the Euro-interbank market, after a period
of noted hesitancy, may also reflect an increased concern at these
banks about earnings rather than financial ratios, such as the return
on assets.

IV-7
Transactions on a balance of payments basis in U.S. official
reserve assets (net of Carter Bonds) generated an increase of $6.8
billion in 1982, a slight decrease relative to 1981. Such increases in
U.S. official reserve assets add to the Treasury's borrowing
requirements from the public. During 1982 the rise in official reserve
assets was primarily due to an increase of $2.6 billion in the U.S.
reserve position at the I.M.F. and to a $2.8 billion increase in
foreign currency holdings. Virtually, the entire increase in net
transactions in foreign currency during 1982 reflected U.S. swap
credits to Brazil and Mexico (see the line "Other" in the Table
below).
U.S. Official ReserveAssets 1/
(billions of dollars; increase in assets (+))
Outstanding as of Net Transactions inDec. 1981 Dec. 1982 1982 2/
1st Half Q3 Q4Total 3/ 15.9 21.5 2.6 1.7 2.5
SDRs 4.1 5.1 .6 .4 .3
Reserve Positionin the I.M.F. 5.1 7.3 1.4 .5 .7
Foreign Currency 3/ 6.8 8.9 .6 .8 1.4
G10 + Switzerland 3/ 6.8 6.8 .4 .2 .1
Other - 2.1 .2 .6 1.3
I/ Excludes holdings of gold.2/ Net flows on a balance-of-payments basis excluding valuation changes.
3/ Net of certain outstanding Treasury debt in foreign currencies (Carter Bonds).

IV-8
In November private foreign net purchases of U.S. corporate
stocks and bonds were only about $400 million (see lines 2a and 2b of
the attached Table). These relatively small foreign net purchases
perhaps reflected investor expectations that the dollar would weaken
against other currencies, as occurred during November. However, U.S.
Eurodollar bond issues were substantial in November and January.
Over 60 percent of the dollar amount of such issues have been offered
on a partial payment basis, enabling investors to take a position on
U.S. dollar exchange rate and interest rate movements. Such issues
usually specify that the investor pay a portion of the purchase price
initially (from 15 to 25 percent) with the balance due in six months or
more at the original purchase price and coupon. The issuer pays
interest on the initial payment for the six month period only if the
purchaser completes payment on the bond at the end of this period.
News accounts have reported that Japanese investors have been
particularly heavy buyers of these securities, perhaps because of the
restrictions on their participation in trading in organized futures
exchanges. Net proceeds of these issues in November and January
amounted to $450 million with about $1.3 billion still to be raised if
investors buy the rest of these issues. It is important to note that
interest rates would hve to rise by a substantial amount relative to
their current levels (i.e. 15 to 20 percent) for investors not to
excersise the option of buying the remainder of a bond offered on a
partial payment basis.

IV -9
Summary of U.S. International Transactions(in billions of dollars)
Private CapitalBanks
1. Change in net foreign positions of bankingoffices in the U.S. (+ = inflow)a) with own foreign officesb) all other
Securities2. Private securities transactions, net
a) Foreign net purchases (+) of U.S.corp. bonds
b) Foreign net purchases (+) of U.S.corp. stocks
c) U.S. net purchases (-) of foreignsecurities
3. Foreign net purchases (+) of U.S. Treasuryobligations 1/
Official Capital4. Changes in foreign official reserve assets
in U.S. (+ = increase)
a) By areaG-10 countries and SwitzerlandOPECAll other countries
b) By typeU.S. Treasury securitiesOther 2/
5. Changes in U.S. official reserve assets(+ = decrease) 3/
Other transactions- Quarterly data)6. U.S. direct investment (-) abroad7. Foreign direct investment (+) in U.S.8. Other capital flows (+ = inflow) 4/ /9. U.S. current account balance 5/
10. Statistical Discrepancy 5/
1981Year
-34.7
-31.3
1.4
2.1
4.7
-5.5
2.5
5.1
-10.812.7
3.3
5.0.1
-5.2
-8.721.3
-12.04.5
25.8
1981
-19.9.g
-20.8
-2.5
.2
.2
-2.9
1.1
8.1
.81.95.4
4.43.7
-. 3
-1.09.3
-4.0-0.99.5
-1.2 -14.6
-8.2 -10.9-8.2 -10.9
-13.1
-3.0
.8 2.1 -3.0
.6 1.7 -. 1
.7 .8 .3
-. 5 -. 4 -3.2
1.3 2.0 1.0
-3.0 1.6 2.7
-6.8 -4.7 1.65.0 2.7 *
-1.1 3.6 1.2
-1.3 -2.1 4.8-1.6 3.7 -2.1
-1.1 -1.1 -. 8
-0.11.2
-4.01.15.0
1.02.3
-0.4-4.214.5
1982-- I Q-l Q- _3_ Sept. Oct. Nov.
-7.2
-3.9
-1.7
-. 2
-. 3
-1.2
, .75-7
-4.3
-1.1
.2
.3
-1.6
8.31.1J1.8
-. 8
.1
.3
-1.2
1.7 3.4 .4
* -2.4
.1 -2.1 -2.6.2 .5 -. 3
1.6 1.6 .5
1.8 .1 -1.4.1 * -1.1
* -1.0 -1.7
MEMO:U.S. merchandise trade balance -- part of line 9
(Balance of payments basis, seasonally adjusted) -27.9 -9.2 -5.9 -5.7 -12.5 -3.0 -5.4 -3.7
1/ Includes U.S. Ireasury notes puDIcly 150 To pr e T eign F ents.f/ Includes deposits in banks, comercial paper, acceptances, & borrowing under repurchase agreements.l/ Includes newly allocated SDR's of $1.1 billion in January 1981.
7/ Includes U.S. government assets other than official reserves, transactions by nonbanking concerns,allocations of SORs, and other banking and official transactions not shown elsewhere.
5/ Includes seasonal adjustment for quarterly data.7/ Less than $50 million.
NOTE: Details may not add to total because of rounding.

V-10
U.S. Merchandise Trade
In December, the U.S. merchandise trade deficit was smaller than
in November or October, but for the quarter as a whole the deficit was
nearly the same as the large third quarter deficit. In the fourth
quarter both exports and imports declined moderately.
Only a small part of the export decline in the fourth quarter was
in agricultural shipments. A pickup in corn exports (primarily to the
U.S.S.R.) partly offset sharp declines in shipments of wheat and
soybeans (to China and Japan respectively). Agricultural export prices
turned up slightly in December. Most of the decline in the fourth
quarter in nonagricultural exports was-in response to sluggish economic
U.S.Merchandise Trade*Years 1 9 8 2
1981 1982Year Year 2Q 3Q 4Q Nov. Dec.
Value (Bil. $, SAAR)Exports 236.3 211.2 220.0 209.3 192.9 186.5 193.5Agricultural 44.3 37.4 42.2 33.6 32.1 33.1 30.5
Nonagricultural 192.0 173.8 177.8 175.7 160.9 153.4 163.0
Imports 264.1 247.3 243.1 259.3 240.5 231.3 227.0
Oil 77.6 61.2 53.6 65.8 62.8 59.3 61.7
Nonoil 186.6 186.1 189.4 193.5 177.7 172.0 165.3
Trade Balance -27.9 -36.1 -23.0 -50.0 -47.6 -44.8 -33.5
Volume (Bil. $, SAAR)Exports - Agric. 18.1 17.2 19.1 15.9 15.6 16.1 n.a.
- Nonagric. 70.5 60.8 62.2 62.0 56.5 53.9 n.a.
Imports - Oil 5.9 5.1 4.5 5.5 5.3 4.9 n.a.Nonoil 71.9 71.8 72.6 75.4 69.5 68.1 n.a.
da b 1 I V Nh .2 1A/International Transactions s. Mont
y ata are est
n .

IV-11
activity in major trading partner countries and the high exchange
value of the dollar. Substantial declines have occurred in
manufactured goods such as machinery, chemicals, aircraft, and
automotive exports to Canada. By area, 35 percent of the decline in
nonagricultural exports since mid-1982 was in shipments to Mexico;
42 percent of the change was to industrial countries, particularly
Canada and Australia/New Zealand.
Oil imports declined marginally in the fourth quarter; in fact,
in the second half of the year the volume of oil imports was 10 percent
above the first-half rate. The increase appears to be largely refined
products from Western Europe and Latin America (other than Mexico)
which contributed to a small build-up in inventories. U.S. domestic
oil consumption dropped markedly in the fourth quarter. Average
import prices declined by about 25 cents per barrel in the fourth
quarter.
Years 1 9 8 21981 1982
Oil Imports Year Year 2Q 3Q 4Q Nov. Dec.
Volume (mbd, SA) 6.25 5.37 4.82 5.78 5.56 5.21 5.20Price ($/BBL) 34.00 31.23 30.53 31.23 30.98 31.20 30.82Value (Bil$ SAAR) 77.6 61.2 53.6 65.8 62.8 59.3 61.7

IV-13
The volume of nonoil imports declined sharply in the fourth
quarter in response to declining U.S. economic activity, with
decreases spread among most major commodity categories --
particularly industrial supplies (steel), machinery, automotive
imports from Canada (and to a lesser extent from Japan and Europe),
and consumer goods.
For the year 1982 as a whole, there was a distinct shift in
the trade balance at mid-year; from quarterly deficits of less than
$25 billion annual rate in the first two quarters, the deficits rose
to about a $50 billion annual rate beginning in the third quarter.
Exports dropped sharply in the second half of the year --
agricultural exports declined from relatively strong levels recorded
during the past several years and nonagricultural exports continued
declines begun in mid-1981. Imports, however, were only marginally
higher in the second half of this year than in the first. There were
several major influences on these trade developments. The decrease
in exports reflected a decline in foreign demand for U.S. goods
(a combined effect of slow economic growth abroad, loss of price
competitiveness of U.S. goods because of the high exchange value of
the dollar, and, in the case of U.S. grain, ample alternative
supplies); in addition constrained financial conditions in some
developing countries, i.e. Mexico, also held down exports. For
imports, the effect of sluggish U.S. economic activity was partly
offset by the increased price competitiveness of foreign goods.

IV - 14
Foreign Economic Developments. Real GNP in major foreign
industrial countries declined on average in the third quarter of last
year. Only one major country, Japan, recorded positive growth in that
quarter. This weakness abroad continued into the fourth quarter with
industrial production generally declining to November. The level of
industrial production in November was below its year-earlier level in
all countries. For some major countries, such as the United Kingdom,
Canada and Germany, industrial production has fallen to levels not seen
since 1975-76. The rate of unemployment abroad has risen further in
the fourth quarter, reaching nearly 13 percent in December in Canada
and the United Kingdom and about 9 percent in Germany, France and Italy.
While these data show continued weakness in the foreign econo-
mies, there have been some as yet tentative indications that activity
could strengthen soon in several countries. Residential construction
has been quite strong in Germany for about two quarters and more
recently also in Canada. The volume of orders rose in November-
December in Germany for the first time in a year. Survey results in
Canada, France and Germany have recently shown less pessimism than
previously by consumers as well as producers. In the United Kingdom
the seasonally adjusted volume of retail sales rose strongly in
December.
Despite weak economic activity, fiscal policy remains tight in most
foreign countries as concerns over rising budget deficits limit
anticyclical responses. Monetary policy, on the other hand, may be
characterized as continuing to ease cautiously. Real interest rates
abroad appear to have declined further in recent months to a level
below a year ago in most countries.

IV - 15
In Japan, industrial production declined slightly in December
after a strong gain in November. As a result, fourth-quarter
production was below its third-quarter level. Wholesale price and
consumer price indices have shown little tendency to rise and in some
cases fell in the last quarter of 1982. Japan's exports rose slightly
in December after an eight month decline to November. Imports fell
strongly in December. As a result, Japan's trade surplus (s.a.) rose
to $1.4 billion in December from $1.0 billion in November. The current
account showed a surplus of $7.3 billion in 1982, compared to a surplus
of $4.6 billion in the previous year.
The preliminary budget for fiscal 1983 has been announced by the
new government formed by Prime Minister Nakasone Yasuhiro. Proposed
nominal expenditures are only 1.4 percent larger than expenditures
under the 1982 budget. This is the first Japanese budget since 1955 to
plan a decline in real terms. It is most likely that government
expenditures in 1983 will not be stimulatory. Monetary policy remains
fairly restrictive. The monetary authorities continue to hew to the
line of modest monetary growth and hestitate to undertake a reduction
in the official discount rate despite an almost 13 percent appreciation
of the yen against the dollar by the end of January over its November
average value.
In Germany, third-quarter real GNP fell at an annual rate of over
5 percent, and preliminary reports, which put the year-over-year
decline of 1982 GNP at 1.1 percent, imply a further decline in the
fourth quarter. Industrial production continued to fall in December to
a level 6 percent below the beginning of last year. The rate of

IV - 16
unemployment reached 8.5 percent (s.a.) in December, which represents
about 2.1 million unemployed.
While these data leave no doubt about the severity of the current
recession, there are some signs that the worst may be over. The volume
of orders, having fallen steadily through October last year, rose
strongly in November and December. Part of this rise is probably due
to the end-of-year deadline for last year's investment credit program,
and orders of investment goods indeed show the strongest gains. But
other sectors, such as consumer goods and primary goods, especially in
terms of foreign orders, have also shown strength. The latest survey
findings judge the business climate less pessimistically than
previously.
Consumer price inflation has declined by about 2 percentage
points during 1982 with a year-over-year result of 5.3 percent. The
marked slowdown of inflation toward the end of last year came just in
time to provide a favorable input into this year's wage bargaining.
Although no major contracts have yet been signed, indications are that
an average outcome of below 4 percent may be expected. Last year's
contractual wages rose by 4.3 percent.
Germany's current account, which was in deficit by $7.6 billion
in 1981, showed a surplus of $2 billion last year. This $9.6 billion
improvement is essentially to be found in the trade balance, which
improved in volume terms as a lagged result of the past weakness of the
D-mark and in unit value terms -- especially later during the year --
as the D-mark appreciated on an effective basis.
The economic policy mix continues in its atypical constellation
of an easing monetary policy and a very tight fiscal policy. The

IV - 17
improvement is essentially to be found in the trade balance, which
improved in volume terms as a lagged result of the past weakness of the
D-mark and in unit value terms -- especially later during the year --
as the D-mark appreciated on an effective basis.
The economic policy mix continues in its atypical constellation
of an easing monetary policy and a very tight fiscal policy. The
conservative government came to office with its fiscal agenda having a
high priority and has used its probation period before the March 6
elections to legislate a host of cuts in social services. The
Bundesbank. on the other hand, has continued its policy of cautious
easing. Central Bank money grew by 6.2 percent between the fourth
quarters of 1981 and 1982, which is in the upper half of the 4 to 7
percent target.
In Canada, the consumer price index was virtually unchanged in
December and the average monthly change over the last six months of
1982 was under 1/2 percent, providing further evidence of sustained
slowing in this measure. From a year earlier, the CPI was up 9.3
percent in December. More sensitive prices, such as industry selling
prices and home prices, have been weak for some'time, with year-over-
year increases in November of, respectively, 4-1/2 percent and minus
3-1/2 percent.
Solid signs of economic recovery remain limited to the residential
construction sector, with housing starts up markedly in both October and
November. By contrast, industrial production, after falling sharply in
October, rose only marginally in November to a level 19 percent below
its most recent peak, reached in June 1981.

IV - 18
Announcement in early January of a record trade surplus for the
first 11 months of 1982 of $13 billion -- a rate more than twice that of
the previous two years -- contributed to upward pressure on the Canadian
dollar. Along with lower interest rates in the United States, this
allowed the Canadian authorities some leeway to reduce interest rates,
and the bank rate fell to below 10 percent for the first time in four
years.
French GDP fell 0.9 percent in the third quarter of 1982 but was
still nearly one percent above the level it reached in the third quarter
of 1981. The main source of strength was in the export sector which
revived from a poor performance in the first half of the year. This
reversal probably reflects an unwinding of previously delayed exports in
anticipation of the June devaluation of the franc. Also, imports were
down strongly. A decline in investment continued to weaken the French
economy. Although industrial production in October and November was
nearly 2-1/2 percent (s.a.) above the second quarter performance, it was
below the level attained in the fourth quarter of 1982. Recent surveys
indicate that stocks are approaching normal levels, but orders and
overall demand remain weak. General production prospects, judging from
survey results, appear improved.
After the June devaluation of the franc, the government instituted
a price freeze which is being slowly lifted by industry-government
negotiation. During the period of the freeze, mainly the third quarter,
consumer prices rose by only 5.6 percent (a.r.), a considerable
improvement over recent French experience. Although fourth-quarter
inflation accelerated to 7.6 percent when the controls were loosened,

IV - 19
the French did manage to keep inflation to about 9-1/2 percent in 1982,
below their 10 percent target. The 1983 target remains 8 percent.
The current account showed a deficit of $12-1/2 billion in 1982,
though the rate of deficit declined in the third and fourth quarters
from the record second-quarter rate.
The 1983 budget seeks to limit the deficit to 3 percent of GNP.
Nevertheless, real expenditure will rise by over 4 percent while real
revenue will increase only marginally. This spending increase is less
than the 17 percent increase in 1982 and emphasizes investment and
subsidies in contrast to last year's emphasis on consumption.
M2 growth is targeted to be 10 percent in 1983, a considerable
reduction from the 12-1/2 to 13-1/2 percent range for 1982 which may be
slightly surpassed. Credit controls are to be tightened while housing
loans and exports will continue to be favored. Personal loans will be
frozen at the 1982 level.
In the United Kingdom indicators of economic activity continue to
be mixed, with the recovery that appears to have started at the end of
1981 still remaining very weak. Real GDP in the third quarter of 1982
was unchanged from its level in the second quarter, but was 1.1 percent
above its year-earlier level at the trough of the recent recession.
Retail sales (volume, s.a.) were exceptionally strong in December,
reaching the second highest level ever. The index in the fourth
quarter of 1982 was 4.5 percent above its year-earlier level. However,
industrial production fell in November, as it had in October, and in
those two months averaged 0.5 percent below its level for the comparable
period in 1981. Unemployment rose further in December to 12. percent 7
(s.a.) from 12.5 percent in November.

IV - 20
Retail prices actually fell in December, producing an inflation
rate over the previous twelve months of 5.4 percent. Consumer price
inflation in the twelve months to December 1981 was 12 percent. The
December 1982 rate was the lowest U.K. inflation rate for a twelve
month interval in over a decade.
The U.K. current account was again in surplus in December. The
1982 total of $8 billion compares to a $12.9 billion surplus for 1981.
Italian economic activity remains depressed with little sign of
an upturn. Industrial production in November was over 4 percent below
its level of a year earlier. The official unemployment rate held
steady at 9.2 percent in the last two quarters of 1982. Inflation, as
measured by the consumer price index, abated somewhat last year, while
wholesale price inflation slowed significantly. Most of the difference
in the behavior of these two indices is explained by the sharp increases
in indirect taxes last year. Industrial wages rose by 16-1/2 percent in
the year ending in October, compared with a 24 percent rise in the year
ending in October 1981. On January 24, the government announced a wage
pact between the major labor unions and employer groups. The pact
includes a 15 percent reduction in the cost of living payments made under
the scala mobile.
The trade deficit in the first eleven months of last year was $11-
1/2 billion, over $4 billion lower than the deficit of the previous year.
Much of this improvement reflects the depreciation of the weighted
average lira by 12-1/2 percent in 1981. Last year, the lira declined
further by over 5 percent.

REAL CNP AND INDUSTRIAL PRODUCTION IN MAJOR INDUSTRIAL COUNTRIES
(PERCENTAGE CHANGE FROM PREVIOUS PERIOD, SEASONALLY ADJUSTED)
1980 1981 1982
CANADA GNPIP
5-1.7
FRANCE: GDP 1.1IP -1.1
3.1 N.A.1.7 N.A
1 N.A-2.3 N.A
GERMANY GNP 1.8 -. 2 N.AIP -. 1 -2.1 -2.6
ITALY: GDP 4.0 -. 2 N.A.IP 4.5 -2.4 N.A
JAPAN. GNP 4.8 3.9 N.AIP 7.1 3.0 1.2
UNITED GDP -2.4 -2.4KINGDOM: IP -6.1 -5.1
UNITED GNP -.4
STATES: IP -3.6
N.A.N.A.
1.9 -1.82.6 -8.1
1981_Q2 Q3 Q4
1.6 -1.1 -. 93.0 -2.7 -4.4
1.3 .15 .3
-. 8 .7 2-. 3 .0 -1 2
-1.1 -1.7 2.61 5 -4.9 4.7
1.2 .9 -. 3-. 3 1.6 2.6
-. 7 -. 3 1.0-. 2 .6 .4
-. 4 .5 -1.3.5 .3 -4.4
198201 02 Q3 Q4
-2 2 -1.9 -1.0-2 8 -2.7 -2.7
-.3 1.1 -.9-2.5 1.3 -3.9
-.4 -.3 -1 31 3 -.9 -3.4
1.2 -1.5 -3.0.8 -1.4 -7.6
.4 1.9 6-.9 -1.7 1.7
.1 .1-. 3 .4
-1.3 .5-3.1 -1.7
N.A.
N A.
N.A.tI . A.N.A.
N.A.-1.9
N.A.N.A.
N.A.-. 6
N.A.N.A.
.2 -. 6-. 9 -2.2
1982SEP. OCT. NOV. DEC.
* *
-3.4 -3.6
* *
1.6 1.6
-* *.9-1.0 -1.9
*
20.1
* *
3 N.A.
* *
.0 N.A.
*
-1.0
* * *
-3.9 3.0 N.A.
* * * *1.2 -3.1 3.0 -. 1
* * *
-. 5 -1.2 N.A.
* * * *
-. 8 -1.1 -. 7 -. 1
*CNP DATA ARE NOT PUBLISHED ON MONTHLY BASIS.
_ _
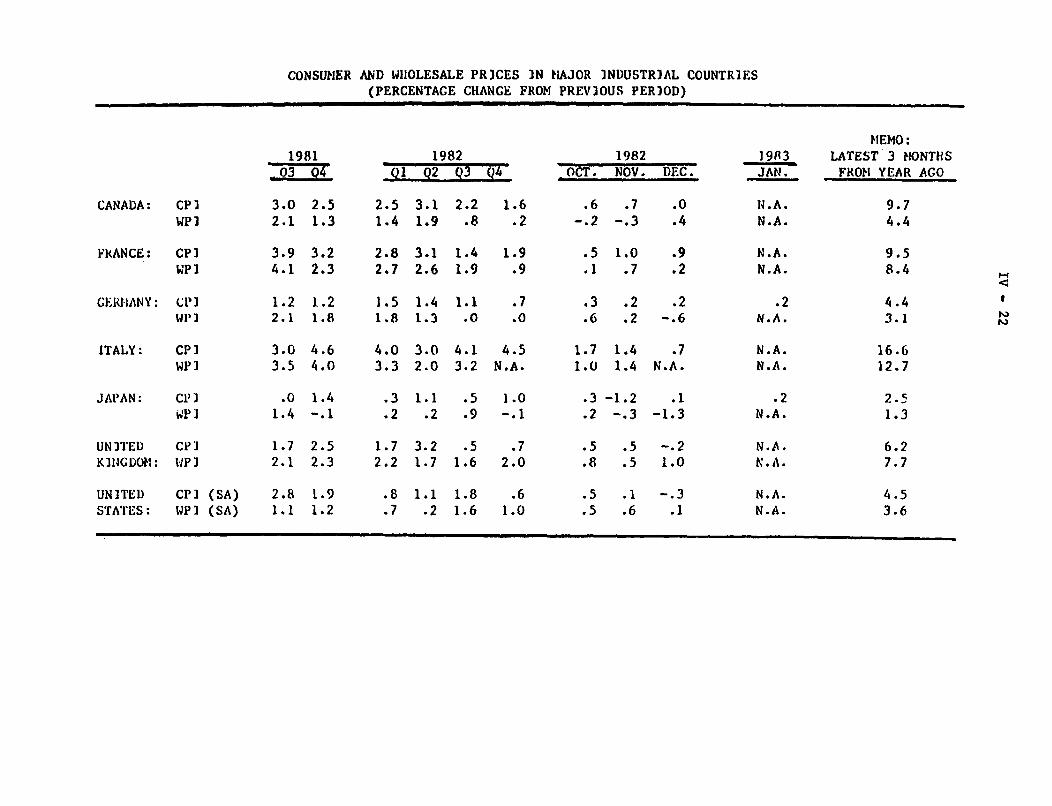
CONSUMER AND WHOLESALE PRICES IN MAJOR INDUSTRIAL COUNTRIES(PERCENTAGE CHANGE FROM PREVIOUS PERIOD)
CANADA: CPIWPI
FRANCE: CPIWPI
GERMANY: CPI
ITALY: CPIWPI
JAPAN: CPI
UNITED CPIKINGDOM: WPI
198103 Or
3.0 2.52.1 1.3
3.9 3.24.1 2.3
1.2 1.22.1 1.8
3.0 4.63.5 4.0
.0 1.41.4 -. 1
1.7 2.52.1 2.3
UNITED CPI (SA) 2.8 1.9STATES: WP] (SA) 1.1 1.2
1982Q1 Q2 Q3 Q4
2.5 3.1 2.2 1.61.4 1.9 .8 .2
2.8 3.1 1.4 1.92.7 2.6 1.9 .9
1.5 1.4 1.1 .71.8 1.3 .0 .0
4.0 3.0 4.1 4.53.3 2.0 3.2 N.A.
1.0-. 1
1982OCT. NOV. DEC.
.6 .7 .0-. 2 -. 3 .4
.5 1.0 .9
.1 .7 .2
.2-. 6
1.7 1.4 .71.0 1.4 N.A.
.3 -1.2 .1
.2 -.3 -1.3
1.7 3.2 .5 .72.2 1.7 1.6 2.0
1.1 1.8.2 1.6
.61.0
.5 .1 -. 3
.5 .6 .1
19f83JAN.
N.A.N.A.
N.A.N.A.
.2N.A.
N.A.N.A.
.2N.A.
N.A.N. A.
N.A.N.A.
MEMO:LATEST 3 MONTHSFROM YEAR AGO
4.43.1
16.612.7
2.51.3

TRADE AND CURRENT ACCOUNT BALANCES OF MAJOR INDUSTRIAL COUNTRIES#(BILLIONS OF U.S. DOLLARS SEASONALLY ADJUSTED)
CANADA: TRADE
CURRENT ACCOUNT
FRANCE: TRADE+
CURRENT ACCOUNT+
GERMANY: TRADE
CURRENT
ITALY: TRADE
CURRENT
ACCOUNT (NSA)
ACCOUNT (NSA)
JAPAN: TRADE+CURRENT ACCOUNT
UNITED TRADEKINGDOM: CURRENT ACCOUNT+
UNITED TRADESTATES: CURRENT ACCOUNT
1981 1982
5.3 N.A.-4.4 N.A.
1981Q3 Q4
.7 2.3-1.9 -. 2
-9.4 -14.0 -1.9 -3.1-4.7 -12.4 -1.4 -2.0
11.9 N.A. 3.1 5.5-7.6 2.0 -4.9 4.1
-16.0 N.A. -4.0 -2.5-8.7 N.A. .3 -. 9
20.1 18.8 6.3 5.04.6 7.3 2.5 1.1
6.6 3.612.9 8.0
-. 6 .9.4 2.8
-27.9 -36.0 -7.8 -9.24.5 N.A. .8 -.9
1982Ql Q2 Q3 Q4
2.9 3.7-. 1 .4
3.7 N.A..8 N.A.
-2.8 -4.2 -4.3 -2.7-2.0 -4.4 -3.7 -2.3
5.0 5.3 5.2-. 8 .6 -2.0
N.A.4.2
-6.0 -1.8 -2.5 N.A.-3.7 N.A. N.A. N.A.
4.4 5.3 5.1 4.0
.9 2.5 2.2 1.6
.6 .2 .7 N.A.
1.4 1.6 1.7 3.3
-5.9 -5.7 -12.5 -11.9
1.1 2.2 -4.2 N.A.
1982OCT. NOV. DEC..
1.4 1.3 N.A.
-* * *-
-. 9 -1.0 -. 9* * *
1.1 1.8 N.A..3 1.8 2.2
-. 4 -. 8 N.A.* * *
1.6 1.0 1.41.0 -. 1 .7
.81.1
1.01.3
-5.4 -3.7 -2.8* * *
# THE CURRENT ACCOUNT INCLUDES GOODS, SERVICES, AND PRIVATE AND OFFICIAL TRANSFERS.+ QUARTERLY DATA ARE SUBJECT TO REVISION AND ARE NOT CONSISTENT WITH ANNUAL DATA.* COMPARAILE MONTHLY CURRENT ACCOUNT DATA ARE NOT PUBLISHED.

IV - 24
In early January the Fanfani government proposed an austerity
package designed to keep the budget deficit at 70 trillion lire, or 15
percent of GNP. Passage of this budget is likely to be difficult. In a
separate move, the government proposed a one-year emergency loan of 8
trillion lire at a 5-1/2 percent rate of interest from the Bank of Italy
to the Treasury. The Treasury has been unable to sell enough securities
in recent months at current interest rates to finance its deficit.
Update on Major Debt Situations
The IMF Executive Board approved on December 23 a three-year $3.9
billion Extended Fund Facility (EFF) arrangement for Mexico. One-third
of the amount is to be disbursed each year, subject to performance on the
agreed stabilization program. Since mid-December, the Mexican government
has introduced a dual exchange rate system, with flexibility in both
rates, eliminated most price controls, increased interest rates on bank
deposits, though they remain negative in real terms, and raised the mini-
mum wage by 25 percent, substantially less than the 100 percent rate of
inflation in 1982 or the prospective rate for 1983. The new minimum wage
is to apply only until mid-year. To gain acceptance of such moderate wage
increase, the authorities granted some tax concessions for the lower
income groups and postponed expected increases in the heavily subsidized
urban transport fares.
One of the two exchange rates, which applies mainly to trade and to
the servicing of the external public debt, was initially set at 95 pesos
per dollar, replacing the two fixed rates of 50 and 70 pesos per dollar
in effect since September 1. This rate is being depreciated daily at an
annual rate of 50 percent. The other exchange rate, which is nominally

IV - 25
"free", was initially set at 148.5 (buying)-150.0 (selling) pesos per
dollar. This rate has been appreciated three times by small amounts.
Since January 24, it has been held at 147.9-149.4 pesos per dollar.
Efforts to raise $5 billion in loans from foreign banks are con-
tinuing, with about $4.7 billion committed to date. The plan to capita-
lize and convert to public sector debt private sector interest payments
due to foreign banks accruing between August 1, 1982, and January 31,
1983, has been put in motion. But preliminary indications are that only
about half of the estimated $1.3 billion in overdue interest potentially
eligible has qualified for the plan, as debtors had difficulty coming up
with the required peso deposits. Mexico has taken steps to promote the
restructuring of private sector external debts along lines that would
parallel the proposed restructuring of the public sector debt. The
request for a restructuring of the public sector external debt owed to
foreign banks remains pending.
On January 24 the IMF Executive Board approved a $1.65 billion
14-month standby arrangement for Argentina and a separate drawing of
about $555 million on the Compensatory Financing Facility for export
shortfalls (CFF). Under an agreement reached with the committee of
banks, international banks have begun making disbursements to Argentina
under a $1.1 billion bridging loan and are close to an agreement on $1.5
billion in new medium-term credits. Argentina and the bank committee
have also reached agreement in principle on refinancing or rescheduling
by June 30, 1983, $4.5-$5.5 billion in public and publicly-guaranteed
short and long-term debt coming due in 1983. On January 27, the BIS also

IV - 26
announced the conclusion of a $500 million bridging loan to the central
bank backed by a number of BIS members and the U.S. monetary authorities.
Brazil received $550 million from the IMF under a CFF in December
1982. Negotiations on a $5 billion EFF program and on a request for $660
million from the CFF and buffer stock facilities are likely to result in
initial disbursements in February or March of 1983. Brazil in the fourth
quarter of 1982 obtained $2.3 billion in bridge loans with an average
maturity of 90 days from several commercial banks. The Brazilians have
advanced four proposals to meet their projected financial needs for 1983.
The key elements are a request for: $4.4 billion in new funding, roll-
over into long-term credits of $4 billion in amortization payments on
medium-term debt due in 1983, maintenance of $8.8 billion trade credits,
and restoration of money market lines to Brazilian banks to the level
outstanding on June 30, 1982. A recent $1.23 billion official short-term
borrowing from the United States has been disbursed and $780 million
repaid. In addition, a $1.45 billion loan was made available to Brazil
through the BIS, including $250 million from Saudi Arabia.
Chile's request for a $535 million 2-year standby arrangement was
approved by the IMF Executive Board on January 10, 1983. Also approved
was a separate drawing of about $315 million under the CFF. Chilean
authorities have also asked a group of private foreign commercial banks,
including both U.S. and non U.S. banks, for a 90 day suspension of repay-
ment on principal of medium- and long-term debt, continued rollover of
short-term debt, a rescheduling of as much as $3.8 billion in payments
falling due on public and private debt in 1983 and 1984 and $1 billion in
new medium-term credits. A large portion of the debt to be rescheduled

IV - 27
is payable by private Chilean banks that are experiencing a severe liqui-
dity crisis. In mid-January, the Chilean authorities felt compelled to
take action with respect to 10 domestic banks, accounting for half the
assets of the Chilean banking system and about $4 billion in external
loans. Three of the affected banks were liquidated, five are under
temporary government management, and two are under continuous government
surveillance.
Venezuela has suffered a setback in its program, which began last
October, to refinance $8.8 billion in short-term government debt. In
January, one of the state agencies was late in making several payments on
debt which it holds or guarantees, leading to a legal action and the
withdrawal of several banks from participation in one of the refinancing
loans. Short-term debt of $3 billion had been scheduled for refinancing
in the first quarter of 1983, about half in January. The Finance Minister
has indicated that the central government will make the payments for the
agency. Recent weakness in the oil market increases Venezuela's diffi-
culties in refinancing the short-term debt. The Finance Minister has
indicated that IMF assistance might be sought if the refinancing effort
falls short; he plans to visit New York banks to discuss the refinancing
problems and arrange for a team of advisors from major banks.