fomc 19781121 g bpt 219781115
TRANSCRIPT

Prefatory Note
The attached document represents the most complete and accurate version available based on original copies culled from the files of the FOMC Secretariat at the Board of Governors of the Federal Reserve System. This electronic document was created through a comprehensive digitization process which included identifying the best-preserved paper copies, scanning those copies,1 and then making the scanned versions text-searchable.2 Though a stringent quality assurance process was employed, some imperfections may remain.
Please note that this document may contain occasional gaps in the text. These gaps are the result of a redaction process that removed information obtained on a confidential basis. All redacted passages are exempt from disclosure under applicable provisions of the Freedom of Information Act.
1 In some cases, original copies needed to be photocopied before being scanned into electronic format. All scanned images were deskewed (to remove the effects of printer- and scanner-introduced tilting) and lightly cleaned (to remove dark spots caused by staple holes, hole punches, and other blemishes caused after initial printing). 2 A two-step process was used. An advanced optimal character recognition computer program (OCR) first created electronic text from the document image. Where the OCR results were inconclusive, staff checked and corrected the text as necessary. Please note that the numbers and text in charts and tables were not reliably recognized by the OCR process and were not checked or corrected by staff.
CONFIDENTIAL (FR)
November 15, 1978
CURRENT ECONOMIC AND FINANCIAL CONDITIONS
By the StaffBoard of Governors
of the Federal Reserve System

TABLE OF CONTENTS
Section Page
DOMESTIC NONFINANCIAL DEVELOPMENTS II
Employment and production ..................................... 1
Personal income and consumer spending........................ 3Business investment........................................... 5Residential construction......................... ... ........ . 10
Government sector activity..................................... 14Prices................. ...................................... 16Wages, productivity, and costs................................ 19
TABLES:
Changes in employment......................................... 2Selected unemployment rates.................................... 2
Personal income............................................... 4Retail sales............ ........................... .......... . 6Contracts and orders for plant and equipment................... 8Surveys of plant and equipment expenditures................... 9Business inventories....................................... . 11
Inventory to sales ratios..................................... 11
New private housing units.................................... 13Recent changes in producer prices.............................. 15Recent changes in consumer prices.............................. 15
Summary of Administration's voluntary wage-pricestandards ................................ .................... 17
Factors contributing to the recentCPI acceleration. ........ .. .... ............. ............... 18
Major collective bargaining settlements....................... 21Hourly earnings index.......................................... 22
Productivity and costs........................................ 23
CHART:
New private housing starts..................................... 12
DOMESTIC FINANCIAL DEVELOPMENTS III
Monetary aggregates and bank credit.. ......................... 3Business finance.............................................. 9
Government securities markets.................................. 14Mortgage markets ................................. ... ....... 18
Consumer credit ........... ........... ......................... 22
TABLES:
Selected financial market quotations........................... 2Monetary aggregates ..................................... . 4
Commercial bank credit......................................... 8

TABLE OF CONTENTSSection Page
DOMESTIC FINANCIAL DEVELOPMENTS (cont.) III
TABLES:
Corporate and foreign securities.............................. 11Government security offerings ................ ... ....... 15
Net change in mortgage debt outstanding....................... 19Interest rates and supply of mortgage funds
at selected S&Ls .......................................... 20
Secondary home mortgage market activity...................... 20Consumer instalment credit................ ... ............ 23
CHARTS:
Estimated levels of small-denomination time depositsby maturity at all insured commercial banks................. 7
Liquidity measures for nonfinancial corporations.............. 13Yields on U.S. Treasury securities........................... 17
Household debt burden........................................ 24
INTERNATIONAL DEVELOPMENTS IV
Foreign exchange markets .................................... 1U.S. international transactions............................... 4Merchandise trade..................................... 4
Nonagricultural exports................. ..... .......... 4
Agricultural exports........................................ 5Nonpetroleum imports..................... ............. 7
Foreign official assets in the United States.................. 8OPEC banking and securities holdings..........s.............. 8Bank-reported private capital transactions................... 8Private securities transactions............................. 9
Foreign economic developments ............................... 10Individual country notes................................... . 11
TABLES:
U.S. international transactions summary...................... 5U.S. merchandise trade, international
accounts basis..................................... ......... 7
Real GNP and industrial production in majorindustrial countries................................ .... . 12
Consumer and wholesale prices in major industrialcountries .......... .............................. .... .... 13
Trade and current-account balances............................ 14Money growth................................................. 15

TABLE OF CONTENTS Continued
Section Page
INTERNATIONAL DEVELOPMENTS (cont.) IV
CHART:
U.S. merchandise trade.................................... 6
APPENDIX A: A Brief Description of the "Revenue Act of 1978"

November 15, 1978
SELECTED DOMESTIC NONFINANCIAL DATAAVAILABLE SINCE PRECEDING GREENBOOK
(Seasonally adjusted)
Latest Data Per Cent Change fromThree
Release Preceding Periods YearPeriod Date Data Period Earlier earlier
(At annual rate)
Civilian labor forceUnemployment rate (%)1 /Insured unemployment rate (%)1/
Nonfarm employment, payroll (mil.)ManufacturingNonmanufacturing
Private nonfarm:Average weekly hours (hr.)1 /
Hourly earnings ($)1/Manufacturing:Average weekly hours (hr.)1/Unit labor cost (1967=100)
Industrial production (1967=100)Consumer goodsBusiness equipmentDefense & space equipmentMaterials
Consumer prices (1967=100)FoodCommodities except foodServices
Producer prices (1967=100).ustrial commoditiesm products & foods & feeds
Personal income ($ bil.) 2 /
Oct.Oct.
Oct.
Oct.
Oct.Oct.
Oct.
Oct.
11-3-7811-3-7811-3-7811-3-7811-3-7811-3-78
101.15.83.2
86.620.466.2
11-3-78 35.8 35.811-3-78 5.82 5.77
Oct. 11-3-78 40.5Sept. 10-30-78 165.5
Oct.Oct.Oct.Oct.Oct.
Sept.Sept.Sept.Sept.
Oct.Oct.Oct.
11-15-7811-15-7811-15-7811-15-7811-15-78
10-27-7810-27-7810-27-7810-27-78
11-2-7811-2-7811-2-78
148.4150.2166.888.1150.2
199.1215.6177.2215.7
215.0214.5214.4
40.41.5
5.711.35.18.24.8
9.16.2
10.29.5
17.712.433.4
Sept. 10-18-78 1735.6
35.9 36.15.71 5.36
40.5-.2
6.36.87.310.26.2
7.63.07.69.9
10.49.2
13.3
40.55.8
6.83.79.3
11.78.1
8.310.76.69.0
9.68.016.1
9.4 11.5
(Not at annual rates)
Mfrs. new orders dur. goods ($ bil.) Sept.Capital goods industries Sept.
Nondefense Sept.Defense Sept.
Inventories to sales ratio:1/Manufacturing and trade, total Aug.Manufacturing Sept.Trade Aug.
Ratio: Mfrs.' durable goods inve-tories to unfilled orders_ Sept.
Retail sales, total ($ bil.)GAF3/
Auto sales, total (mil. units.)2 /
Domestic modelsForeign models
Housing starts, private (thous.)2/Leading indicators (1967=100)
Oct.
Oct.
Oct.Oct.Oct.
Sept.Sept.
11-1-7811-1-7811-1-7811-1-78
11-13-7811-1-7811-13-78
72.323.620.0
3.5
1.40 1.431.52 1.511.30 1.32
11-1-78 .591
11-13-78 65.911-13-78 14.3
11-7-7811-7-7811-7-78
11.29.22.0
10-18-78 2,07310-30-78 138.3
-. 5-2.8
5.45.54.6
1.4.9
5.09.1
10.32.9
19.829.224.167.6
1.41 1.461.52 1.591.30 1.33
.593 .654
8.55.6
2.81.111.7
3.04.4
1/ Actual data used in lieu of per cent changes for earlier periods.At annual rate.xcludes mail order houses.
II - T - 1

II - 1
DOMESTIC NONFINANCIAL DEVELOPMENTS
Economic activity continued to expand at a moderate rate over
the past month. Employment increased markedly in October following the
slow pace during the summer and industrial production continued upward.
While total retail sales declined in October, unit auto sales recovered
some of their earlier vigor after some hesitation at the beginning of the
1979 model year. Housing starts.remained at a high level in September,
although new home sales moved down considerably during the summer. For
capital spending, recent contracts and orders data suggest further near-
term increases; private surveys, however, point to a slowing of growth
in plant and equipment outlays in 1979. Incoming price data indicate
continued large increases in both food and nonfood sectors.
Employment and Production
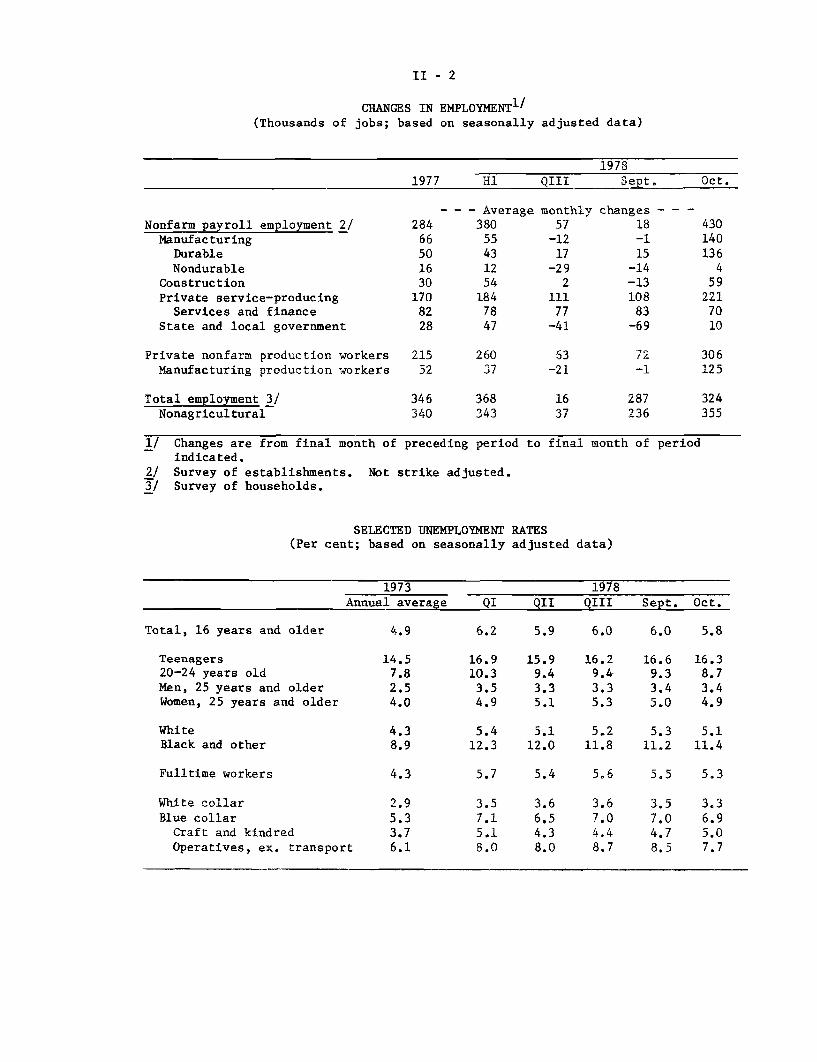
Total employment rose strongly in October following small gains
in the third quarter. The jobless rate dropped 0.2 to 5.8 per cent,
continuing to hover in the range that has prevailed throughout this year.
Compared to a year ago, however, unemployment rates for most labor force
groups have declined about 1 percentage point.
Nonfarm payroll employment rose more than 400,000 in October,
a strong gain even when compared with the first-half surge. Employment
growth in the private service-producing sector accounted for about half
of the over-all increase. In the goods-producing sector, construction
employment increased following two months of decline and manufacturing
employment, which had been little changed since April, rose briskly.
II - 2
CHANGES IN EMPLOYMENT 1 /
(Thousands of jobs; based on seasonally adjusted data)
19781977 H1 QIII Sept. Oct.
- - - Average monthly changes - - -
Nonfarm payroll employment 2/ 284 380 57 18 430Manufacturing 66 55 -12 -1 140
Durable 50 43 17 15 136Nondurable 16 12 -29 -14 4
Construction 30 54 2 -13 59Private service-producing 170 184 111 108 221
Services and finance 82 78 77 83 70State and local government 28 47 -41 -69 10
Private nonfarm production workers 215 260 53 72 306Manufacturing production workers 52 37 -21 -1 125
Total employment 3/ 346 368 16 287 324Nonagricultural 340 343 37 236 355
1/ Changes are from final month of preceding period to final month of periodindicated.
2/ Survey of establishments. Not strike adjusted.3/ Survey of households.
SELECTED UNEMPLOYMENT RATES(Per cent; based on seasonally adjusted data)
1973 1978Annual average QI QII QIII Sept. Oct.
Total, 16 years and older 4.9 6.2 5.9 6.0 6.0 5.8
Teenagers 14.5 16.9 15.9 16.2 16.6 16.320-24 years old 7.8 10.3 9.4 9.4 9.3 8.7Men, 25 years and older 2.5 3.5 3.3 3.3 3.4 3.4Women, 25 years and older 4.0 4.9 5.1 5.3 5.0 4.9
White 4.3 5.4 5.1 5.2 5.3 5.1Black and other 8.9 12.3 12.0 11.8 11.2 11.4
Fulltime workers 4.3 5.7 5.4 5.6 5.5 5.3
White collar 2.9 3.5 3.6 3.6 3.5 3.3Blue collar 5.3 7.1 6.5 7.0 7.0 6.9Craft and kindred 3.7 5.1 4.3 4.4 4.7 5.0Operatives, ex. transport 6.1 8.0 8.0 8.7 8.5 7.7

II - 3
The surge in factory hiring was concentrated at durable goods producers;
gains were especially large in the metals, machinery, and transportation
equipment industries. The average workweek in manufacturing rose frac-
tionally to 40-1/2 hours.
Industrial production is estimated to have increased 0.5 per
cent in October, a rate only slightly below the average pace over the
previous five months. But part of the rise reflected a rebound in autos
and coal following the end of the railroad strike. Auto assemblies
increased to a 9-1/2 million unit annual rate from an 8.9 million unit
rate in September. Moderate advances occurred in both materials and
final products. Production of nonauto consumer goods is estimated to
have edged up further in October. In addition, production of business
equipment rose further, but the increase in both September and October
was below the pace earlier in the year.
Capacity utilization in manufacturing appears to have risen
slightly in October to about 85.2 per cent, up from 82.9 per cent a
year earlier. Nonetheless, over-all utilization rates remain about
2-1/2 percentage points below their 1973 highs.
Personal Income and Consumer Spending
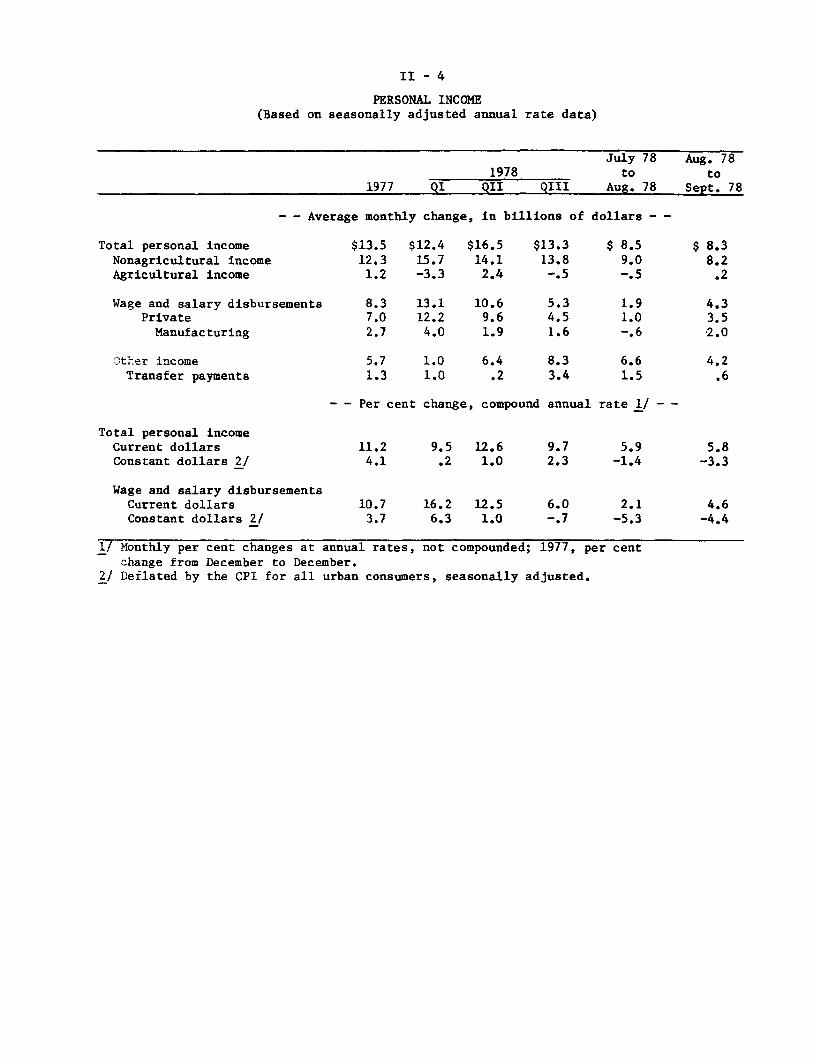
Total personal income grew slowly for the second consecutive
month in September, reflecting the small employment gains late in the
third quarter. Private wage and salary disbursements advanced at only
a $3-1/2 billion rate--well below the average monthly increases of
II - 4
PERSONAL INCOME(Based on seasonally adjusted annual rate data)
Total personal incomeNonagricultural incomeAgricultural income
Wage and salary disbursementsPrivateManufacturing
Other incomeTransfer payments
19781977 QI QII QIII
- - Average monthly change, in billions of
$13.5 $12.4 $16.5 $13.312.3 15.7 14.1 13.81.2 -3.3 2.4 -.5
8.3 13.1 10.6 5.37.0 12.2 9.6 4.52.7 4.0 1.9 1.6
5.7 1.0 6.4 8.31.3 1.0 .2 3.4
- - Per cent change, compound annual
July 78to
Aug. 78
dollars - -
$ 8.59.0-.5
1.91.0-.6
6.61.5
rate 1/ --
Total personal incomeCurrent dollars 11.2 9.5 12.6 9.7 5.9 5.8Constant dollars 2/ 4.1 .2 1.0 2.3 -1.4 -3.3
Wage and salary disbursementsCurrent dollars 10.7 16.2 12.5 6.0 2.1 4.6Constant dollars 2/ 3.7 6.3 1.0 -.7 -5.3 -4.4
1/ Monthly per cent changes at annual rates, not compounded; 1977, per centchange from December to December.
2/ Deflated by the CPI for all urban consumers, seasonally adjusted.
Aug. 78to
Sept. 78
$ 8.38.2.2
4.33.52.0
4.2.6
II - 5
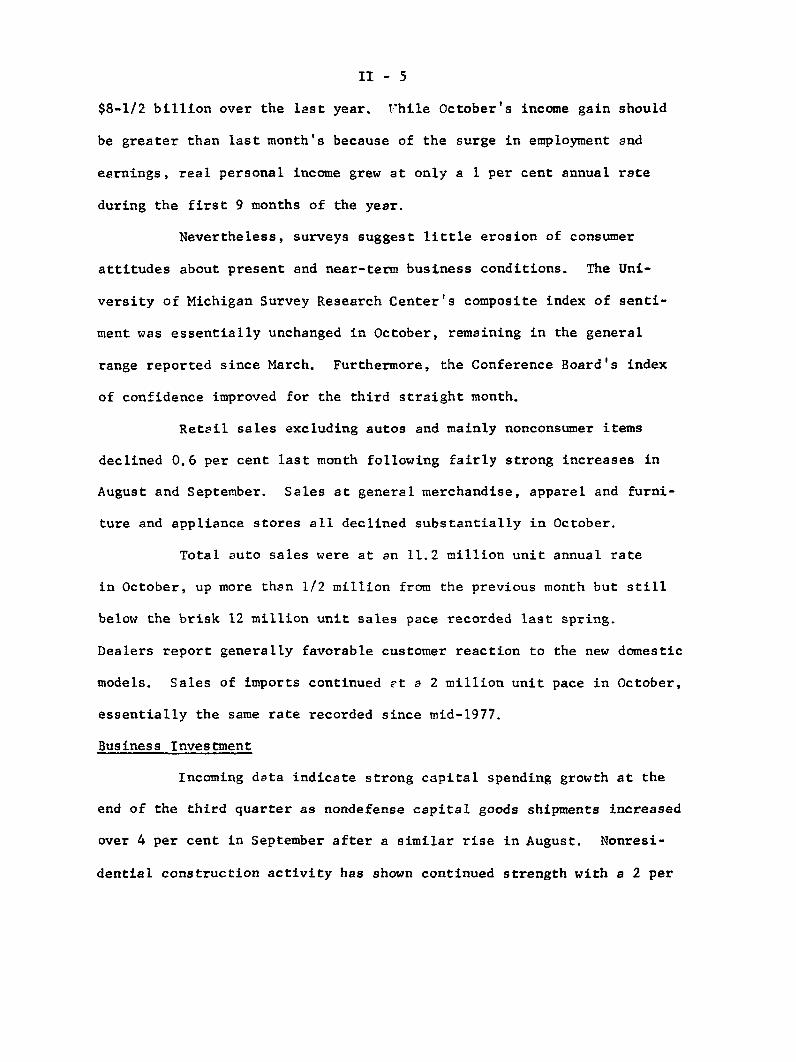
$8-1/2 billion over the last year. While October's income gain should
be greater than last month's because of the surge in employment and
earnings, real personal income grew at only a 1 per cent annual rate
during the first 9 months of the year.
Nevertheless, surveys suggest little erosion of consumer
attitudes about present and near-term business conditions. The Uni-
versity of Michigan Survey Research Center's composite index of senti-
ment was essentially unchanged in October, remaining in the general
range reported since March. Furthermore, the Conference Board's index
of confidence improved for the third straight month.
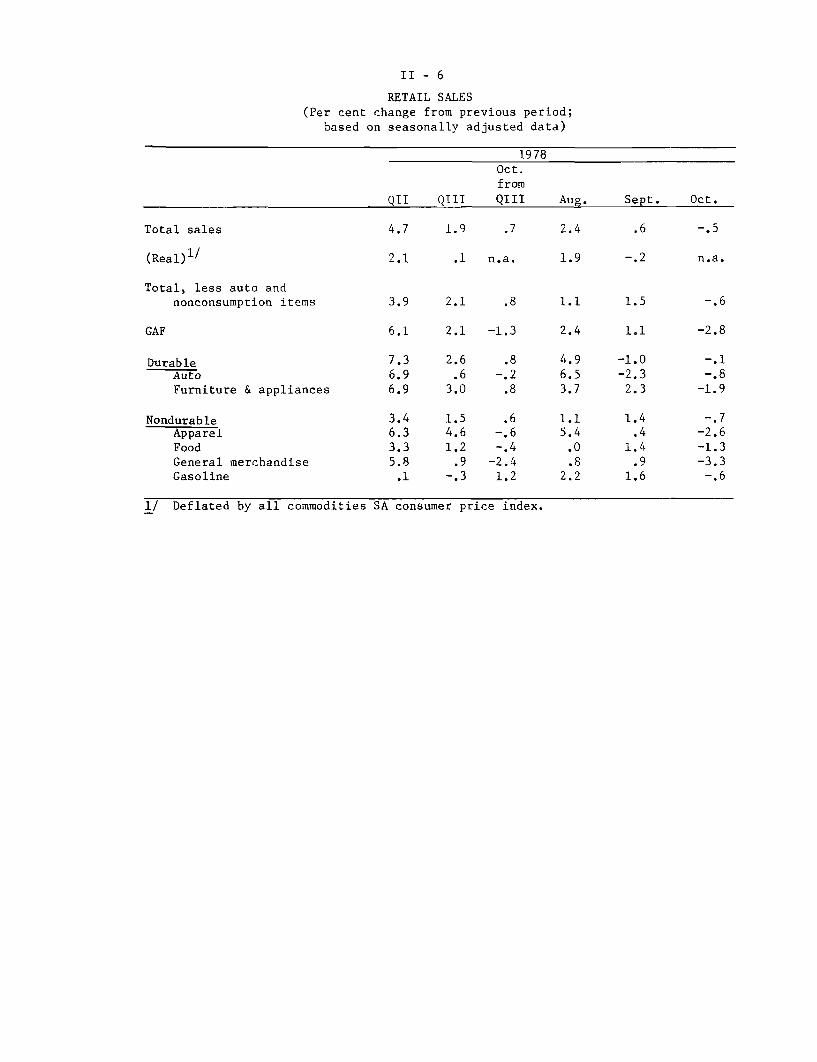
Retail sales excluding autos and mainly nonconsumer items
declined 0.6 per cent last month following fairly strong increases in
August and September. Sales at general merchandise, apparel and furni-
ture and appliance stores all declined substantially in October.
Total auto sales were at an 11.2 million unit annual rate
in October, up more than 1/2 million from the previous month but still
below the brisk 12 million unit sales pace recorded last spring.
Dealers report generally favorable customer reaction to the new domestic
models. Sales of imports continued at a 2 million unit pace in October,
essentially the same rate recorded since mid-1977.
Business Investment
Incoming data indicate strong capital spending growth at the
end of the third quarter as nondefense capital goods shipments increased
over 4 per cent in September after a similar rise in August. Nonresi-
dential construction activity has shown continued strength with a 2 per
II - 6
RETAIL SALES
(Per cent change from previous period;
based on seasonally adjusted data)
1978
Oct.
from
QII QIII QIII Aug. Sept. Oct.
Total sales 4.7 1.9 .7 2.4 .6 -.5
(Real)1/ 2.1 .1 n.a. 1.9 -.2 n.a.
Total, less auto and
nonconsumption items 3.9 2.1 .8 1.1 1.5 -.6
GAF 6.1 2.1 -1.3 2.4 1.1 -2.8
Durable 7.3 2.6 .8 4.9 -1.0 -.1
Auto 6.9 .6 -.2 6.5 -2.3 -.8
Furniture & appliances 6.9 3.0 .8 3.7 2.3 -1.9
Nondurable 3.4 1.5 .6 1.1 1.4 -.7
Apparel 6.3 4.6 -. 6 5.4 .4 -2.6
Food 3.3 1.2 -.4 .0 1.4 -1.3
General merchandise 5.8 .9 -2.4 .8 .9 -3.3
Gasoline .1 -.3 1.2 2.2 1.6 -.6
1/ Deflated by all commodities SA consumer price index.

II - 7
cent advance in September and a 5 per cent increase for the third quarter
as a whole. However, business spending for motor vehicles weakened, as
truck sales fell sharply in September to their lowest level in a year.
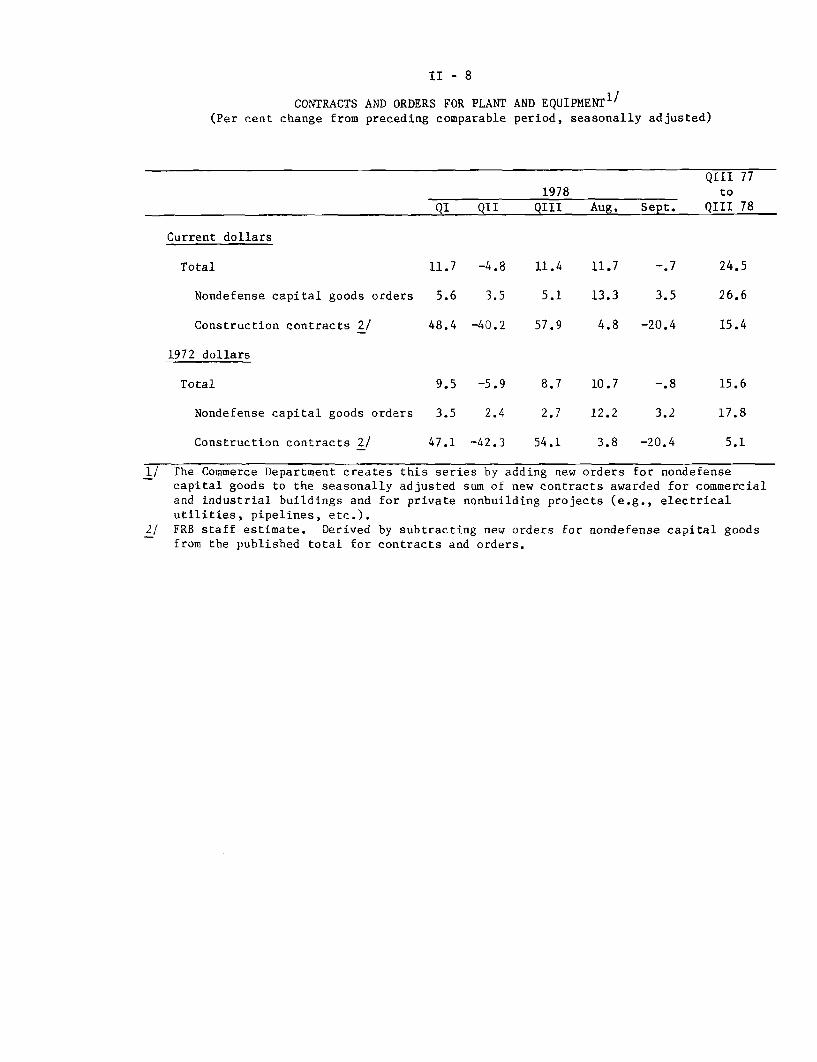
Commitments for near term plant and equipment spending suggest
further moderate increases this winter. New orders for nondefense capital
goods rose 3.5 per cent in September following a much sharper rise in
August. The September gain largely reflected a surge of machinery
orders, which had been on a plateau since last February. Over the same
period, total bookings were bolstered by gains in commercial aircraft
orders; as a result, total nondefense capital goods orders have risen
at a fairly strong pace thus far this year.
The immediate outlook for commercial and industrial building
also appears bright. The volatile series on nonresidential construction
contracts dropped sharply in September due to a substantial decline in
awards for power plants. Even so, the total value of contracts awarded
in the first nine months of 1978 is 12 per cent above the comparable
period of last year. So far this year, gains in contracts for com-
mercial and manufacturing buildings have been particularly impressive,
while awards for nonbuilding projects such as electric power plants
have decreased markedly.
However, in contrast to the relatively favorable near-term
outlook, survey data suggest a slowing of capital spending growth in
1979. The McGraw-Hill survey, which has been the most reliable of
the private reports, shows business planning only a 10 per cent year-
II - 8
CONTRACTS AND ORDERS FOR PLANT AND EQUIPMENT1/
(Per cent change from preceding comparable period, seasonally adjusted)
QIII 771978 to
QI QII QIII Aug. Sept. QIII 78
Current dollars
Total 11.7 -4.8 11.4 11.7 -.7 24.5
Nondefense capital goods orders 5.6 3.5 5.1 13.3 3.5 26.6
Construction contracts 2/ 48.4 -40.2 57.9 4.8 -20.4 15.4
1972 dollars
Total 9.5 -5.9 8.7 10.7 -. 8 15.6
Nondefense capital goods orders 3.5 2.4 2.7 12.2 3.2 17.8
Construction contracts 2/ 47.1 -42.3 54.1 3.8 -20.4 5.1
1/ The Commerce Department creates this series by adding new orders for nondefense
capital goods to the seasonally adjusted sum of new contracts awarded for commercial
and industrial buildings and for private nonbuilding projects (e.g., electrical
utilities, pipelines, etc.).2/ FRB staff estimate. Derived by subtracting new orders for nondefense capital goods
from the published total for contracts and orders.

II - 9
SURVEYS OF PLANT AND EQUIPMENT EXPENDITURES(Per cent change from preceding year)
All Business
Manufacturing
Durables
Nondurables
Nonmanufacturing
Mining
Transportation
Utilities
Communications
Commercial
Actual
1977
12.7
14.6
17.3
12.4
11.2
12.4
-7.0
15.8
16.2
9.4
1978
1/August Commerce-
12.3
13.1
14.0
12.2
11.7
5.8
15.4
12.2
14.6
9.2
Planned Spending1979
McGraw-Hill Merrill Lynch2/
10 9
10 9
12 8
9 10
10 8
8 5
14 3
7 13
10 5
11 8
1/ Reflects actual expenditures in the first half of 1978.
2/Confidential results, for internal use only.

II - 10
over-year gain in nominal capital outlays. The respondents also expect
an 8 per cent rise in capital goods prices, suggesting a gain in real
investment of only 2 per cent. The over-all results of the Merrill
Lynch survey are similar to the nominal McGraw-Hill reading.
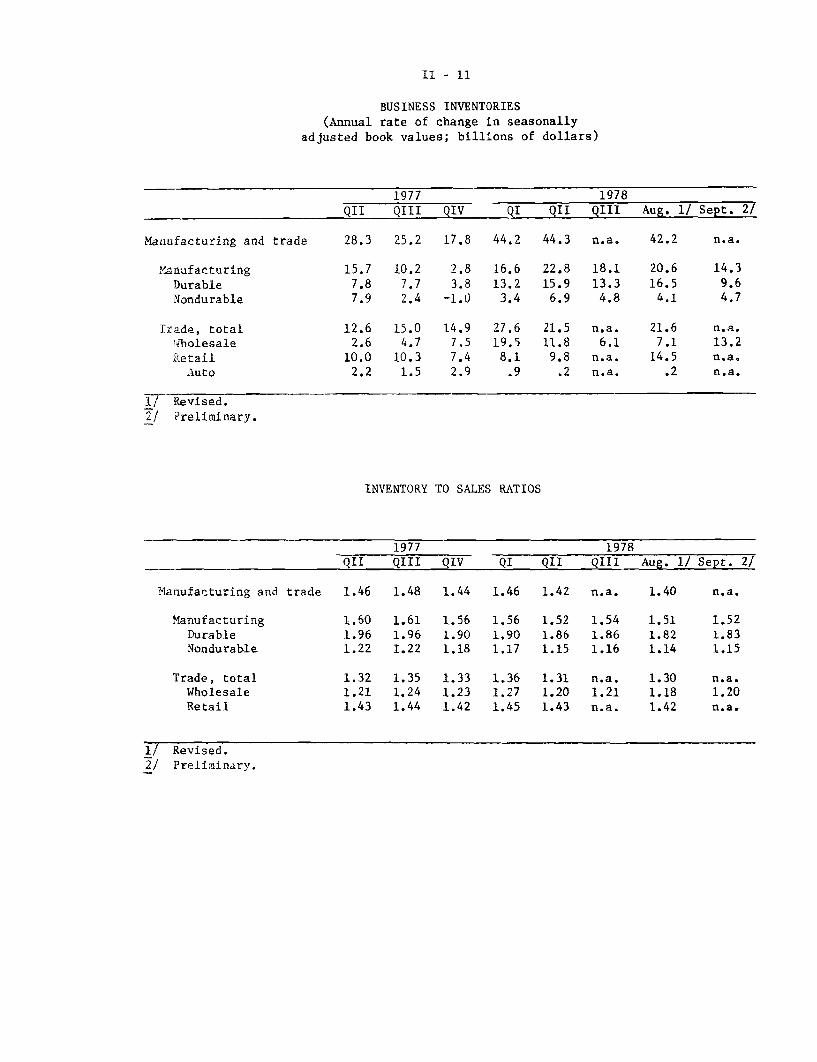
Inventory investment continues to show signs of business
caution. In September, the book value of manufacturing stocks rose by
$14.3 billion--the smallest gain so far this year. Durable goods pro-
ducers added to inventories at an annual rate of $9.6 billion--about
twice the rise at nondurables; this pattern has been characteristic
of manufacturing accumulation for over a year. Since the September
rise was accompanied by essentially unchanged shipments, the ratio of
inventories to sales for all manufacturers edged up, but still remained
low on an historical basis. The book value of wholesale trade inven-
tories increased at an annual rate of $13.2 billion in September fol-
lowing much smaller increases over the past four months.
Residential Construction
Housing starts remained virtually unchanged in September for
the third consecutive month. At an annual rate of 2.1 million units,
they were about 3 per cent below the recent high in the fourth quarter
of 1977, while the starts rate in the single-family sector has been
unchanged for the last three months. Sales of new units have trended
down since May and the inventory of unsold new single-family homes has
risen to a 2-1/2 year high. Sales of existing homes registered a
moderate decline in September, but the rate continued near the August
record.
II - 11
BUSINESS INVENTORIES(Annual rate of change in seasonally
adjusted book values; billions of dollars)
1977 1978
QII QIII QIV QI QII QIII Aug. 1/ Sept. 2/
Manufacturing and trade 28.3 25.2 17.8 44.2 44.3 n.a. 42.2 n.a.
Manufacturing 15.7 10.2 2.8 16.6 22.8 18.1 20.6 14.3
Durable 7.8 7.7 3.8 13.2 15.9 13.3 16.5 9.6
Nondurable 7.9 2.4 -1.0 3.4 6.9 4.8 4.1 4.7
Trade, total 12.6 15.0 14.9 27.6 21.5 n.a. 21.6 n.a.Wholesale 2.6 4.7 7.5 19.5 11.8 6.1 7.1 13.2
Retail 10.0 10.3 7.4 8.1 9.8 n.a. 14.5 n.a.Auto 2.2 1.5 2.9 .9 .2 n.a. .2 n.a.
1/ Revised.2/ Preliminary.
INVENTORY TO SALES RATIOS
1977 1978
QII QIII QIV QI QII QIII Aug. 1/ Sept. 2/
Manufacturing and trade 1.46 1.48 1.44 1.46 1.42 n.a. 1.40 n.a.
Manufacturing 1.60 1.61 1.56 1.56 1.52 1.54 1.51 1.52Durable 1.96 1.96 1.90 1.90 1.86 1.86 1.82 1.83Nondurable 1.22 1.22 1.18 1.17 1.15 1.16 1.14 1.15
Trade, total 1.32 1.35 1.33 1.36 1.31 n.a. 1.30 n.a.Wholesale 1.21 1.24 1.23 1.27 1.20 1.21 1.18 1.20Retail 1.43 1.44 1.42 1.45 1.43 n.a. 1.42 n.a.
1/ Revised.2/ Preliminary.

II - 12
NEW PRIVATE HOUSING STARTS
(Seasonally adjusted annual rates)
Millionsof units
IIIlliill tII IIII ililII 2.4
TOTAL
2.0
1.6
1.2
SINGLE-FAMILY
.8
.4

II - 13
NEW PRIVATE HOUSING UNITS(Seasonally adjusted annual rates; millions of units)
1977 1978 Per cent change
1/ 2/ 1/ 2/ from:QIV QI QII- QIII Aug.- Sept.- Month ago Year ago
Single & MultifamilyPermits 1.79 1.57 1.72 1.63 1.56 1.71 +10 + 1Starts 3/ 2.15 1.72 2.11 2.08 2.04 2.07 + 1 + 3Under construction- 1.25 1.26 1.30 1.32 1.30 1.32 + 1 +14Completions 1.69 1.76 1.90 1.95 1.97 1.93 - 2 + 3
Single-familyPermits 1.20 1.01 1.11 1.05 1.02 1.10 + 8 - 4Starts 3/ 1.55 1.23 1.47 1.45 1.45 1.45 -- - 4
Under construction- .77 .78 .77 .79 .79 .79 -- +11Completions 1.28 1.30 1.43 1.35 1.37 1.41 + 3 - 4
MultifamilyPermits .60 .56 .61 .58 .54 .61 +13 +10Starts 3/ .60 .49 .64 .63 .59 .62 + 5 +23Under construction- .48 .48 .52 .53 .51 .53 + 3 +19Completions .42 .46 .47 .59 .60 .52 -13 +26
Mobile home shipments .31 .29 .26 .28 .28 .29 + 2 -
1/ Revised.2/ Preliminary.3/ Seasonally adjusted, end of period.

II - 14
The multifamily sector apparently was aided by a substantial
end-of-the-fiscal year surge in starts of Government subsidized units.
A jump in the starts rate in September brought the average during the
first nine months of 1978 to a 587,000 unit annual rate--almost 10 per
cent above the pace of last year. Rental markets are very tight in
many areas of the nation and there is no indication of the overbuilding
of condominium units that characterized the 1973-1974 period. However,
there continue to be uncertainties about long-run rates of return due
to rising costs for operation, finance and construction.
Government Sector Activity
In the Federal sector, final budget totals for fiscal year
1978 indicate the deficit was $48.7 billion, higher than the $45 billion
deficit for the preceding fiscal year. The Administration projects a
deficit of $39 billion for fiscal year 1979, including the effects of
the Revenue Act of 1978 signed by the President on November 6.
Recent data continue to indicate a moderation of growth of
State and local spending. The value of construction put-in-place
declined slightly in September for the second month in a row, but
remains at a high level following very strong increases last spring
and summer. State and local employment was roughly unchanged in
October but has declined more than 100,000 since June. Most of this
decline has been in the education area and some of it may reflect
the effects of Proposition 13 in California.
II - 15
RECENT CHANGES IN PRODUCER PRICES
(Per cent change at compound annual rates; based
on seasonally adjusted data)1/
Relative
importance 1977 1978
Dec. 1977 H1 H2 QI QII QIII Sept. Oct.
Finished goods 41.2 8.2 5.0 9.6 11.4 5.0 10.4 10.3
Consumer foods 10.3 10.9 2.4 21.2 14.6 -1.0 19.9 20.1
Consumer nonfoods 18.7 8.4 4.3 5.3 11.2 7.6 6.5 7.7
Capital equipment 12.2 5.9 8.4 7.1 8.7 6.4 7.2 7.1
Materials:
Intermediate 2/ 45.5 7.2 5.6 9.2 6.6 6.7 7.7 13.7
Crude nonfood 4.6 7.4 6.6 16.2 11.6 12.2 12.0 25.0
Crude food 6.3 1.7 1.3 40.3 28.1 -9.4 22.7 43.4
Memo: Energy 3/ 11.3 19.0 5.1 4.3 10.4 4.8 7.8 7.0
1/ Changes are from final month of preceding period to final month of period
indicated. Monthly changes are not compounded.
2/ Excludes intermediate materials for food manufacturing and manufactured
animal feeds.
3/ Fuels and related products and power.
RECENT CHANGES IN CONSUMER PRICES
(Per cent change at compound annual rates; based
on seasonally adjusted data) 1/
Relative
importance 1977 1978
Dec. 77 _ H1 H2 QI QII QIII Aug. Sept.
All items 100.0 8.9 4.7 9.3 11.4 7.8 7.3 9.1
Food 17.7 13.4 3.0 16.4 20.4 3.0 3.4 6.2
Commodities (nonfood) 41.6 5.8 4.0 6.1 7.2 7.8 5.5 10.2
Services 40.7 9.6 6.3 9.1 11.8 10.3 10.2 9.5
Memoranda:
All items less food
and energy 3/ 73.7 7.7 5.2 8.0 9.9 8.3 7.6 8.2
Gas and electricity 3.4 12.2 5.3 12.2 22.1 4.5 3.0 4.0
Gasoline and fuel oil 4/ 5.2 11.2 1.4 .2 8.4 12.5 12.4 9.5
Home financing, taxes,and insurance 9.2 15.3 7.3 16.7 21.6 19.3 19.8 16.7
1/ Changes are from final month of preceding period to final month of periodindicated. Monthly changes are not compounded.
2/ Based on new index for all urban consumers.3/ Energy items excluded: gasoline and motor oil, fuel oil and coal, gas and
electricity.4/ Includes motor oil, coal, and bottled gas.

II - 16
Prices
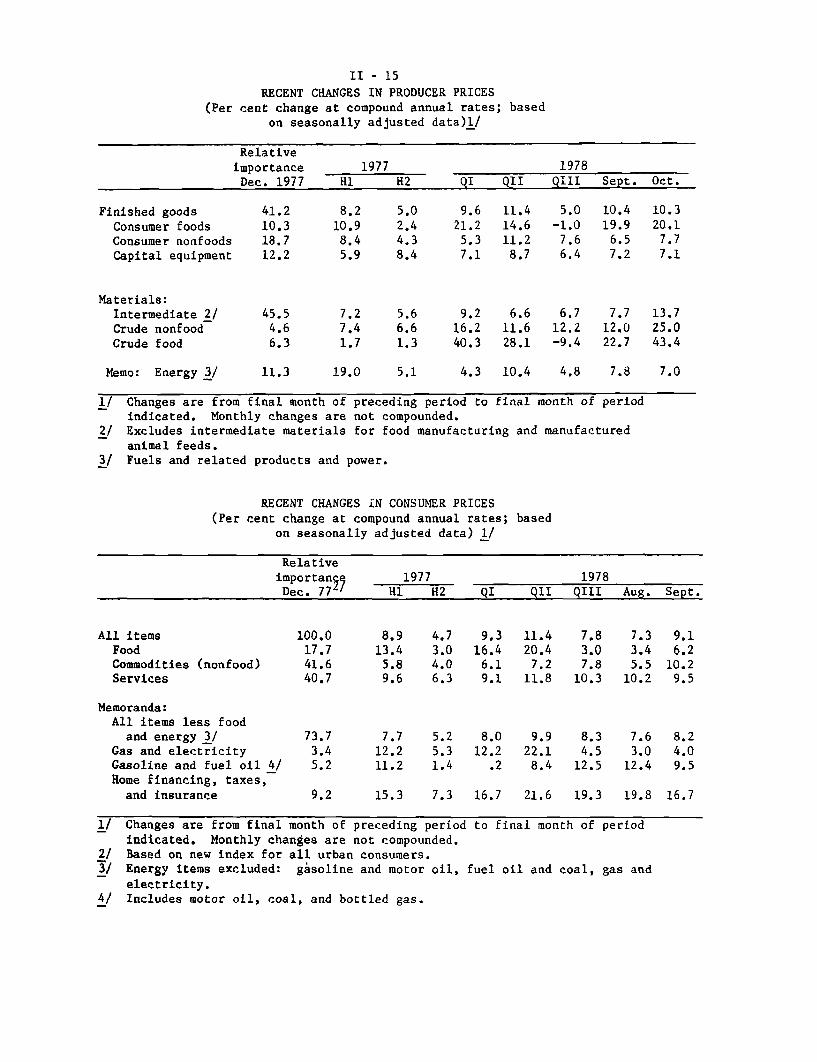
Prices have continued to rise at a rapid pace at both the
consumer and producer levels; consumer prices increased at a 9 per cent
annual rate in September, while prices of producer finished goods rose
at over a 10 per cent rate in September and October.
The food sector continues to be an important influence on
recent over-all price movements. Retail food prices rose at about a
6 per cent annual rate in September, following two months of little
change. In addition, producer prices of both crude and finished foods
climbed sharply in October for the second month after declining in
July and August. Supply conditions for red meat suggest that upward
pressure on food prices will continue for some time.
Energy items also have been pushing up the inflation rate.
Gasoline and natural gas prices rose sharply in September. Electricity
rates, by contrast, receded somewhat in the third quarter, following
large increases in previous months. Outside of the food and energy
area, retail prices in September increased at an 8 per cent annual
rate--about the same as the average pace so far this year.
Thus far in 1978 the total CPI has increased at a 9.5 per
cent annual rate, up sharply from the 6.8 per cent rate recorded over
1977. As shown in the following table, the rapid increase in home-
ownership costs accounts for 1 percentage point of the 2-3/4 per-
centage point acceleration in the total CPI this year. The influence

SUMMARY OF ADMINISTRATION'S VOLUNTARY WAGE PRICE STANDARDS
Standards
Wages:
Prices:
Profits:
I
Exemptions
General standard of a 7 per cent
increase including private fringe
benefits.
7 per cent annual average formulti-year contracts, including
COLA.
- First year increases to be lessthan 8 per cent.
- COLA's evaluated assuming 6per cent rise in CPI.
General standard of a 1/2percentage point reduction from
1976-77 average increase.
Rent is included.
Deceleration of medical carecosts by 2 percentage points per
year.
Workers earning less than
$4 per hour.
Previously signed contracts.
Where justified
work rules.
Incentives and selected
sanctions
Real wage insurance plan
Congressional enactment).
(needs
by changes in
Where justified by equityconsiderations.
Profit margin standardalternative.
Greater price reductionsrequired if wages deceleratemore than 1/2 percentagepoint.
Monitoring
Council on
Stability.
Relaxation
imports.
of largest firms by
Wage and Price
of restrictions on
Exclusion from bidding ongovernment contracts.
Review of administratively setminimum prices.
Evaluation of regulated rate
increases in light of standards.
Profit margins can be used as analternative price standard whenunavoidable costs rise rapidly.In such cases profit marginsare not to exceed average ofbest 2 of last 3 years.

II - 18
FACTORS CONTRIBUTING TO THE RECENT CPI ACCELERATION
Accelera- ContributionRelative Per cent 1/ tion to accelera-importance, change, annual- from tion in CPIDec. 1977 1977 1978 (1978-1977) total
-- Percentage points---
CPI, all items 100.0 6.8 9.5 2.7 2.7
Homeownership 22.8 9.2 13.8 4.6 1.0
Food 17.7 8.0 13.0 5.0 .9
Used cars 3.0 -4.1 11.3 15.4 .5
1/ For 1977 the change shown is from December 1976 to December 1977;for 1978, the change is from December 1977 to September 1978, atcompound annual rate,

II - 19
of higher mortgage rates accounts for over half the acceleration in
homeownership costs, and home purchase price increases for much of the
remainder. Of the other major contributors to acceleration in the CPI this
year, food costs are responsible for about 1 percentage point and used
car prices for about 1/2 percentage point.
At the producer level, nonfood finished goods prices rose in
October at rates similar to those earlier this year--at an annual rate
of nearly 8 per cent for consumer goods and almost 7-1/2 per cent
for capital equipment. However, materials prices, both crude and
intermediate, accelerated markedly. In particular, prices of construc-
tion materials, nonferrous metals, and scrap metal rose sharply.
Wages and Productivity and Costs
On October 24 the President announced an anti-inflation program
that includes voluntary wage and price standards backed by limited sanc-
tions, as well as regulatory reform and changes in Federal budgetary
policies. The standards, which are summarized on the following page
include a proposal for a tax-based incentive program for wage compliance--
the real wage insurance plan.
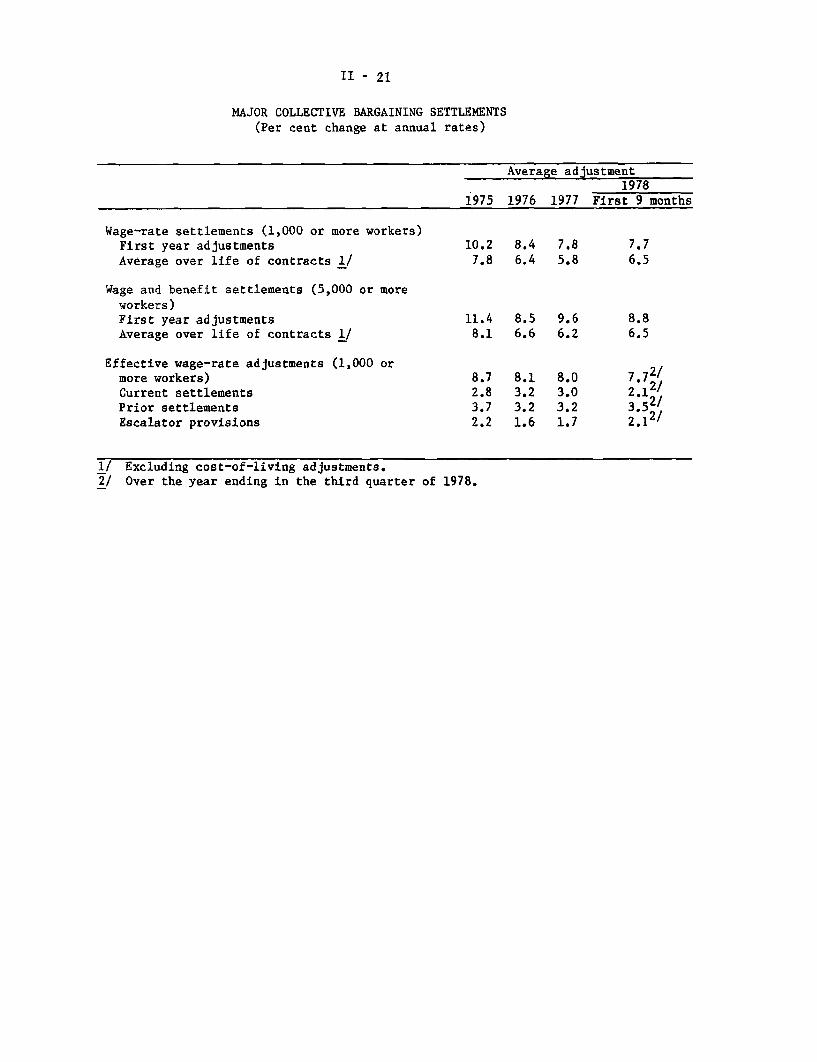
Wage rates so far this year have advanced faster than the
President's standards. First-year wage increases negotiated in major
collective bargaining settlements during the first nine months of 1978
averaged 7.7 percent; this excludes cost-of-living adjustments, which
are included in the President's wage standard. Negotiated increases
in combined wages and benefits (contracts covering 5,000 or more

II - 20
workers) averaged nearly 9 per cent in the first year, and 6-1/2 per
cent over the contract life (excluding any cost-of-living increases).
Wage rates for nonfarm production workers, as measured by the
hourly earnings index, have increased at just under an 8 per cent annual
rate since mid-year, the same as in the second quarter. Total compensa-
tion increases have remained large; the 9 per cent rate of rise in the
nonfarm sector in the third quarter was roughly the same as the rate
over the preceding four quarters. The rapid rise in compensation was
partially offset by improved productivity. In the private nonfarm sector,
output per hour was up at a 3-3/4 per cent rate as growth of labor input
slowed sharply. Dsspite the sizable third-quarter increase, output
per hour is only fractionally above the level of a year ago, with the
bulk of this weak productivity performance occurring outside the
manufacturing sector.
II - 21
MAJOR COLLECTIVE BARGAINING SETTLEMENTS
(Per cent change at annual rates)
Average adjustment1978
1975 1976 1977 First 9 months
Wage-rate settlements (1,000 or more workers)First year adjustments 10.2 8.4 7.8 7.7
Average over life of contracts 1/ 7.8 6.4 5.8 6.5
Wage and benefit settlements (5,000 or moreworkers)First year adjustments 11.4 8.5 9.6 8.8Average over life of contracts 1/ 8.1 6.6 6.2 6.5
Effective wage-rate adjustments (1,000 ormore workers) 8.7 8.1 8.0 7.72/Current settlements 2.8 3.2 3.0 2.12/Prior settlements 3.7 3.2 3.2 3.52/Escalator provisions 2.2 1.6 1.7 2.12/
1/ Excluding cost-of-living adjustments.2/ Over the year ending in the third quarter of 1978.

II - 22
HOURLY EARNINGS INDEX1/
(Per cent change at compound annual rates; based on seasonally adjusted data)
Dec. 76 Dec. 77 Dec. 77 Mar. 78 June 78
to to to to toDec. 77 Oct. 78 Mar. 78 June 78 Oct. 78
Total private nonfarm 7.4 8.4 9.8 7.9 7.9
Manufacturing 8.2 8.4 9.1 7.2 8.6
Contract construction 4.0 8.2 11.9 9.3 4.7
Transportation and public
utilities 9.4 6.2 6.3 7.3 5.4
Total trade 7.5 9.3 12.0 7.5 8.7
Retail trade 7.1 9.2 14.0 6.4 7.8
Services 6.7 7.9 10.6 5.5 7.7
1/ Excludes the effect of interindustry shifts in employment and fluctuations in
overtime pay in manufacturing.

II - 23
PRODUCTIVITY AND COSTS
(Per cent change from preceding period at a compound annual rates;
based on seasonally adjusted data)
1977 QIII1977 1978 to
QII QIII QIV QI QII QIII 1978 QIII
Output per hour
Total private business -1.7 5.1 .4 -4.5 1.2 4.5 .3Nonfarm business -1.4 3.7 .5 -3.1 1.7 3.7 .7Manufacturing 6.4 6.5 -.3 -5.1 8.3 10.0 3.0
Durable 8.9 5.0 -1.1 -6.8 11.3 9.6 3.0
Nondurable 3.1 8.6 1.0 -2.6 3.9 10.6 3.1
Compensation per hour
Total private business 5.8 9.5 6.7 12.1 8.1 9.8 9.1Nonfarm business 6.5 8.1 7.6 12.2 8.2 8.9 9.2Manufacturing 8.2 9.2 8.8 11.6 7.4 10.5 9.6
Durable 9.4 9.0 9.8 10.4 7.5 10.5 9.5Nondurable 6.0 8.5 6.7 13.6 7.2 9.3 9.2
Unit labor costs
Total private business 7.6 4.2 6.3 17.4 6.8 5.1 8.8Nonfarm business 8.0 4.2 7.1 15.7 6.4 5.0 8.5Manufacturing 1.6 2.5 9.1 17.7 -.8 .5 6.4
Durable .5 3.8 11.0 18.5 -3.4 .8 6.4Nondurable 2.8 -. 1 5.6 16.6 3.2 -1.2 5.9

III-T-1SELECTED DOMESTIC FINANCIAL DATA
Latest data Net Change from:Indicator Month Three Year
Period Level ago months ago ago
1/ $ billions Per cent at annual ratesMonetary and credit aggregates-
Total reserves OCTOBER 38.5 8.9 2.7 7.4Nonborrowed reserves OCTOBER 37.2 2.1 3.2 7.7Money supplyM1 OCTOBER 362.0 3.7 8.8 7.8M2 OCTOBER 867.4 7.0 10.0 8.2M3 OCTOBER 1484.5 10.2 12.1 9.3
Time and savings deposits (less CDs) OCTOBER 505.4 9.1 10.9 8.6CDs2 / OCTOBER 88.2 0.1 0.8 21.8Thrift deposits (S&Ls + MSBs+ Credit Unions) OCTOBER 617.0 14.6 15.0 10.9Bank credit (end of month) OCTOBER 959.2 9.5 8.3 11.0
Net Change from:Latest data Three
Indicator Per cent Month months YearPeriod or index ago Ago ago
Market yields and stock pricesFederal funds wk. endg. 11/8/78 9.77 .91 1.93 3.27
easury bill (90 day) " 11/8/78 8.85 .68 2.09 2.68rcial paper (90-119 day) " 11/8/78 10.01 1.19 2.23 3.44
ew utility issue Aaa " 11/10/78 9.30 - .49 1.01Municipal bonds (Bond Buyer) 1 day 11/9/78 6.17 .07 .14 .66FNMA auction yield (FHA/VA) 11/13/78 10.27 .36 .45 1.41Dividend price ratio (common
stocks) wk endg. 11/8/78 5.40 .55 .49 .45NYSE index (12/31/65=50) end of day 11/13/78 51.83 -7.10 -6.73 -0.54
Net Change or Gross OfferingsLatest Year Year to Date
Period Data ago 1978 1977
Credit demands 1/Business loans at commercial banks- 1/Consumer instalment credit outstanding- 1/Mortgage debt outstanding (major holders)-Corporate bonds (public offerings)Municipal long-term bonds (gross offerings)Federally sponsored agcy. (net borrowing)U.S. Treasury (net cash borrowing)
OCTOBERSEPTEMBERAUGUSTOCTOBEROCTOBEROCTOBERNOVEMBER
2.03.3
10.31.8e3.2e2.45.0
26.430.270.617.1e4 0.2e19.549.7
19.122.661.720.439.7
5.846.9
Seasonally adjusted.$ billions, not at annual ratesIncludes comm'l banks, S&Ls, MSBs, life ins.Estimated
cos, FNNA, and GNMA.
I/2/3/e -

III - 1
DOMESTIC FINANCIAL DEVELOPMENTS
Interest rates have risen, and stock prices have declined, on
balance since the last FOMC meeting, with unusually sharp short-run fluc-
tuations prompted by shifting expectations about monetary policy,
inflation, and the exchange value of the dollar. In late October, secu-
rity yields rose substantially, responding in part to a 50 basis point
increase in the Federal funds rate but also reflecting concern about the
falling foreign exchange value of the dollar and pessimism regarding the
likelihood of success of the Administration's anti-inflation program.
On November 1, the Treasury and the Federal Reserve announced actions to
strengthen the dollar, including a 1 percentage point increase in the
discount rate to 9-1/2 per cent and supplemental reserve requirements on
large time deposits. With a concurrent further rise of about 50 basis
points in the funds rate, short-term rates generally increased sharply;
meanwhile, long-term bond yields fell markedly during the day, and stock
prices posted a record increase. In subsequent days, however, most
short- and long-term rates moved upward and stock prices drifted lower.
Most recently, rates on private short-term instruments were 115 to
160 basis points higher than at the time of the October meeting;
increases in Treasury bill rates were much smaller, owing to heavy
foreign purchases of both marketable and nonmarketable securities.
Most bond yields, though somewhat lower than before the November 1
announcement, have risen 5 to 25 basis points on balance in the
intermeeting period. Stock price indexes have fallen 9 to 15 per cent
over this period.

III - 2
SELECTED FINANCIAL MARKET QUOTATIONS(per cent)
1977 1/
High LowFOMCSept.19
FOMCOct.17
1978 2/ Change from:
Oct. Nov. Nov. Sept.31 1 14 FOMC
Oct.FOMC
Short-term ratesFederal funds 1/
Treasury bills3-month6-month1-year
Commercial paper1-month3-month
6.65 4.47 8.36 8.78 9.29 9.29 9.72 3 / +1.36
6.276.516.62
4.414.554.67
7.958.038.03
8.158.628.45
8.759.239.13
8.859.319.16
8.309.199.19
+.35+1.16-1.16
+.94
+.15+.57+.74
6.58 4.53 8.36 8.84 9.13 9.37 10.00 +1.64 +1.166.66 4.63 8.46 8.99 9.40 9.72 10.26 +1.80 +1.27
Large negotiable CDs 4/3-month 6.626-month 6.84
4.60 8.654.65 8.90
9.35 10.13 10.25 10.70 +2.05 --1.359.70 11.00 11.00 11.30 +2.40 +1.60
Bank prime rate 7.75 6.25 9.50 10.00 10.25 10.50 10.75 +1.25
Intermediate- and long-term ratesCorporateNew AAA 5/Recently offered 6/
Municipal(Bond Buyer) 7/
U.S. Treasury(constant maturity)3-year7-year
20-year
8.36 7.90 8.748.48 7.95 8.73
- 9.23 9.23 9.30p +.569.03 9.24 9.24 9.31p +.58
5.93 5.45 6.02 6.10 6.21 6.21 6.17 --. 15 +.07
7.397.667.96
5.746.487.20
8.418.418.43
8.548.618.66
9.329.008.90
9.048.688.72
9.048.808.75
FOMC FOMCLow High Sept. Oct. Oct. Nov. Nov. Sept. Oct.8/ 8/ 19 17 31 1 14 FOMC FOMC
Stock pricesDow-Jones Industrial 807.74 985.74 861.57 866.34 792.45 827.79 785.26 -76.31 -81.08N.Y.S.E. Composite 50.13 56.98 57.84 56.89 51.67 53.79 51.36 -6.48 -5.53AMEX 110.37 126.86 169.07 163.55 136.75 143.42 138.98 -30.09 -24.57Keefe Bank Stock 6/ 530 633 691 676 694 694 619 -72 -57
1/ Daily averages for statement week, except where noted.2/ One-day quotes except as noted.3/ Average for first 6 trading days of statement week ending November 15.4/ Highest quoted new issues.5/ 1978 figures are averages for preceding week.6/ 1978 figures are one-day quotes for preceding Friday.7/ 1978 figures are one-day quotes for preceding Thursday.8/ Calendar week averages.
+.75
+.28
+.63+.39+.32
+.50+.19+.09
~1~1_

III - 3
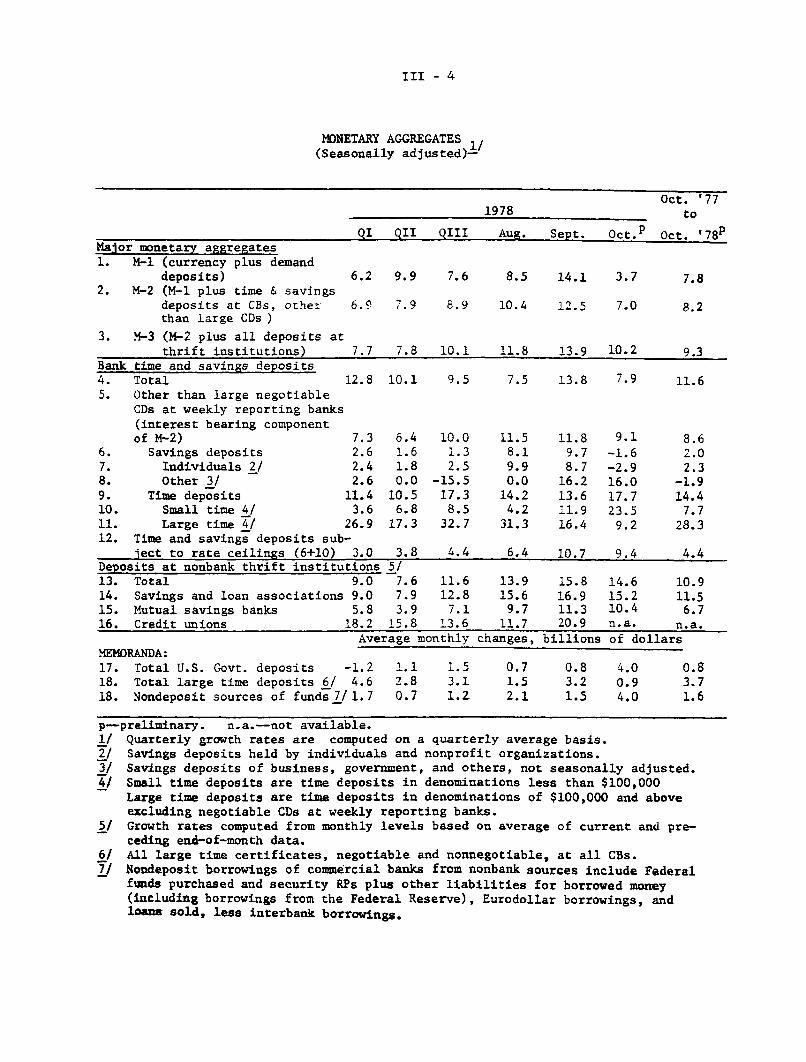
Growth in the major monetary aggregates slowed markedly in
October from the rapid pace of the previous month, mainly reflecting
sharply reduced inflows of demand and savings deposits at commercial
banks. Unusually large inflows to small time accounts--associated
with record sales of money market time deposits--enabled banks to
finance a moderate expansion of bank credit without increasing signif-
icantly their rate of issuance of managed liabilities.
Funds raised by private borrowers during October apparently
remained about the same as the volume registered in September. Short-
term borrowing by nonfinancial businesses picked up during the month,
while gross issues of long-term corporate securities moderated from the
September pace. Net mortgage borrowing by households appears to have
increased slightly for the third consecutive month, and consumer credit
expansion apparently remained near its reduced third-quarter pace. In
the public sector, the gross volume of tax-exempt security offerings
was somewhat higher than in September, while Treasury borrowing decreased
slightly. Net offering of marketable issues from the Treasury in October
were much reduced from the volume of the previous month, reflecting in
part large foreign purchases of nonmarketable securities.
Monetary Aggregates and Bank Credit
M-1 expanded at a 3-3/4 per cent annual rate in October, off
sharply from the extremely rapid 14 per cent rate the preceding month
and the slowest pace since March.1 The slower monthly average growth
1/ Following the pattern of the first month of most other recent quarterssince the beginning of 1976, there was a bulge in demand deposits early
in October. However, the run-off in these deposits later in the month
was more pronounced than in similar periods of previous quarters, andhence the monthly increase for October as a whole was small.
III - 4
MONETARY AGGREGATES(Seasonally adjusted)1/
Oct. '771978 to
QI QII QIII Aug. Sept. Oct. P Oct. '78Major monetary aggregates1. M-1 (currency plus demand
deposits) 6.2 9.9 7.6 8.5 14.1 3.7 7.82. M-2 (M-1 plus time & savings
deposits at CBs, other 6.9 7.9 8.9 10.4 12.5 7.0 8.2than large CDs )
3. M-3 (M-2 plus all deposits atthrift institutions) 7.7 7.8 10.1 11.8 13.9 10.2 9.3
Bank time and savings deposits4. Total 12.8 10.1 9.5 7.5 13.8 7.9 11.65. Other than large negotiable
CDs at weekly reporting banks(interest bearing componentof M-2) 7.3 6.4 10.0 11.5 11.8 9.1 8.6
6. Savings deposits 2.6 1.6 1.3 8.1 9.7 -1.6 2.07. Individuals 2/ 2.4 1.8 2.5 9.9 8.7 -2.9 2.38. Other 3/ 2.6 0.0 -15.5 0.0 16.2 16.0 -1.99. Time deposits 11.4 10.5 17.3 14.2 13.6 17.7 14.410. Small time 4/ 3.6 6.8 8.5 4.2 11.9 23.5 7.711. Large time 4/ 26.9 17.3 32.7 31.3 16.4 9.2 28.312. Time and savings deposits sub-
ject to rate ceilings (6+10) 3.0 3.8 4.4 6.4 10.7 9.4 4.4Deposits at nonbank thrift institutions 5/13. Total 9.0 7.6 11.6 13.9 15.8 14.6 10.914. Savings and loan associations 9.0 7.9 12.8 15.6 16.9 15.2 11.515. Mutual savings banks 5.8 3.9 7.1 9.7 11.3 10.4 6.716. Credit unions 18.2 15.8 13.6 11.7 20.9 n.a. n.a.
Average monthly changes, billions of dollarsMEMORANDA:17. Total U.S. Govt. deposits -1.2 1.1 1.5 0.7 0.8 4.0 0.818. Total large time deposits 6/ 4.6 2.8 3.1 1.5 3.2 0.9 3.718. Nondeposit sources of funds7/ 1.7 0.7 1.2 2.1 1.5 4.0 1.6
p-preliminary. n.a.-not available.1/ Quarterly growth rates are computed on a quarterly average basis.2/ Savings deposits held by individuals and nonprofit organizations.3/ Savings deposits of business, government, and others, not seasonally adjusted.4/ Small time deposits are time deposits in denominations less than $100,000
Large time deposits are time deposits in denominations of $100,000 and aboveexcluding negotiable CDs at weekly reporting banks.
5/ Growth rates computed from monthly levels based on average of current and pre-ceding end-of-month data.
6/ All large time certificates, negotiable and nonnegotiable, at all CBs.7/ Nondeposit borrowings of commercial banks from nonbank sources include Federal
funds purchased and security RPs plus other liabilities for borrowed money(including borrowings from the Federal Reserve), Eurodollar borrowings, andloans sold, less interbank borrowings.

III - 5
of M-l may in part have reflected an unwinding of transitory special
factors--including the effects of early disbursement of Social Security
checks and of delays in processing individual tax payments--which boosted
expansion in September, as well as a subsequent temporary diminution in
the public's deposits associated with the run-up in Treasury balances
during October. In addition, the rapid rise in market interest rates
over recent months likely has exerted a depressing effect on the demand
for cash balances.
Although commercial banks experienced a slight net outflow
from savings accounts in October, following two consecutive months of
surprisingly rapid growth of these deposits, sharply accelerated inflows
to small-denomination time accounts kept the expansion of total interest-
bearing deposits subject to rate ceilings near the rapid September pace.
At the same time, issuance of ceiling-free large time deposits included
in M-2--which had acted to boost M-2 expansion throughout the first three
quarters of the year--slowed, and the rate of growth of the interest-
bearing component of M-2 moderated. M-2 growth dropped to a 7 per cent
annual rate in October--slightly below the average pace of the past
12 months.
Since early September, rates available on the 6-month money
market time deposits (MMTDs) at banks have exceeded ceiling rates on all
other small-denomination time deposits, including the recently autho-
rized 8-year certificate. In the 5-month period since MMTDs were intro-
duced in June, these certificates attracted nearly $14 billion, on a not
seasonally adjusted basis, while other small time deposits with maturi-
ties of less than 4 years declined about $7 billion and inflows to
III - 6
longer-term small time accounts decelerated (see Chart on page 7).
The attractive terms on the MMTDs undoubtedly have induced depositors
to shift from savings and other time accounts with fixed ceilings; how-
ever, time and savings deposits subject to rate ceilings have grown at
a substantially more rapid pace since June, suggesting that a part of
the sales over this period represented funds that banks otherwise would
have lost to market instruments.
At thrift institutions, deposits grew at a 14-1/2 per cent
annual rate in October, slightly below the rapid pace of the previous
month, and M-3 growth slowed from 14 per cent in September to 10-1/4 per
cent last month. The MMTD apparently has augmented deposit flows to
these institutions even more than to commercial banks; deposit growth
at thrifts averaged 13 per cent at an annual rate from June through
October, well above the 8 per cent average monthly growth for the first
five months of the year. Over the June-October period, total deposits
at S&Ls rose $21-1/2 billion, not seasonally adjusted, and deposits of
mutual savings banks grew $3-3/4 billion; growth in MMTDs over the same
period was about $25 billion at S&Ls and $8 billion at mutual savings
banks.1
Total loans and investments at commercial banks grew at a
9-1/2 per cent annual rate in October, slightly below the pace of the
third quarter. Bank holdings of Treasury securities declined for the
1/ There have been scattered reports that some thrift institutionsrecently have begun to de-emphasize the certificates due to theirhigh cost. According to recent surveys, about the same number ofthrifts were offering MMTDs in September as in August; but fewerMSBs were reported to be paying the ceiling rate, and S&Ls apparentlyhave cut back on their advertising and promotions.

III - 7
ESTIMATED LEVELS OF SMALL-DENOMINATION TIME DEPOSITSBY MATURITY AT ALL INSURED COMMERCIAL BANKSMonthly averages, not seasonally adjusted
-Billionsof
dollars
Maturing in less 90than 4 years
Excludingmoney markettime deposits
-80
Maturing in 4 years - 70or more
60
50
1977 19781976

III - 8
COMMERCIAL BANK CREDIT
(Per cent changes at annual rates, based on seasonally adjusted data)1/
12
1978monthsending
QI QII QIII Aug. Sept. Oct. Oct.
1. Total loans & invest-ments 1/
2. Investments
3. Treasury securities
4. Other securities
2/5. Total loans-
6. Business loans
7. Security loans
8. Real estate loans
9. Consumer loans
9.7 13.5 10.7 5.2
3.3 8.6 2.3 -5.5
9.9 9.5 11.0
3.2 -4.6 1.7
- 11.7 -8.5 -32.5 -8.7 -24.9
5.3 6.7 8.8 11.0 10.2 7.2
12.3 15.4 14.0 9.4 12.5 14.8
16.3 19.0 11.0 12.3
-5.1
6.0
14.9
9.5 10.5 14.8
-29.9 62.4 -24.0 -132.1 12.9 -76.6
16.1 17.2 17.1 18.5 15.2 16.2
14.6 21.0 17.1 22.1
-6.9
18.3
13.6 n.a. n.a.
MEMORANDA:
10. Commercial paperissued by non-financial firms3/
11. Business loans atbanks net of bankholdings of bankersacceptances
12. Sum of items 10 & 11
13. Memo item 12 plusbusiness loans fromfinance companies
-2.5 30.6 18.9 / -6.8
17.8 19.5 11.0 9.2
16.1 20.3 11.5 -r 8.0
15.5 18.6 9.6
6.r-/ 33.9
9.7 12.3
9.5-/ 13.8
6.4 n.a.
18.2
15.8
16.0
n.a.
n.a.-not available. r/--revised.1/ Last-Wednesday-of-month series except for June and December, which are
adjusted to the last business day of the month.2/ Loans include outstanding amounts of loans reported as sold outright to a
bank's own foreign branches, nonconsolidated nonbank affiliates of thebank, the bank's holding company (if not a bank), and nonconsolidated non-bank subsidiaries of the holding company.
3/ Measured from end of month.

III - 9
third consecutive month, reaching their lowest level as a proportion
of bank credit since May 1975; however, at 9.4 per cent, this ratio
remained well above the record low of 7.3 per cent in November 1974.
At large banks, Treasury security run-offs were concentrated in bills
and may have been associated with their low rates relative to rates
on other short-term instruments. Meanwhile, with bank profits rising
over the year, acquisitions of other securities--mainly tax exempt
issues--continued in October. Business and real estate loans rose
more rapidly in October than in September, while security loans out-
standing declined.
Banks' issuance of managed liabilities in October remained
at about the same high rate as in other recent months, although the
composition shifted somewhat. Over the first nine months of the year,
large time deposits accounted for about three-fourths of the average
$4-3/4 billion monthly increase in managed liabilities. In October,
however, total large time deposits increased less than $1 billion, as
banks raised $4 billion from nondeposit sources. In late October
and early November, weekly reporting banks both inside and outside
New York City sharply increased their issuance of negotiable CDs,
reportedly in association with their revised expectations concern-
ing further advances in interest rates over the coming months, but
perhaps in part to finance advances to banking offices abroad.
Business Finance
Borrowing by nonfinancial firms at banks and in the commercial
paper market accelerated to a 13-3/4 per cent annual rate of growth in

III - 10
October, while the gross volume of long-term security offerings declined.
Bank business loans (net of holdings of bankers acceptances) expanded
at a 12-1/4 per cent annual rate, above the 11 per cent rate in the
third quarter, but below the average rate over the last year.1 In
contrast to the pattern over most of the third quarter, the strength
in business loans was concentrated at large banks--particularly those
outside New York City--as growth at small banks fell to the slowest
pace since May.2
Commercial paper issued by nonfinancial firms rose $500 million
during October, somewhat greater than the average monthly increase in the
previous two quarters, and reportedly due to continued heavy issuance by
industrial corporations and several foreign concerns. The most recent
data for business credit at finance companies indicate a $300 million
decline for September--the first monthly drop in a year--as larger-than-
1/ Unlike the experience in October of the preceding three years, no
unusually large increase in holdings of bankers acceptances--which are classified as business loans on bank reports--actedto boost the seasonally adjusted level of business loans at com-mercial banks. On a last-Wednesday basis, large banks added only$200 million in acceptances in October compared to an average $750million during 1975-1977. Increased business lending at large
banks this year has reduced their need to build up their acceptanceportfolios in order to boost loan loss reserves for tax write-offs.Previous year-end build-ups and subsequent run-offs in the earlymonths of the following year of bankers acceptances held in port-folio had masked underlying movements in business lending activity.
2/ Term loans as a proportion of total commercial and industrial loansat large banks fell during September and October, after rising forseveral months. The proportion of long-term loans made at fixed
rates had declined sharply between May and August (most recent data),particularly at large banks outside of New York. Such developments
may have reflected tighter balance sheet positions at these banks aswell as their concern over future increases in interest rates.
III - 11
CORPORATE AND FOREIGN SECURITIES: GROSS OFFERINGS(Monthly totals or monthly averages, in millions of dollars)
1977 1978
Year H1 QIII
e / Sept.e/ Oct.e/Nov. f/ Dec. f /
Seasonally adjusted
Corporate securities--total 4,518 3,587 4,510 4,506 3,760 4,175 3,675
Publicly offered bonds 2,016 1,489 2,317 1,969 1,619 2,025 1,750
Privately placed bonds 1,501 1,366 1,307 1,502 1,425 1,325 1,250
Stocks 1,001 732 886 1,035 716 825 675
Not seasonally adjusted
Publicly offered bonds 2,016 1,695 1,726 1,500 1,800 1,900 1,400By quality 1/
Aaa and Aa 1,089 820 870 550 950
Less than Aa 2/ 927 875 856 950 850 -
By type of borrowerUtility 692 525 770 600 1,100
Industrial3/ 700 578 540 750 400 -
Financial 624 592 416 150 300
Foreign securities--total 621 640 371 400 750 475 -
Publicly offered4/ 437 466 183 325 750 425 300
Privately placed 184 174 188 75 0 50
1/ Bonds categorized according to Moody's bond ratings.2/ Includes issues not rated by Moody's.3/ Includes equipment trust certificates.4/ Classified by original offering date.e/ Estimated.f/ Forecast.
III - 12
usual reductions in auto dealer inventories associated with the model
change-over period resulted in a large decline in automotive lending.
Net expansion of business credit at finance companies for the entire
third quarter totaled only $400 million, the smallest quarterly in-
crease since the final three months of 1975. Total short- and inter-
mediate-term business credit expanded at a 9-1/2 per cent annual rate
in the third quarter, considerably below the 17 per cent pace for
the first half of the year.
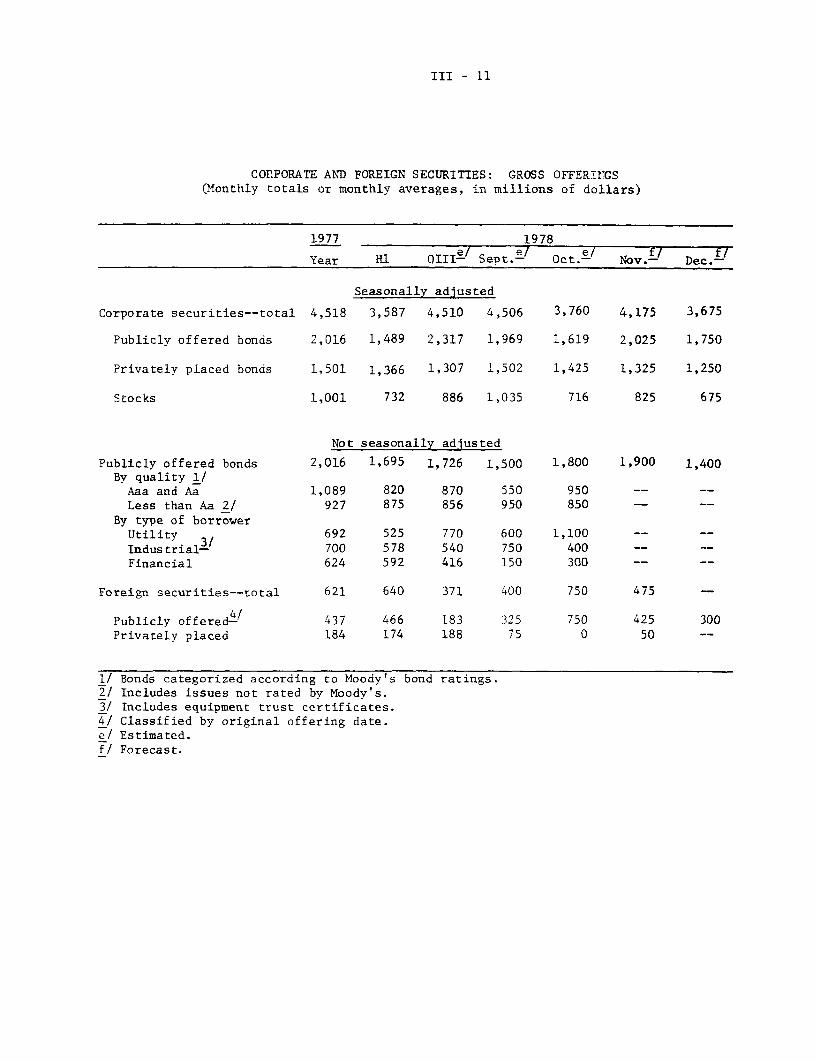
Gross public offerings of bonds by nonfinancial corporations
increased less than seasonally in October. Several large, highly
rated issues by electric and gas companies and communication firms
accounted for the majority of the October slate, while public offer-
ings of bonds by industrial concerns were relatively light. Public
offerings by financial corporations rebounded somewhat in October, but
remained below their levels earlier this year.
Since early 1977, nonfinancial corporations have met a higher
proportion of their financing needs by increasing their reliance on
short-term borrowing and by limiting their acquisition of liquid assets.
As a result, measures of liquidity for nonfinancial corporations--such
as the ratio of liquid assets to total current liabilities and the ratio
of short-term debt to total debt--have retraced nearly all of the improve-
ment that was recorded in the first two years of the current expansion
(see Chart on page 13).
During the second half of October, stock prices fell in heavy
trading, with shares of smaller firms posting the largest declines. The
American Stock Exchange index decreased about 20 per cent over this period,

III - 13
LIQUIDITY MEASURES FOR NONFINANCIAL CORPORATIONS 1/
Assets/Total Current Liabilities
1975 1976 1977 1978
Short-term Market Debt/Total Market Debt
Per Cent
. 35.0
S34.0
S33.0
S32.0
* 31.0
* 30.0
* 29.0
S28.0
. 27.0
. 26.0
Per Cent
-1 27.5
26.5
25.5
24.5
23.5
1975 1976 1977 1978
1/ Liquid assets include cash and deposits, U.S. Gov't. securities, State and local obligationsand open market paper. Short-term debt consists of short-term bank loans, open market paper,finance company loans, U.S. Gov't. loans, and construction loans. Current liabilities in-clude short-term debt plus trade debt plus profit taxes payable. Flow of Funds data, sea-sonally adjusted. Data for 19 78 -Q3 are preliminary.

III - 14
and the New York Stock Exchange index dropped over 12 per cent.
The downward trend in stock prices generally, and in those of smaller
firms particularly, probably reflected investors' increasing con-
cern over inflation and the depreciation of the dollar. The actions
announced November 1 were favorably received, and the Dow Jones Industrial
Average registered a record single-day increase of 35 points. Since then,
however, all of this gain has been reversed, as market participants
apparently grew more pessimistic about the near-term probability of
a recession.
Institutional activity, as indicated by large block trans-
actions, continued to dominate trading in late October; however, frag-
mentary evidence suggests that individual investors accounted for a
larger proportion of trading activity during this period than earlier
in the year. Some of this increased individual activity may have been
associated with the reportedly large number and amount of margin calls
prompted by the sharp drop in stock prices. Over $300 million of
margin debt was liquidated in October--the largest monthly decline
since the end of 1973.1 As stock prices stabilized in early November,
the number and dollar volume of margin calls declined substantially.
Government Securities Markets
Rates on short-term government securities have increased less
than other money market rates since mid-October, reflecting in part
1/ The fall in stock prices had a marked impact on the quality of margincredit; over October, the proportion of margin debt in accounts inwhich customer equity positions amounted to less than 40 per cent of
the value of the underlying collateral rose to 47 per cent from15 per cent at the end of September. Brokers customarily issue
margin calls when customer equity positions fall to around 30 per cent.
III - 15
(Monthly totalsGOVERNMENT SECURITY OFFERINGSor monthly averages, in millions of dollars)
1977 1978
Year H1 QIII Sept. Oct.-e Nov.f Dec.-
Seasonally adjusted
State and local governmentsecurities, gross offerings
TotalLong-termShort-term
U.S. Government securities,net offerings
U.S. Treasury 1/Sponsored agencies
5,8073,9131,894
6,3214,3521,969
3,9982,4681,530
3,654 3,080 2,9042,320 1,641 1,635
Not seasonally adjusted
5,1703,2301,940
5,4004,0001,400
-325 745307 1,480
State and local governmentsecurities, gross offerings
TotalLong-termShort-term
U.S. Government securities,net offerings
U.S. Treasury1 /
Sponsored agencies
5,7703,8911,879
6,1984,0862,112
6,0124,1831,829
4,2762,3001,976
3,422 2,382 3,560 2,483601 2,012 2,130 2,334
4,7003,2001,500
5,1003,8001,300
4,0002,8001,200
1,823 2,700 5,550647 1,094 97
e/ Estimated.f/ Forecast.
1/ Marketable issues only.
5,1503,6001,550
3,362658

III - 16
substantial purchases of bills by foreign official institutions.1
Even so, rates on short-term Treasury issues generally rose more
than long-term government yields in this period. The more pro-
nounced downward slope of the yield curve which has emerged
since November 1 suggests that the announced actions to reduce infla-
tion and support the dollar have strengthened investors' beliefs that
short term interest rates will decline in the near future (see Chart
on page 17).
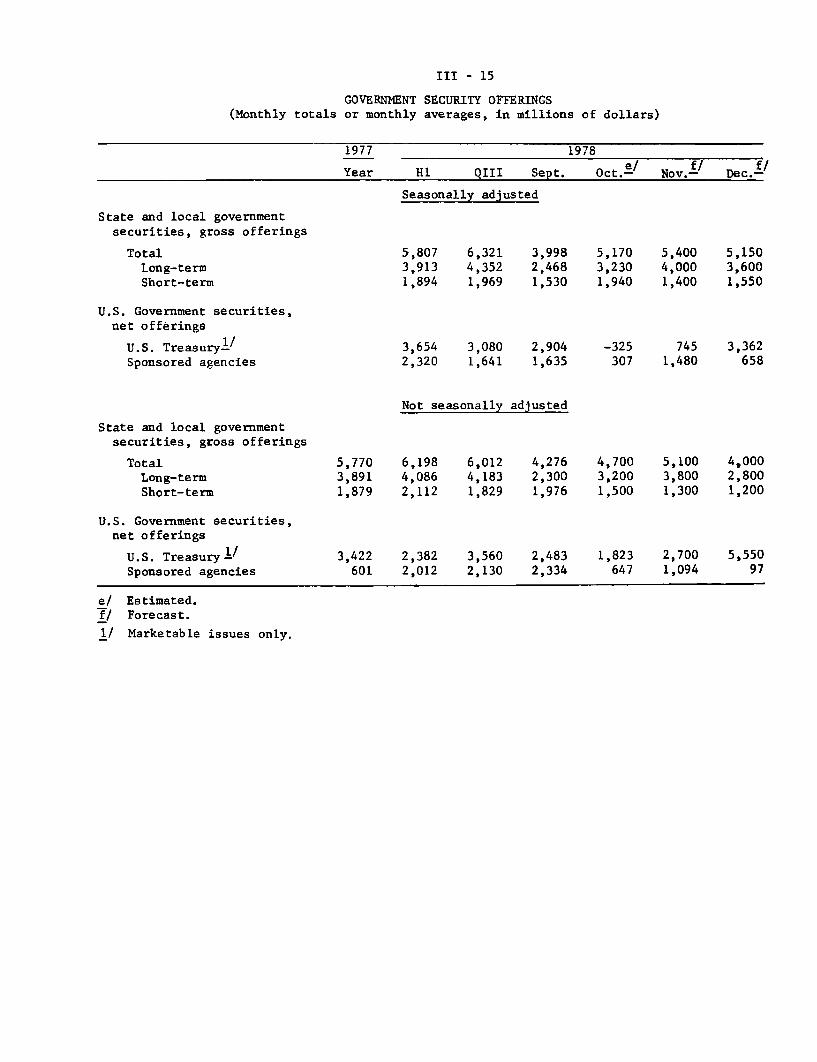
Offerings of marketable Treasury issues declined in October.
The Treasury's reduced reliance on borrowings in the open market in
part reflected $3 billion of purchases of nonmarketable securities
by foreign official institutions, mostly associated with dollar-support
activities. The Treasury has indicated that it expects to raise
about $11.0 billion through marketable borrowing during the fourth
quarter. To date, about half of this total has been raised through
sales of $3.3 billion of coupon issues in October and another $2.2
billion in the mid-quarter refunding of early November. Federally
sponsored credit agencies borrowed about $300 million, seasonally
adjusted, in October, down sharply from the September pace. Net issuance
of long-term debt by the principal Federal housing agencies--FHLB
and FNMA--was slightly negative; the agencies financed their October
lending activity by selling off liquid assets and by issuing a small
amount of discount notes.
1/ In the five weeks ending November 8, marketable and nonmarketablegovernment securities held at the Federal Reserve Bank of NewYork for foreign buyers increased by $10.3 billion.

III - 17
Yields On U.S. Treasury Securities
Per cent per annum
-- 10.0
-- 9.5
S OCTOBER 31, 1978
- - - - -- - - - - - - -** NOVEMBER 12, 1978
*............................................OCTOBER 17, 1978
OCTOBER 17, 1978 8.5
,, I I I I I I 1 I 1 I I I I I I .Ij 0.0YEARS TO MATURITY
III - 18
Gross offerings of long-term tax-exempt securities totaled
about $3.2 billion in October, up sharply from the previous month
but well below the average monthly volume earlier this year. As
in September, almost all of October's bond sales were for new capital,
in marked contrast to the pattern of offerings earlier this year when
refundings and advance refundings accounted for about 30 per cent of
the total.
Mortgage Markets
Net mortgage lending in October apparently increased somewhat
from the third quarter pace, and the home mortgage component--which
bore the brunt of the first-half decline--likely strengthened. Real
estate loans at commercial banks are estimated to have expanded at close
to the continued rapid rate recorded in the third quarter. New issues of
GNMA-guaranteed securities picked up again in October, and purchases of
mortgages by FNMA remained around the third quarter volume. At savings
loan associations--still the major suppliers of mortgage funds despite
the substantial reduction in loan activity since the record levels of
late 1977--net mortgage lending probably increased from the reduced
average for the third quarter.
As deposit growth continued strong in September, estimated new
mortgage commitments at S&Ls increased somewhat, and their mortgage com-
mitments outstanding rose for the second consecutive month, to $32.2
billion. Through September, net mortgage lending by S&Ls, which ordi-
narily lags commitment activity by several months, had advanced only
modestly from the July low. During the third quarter, S&Ls used a sub-
stantial portion of their improved deposit inflows to rebuild liquid

NET CHANGE IN MORTGAGE DEBT OUTSTANDING
(In billions of dollars, seasonally adjusted annual rates)
1977 1978
e/QIII QIV QI QII QIIIe/
By type of debt:
Total 141 151 133 137 140
Residential 114 116 100 103 104
1- to 4-family 107 106 90 94 93Multifamily 7 10 10 9 11
Other1/ 27 35 33 34 36 HH
By type of holder:
Commercial banks 32 31 25 31 36Savings and loans 61 62 54 52 48
Mutual savings banks 8 8 7 6 7
Life insurance companies 5 9 6 9 10FNMA and GNMA -3 * 6 13 8
GNMA pools 18 18 15 7 11Other2/ 20 23 20 19 20
i/ Includes commercial and other nonresidential as well as farm properties.2/ Includes mortgage pools backing securities guaranteed by the Federal Home
Loan Hortgage Corporation or Farmers Home Administration, some of which mayhave been purchased by the institutions shown separately.
e/ Partially estimated.SLess than $0.5 billion.

III - 20
INTEREST RATES AND SUPPLY OF MORTGAGE FUNDSAT SELECTED S&Ls
Period1977--High
Low
1978--HighLow
1978--JulyAug
Sep
Oct 613
20
27
Nov 310
Conventional home mortgagesAverage rate on Basis point
new commitments change from Spread1/
for 80% loans month or (basis
(Per cent) week earlier points)
9.00 -- +92
8.65 -- +37
10.059.00
9.75
9.809.78
9.85
9.85
9.859.88
9.90
10.05
+101
+30
+67
+100+72
+81
+66
+65
+65+75
Per cent of S&Ls 2/
with mortgage funds
in short supply22
2
6919
625760
65615959
57n.a.
1/ Average mortgage rate minus average yield on new issues of Aaa utility bonds.2/ Per cent reporting supply of funds slightly or substantially below normal
seasonal patterns.
SECONDARY
FNMA auctions ofConventional
1977--HighLow
Amount
($ millions)
Offered Accepted416 278
108 83
1978--High
Low
19 7 8--Oct 2
16 3362330 425
Nov 613 488
HOME MORTGAGE MARKET ACTIVITY
forward purchase commitmentsGovt.-underwritten
Yield
toFNMA1/
9.218.81
10.31
9.28
10.10
10.18
10.31
10.49
Amount
($ millions)Offered Accepted
885 57050 35
1011130
682
425
857
453
Yieldto
FNMA1 /
8.988.46
605 10.2080 9.13
279 9.91
176 9.98
378 10.20
182 10.27
Yields on GNMA-
guaranteed
mortgage-backed
securities for
immediate
delivery -8.39
7.56
9.328.43
9.139.07
9.109.209.32
9.179.18
1/ Average gross yield before deducting fee of 38 basis points for mortgage servicing.Data, based on 4-month FNMA purchase commitments, reflect the average accepted bidyield for home mortgages, assuming a prepayment period of 12 years for 30-year loanwithout special adjustment for FNMA commitment fees and related stock requirements.Mortgage amounts offered by bidders relate to total eligible bids required.
2/ Average net yields to investors assuming prepayment in 12 years on pools of 30-yearFHA-VA mortgages carrying the prevailing ceiling rate on such loans.
--
--
III - 21
asset balances and significantly slowed net borrowing from the FhL Banks
(on a seasonally adjusted basis).1 In October, FHLB advances to S&Ls
again picked up, and deposit flows into these institutions slackened.
The average contract interest rate on new commitments for 80
per cent, 30-year conventional home mortgages at sampled S&Ls was 10.05
per cent on November 10, up 20 basis points since the October FOMC
meeting and reflecting increases in 3 of 5 FHLC regions. Since June,
rates on these commitments have increased 30 basis points despite the
robust deposit flows at thrift institutions during this period. The
computed rate average may understate to some degree the true average
rate on commitments made, since rates in areas where State usury
ceilings may have constrained the volume of activity still enter the
index with a fixed weight. 2
Yields in secondary markets for home mortgages have increased
somewhat since mid-October. Average yields on accepted bids in the
FNMA commitment auctions have risen about 30 basis points. Effective
rates on GNMA-guaranteed securities--which generally follow movements
in Treasury bond markets--have increased less than 10 basis points.
1/ The liquidity ratio at insured S&Ls in September--as measured bycash and liquid assets as a percentage of deposits plus short-termborrowings--increased for the third consecutive month to 9.24 per cent,the highest ratio since October of 1977. The minimum required liquidityratio, set by the Federal Home Loan Bank Board, now stands at 6.5 percent.
2/ Nineteen States, containing about half of the U.S. population, cur-rently have usury ceilings below the national average contract rate.However, there are several exceptions tc these ceilings. For example,FHA/VA underwritten mortgages are exempt from the ceilings inmost States, points may be charged to increase effective yields insome States, and loans from certain lenders also may be exempt.In all States, National banks may charge 1 pereentage point morethan the Federal Reserve discount rate, currently 9-1/2 per cent.

III - 22
Consumer Credit
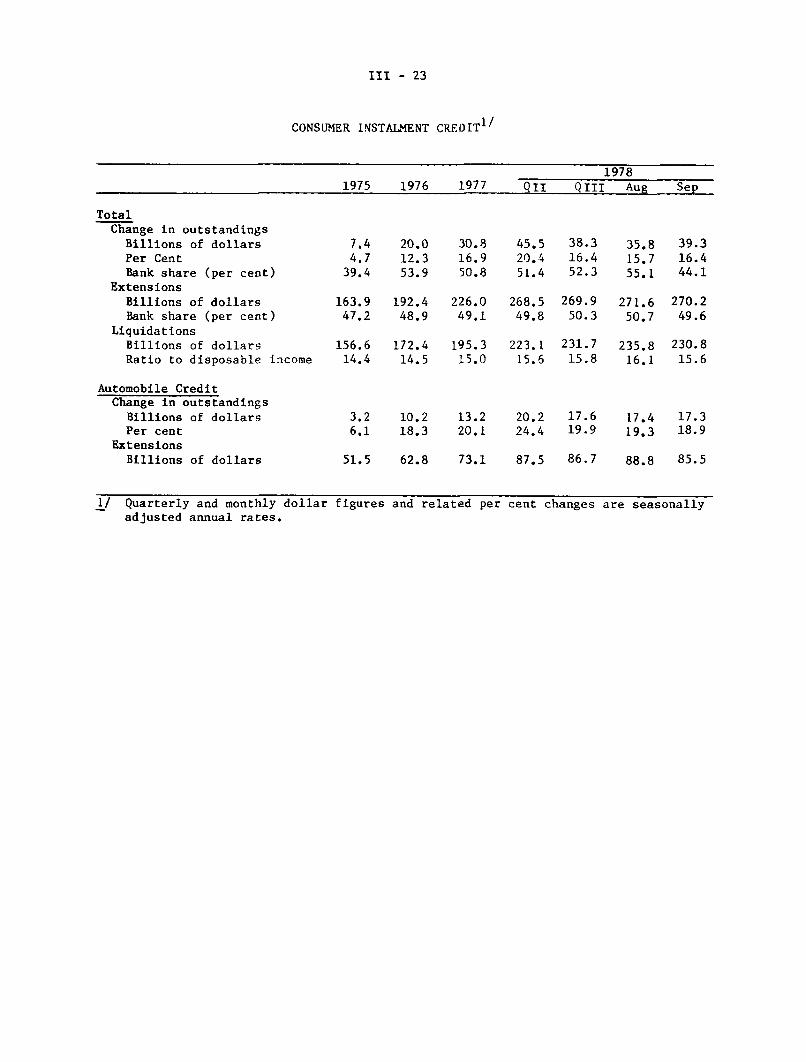
Growth in consumer credit outstanding picked up slightly in
September to a seasonally adjusted annual rate of 16 per cent--due pri-
marily to a drop in liquidations of existing debt from the large August
volume--and early indications suggest that instalment credit growth in
October held near the September pace. For the third quarter, instalment
credit outstanding expanded at a 16 per cent annual rate, down from the
20 per cent second quarter pace, but about equal to the average rate of
growth during 1977.
As the increase in liquidations again outpaced the growth in
disposable income in the third quarter, the ratio of liquidations to
income--a commonly used indicator of household instalment debt burden--
reached 15.8 per cent. This level compares with 15.0 per cent a year
earlier and a high of 15.9 per cent in the early 1970's. With estimated
mortgage repayments added to instalment credit liquidations, total house-
hold debt payments were equal to 20.9 per cent of disposable income
in the third quarter, a new high for the combined ratio (see Chart on
page 24). Available direct measures of payment difficulties continue
to present a mixed picture. The delinquency rate at auto finance
companies has edged up to midway between its historical high and
low, and some slight upward movement is observable in commercial bank
consumer loan delinquency rates; on the other hand, mortgage delin-
quencies at S&Ls have declined.
III - 23
CONSUMER INSTALMENT CREDIT1/
19781975 1976 1977 QII QIII Aug Sep
Total
Change in outstandings
Billions of dollarsPer Cent
Bank share (per cent)Extensions
Billions of dollarsBank share (per cent)
Liquidations
Billions of dollars
Ratio to disposable income
Automobile CreditChange in outstandings
Billions of dollarsPer cent
Extensions
Billions of dollars
7.44.7
39.4
20.012.353.9
30.8
16.950.8
45.520.451.4
38.316.452.3
35.815.755.1
39.3
16.444.1
163.9 192.4 226.0 268.5 269.9 271.6 270.2
47.2 48.9 49.1 49.8 50.3 50.7 49.6
156.6 172.4 195.3 223.1 231.7 235.8 230.8
14.4 14.5 15.0 15.6 15.8 16.1 15.6
3.2 10.2 13.2 20.2 17.6 17.4 17.3
6.1 18.3 20.1 24.4 19.9 19.3 18.9
51.5 62.8 73.1 87.5 86.7 88.8 85.5
1/ Quarterly and monthly dollaradjusted annual rates.
figures and related per cent changes are seasonally

HOUSEHOLD DEBT BURDEN(REPAYMENTS RELATIVE TO DISPOSABLE INCOME)
- . .... -- ..-- .--- ------i- -7- -..1 TT lr
Mortgage and Consumer Credit
K
LN,
J/
Concumer Credit
7-
\,/
1974 1976II I 1978
1978
PERCENT
-21
N~ C----
1 _ 1 _
19721970

U.S. International Transactions(in million of dollars; receipts, or increase in liabilities, +)
November 15, 1978
1. Trade balance 1/2. Merchandise exports3. Merchandise imports
4. Change in net foreign positions of bankingoffices in U.S.(excl. liab. to foreign official inst.)
Through interbank transactions with5. a) Own offices in foreign countries6. b) Unaffiliated banking offices in foreign countries
Through nonbank transactions7. a) Claims on nonbanks in foreign countries (increase, -)8. b) Liabilities to private nonbanks in foreign
countries (inc. custody liab.)
9. Private securities transactions, net (excl. U.S. Treas. Oblig.)10. Foreign net purchases of U.S. corp. bonds11. Foreign net purchases of U.S. corp. stocks
12. U.S. net purchases (-) of foreign securities13. Foreign net purchases of U.S. Treasury obligations
U.S. (increase +)
By AreaG-10 countries and SwitzerlandOPECAll other countries
By Type18. U.S. Treasury securities19. Other 2/
20. Change in U.S. reserve assets (increase -)
21. All other transactions and statistical discrepancy
1976 1977 1978
Year Year Q4 Q1 Q2 Q3 July Aug. Sept.
-9.353 -31.059 -10.170 -11.-i1 -7.802 -7.789 -3.529 -1.853 -2.407114,694 120,585 29,457 30,664 35,067 37,182 11,534 12,513 13,135
-124,047 -151,644 -39,627 -41,865 -42,869 -44,97L -15,063 -14,366 -15,542
-9.935 -3,907 -5.142 -6.031 3,344 -897 438 -1,440 105
-6,282 -2,717 -5,545 -3,346 4/ 1,980 -2,652 -228 4,860-3,220 -2,203 -147 -2,369 4/ -617 3,023 -559 -3,081
-3,142 -423 -487 -180 4/ -2,785 -548 -1,060 -1,177
2,709 1,436 1,037 -136 4/ 525 615 407 -497
-7.480 -2,650 55 -475 86 2-204 -275 10 i97 1,549 223 133 179 381 50 238 93
853 1,325 580 341 1,018 -118 -44 -102 28-8,730 -5,524 -748 -949 -1,111 -467 -281 ;146 -40
2,783 569 -297 881 796 -1,053 -1,568 -108 B22
13.091 35.406 15.152 14.899 -5373 4.551 3.542 1.936 -)97
3,922 29,414 14,476 12,312 -3,085 5,436 2,475 3,271 -3106,802 5,989 757 1,354 -2,389 -1,645 269 -1.481 -4332,367 3 -81 1,233 101 760 798 146 -184
9,315 30,218 12,900 12,964 -5,589 3,155 2,479 1,328 -6523,776 5,188 2,252 1,935 216 1,396 1,063 608 -275
-2,532 -237 -2 246 328 14 32 49 -67
13.426 1.878 404 1.681 8,621 5,378 1,360 1,426 2,593
:Current account 3/ 4,339 15,265 -6,959 6,854 -3,261Current account 1/ 4,339 -15,265 -6,959 -6,854 -3,261 n.a. n.e. n.a. n.a.
J/ International accounts basis, seasonally adjusted.1/ Includes deposits in banks, commercial paper, bankers'3/ Seasonally adjusted.4/ Data not shown separately because of break in series.
acceptances, and borrowing under repurchase agreements.
RESTRICTED
RESTRICTED
1II /. ,I - ^ * 4¢4-^ 4 114.

INTERNATIONAL DEVELOPMENTS
Foreign exchange markets. Although the average exchange value
of the dollar is now about the same as it was five weeks ago, in the interim
it experienced stunning changes in both directions
. The dollar's average exchange value fell by
four per cent over four days following the President's announcement on
October 24 of a program to contain inflation. Market participants then
began to anticipate the adoption of forceful policies to tighten monetary
policy and increase U.S. authorities' access to and use of intervention
resources; and when new measures were announced on November 1, the dollar's
average value jumped by nearly five per cent. Prompt and vigorous applica-
tion of the new policies stimulated further increases that brought the dollar's
value by November 3 to nearly eight per cent above its October low. There-
after, the dollar's value fluctuated near the rates reached in the first
days of the month
The measures announced on November 1 included an increase of one
percentage point in the discount rate and establishment of a supplementary
reserve requirement of two per cent on time deposits of $100,0OO or more.
The volume of gold to be auctioned in December will be at least twice as
great as the 750,000 ounces previously announced and subsequent auctions
may also be enlarged. To increase intervention resources, Federal Reserve
swap lines with Germany, Switzerland, and Japan were increased by a total of
$7.6 billion to $15 billion and the previously unused arrangement with Japan

IV - 2
was activated. The Treasury also announced plans to sell a total of $2
billion equivalent of Special Drawing Rights to the same three countries;
to draw $3 billion equivalent of foreign currencies from the IMF (accomplished
on November 6 and 9); and to issue up to $10 billion equivalent in foreign-
currency denominated securities.
, $2 billion equivalent was in the form of sales of foreign
currencies -- mostly marks -- by the Desk for the accounts of the System
and Treasury; half of that amount also was sold November 1 and 2. Swap-
financing of the System's share in that and later intervention has brought
outstanding System swap commitments to nearly $4 billion.
Before the hectic period just discussed, a realignment of the
snake currencies was accomplished, which helped ease the strains within the
EC currency arrangement. Over the weekend of October 14 - 15, the mark was
IV - 3
revalued by two per cent relative to the guilder and the Belgian franc
and by four per cent relative to the Danish and Norwegian currencies. In
order to absorb some of the large increase in mark liquidity caused by prior
intervention to maintain the old snake parities, the Bundesbank subsequently
raised reserve requirements of German banks and sold special Bundesbank
securities.
Since the time of the Federal Reserves's discount-rate increase,
two foreign central banks have raised their comparable rates. On November 6,
the Bank of Canada increased its discount rate from 10-1/4 per cent to
10-3/4 per cent. On November 9, the Bank of England raised ics minimum
lending rate from 10 per cent to 12-1/2 per cent.
IV - 4
U.S. international transactions. Third-quarter data show an
increase of more than $6 billion in foreign official holdings in the United
States (excluding OPEC holdings), sharply reversing the second-quarter
outflow; a second consecutive quarterly decline in OPEC banking and
securities holdings in the United States; a merchandise trade deficit
of $31.2 billion at an annual rate, unchanged from the second quarter;
and a small net outflow of bank-reported private capital, following a
second-quarter inflow. In the 5 weeks ending November 8, foreign official
holdings of G-10 countries in the United States are estimated to have
increased by more than $10 billion, indicating that there were large
private capital outflows which contributed to private demands on domestic
credit markets.
The merchandise trade deficit for September was $28.9 billion
at an annual rate, resulting in a third-quarter deficit of $31.2 billion,
unchanged from the second quarter. Exports increased by 6 per cent in
the third quarter, continuing to rebound from their weak performance in
1977, while imports rose by 5 per cent (see chart).
Nonagricultural exports increased by 8 per cent in value during
the third quarter, with volume up 3 per cent from the second quarter and
unit values 5 per cent higher. Major underlying factors were a 60 per
cent increase in the value of civilian aircraft exports, a 10 per cent
increase in exports of nonagricultural industrial supplies, and a 5 per
cent increase in machinery exports. Exports of automotive products and
consumer goods showed little change.

IV - 5
U.S. International Transactions Summary(in billions of dollars, n.s.a., (-) = outflow)
1977 1 9 7 8Year Q- 1 Q-2 Q-3 July Aug. Sept.
I1. Trade balance, n.s.a. 1/ -31.1 -11.1 -7.3 -9.4 -4.3 -2.7 -2.4
2. Private capital trans. adj. 2/ -6.0 -7.4 4.7 -1.9 -. 1 -1.6 -. 23. Private capital as rept. net -6.0 -5.6 4.2 -2.2 -1.4 -1.6 .84. Reporting bias 3/ -- -1.8 .5 .3 1.3 -- -1.0
5. OPEC net investments in U.S. 6.0 1.4 -2.4 -1.6 .3 -1.5 -.46. Other foreign official assets 29.4 13.5 -3.0 6.2 3.3 3.4 -.57. U.S. reserve assets -.2 .3 .3 * * * -.1
8. All other 4/ 1.9 3.4 8.2 5.1 * 1.6 3.6
Memorandum (seasonally adjusted annual rates).9. Trade balance 1-31.1 -44.8 -31.2 -31.2 -42.3 -22.2 -28.910. GNP net exports of goods
and services 1-10.9 -24.1 -5.5 -6.5 n.a. n.a. n.a.Current account balance '-15.3 -27.4 -13.0 n.a. n.a. n.a. n.a.
1/ International accounts basis. For seasonally-adjusted number see line 9.2/ Includes bank-reported capital, foreign purchases of U.S. Treasury securities,
and other private securities transactions.
3/ Adjustment for reporting bias in bank-reported data associated with week-endtransactions. See page IV 10-11 in the June 1976 greenbook.
4/ Includes service transactions, unilateral transfers, U.S. government capital,direct investment, nonbank capital transactions, and statistical discrepancy.
*/ Less than $50 million.
Agricultural exports during the third-quarter declined slightly
from their strong second-quarter performance, although exports of wheat,
cotton and tobacco were moderately higher than second-quarter levels.
Some of the overall decline was due to price reductions of about 5 per
cent for both soybeans and corn.
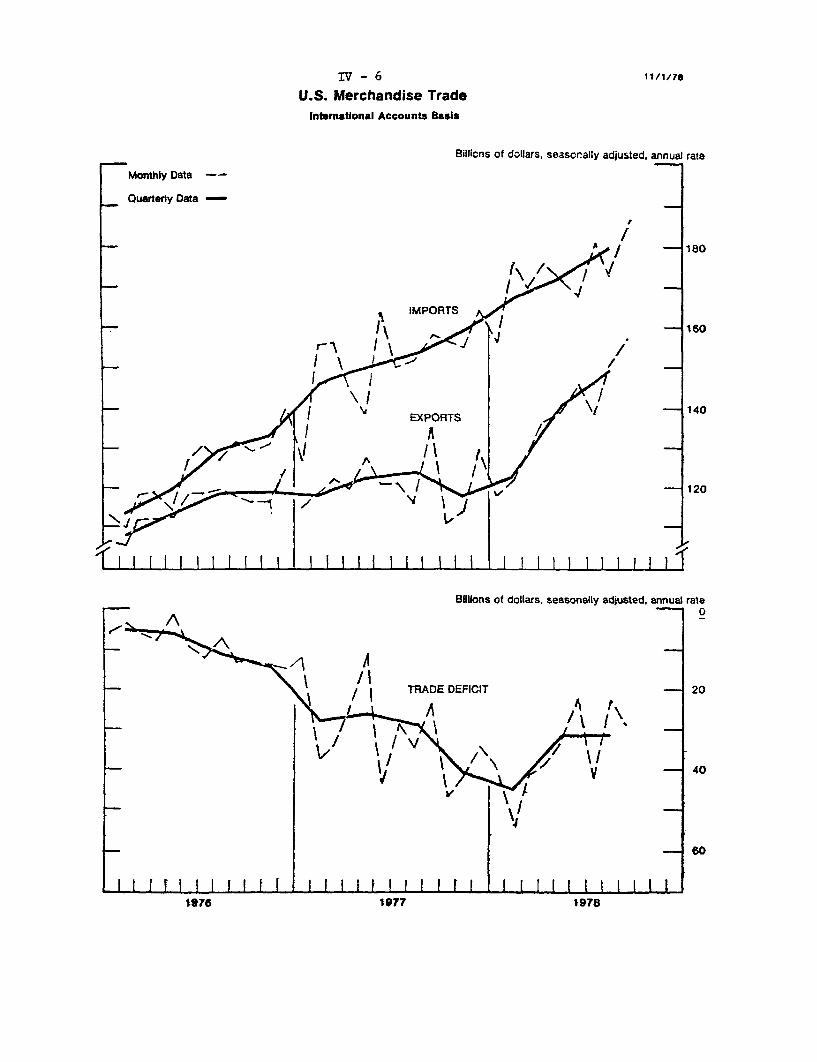
Monthly Data --
Quarterly Data -
IV - 6 11/1/70
U.S. Merchandise TradeInternational Accounts Basis
Billions of dollars, seasonally adjusted, annual rate
/
160
\ " EXPORTS 140/\/
I /
A I-'v\
- 120
Billions of dollars, seasonally adjusted, annual rate0
AI TRADE DEFICIT - 20
40
-- 60
19771976 1978

IV - 7
U.S. Merchandise Trade, International Accounts Basis(billions of dollars, seasonally adjusted annual rates)
1977 1 9 7 8
Year 1Q 2Q 3Q Aug.* Sept.*
EXPORTS 120.6 122.7 140.3 148.7 150.2 157.6Agric. 24.4 26.0 32.0 31.6 33.9 30.2Nonagric. 96.2 96.6 108.3 117.2 116.2 127.5
IMPORTS 151.7 167.5 171.5 179.91 172.4 186.5Petroleum 45.0 39.8 43.2 43.2 42.6 46.7Nonpetrol. 106.7 127.7 128.2 136.7 129.8 139.8
BALANCE -31.1 -44.8 -31.2 -31.2 -22.2 -28.9
NOTE: Details may not add to totals because of rounding.
*/ The monthly International Accounts figures are only rough estimates and
are subject to considerable revision.
Nonpetroleum imports increased by nearly 7 per cent in value
during the third quarter, primarily reflecting higher import volumes.
This increase was spread over a broad range of commodities, with the
sharpest rise occurring in capital goods, particularly machinery items
such as engines, turbines and business machines.
Petroleum imports in the third quarter were unchanged from
the second-quarter value of $43.2 billion (annual rate), as volume
held steady at 8.9 million barrels per day and the average price
remained at about $13.25 per barrel. There has not yet appeared to be
any stockbuilding in anticipation of a price increase next year.
IV - 8
Foreign official assets in the United States (excluding OPEC
holdings) increased by more than $6 billion in the third quarter, with
a decline in September (reflecting Canadian sales of U.S. dollars to
support Canadian currency) following increases of more than $3 billion
in both July and August. In the five weeks ending November 8, official
G-10 holdings in the United States are estimated to have increased by
another $10 billion, reflecting large foreign central bank purchases of
dollars and U.S. drawings on swap lines to finance intervention sales of
foreign currencies.
OPEC banking and securities holdings in the United States
declined by $1.6 billion in the third quarter. The reduction in OPEC
holdings, which began with the second-quarter outflow of $2.4 billion,
reflects reduced OPEC current-account surpluses as well as some diversifi-
cation out of traditional dollar-denominated assets. A decline in
Venezuela's holdings more than accounted for the $0.4 billion September
reduction in total OPEC holdings. In October, however, OPEC assets at
FRBNY increased by $0.4 billion.
Bank-reported private capital transactions resulted in a third-
quarter net outflow of $0.6 billion (adjusted for reporting bias),
following a second-quarter net inflow of $3.3 billion. The third-quarter
outflow was more than accounted for by a surge in lending to public
borrowers in Canada ($0.9 billion) and Latin America ($0.9 billion).

IV - 9
The increase in loans to Canada reflects drawings on bank-provided credit
lines to finance Canadian official intervention activity.
Private securities transactions show that foreigners were
small net sellers of U.S. corporate stock in the third quarter, and
responses to an early November survey of securities firms by the
FRBNY suggest that foreigners were moderately active net sellers during
the stock market's October price decline. Scheduled new foreign security
issues in the United States during October-November are now estimated
at $1.2 billion, slightly above the third-quarter rate. Notably, all
October-November issues scheduled to date involve Canadian borrowing,
including the Canadian government's second $750 million issue during 1978.

IV - 10
Foreign Economic Developments. As third-quarter data are
becoming available, our basically positive view of last month on GNP
growth prospects abroad remains unchanged. The average rate of growth
abroad (in G-10 countries) is currently at about 3-1/2 per cent annual
rate. In Germany, where growth has been below this average, industrial
production has shown a marked improvement since May. In Japan and
Canada GNP growth prospects continue to be above average even though
recent industrial production figures in these two countries show some
slight slowdown in the rate of increase. For France, Italy and the
Benelux countries prospects for growth remain relatively modest.
Inflation, as measured by the change in the consumer price
index is currently running at an average annual rate of about 7 per
cent abroad, with Germany and Japan in the 3-4 per cent range and the
United Kingdom, Canada and France in the 8-9 per cent range. In Italy
the rate is currently about 12 per cent.
The employment picture abroad has remained weak.
Even countries with relatively strong economic activity such
as Japan, Canada and Germany have failed to reduce unemployment rates
appreciably in the third quarter, although the number of employed has
risen in Germany and Canada. Japan's unemployment rate remains at a
record high level. In Canada only the October figure shows a decline.
Among other countries, France has been recording an increase in the
rate of unemployment and rates in Italy and the Benelux countries
remain at very high levels.

IV - 11
The combined trade surplus of six major foreign countries in
the third quarter was approximately equal to the second-quarter surplus
of $13 billion (not an annual rate). The large German share of this
combined surplus expanded further, while the large Japanese share de-
clined slightly. Adjustment to currency appreciation in Japanese trade
may have begun, whereas German trade does not yet show signs of adjust-
ment. Among the remaining countries, Italy's trade balance swung from
a surplus in the second quarter to a deficit in the third. The small
second quarter U.K. deficit widened somewhat in the third quarter.
Individual country notes. In Japan the likelihood of
attaining the announced target of 7 per cent real GNP growth in FY1978
(ending in March 1979) continues to be low, despite official Japanese
pronouncements to the contrary. Although industrial production rose
by about 1 per cent in both August and September, the average level
of industrial production in the third quarter was only 0.4 per cent
above the second quarter level. In recent months somewhat stronger
domestic demand has been partially offset by a weakening contribution
from the external sector, as effects of past exchange-rate changes
appear to be taking hold more strongly on export volumes. Accordingly,
there is growing concern in Japan that the ¥ 2.5 trillion budget pack-
age, which was announced in September and approved by the Japanese Diet
last month, may not be sufficient to realize the official growth target.
Unemployment continues at very high levels. The appreciation of the
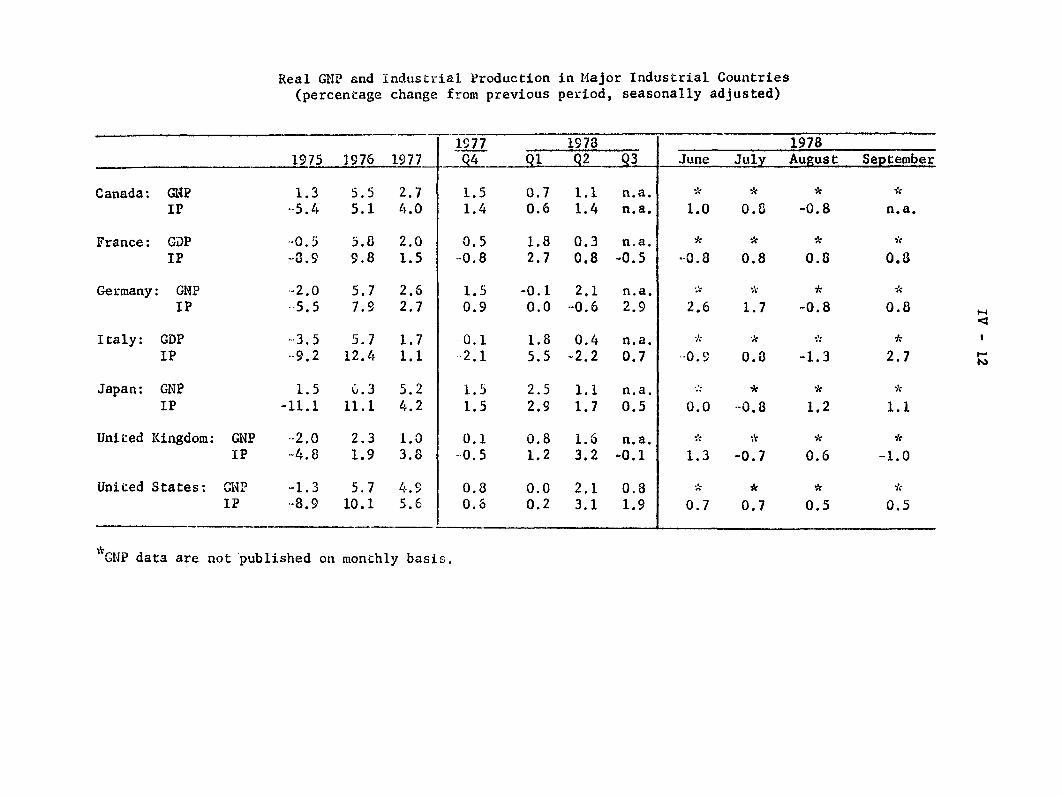
Real GNP and Industrial Production in Major Industrial Countries(percentage change from previous period, seasonally adjusted)
1977 1978 19781975 1976 1977 Q4 Q1 Q2 Q3 June July August September
Canada: GNPIP
France: GDPIP
Germany: GNPIP
Italy: GDPIP
Japan: GNPIP
United Kingdom:
United States:
1.3 5.5 2.7-5.4 5.1 4.0
-0.5 5.8 2.0-8.9 9.8 1.5
-2.0 5.7 2.65.5 7.9 2.7
-3.5 5.7 1.7-9.2 12.4 1.1
1.5 6.3 5.2-11.1 11.1 4.2
GNP -2.0 2.3 1.0IP -4.8 1.9 3.8
-1.3 5.7 4.9-8.9 10.1 5.6
1.51.4
0.5-0.8
0.7 1.1 n.a.0.6 1.4 n.a.
1.8 0.3 n.a.2.7 0.8 -0.5
1.5 -0.1 2.10.9 0.0 -0.6
0.12.1
1.51.5
0.1-0.5
0.80.6
n.a.2.9
1.8 0.4 n.a.5.5 -2.2 0.7
2.5 1.1 n.a.2.9 1.7 0.5
0.8 1.6 n.a.1.2 3.2 -0.1
0.0 2.1 0.80.2 3.1 1.9
1.0 0.8
* *
-0.8 0.8
2.6 1.7
-0.8
0.8
-0.8-0.8
* *.
0.9 0.8 -1.3
*
0.0 -0.8
*
1.3 -0.7
7 0*
0.7 0.7
*
1.2
*
0.6
0.50.5
*
n.a.
0.8
*
0.8
*
2.7
1.1
*
-1.0
0.5
GNP data are not published on monthly basis.
GNPIP
- --- ------ II ---- ^-
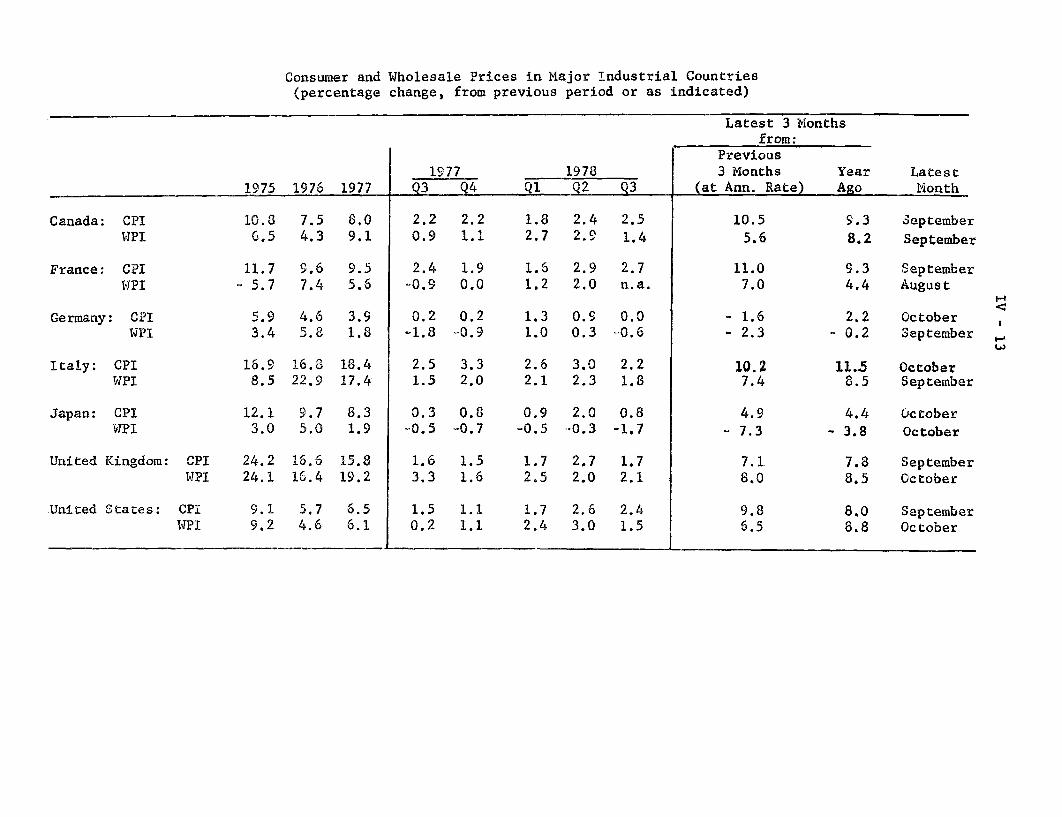
Consumer and Wholesale Prices in Major Industrial Countries(percentage change, from previous period or as indicated)
Latest 3 Monthsfrom:
Previous1977 1978 3 Months Year Latest
1975 1976 1977 Q3 Q4 Q2 Q2 Q3 (at Ann. Rate) Ago Month
Canada: CPIWPI
France: CPIWPI
Germany: CPIWPI
Italy: CPIWPI
Japan: CPIWPI
United Kingdom:
United States:
10.8 7.5 8.06.5 4.3 9.1
11.7 9.6 9.5- 5.7 7.4 5.6
5.9 4.6 3.93.4 5.8 1.8
16.9 16.8 18.48.5 22.9 17.4
12.1 9.7 8.33.0 5.0 1.9
CPI 24.2 16.6 15.8WPI 24.1 16.4 19.2
9.1 5.7 6.59.2 4.6 6.1
2.2 2.20.9 1.1
2.4 1.9-0.9 0.0
0.2 0.2-1.8 -0.9
2.5 3.31.5 2.0
0.3 0.8-0.5 -0.7
1.6 1.53.3 1.6
1.50.2
1.8 2.4 2.52.7 2.9 1.4
1.6 2.9 2.71.2 2.0 n.a.
1.3 0.9 0.01.0 0.3 -0.6
2.6 3.0 2.22.1 2.3 1.8
0.9 2.0 0.8-0.5 -0.3 -1.7
1.7 2.7 1.72.5 2.0 2.1
1.7 2.6 2.42.4 3.0 1.5
10.55.6
11.07.0
- 1.6- 2.3
10.27.4
4.9S7.3
7.18.0
9.86.5
9.3 3eptember
8.2 September
9.34.4
SeptemberAugust
2.2 October- 0.2 September
11.5 October8.5 September
4.4 October
- 3.8 October
7.8 September8.5 October
8.0 September8.8 October
CPIWPI
- -'- I- -I- - - --~ - - I

Current-Account Balances of Major Industrial Countries a/
(billions of U.S. dollars; seasonally adjusted)
1977 1978 19781976 1977 Q3 Q4 Q1 Q2 Q3 July Aug. Sept. Oct.
Canada: TradeCurrent Account
France: TradeCurrent Account
Germany: TradeCurrent Accountb/
Italy: TradeCurrent Accountb/
Japan: TradeCurrent Account
United Kingdom: TradeCurrent Account
1.2 2.2-3.9 -3.9
0.4 0.7-1.2 -0.7
-4.2 -2.2 -0.5 0.1-6.0 -3.3 -0.8 -0.4
13.5 16.53.9 3.9
-6.5 -2.5-2.9 2.3
9.9 17.53.7 11.0
-6.3 -2.9-2.0 0.6
3.7 4.82.0 3.8
-0.2 -0.22.3 0.7
4.2 4.62.7 3.1
-0.1 0.11.0 0.9
1.3 0.5 0.6-0.5 .1.2 n.a.
-0.1 0.3 0.30.0 1.0 n.a.
4.3 5.0 5.51.6 2.0 -0.3
-0.1 0.5 -0.80.3 n.a. n.a.
7.4 6.8 6.75.5 4.8 4.5
0.0 0.2 0.5 n.a.* * * *
0.2 -0.2 0.3 n.a.* * * *
1.3 2.0 2.3-1.0 0.1 0.6
n.a.n.a.
-1.1 0.2 0.1 n.a.* * * *
2.1 2.1 2.4 n.a.1.4 1.4 1.6 n.a.
-1.1 -0.2 -0.6 -0.3 0.1 -0.4 0.2-0.6 0.4 -0.1 -0.1 0.3 -0.3 0.4
United States: TradeCurrent Account
-9.3 -31.1 -7.3 -10.24.3 -15.3 -2.9 -7.0
-11.2 -7.8 -7.8-6.9 -3.3 n.a.
-3.5 -1.9 -2.4* * *
a/ The current account includes goods, services, and privateb/ Not seasonally adjusted.* Comparable monthly current-account data are not published.
and official transfers.
Trade and
n.a.*

Growth of Money Stock in Selected Industrial Countries
Canada (M1)
France (M2 )
Germany(CBM)1/
Japan(M2 )
Switzerland(Ml)2
United Kingdom(M 3)
United States(Ml)
(M2)
Jan.
-1.0
0.7
1.4
0.6
0.2
2.4
0.9
0.8
Feb.
1.1
1.9
1.1
0.9
2.0
2.4
0.0
0.4
(percentageseasonally
Mar. Apr.
-0.7 -0.4
0.4 1.3
0.8 0.7
1.0 2.2
6.6 0.3
0.6 2.5
0.3 1.6
0.4 0.9
1978change from previous month,adjusted monthly rates)
May
3.1
0.0
1.0
0.2
-0.6
0.9
0.6
0.6
June July A Sept.
0.8
1.6
0.7
1.4
0.1
0.3
0.6
0.7
1.0
1.2
0.4
1.1
-4.8
1.1
0.4
0.7
1.4
n.a.
1.3
1.0
3.0
-1.0
0.7
0.9
Percentage changein latest 3 monthsfrom same periodyear earlier
1.0
n.a.
1.0
0.8
n.a.
1.2
1.2
1.0
10.5
12.1
11.2
12.0
15.0
14.9
8.0
8.2
Central Bank Loney, equal to currency plus non-currencyrequirements as of January 1974.
2/ Not seasonally adjusted.
components of M3 weighted by their reserve
I ------ --
IV - 16
yen has exerted a moderating influence on both wholesale and consumer
prices. Wholesale prices have maintained their slow decline, and the
Japanese consumer price index has continued to rise at about a 4 per
cent annual rate.
Another extremely large monthly current-account surplus was
recorded in September ($1.6 billion, s.a.), bringing the cumulative
surplus through the first three quarters of the year to slightly less
than $15 billion. Although there was a significant increase in export
volume in September, in recent months a downward trend is becoming
apparent. Third quarter average export volume was about 4 per cent
below its level of the previous year. The volume of imports has in-
creased by over 7 per cent during the same period. October's current-
account surplus is expected to be significantly below the September
level, primarily because of Japanese prepayment to the United States of
approximately $1 billion for uranium enrichment services under Japan's
emergency import program. (Because of assymetry in the U.S. and
Japanese treatments of this item in their respective international
accounts, however, this transaction will not have a corresponding
positive effect on the U.S. current-account deficit in the current
quarter.)
The outlook for the German economy, which had changed for the
better in September, continues on the positive side, as the mild recovery
appears to be broadening. One big factor in the improved outlook is
fiscal measures taken in 1977, which are having their impact now, and

IV - 17
the further measures of July this year, which are expected to increase
demand next year. Third-quarter industrial production exceeded the
second quarter by almost 3 per cent and third quarter 1977 by 3.2 per
cent. Investment -- other than in construction which has been booming --
is now rising on a broad front with new investment orders leading other
sectors. The trade balance has so far not shown the effect of DM
appreciation. The trade surplus this year through September was DM 30
billion against DM 27 billion for the same period last year.
In spite of central bank money expansion now running at an
annual rate of 11 per cent, the cost of living index through October
has been only 2.7 per cent above the same period of 1977. The rate of
unemployment is only marginally improved from a seasonally adjusted level
of 4.4 per cent during the summer to 4.3 per cent in September and
October.
Industrial production in Canada declined in August by 0.8 per
cent, slowing the recently rapid rate of expansion. Industrial
production in the last three months is now about 1.0 per cent above the
previous three months. Manufacturing output was particularly weak while
mining production advanced strongly. The unemployment rate remained at
8.5 per cent (s.a.) through September and fell to 8.2 per cent in October.
The general CPI declined in September -- however, it was up about 2.5
per cent in the third quarter. The rise of the non-food CPI has contin-
ued its more moderate pace and was up about 1.5 per cent in the third
quarter. The merchandise trade surplus rose to over $C600 million in
September -- with the value of exports rising by over 20 per cent while
imports rose by less than 10 per cent.
IV - 18
Economic activity in the United Kingdom continues to show
signs of strength and price inflation rates remain low relative to
British experience during the past several years. The U.K.'s current
account recorded a small deficit in the first 9 months of this year.
However, the U.K.'s external position has improved sufficiently to
allow the government to repay some of its external debt ahead of
schedule. On October 30, the British government repaid another
$1 billion to the IMF, bringing the total repaid to the IMF this year
to $2 billion. On November 9, the Bank of England increased its
Minimum Lending Rate (MLR) from 10 to 12-1/2 per cent. The MLR had
been at 10 per cent since June 8 and had become out of line with money
market rates in recent weeks. On the same day, Chancellor Healey
announced that the target rate of growth of M3 for the next 12 months
(subject to review in 6 months' time) is 8-12 per cent. The rate is
the same as before but because M3 growth has been below 8 per cent
(s.a.a.r.) since April 1978, in effect money growth has been tightened
somewhat.
Economic developments in France continue to be dominated by
Prime Minister Barre's program of gradual liberalization of industrial
prices and increased competition. Labor market conditions have
worsened in the past few months, with the unemployment rate standing at
6 per cent in September, compared with 5-1/2 per cent a year earlier.
Industrial production remains sluggish, with the third-quarter average be-
low the second-quarter average. France's external situation has

IV - 19
improved in 1978. The first three quarters show a trade surplus of
$0.4 billion, compared to a deficit of about $2.4 billion in the same
period last year. The current account surplus for the first half of
1978 reached almost $1 billion, contrasted with a deficit of $2.1
billion in the same period 1977.
Consumer prices in September stood 9.1 per cent higher than
a year earlier, although wholesale price movements have been somewhat
slower. Growth in the monetary aggregates has accelerated lately,
although M2 growth through July was only slightly above the announced
12 per cent target for 1978. The 1979 target will be cut to 11 per
cent, with the government taking several measures to restrain the
supply of new credit by the banking system.
In Italy second-quarter GDP rose by only 0.4 per cent (s.a.
not annual rate), providing further evidence that activity flattened
out in the second quarter; industrial production data for the last few
months also indicates that the economy is on a plateau although
production did rebound in September. On the other hand, both the
retail and wholesale price indexes accelerated in September, although
this may reflect seasonal factors and not a worsening trend of
inflation.
Although there have been some small signs of improvement in
the Benelux countries, economic activity remains weak, with 1978 real
GNP growth expected to be 2 per cent or less. Thus, current historically
high unemployment rates are not likely to decline in the near future.

IV - 20
Inasmuch as the stagnation of exports is largely responsible for the
continued slack, the devaluations of the guilder and the franc vis a
vis the DM by 2 per cent may help slightly.
In Switzerland the all-out policy of halting the appreciation
of the Swiss Franc announced October 1 followed indications of a
deterioration in the business outlook caused by the difficulties en-
countered by exporters. A recent survey disclosed a drop in sales,
incoming orders, order-book levels and earnings for almost all sectors
except construction since the second quarter.
A byproduct of focussing monetary policy on the exchange rate
is that M1 is expected to grow 15 per cent in 1978, triple the 5 per
cent target. Inflation continues to run at less than 1 per cent annually
and may even turn negative in coming months. The rapid M1 growth is not
expected to increase inflation in the short run because it simply
accommodates a presumed shift in the asset demand for Swiss Francs.

A - 1
APPENDIX AA BRIEF DESCRIPTION OF THE
"REVENUE ACT OF 1978"
The Revenue Act of 1978 which was signed into law onNovember 6, 1978 reduces tax liabilities by $21.4 billion forcalendar year 1979.1/ In broad terms, the Act cuts individual taxesby $12.9 billion, business taxes by $6.4 billion and capital gainstaxes by $2.0 billion. 2/ (See Table 1.) The Treasury Departmentestimates that about 32 per cent of the individual tax cuts--including capital gains--will go to taxpayers earning less than$20,000, 43 per cent to people earning between $20,000 and $50,000,and the remaining 25 per cent to those with incomes over $50,000.(See Table 2.) In terms of actual revenue collections, the newlaw will reduce fiscal year 1979 receipts by $11.6 billion, about$2 billion below the tax cuts specified in the Second ConcurrentBudget Resolution.
Individual Taxes
For individuals, the legislation contains a higher stan-dard deduction, a higher personal exemption, fewer and wider taxbrackets, rate cuts, and an increase in the earned income creditfor the working poor. Each of these tax reductions will becomeeffective on January 1, 1979.
(1) The zero bracket amount (formerly referred to asthe standard deduction) is increased from $3,200 to $3,400 forjoint returns and from $2,200 to $2,300 for single persons.
1/ This estimate was prepared by the Treasury Department and iscomparable to Congress' estimate of $18.7 billion after makingallowance for an accounting difference. The new Act alsoextends $13.5 billion in tax cuts that were scheduled to expireat the end of this year.
2/ These estimates are on a calendar year liability basis; whilethe estimates in the "Comments on the Fiscal Policy Outlook"(Greenbook - Part I) are on a NIA basis.
* Prepared by James Fralick, and Donna Lipresti, GovernmentFinance Section, Division of Research and Statistics.

A - 2
(2) The individual tax brackets are widened and restruc-tured, with the number of brackets reduced from 25 to 15. In addi-tion, rate reductions are mandated in certain lower- and middle-income brakcets. The increase in the zero bracket amount, thewidening of the tax brackets and the reduction of certain ratesrepresent a combined reduction in liabilities of $11.8 billion incalendar year 1979.
(3) The personal exemption is increased from $750 to$1,000 but the reduction in tax liabilities due to this provision($11.7 billion) is partly offset by an increase in liabilitiesresulting from the repeal of the general tax credit ($10.4billion revenue gain).
(4) The 10 per cent earned income credit is made per-manent and increased for families with dependent children. Thecredit under the old law reached a maximum of $400 at the $4,000income level and was completely phased out at an income of $8,000.The new maximum credit is $500 (10 per cent of the first $5,000)and the new trigger-off point is $10,000. In addition, beginningJuly 1, 1979, employees eligible for the credit will have it addedto their paycheck each pay period. Employers who make these advancepayments to eligible employees will be able to reduce their with-
holding and FICA tax liabilities. The reduction in liabilitiesassociated with this provision is $1.0 billion for calendar year1979.
(5) The deduction for State and local nonbusinessgasoline and other motor fuel taxes is repealed. This provisionis expected to increase tax liabilities by $1.2 billion incalendar year 1979.
(6) Unemployment compensation is taxed at higher levelsof adjusted gross income. The amount of unemployment compensation
included in taxable income would be one-half of the amount by whichadjusted gross income (including unemployment compensation) exceeds$20,000 for single taxpayers and $25,000 for married taxpayers filingjointly. This provision is expected to increase tax liabilities by$0.3 billion in calendar year 1979.
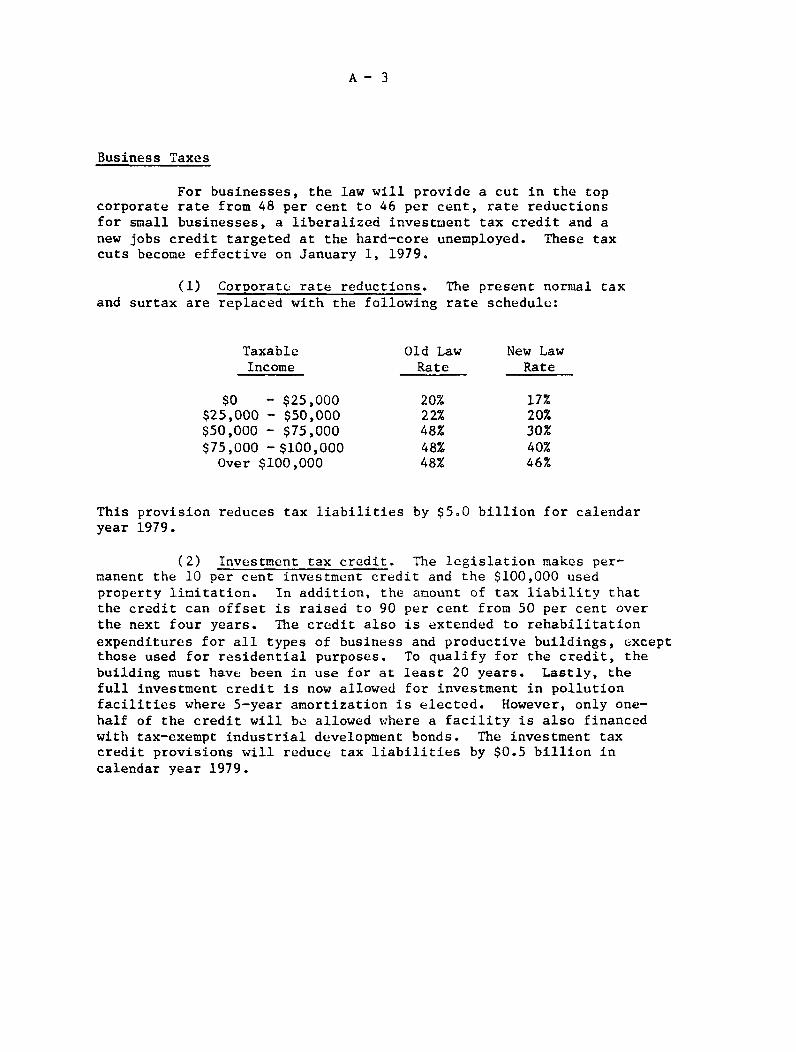
A - 3
Business Taxes
For businesses, the law will provide a cut in the topcorporate rate from 48 per cent to 46 per cent, rate reductionsfor small businesses, a liberalized investment tax credit and anew jobs credit targeted at the hard-core unemployed. These taxcuts become effective on January 1, 1979.
(1) Corporate rate reductions. The present normal taxand surtax are replaced with the following rate schedule:
Taxable Old Law New LawIncome Rate Rate
$0 - $25,000 20% 17%$25,000 - $50,000 22% 20%$50,000 - $75,000 48% 30%$75,000 -$100,000 48% 40%Over $100,000 48% 46%
This provision reduces tax liabilities by $5.0 billion for calendaryear 1979.
(2) Investment tax credit. The legislation makes per-manent the 10 per cent investment credit and the $100,000 usedproperty limitation. In addition, the amount of tax liability thatthe credit can offset is raised to 90 per cent from 50 per cent overthe next four years. The credit also is extended to rehabilitationexpenditures for all types of business and productive buildings, exceptthose used for residential purposes. To qualify for the credit, thebuilding must have been in use for at least 20 years. Lastly, thefull investment credit is now allowed for investment in pollutionfacilities where 5-year amortization is elected. However, only one-half of the credit will be allowed where a facility is also financedwith tax-exempt industrial development bonds. The investment taxcredit provisions will reduce tax liabilities by $0.5 billion incalendar year 1979.
A - 4
(3) The general jobs credit is allowed to expire and isreplaced with a jobs credit that is targeted at individuals in sevenneedy groups. The credit would be equal to 50 per cent of the first$6,000 of wages for the first year of employment. The credit willapply to taxable years beginning after December 31, 1978 and beforeJanuary 1, 1982. The reduction in liabilities associated with thetargeted jobs credit is $0.4 billion for calendar year 1979.
Capital Gains Taxes
The law reduces the top rate on individual gains to 28per cent from 49 per cent through a number of changes includingan increase in the capital gains exclusion and the deletion ofcapital gains from the minimum tax. Also provided are a $100,000exclusion on the sale of a residence, a reduction in the corporatecapital gains tax rate and certain revenue raising provisions suchas a new alternative minimum tax on individual gains.
(1) Capital gains deductions for individuals. The amountof any net capital gain that an individual may deduct from grosstaxable income is increased from the current 50 per cent to 60 percent, beginning with transactions occurring after October 31, 1978.The remaining 40 per cent of the net capital gains is included ingross income and is subject to tax at regular rates. The deductedgain is classified as a tax preference item for minimum tax purposes(see provision below). Under the previous law, the highest marginal
rate applied to wage and salary income was 50 per cent, but theamount eligible for this tax rate was reduced dollar for dollarby the excluded portion of capital gains. Under the new law, theexcluded capital gains do not have to be deducted from the incomeeligible for the maximum tax. The above provisions will lower nettax liabilities by $0.9 billion for calendar year 1979. 3/
(2) Previously, an individual could choose to have thefirst $50,000 of capital gains taxed at a 25 per cent rate. Thisalternative tax on gains is repealed for taxable years beginningafter December 31, 1978. The increase in liabilities resulting
from the change is estimated at $0.1 billion in calendar year 1979.
(3) The corporate alternative tax on net capital gainsis reduced to 28 per cent from 30 per cent on those transactionsthat occur after December 31, 1978. This provision reducesliabilities by $0.1 billion in calendar year 1979.
3/ A total capital gain reduction of $1.8 billion is partly offsetby an estimated $0.9 billion tax increase resulting from addi-tional capital gains realizations.
A - 5
(4) Exclusion of gain on residential sales. The lawrepeals the provision that permits an individual who is 65 yearsor older to exclude capital gains resulting from the sale of aresidence. Instead, a homeowner 55 years or older may excludefrom gross income, on a one-time elective basis, up to $100,000of gain from the sale of a principal residence. The individualmust own and occupy the home for a period totaling 3 out of 5years preceding the sale. This change was made retroactiveto July 16, 1978 and will decrease liabilities by $0.4 billion incalendar year 1979.
(5) Minimum tax for individuals. The new law retainsthe previous minimum tax with respect to all preference itemsexcept the deducted amount of capital gains and "excess" itemizeddeductions (deductions--other than medical expenses and casualtylosses--exceeding 60 per cent of adjusted gross income). Thesetwo items plus taxable income, minus a $20,000 exemption are sub-ject to the new alternative minimum tax. The rate applied wouldbe 10 per cent on the first $40,000, 20 per cent on the next $40,000,and 25 per cent on amounts exceeding $80,000. Individuals wouldpay this new alternative minimum tax only if it exceeds regulartaxes plus the existing minimum tax, which continues to applyto all other tax preference items.
The repeal of the minimum tax for the deducted amountof capital gains and excess itemized deductions represents areduction in tax liabilities of $1.4 billion for calendar year1979. The alternative minimum tax partly offsets this loss withan increase in liabilities of $0.8 billion.
(6) Deferral of carryover basis for bequests. Priorto the Tax Reform Act of 1976, the law permitted heirs to avoidincome tax-but not estate taxes--on the capital gains accrued overtheir benefactor's lifetime. The heirs received a step-up in basison the inherited property; this meant that if the heir sold theasset, the only gain subject to tax was gain that occurred afterthe benefactor's death. The 1976 Act required an heir to carry-over any capital gains that accrued prior to the benefactor'sdeath with some adjustment for death taxes paid. To ease theeffects of the change, Congress--in 1976--agreed to apply thecarryover provisions to property passing from benefactors whodied after December 31, 1976. The new Revenue Act postpones theeffective carryover date so that the provisions will only applyto property passing from someone dying after December 31, 1979.The postponement of the carryover rules represents a reduction inliabilities of $0.1 billion in calendar year 1979.

A - 6
Table 1Revenue Impact of the Revenue Act of 1978
(billions)
Calendar Year Liability1979 1980 1981
Individual Tax Reductions and RevisionsTax rate reductions -10.4 -12.5 -15.0Increase zero bracket amount -1.4 -1.5 -1.5Increase exemption from $750 to $1,000 -11.7 -12.4 -13.1Repeal general tax credit 10.4 11.0 11.6Revisions in earned income credit -1.0 -1.0 -1.0Repeal deduction for gasoline tax 1.2 1.4 1.6Tax unemployment compensation .3 .3 .3Other revisions and reductions -.3 -.3 -.3
Subtotal, Individual -12.9 -15.0 -17.4
Business Tax Reductions and RevisionsCorporate rate reductions -5.0 -5.5 -6.0Investment credit revisions -.5 -.9 -1.9Targeted unemployment credit -.4 -.6 -.7Other revisions and reductions -.5 -.7 -.8
Subtotal, Business -6.4 -7.7 -9.4
Capital Gains Revisions60 per cent capital gains exclusion
and deletion of gains from maximum tax1/ -.9 -1.1 -1.3Repeal alternate tax .1 .2 .2Reduction of corporate alternate rate -.1 -.1 -.2Exclusion of gain on residential sale -.4 -.5 -.5Delete gains from minimum tax and
delete "excess" itemized deductionsfrom minimum and maximum tax -1.4 -1.5 -1.6
Alternate tax on capital gains and"excess" itemized deductions only .8 .9 1.0
Deferral of carryover basis -.1 -.2 -.2
Subtotal, Capital Gains -2.0 -2.3 -2.7
2/Total Reduction -21.4- / -25.0 -29.5
1/ Capital gain reduction is partly offset by the tax increase from additionalcapital gains realizations.
2/ This estimate was prepared by the Department of Treasury and is comparableto Congress' estimate of $18.7 billion after making allowance for an account-ing difference. Congress includes the repeal of the general jobs credit inits estimate whereas the Treasury does not. Treasury feels that the repealof the credit should not be included because the credit is due to expireat the end of 1978 and, therefore, is not a legislated change.
Detail may not equal total due to rounding.Source: Department of Treasury, Office of Tax Analysis.

A - 7
Table 2Individual Income Tax Provisions of the Revenue Act of 19781/
(1978 Levels of Income)
Change inIncome Class Tax Liability Per Cent
($ millions)
$0 - $10,000 -1,799 13.1
$10,000 - $20,000 -2,671 19.5
$20,000 - $30,000 -3,137 22.9
$30,000 - $50,000 -2,728 19.9
$50,000 - $100,000 -1,650 12.1
$100,000 - $200,000 -657 4.8
Over $200,000 -1,039 7.6
Source: Department of Treasury, Office of Tax Analysis.
1/ Includes capital gains and minimum tax changes.