fomc 19791120 g bpt 119791114
TRANSCRIPT
Prefatory Note
The attached document represents the most complete and accurate version available based on original copies culled from the files of the FOMC Secretariat at the Board of Governors of the Federal Reserve System. This electronic document was created through a comprehensive digitization process which included identifying the best-preserved paper copies, scanning those copies,1 and then making the scanned versions text-searchable.2 Though a stringent quality assurance process was employed, some imperfections may remain.
Please note that this document may contain occasional gaps in the text. These gaps are the result of a redaction process that removed information obtained on a confidential basis. All redacted passages are exempt from disclosure under applicable provisions of the Freedom of Information Act.
1 In some cases, original copies needed to be photocopied before being scanned into electronic format. All scanned images were deskewed (to remove the effects of printer- and scanner-introduced tilting) and lightly cleaned (to remove dark spots caused by staple holes, hole punches, and other blemishes caused after initial printing). 2 A two-step process was used. An advanced optimal character recognition computer program (OCR) first created electronic text from the document image. Where the OCR results were inconclusive, staff checked and corrected the text as necessary. Please note that the numbers and text in charts and tables were not reliably recognized by the OCR process and were not checked or corrected by staff.

CONFIDENTIAL (FR)
November 14, 1979
SUMMARY AND OUTLOOK
By the StaffBoard of Governors
of the Federal Reserve System

I-1
DOMESTIC NONFINANCIAL DEVELOPMENTS
Summary of Recent Developments. Available information suggests
a weakening of economic activity during October, following the third
quarter rebound. Total retail sales declined, particularly sharply in the
case of autos, and field reports indicate a substantial slowing of resi-
dential construction activity since the monetary policy actions of October 6.
Inflation continued at about the same very rapid pace as earlier this year.
On the basis of partial data, industrial production is estimated
to have been about unchanged in October. Auto assemblies remained at
the September rate, slightly lower than the third quarter average, and
considerably reduced from the pace of production in the first half of the
year. Production of consumer nondurable goods increased somewhat, but
business equipment output was reduced reflecting strike activity.
The payroll employment survey taken in early October showed
a large increase from September of 300,000 jobs, with gains in trade,
services and, to a small extent, construction. Total manufacturing
employment was up somewhat after strike adjustments, but in recent weeks,
new layoffs and temporary plant shutdowns have been announced in the auto
industry. The factory workweek continued unchanged, one-half hour below
the level of the first quarter. The unemployment rate, as shown in the
household survey, increased to 6.0 percent, up slightly from September
and the third quarter average.

I-2
Following two successive months of large gains, total retail
sales in dollar terms are reported to have decreased 1.7 percent in
October with the bulk of the decline at auto stores. Unit auto sales
were off about 12 percent from the September level to a 9.4 million unit
annual rate. Rebates and discounts by manufacturers had stimulated sales
in August and September, some of which undoubtedly involved borrowing from
the future. But in October,sales of discretionary items at general
merchandise, apparel,and furniture and appliance stores also declined--by
nearly 1 percent--after a large increase reported during the third
quarter.
There is little hard information available on residential construc-
tion activity since the monetary policy actions in early October, but
qualitative reports generally indicate that home sales and new building
activity are being severely curtailed. Among contributing causes are
apparently buyer resistance to higher financing costs, the effects of
high carrying costs on builder profits, and diminished credit availability
due to usury laws and lender uncertainties. In September, however, before
these new factors took hold, private housing starts were at an impressive
1.9 million unit annual rate. Single-family starts, at about a 1.25
million unit annual rate, were about unchanged from August, while multi-
family starts increased substantially, partly reflecting an end-of-fiscal-
year bulge in federally subsidized units. Home sales also increased further
in September, mainly for existing homes.

I - 3
Information on business spending is available only through
September. Outlays for business capital investment continued strong
in that month with shipments of nondefense capital goods up 1.6 percent
further. Sales of heavy trucks,,however, declined again in September to
the lowest level this year. Nonresidential construction put-in-place,
although at a substantially higher level than a year earlier, did not
show much change in August and September.
Capital spending commitments suggest a more moderate pace of
growth in outlays in the near term in contrast to the strong third
quarter spending rate. Although new orders for nondefense capital goods
increased in both August and September, they showed declines for the
second as well as the third quarter when measured in constant dollars.
Nonresidential construction contracts also suggest a more moderate future
outlay growth. According to two private surveys, primarily taken before
the October 6 actions, firms were planning to boost nominal spending on
plant and equipment between 7 and 9-1/2 percent in 1980; this implies no
real growth in capital spending in 1980.
Book value inventory investment, which had slowed markedly in
August from the record July pace, contracted considerably further in
September. In large part this reflects a liquidation in stocks of motor
vehicles and parts at both the trade and manufacturing levels, associated
with reduced production and increased sales. The book value of manufacturers
inventories increased at an annual rate of $20.5 billion in September, well
below the monthly average so far this year. Total trade inventories

I-4
declined at an annual rate of $16 billion reflecting the auto liquidations;
excluding autos, trade stocks showed an increase. The book value inventory-
sales ratio for manufacturing and trade, combined, edged down slightly.
Energy price increases and their diffusion throughout the
economy continue to be the dominant factor in keeping overall inflation
at the high rates that have prevailed since the beginning of this year.
Producer prices of finished goods increased at a 12 percent annual rate
in October. The energy price component rose at a 56 percent annual rate
in October, following an 80 percent annual rate of increase over the
third quarter. The September consumer price index rose at a 13 percent
annual rate--about the same rate as since last February, with sharp
increases reported for energy, food, homeownership, and apparel prices.
Labor cost pressures on prices remained intense in the third quarter
as there was virtually no increase in overall productivity to offset the
sizable rise in hourly compensation.
Outlook. The fiscal policy assumptions underlying the staff's
projection indicate a $42 billion unified budget deficit in FY 1980;
this total is somewhat larger than previously estimated, reflecting cyclical
reductions in revenues as well as some increases in spending. Passage of a
windfall profits tax would reduce this deficit by several billion dollars.
In the monetary area, M1 is assumed to increase at about a 6 percent rate
over the next year, unchanged from last month's projection. Market
interest rates, which rose sharply in the wake of the October 6 action, are
I - 5
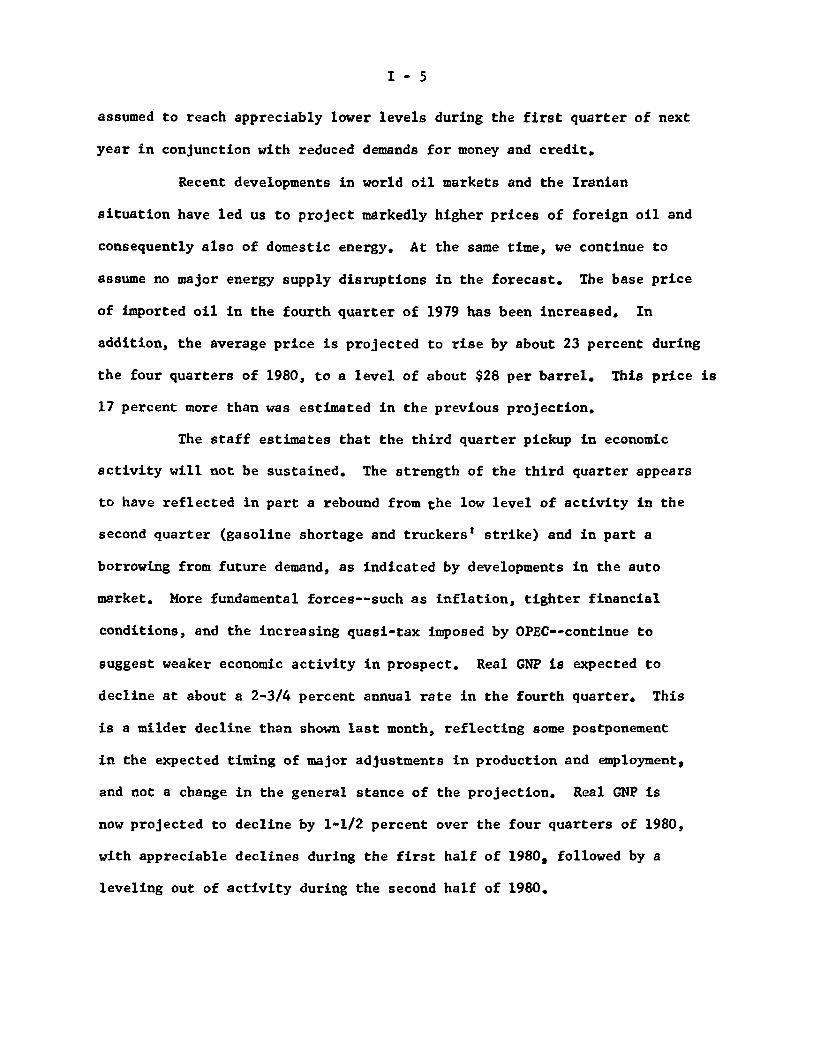
assumed to reach appreciably lower levels during the first quarter of next
year in conjunction with reduced demands for money and credit.
Recent developments in world oil markets and the Iranian
situation have led us to project markedly higher prices of foreign oil and
consequently also of domestic energy. At the same time, we continue to
assume no major energy supply disruptions in the forecast. The base price
of imported oil in the fourth quarter of 1979 has been increased. In
addition, the average price is projected to rise by about 23 percent during
the four quarters of 1980, to a level of about $28 per barrel. This price is
17 percent more than was estimated in the previous projection.
The staff estimates that the third quarter pickup in economic
activity will not be sustained. The strength of the third quarter appears
to have reflected in part a rebound from the low level of activity in the
second quarter (gasoline shortage and truckers' strike) and in part a
borrowing from future demand, as indicated by developments in the auto
market. More fundamental forces--such as inflation, tighter financial
conditions, and the increasing quasi-tax imposed by OPEC--continue to
suggest weaker economic activity in prospect. Real GNP is expected to
decline at about a 2-3/4 percent annual rate in the fourth quarter. This
is a milder decline than shown last month, reflecting some postponement
in the expected timing of major adjustments in production and employment,
and not a change in the general stance of the projection. Real GNP is
now projected to decline by 1-1/2 percent over the four quarters of 1980,
with appreciable declines during the first half of 1980, followed by a
leveling out of activity during the second half of 1980.

I - 6
In particular, residential construction activity is projected
to slow substantially with housing starts dropping to a low of 1.3 million
units (annual rate) in the first quarter of 1980. The recent and, to some
extent, continuing disruptions in credit flows are expected to exert
their major impact on housing early next year. Real business fixed invest-
ment is projected to begin a decline in the current quarter that will
con tinue throughout next year. On a year-over-year basis, real spending
in 1980 is projected to decline about 3 percent, as businesses are
expected to revise downward their spending plans in light of weaker-than-
anticipated final sales and increased financing costs. The decline in
the rate of inventory accumulation which started in the third quarter, is
expected to continue through mid-1980. Real consumption outlays are
projected to contract in an environment of declining real incomes,
uncertainties about economic and financial prospects, and tighter
consumer credit terms.
Consistent with the sharp decline in real GNPunemployment is
projected to rise sharply to almost 8 percent by mid-1980; in view of
sluggish activity over the last half of 1980, the unemployment rate is
expected to continue to edge up reaching a level of about 8-1/2 percent
by year-end. Growth of hourly compensation is not likely to slow during
1980 as efforts by workers to catch up with past price increases are
expected to offset the downward pressure on wages due to weaker labor
markets. Even though productivity may improve after firms adjust employ-
ment to reduced demands, unit labor costs will continue to increase

I - 7
sharply. The gross business product fixed-weighted price index is
projected to rise at a 10 percent rate during the current quarter,
followed by a 9-1/2 percent rate of advance during 1980. The increase
next year is about 1/2 percent higher than in last month's projection
due to the upward revised assumptions for oil prices. The projection
indicates some moderation of inflation rates during the last half of
next year when this price index increases at about a 9 percent annual
rate.
Detailed data for these projections are shown in the tables
that follow.

I-8
STAFF GNP PROJECTIONS
Percent changes, annual rateGross business
product Unemploymentfixed-weight rate
Nominal GNP Real GNP price index (percent)10/12/79 11/14/79 10/12/79 11/14/79 10/12/79 11/14/79 10/12/79 11/14/79
1976 1/1977 1/1978 1/19791980
1978-III 1/1978-IV 1/
1979-1 1/1979-II 1/1979-III 1/1979-IV
1980-I1980-II1980-III1980-IV
Change:79-II to
79-IV79-IV to
80-II80-II to
80-IV
Change:77-IV to78-IV 1/78-IV to79-IV79-IV to80-IV
11.311.612.010.98.0
10.914.8
10.66.7
10.65.8
11.311.612.011.07.5
10.914.8
10.66.7
11.07.0
5.76.78.8
10.1
5.95.34.41.7
-1.2
3.55.6
1.1-2.3
1.6-4.0
-1.9-1.0
.6.9
-1.2
-1.5
.7
13.4 13.4
5.95.34.41.9
-1.7
3.55.6
1.1-2.3
2.4-2.7
-3.8-2.5
.0
.8
-. 2
-3.1
5.36.27.69.79.6
8.88.7
10.010.110.310.1
9.89.48.68.4
5.36.27.69.79.9
8.88.7
10.010.110.010.0
10.210.19.08.9
10.2 10.0
9.6 10.1
.4 8.5
4.8
-. 4
-1.4
.4 .5
10.1 10.0
I/ Actual.
I-9
November 14, 1979
CONFIDENTIAL - FRCLASS II FOMC
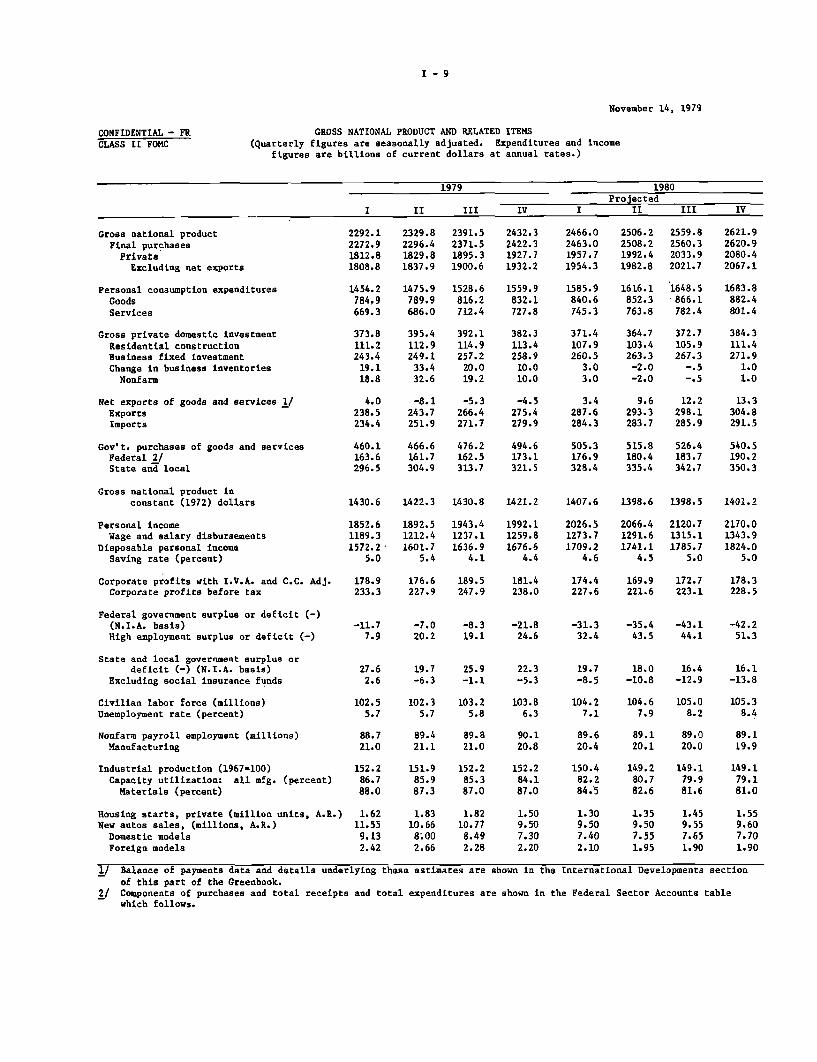
GROSS NATIONAL PRODUCT AND RELATED ITEMS
(Quarterly figures are seasonally adjusted. Expenditures and incomefigures are billions of current dollars at annual rates.)
1979 1980
ProjectedI II III IV I II III IV
Gross national productFinal purchasesPrivateExcluding net exports
Personal consumption expendituresGoodsServices
Gross private domestic investmentResidential constructionBusiness fixed investmentChange in business inventoriesNonfarm
Net exports of goods and services 1/ExportsImports
Gov't. purchases of goods and servicesFederal 2/State and local
Gross national product in
constant (1972) dollars
Personal incomeWage and salary disbursements
Disposable personal income
Saving rate (percent)
Corporate profits with I.V.A. and C.C. Adj.Corporate profits before tax
Federal government surplus or deficit (-)(N.I.A. basis)High employment surplus or deficit (-)
State and local government surplus ordeficit (-) (N.I.A. basis)
Excluding social insurance funds
Civilian labor force (millions)Unemployment rate (percent)
Nonfarm payroll employment (millions)Manufacturing
Industrial production (1967=100)Capacity utilization: all mfg. (percent)Materials (percent)
Housing starts, private (million units, A.R.)New autos sales, (millions, A.R.)Domestic modelsForeign models
2292.12272.91812.81808.8
1454.2784,9669.3
373.8111.2243.4
19.118.8
2329.82296.41829.81837.9
2391.52371.51895.31900.6
2432.32422.31927.71932.2
2466.02463.01957.71954.3
1475.9 1528.6 1559.9 1585.9789.9 816.2 832.1 840.6686.0 712.4 727.8 745.3
395.4112.9249.133.432.6
392.1114.9257.2
20.019.2
382.3113.4258.910.010.0
371.4107.9260.5
3.03.0
2506.22508.21992.41982.8
1616.1852.3763.8
364.7103.4263.3-2.0-2.0
4.0 -8.1 -5.3 -4.5 3.4 9.6238.5 243.7 266.4 275.4 287.6 293.3234.4 251.9 271.7 279.9 284.3 283.7
460.1163.6296.5
466.6161.7304.9
476.2162.5313.7
494.6173.1321.5
2559.82560.32033.92021.7
1648.5866.1782.4
372.7105.9267.3
-.5
-.5
12.2298.1285.9
2621.92620.92080.42067.1
1683.8882.4801.4
384.3111.4271.91.01.0
13.3304.8291.5
505.3 515.8 526.4 540.5176.9 180.4 183.7 190.2328.4 335.4 342.7 350.3
1430.6 1422.3 1430.8 1421.2 1407.6 1398.6 1398.5 1401.2
1852.61189.31572.2
5.0
1892.51212.41601.7
5.4
1943.41237.11636.9
4.1
1992.11259.81676.6
4.4
178.9 176.6 189.5 181.4233.3 227.9 247.9 238.0
-11.7 -7.0 -8.3 -21.87.9 20.2 19.1 24.6
27.6 19.7 25.9 22.32.6 -6.3 -1.1 -5.3
102.55.7
102.3 103.2 103.85.7 5.8 6.3
88.7 89.4 89.8 90.121.0 21.1 21.0 20.8
152.286.788.0
1.6211.559.132.42
151.985.987.3
1.8310.668.002.66
152.285.387.0
1.8210.778.492.28
152.284.187.0
1.509.507.302.20
2026.51273.71709.2
4.6
2066.41291.61741.1
4.5
2120.71315.11785.7
5.0
2170.01343.91824.0
5.0
174.4 169.9 172.7 178.3227.6 221.6 223.1 228.5
-31.3 -35.4 -43.1 -42.232.4 43.5 44.1 51.3
19.7 18.0 16.4 16.1-8.5 -10.8 -12.9 -13.8
104.2 104.6 105.07.1 7.9 8.2
105.38.4
89.6 89.1 89.0 89.120.4 20.1 20.0 19.9
150.482.284.5
14.9.2 149.180.7 79.982.6 81.6
149.179.181.0
1.30 1.35 1.45 1.559.50 9.50 9.55 9.607.40 7.55 7.65 7.702.10 1.95 1.90 1.90
1/ Balance of payments data and details underlying these estimates are shown in the International Developments section
of this part of the Greenbook.2/ Components of purchases and total receipts and total expenditures are shown in the Federal Sector Accounts table
which follows.

CONFIDENTIAL - FRCLASS II FOMC
I - 10
PERCENT CHANGES IN GROSS NATIONAL PRODUCTAND RELATED ITEMS
(Annual rates compounded quarterly)
November 14, 1979
1980Projected
SI II III IV I II III IV
Constant (1972) dollars
Gross national productFinal purchasesPrivateExcluding net exports
Personal consumption expendituresGoodsServices
Gross private domestic investmentResidential structuresBusiness fixed investment
Gov't. purchases of goods and servicesFederalState and local
Disposable personal income
Current dollars
Gross national productFinal purchasesPrivate
Excluding net exports
Personal consumption expendituresGoodsServices
Gross private domestic investmentResidential structuresBusiness fixed investment
Gov't. purchases of goods and servicesFederalState and local
Disposable personal income
Personal incomeWage and salary disbursements
Corporate profits with IVA & C.C. Adj.Corporate profits before tax
Nonfarm payroll employmentManufacturing
Nonfarm business sectorOutput per hourCompensation per hourUnit labor costs
GNP implicit deflator 1/Gross business product fixed-weight price index 2/Consumer price index (all urban)
Industrial production
1.11.11.8.4
.6-4.47.1
-. 5-14.3
4.8
-1.87.2
-6.6
2.1
10.611.012.410.3
11.47.9
15.8
3.6-8.512.9
5.612.1
2.3
13.0
11.412.7
-12.210.8
4.35.0
-2.3-3.9-4.1-2.9
-2.9-7.3
2.5
8.5-7.2-. 8
-3.3-11.31.6
-1.4
6.74.23.86.6
6.12.6
10.4
25.26.19.6
5.8-4.611.9
7.7
8.98.0
-5.0-8.9
2.9.8
2.44.86.03.7
4.33.94.9
-12.9-4.7
3.6
.2-2.0
1.5
-1.1
11.013.815.114.4
15.114.016.3
-3.37.5
13.7
8.51.9
12.1
9.1
11.28.4
32.640.2
1.9-1.2
-2.7-1.3-2.6-3.1
-2.0-3.3-.5
-16.4-14.5-5.5
4.410.41.1
-.6
7.08.87.06.8
8.48.08.9
-9.6-5.12.7
16.428.810.3
10.1
10.47.5
-16.0-15.1
1.2-3.2
-3.8-2.8-3.6-5.1
-3.7-7.1
.2
-17.3-26.2
-5.7
.41.3.0
-2.6
5.76.96.44.7
6.84.1
10.0
-10.9-18.0
2.5
8.99.18.9
8.0
7.14.5
-14.6-16.3
-2.1-7.7
-2.5-1.8-2.5-3.4
-2.1-4.6
.8
-13.8-23.7-3.8
.71.4
.4
-2.2
6.77.67.36.0
7.85.7
10.3
-7.0-15.7
4.4
8.68.28.8
7.7
8.15.7
-9.9-10.2
-2.0-5.8
-3.2 -4.1 .2 -. 9 .0 .4 1.010.4 7.9 8.2 9.3 10.6 9.6 9.714.0 12.5 7.9 10.3 10.6 9.2 8.7
9.3 9.3 8.4 9.9 9.8 9.4 8.910.0 10.1 10.0 10.0 10.2 10.1 9.011.1 13.6 12.9 13.0 13.8 10.1 9.0
4.0 -. 8 .8 .0 -4.7 -3.1 -. 3
I/ Excluding Federal pay increases, the rates of change are:QI, 9.8 percent; 1980 QIV, 8.6 percent.
2/ Uses expenditures in 1972 as weights.
1979 QI, 9.3 percent; 1979 QIV, 9.2 percent; 1980
1979
.8
.6
.4
.4
.0-. 91.0
3.712.3-1.1
1.31.21.4
.0
10.19.89.59.3
8.87.7
10.1
13.022.47.1
11.214.9
9.2
8.9
9.69.1
13.610.0
.3-1.5
.99.48.4
9.28.99.0
.1

I - 11
November 14, 1979
CONFIDENTIAL - FRCLASS II FOMC
GROSS NATIONAL PRODUCT AND RELATED ITEMS(Quarterly figures are seasonally adjusted. Expenditures and income
figures are billions of current dollars at annual rates.)
1977 1978
III III IV I II III IV
Gross national productFinal purchasesPrivate
Excluding net exports
Personal consumption expendituresGoodsServices
Gross private domestic investmentResidential constructionBusiness fixed investmentChange in business inventoriesNonfarm
Net exports of goods and services 1/ExportsImports
Gov't. purchases of goods and servicesFederal 2/State and local
Gross national product inconstant (1972) dollar
ersonal incomeWage and salary disbursements
Disposable personal incomeSaving rate (percent)
1820.21800.91420.91430.1
1169.1642.0527.1
280.481.3179.819.320.1
1876.01853.61462.01468.0
1190.5651.2539.3
300.091.4
186.122.521.5
1930.51902.91502.41508.7
1220.6661.9558.7
315.795.0193.227.525.6
1971.31952.91540.11558.2
1259.7685.6574.1
316.999.9
198.618.515.7
2011.31988.51569.11591.3
1287.2691.2596.0
327.0100.5203.722.822.0
2104.22078.41650.11657.7
1331.2722.1609.1
352.3107.7218.825.825.3
2159.62139.51698.61705.4
1369.3740.2629.1
356.2110.2225.9
20.018.5
2235.22214.51760.71765.2
1415.4770.2645.1
370.5113.7236.1
20.619.3
-9.2 -6.0 -6.3 -18.1 -22.2 -7.6 -6.8 -4.5170.5 178.6 180.1 174.2 184.4 205.7 213.8 224.9179.8 184.7 186.4 192.3 206.6 213.3 220.6 229.4
380.0138.2241.8
391.6142.6249.0
400.5145.6254.9
412.8151.2261.6
419.4150.9268.5
428.3148.2280.1
440.9152.3288.6
453.8159.0294.8
1315.7 1331.2 1353.9 1361.3 1367.8 1395.2 1407.3 1426.6
1472.5945.8
1250.14.2
1509.0971.8
1286.05.1
1548.5995.0
1323.25.4
1596.41023.41361.2
5.1
1634.81052.01395.0
5.3
1689.31090.01437.3
5.0
1742.51116.81476.5
4.8
1803.11154.31524.8
4.7
Corporate profits with I.V.A. and C.C. Adj. 137.1Corporate profits before tax 168.4
Federal government surplus or deficit (-)(N.I.A. basis) -37.2High employment surplus or deficit (-) -5.5
148.9 160.8 153.0 141.2 169.4 175.2 184.8176.2 180.9 183.0 177.5 207.2 212.0 227.4
-40.9 -53.6 -53.6 -49.4 -24.6 -20.4 -16.3-12.4 -29.8 -28.3 -20.4 -4.7 -1.0 -.8
State and local government surplus ordeficit (-) (N.I.A. basis)
Excluding social insurance funds
Civilian labor force (millions)Unemployment rate (percent)
Nonfarm payroll employment (millions)Manufacturing
Industrial production (1967=100)Capacity utilization: all mfg. (percent)Materials (percent)
Housing starts, private (million units,New autos sales, (millions, A.R.)Domestic modelsForeign models
80.919.4
134.880.781.7
A.R.) 1.8111.129.281.84
24.2 30.15.4 10.0
97.1 97.67.2 6.9
82.0 82.919.6 19.8
138.0 139.382.1 82.483.2 82.8
1.9311.709.342.36
2.0210.928.882.04
28.8 30.27.4 7.9
29.6 22.7 27.16.5 -. 9 3.3
98.5 99.3 100.1 100.8 101.56.6 6.2 6.0 6.0 5.8
83.9 84.819.9 20.2
140.3 140.882.6 82.083.0 82.6
2.0910.758.771.98
1.8110.808.802.00
86.3 86.9 87.820.4 20.5 20.8
145.1 147.983.9 85.285.0 86.4
2.1012.1210.012.11
2.0411.169.191.98
150.786.488.2
2.0811.079.062.00
1/ Balance of payments data and details underlying these estimates are shown in the International Developments sectionof this part of the Greenbook.
2/ Components of purchases and total receipts and total expenditures are shown in the Federal Sector Accounts tablewhich follows.

November 14, 1979
CONFIDENTIAL - FRCLASS II FOMC
PERCENT CHANGES IN GROSS NATIONAL PRODUCTAND RELATED ITEMS
(Annual rates compounded quarterly)
1977 1978
I II III IV I II III IV
Constant (1972) dollars
Gross national productFinal purchasesPrivateExcluding net exports
Personal consumption expendituresGoodsServices
Gross private domestic investmentResidential structuresBusiness fixed investment
Gov't. purchases of goods and servicesFederalState and local
Disposable personal income
Current dollars
Gross national productFinal purchasesPrivateExcluding net exports
Personal consumption expendituresGoodsServices
8.9 4.8 7.05.5 4.2 6.06.2 4.0 6.67.2 4.1 5.7
6.2 1.9 5.07.8 1.3 3.64.4 2.6 6.8
39.6 19.2 15.011.1 37.6 10.212.6 6.8 7.8
2.8 4.8 4.25.4 7.9 6.21.3 3.0 3.0
2.1 6.1 5.6
15.4 12.8 12.111.0 12.2 11.111.0 12.1 11.515.0 11.0 11.6
1 .8 7.5 10.514.2 5.9 6.713.2 9.6 15.2
Gross private domestic investment 56.5 31.0 22.7Residential structures 25.7 59.1 16.8Business fixed investment 18.8 15.0 16.1
Gov't. purchases of goods and services 10.9 12.8 9.4Federal 11.0 13.3 8.7State and local 10.8 12.5 9.8
Disposable personal income 9.3 12.0 12.1
Personal income 11.8 10.3 10.9Wage and salary disbursements 11.4 11.5 9.9
Corporate profits with IVA & C.C. Adj. 46.6 39.1 36.0Corporate profits before tax 35.4 19.9 11.1
Nonfarm payroll employment 4.0 5.7 4.6Manufacturing 4.9 6.3 2.8
Nonfarm business sectorOutput per hour 5.1 -1.8 3.1Compensation per hour 8.7 6.4 7.7Unit labor costs 3.4 8.4 4.5
GNP implicit deflator 1/ 6.0 7.7 4.8Gross business product fixed-weight price index 2/ 6.9 7.1 5.2Consumer price index (all urban) 8.1 8.1 5.2
Industrial production 7.1 9.8 3.8
2.2 1.9 8.3 3.5 5.63.9 .4 8.7 4.6 5.74.4 .8 10.7 4.4 6.77.4 1.0 7.9 4.1 6.9
8.2 .8 5.6 4.8 6.810.7 -4.7 9.2 4.2 9.9
5.3 7.9 1.4 5.5 3.2
-6.9 12.3 15.7 -5.0 6.65.3 -4.7 11.0 -4.9 -1.12.7 4.6 23.2 3.9 11.3
1.8 -1.2 .9 5.0 1.8-. 1 -7.4 -12.3 8.2 3.23.0 2.7 9.3 3.3 1.0
6.6 2.0 4.0 4.2 6.4
8.7 8.4 19.8 10.9 14.810.9 7.5 19.3 12.3 14.810.4 7.7 22.3 12.3 15.413.8 8.8 17.8 12.0 14.8
13.5 9.0 14.4 11.9 14.215.1 3.3 19.1 10.4 17.211.6 16.1 9.1 13.8 10.6
1.6 13.3 34.8 4.5 17.122.3 2.4 32.0 9.5 13.511.6 10.6 33.3 13.7 19.3
12.9 6.5 8.8 12.3 12.216.5 -.9 -7.0 11.7 18.710.8 11.1 18.5 12.6 8.9
12.0 10.3 12.7 11.4 13.8
13.0 10.0 14.0 13.2 14.711.9 11.7 15.3 10.2 14.1
-18.0 -27.5 107.2 14.4 23.84.7 -11.5 85.7 9.6 32.4
4.6 4.6 7.1 2.8 4.43.3 5.8 3.8 1.3 5.5
-1.5 -. 9 1.9 2.7 .87.0 11.4 7.5 8.8 8.88.6 12.4 5.4 6.0 8.0
6.4 6.3 10.6 7.2 8.76.5 6.6 10.5 8.8 8.75.4 7.8 10.2 8.8 9.1
2.9 1.4 12.8 7.9 7.8
1/ Excluding Federal pay increases, rates of change were: 1977:QI, 5.9 percent; 1977:QIV, 5.6 percent; 1978:QI,6.3 percent; 1978:QIV, 8.1 percent.
/ Uses expenditures in 1972 as weights.
I - 12
I - 13
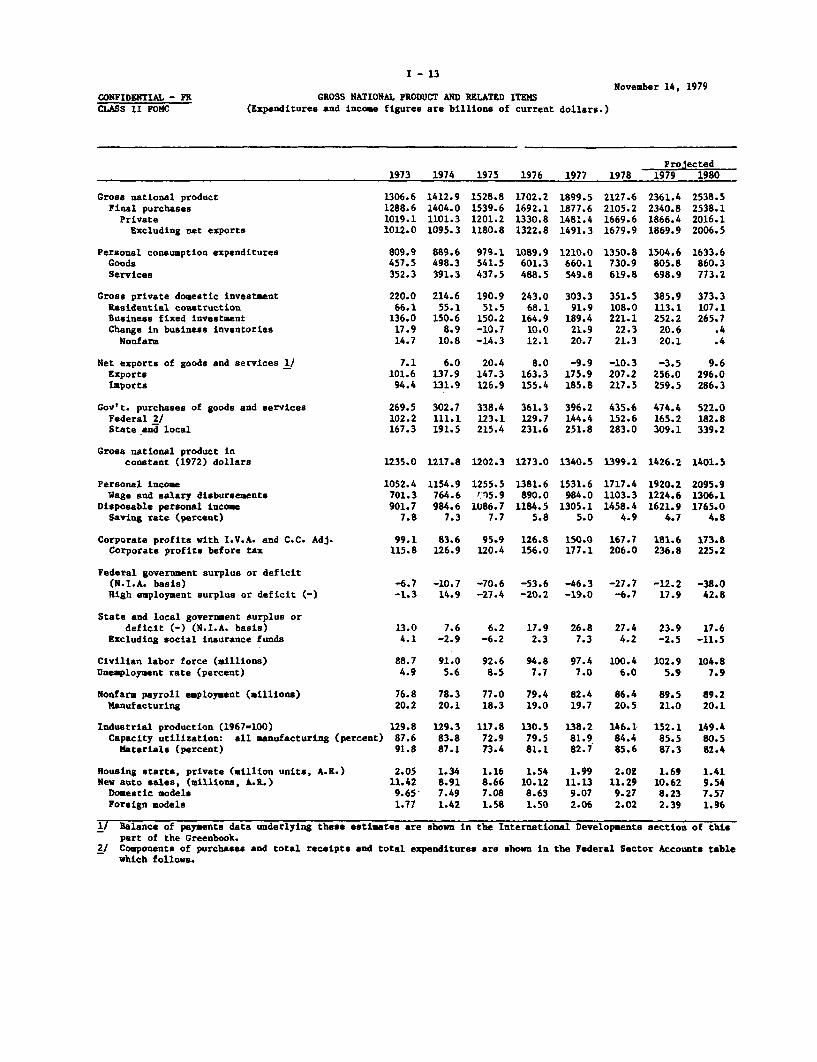
CONFIDENTIAL - FRCLASS II FOMC
GROSS NATIONAL PRODUCT AND RELATED ITEMS(Expenditures and income figures are billions of current dollars.)
November 14, 1979
Gross national productFinal purchasesPrivateExcluding net exports
Personal consumption expendituresGoodsServices
Gross private domestic investmentResidential constructionBusiness fixed investmentChange in business inventoriesNonfarm
Net exports of goods and services 1/ExportsImports
Gov't. purchases of goods and servicesFederal 2/State and local
Gross national product inconstant (1972) dollars
Personal incomeWage and salary disbursements
Disposable personal incomeSaving rate (percent)
Corporate profits with I.V.A. and C.C. Adj.Corporate profits before tax
Federal government surplus or deficit(N.I.A. basis)High employment surplus or deficit (-)
State and local government surplus ordeficit (-) (N.I.A. basis)
Excluding social insurance funds
Civilian labor force (illions)Unemployment rate (percent)
Nonfarm payroll employment (millions)Manufacturing
Industrial production (1967-100)Capacity utilization: all manufacturing (percent)Materials (percent)
Housing starts, private (million units, A.R.)New auto sales, (millions, A.R.)
Domestic modelsForeign models
Projected1978 1979 1980
2127.6 2361.4 2538.52105.2 2340.8 2538.11669.6 1866.4 2016.11679.9 1869.9 2006.5
1350.8 1504.6 1633.6730.9 805.8 860.3619.8 698.9 773.2
351.5 385.9 373.3108.0 113.1 107.1221.1 252.2 265.722.3 20.6 .421.3 20.1 .4
-10.3 -3.5 9.6207.2 256.0 296.0217.5 259.5 286.3
435.6 474.4 522.0152.6 165.2 182.8283.0 309.1 339.2
1973
1306.61288.61019.11012.0
809.9457.5352.3
220.066.1
136.017.914.7
7.1101.6
94.4
269.5102.2167.3
1235.0
1052.4701.3901.7
7.8
99.1115.8
1974
1412.91404.01101.31095.3
889.6498.3391.3
214.655.1
150.68.9
10.8
6.0137.9131.9
302.7111.1191.5
1217.8
1154.9764.6984.67.3
83.6126.9
-6.7 -10.7 -70.6 -53.6 -46.3 -27.7 -12.2 -38.0-1.3 14.9 -27.4 -20.2 -19.0 -6.7 17.9 42.8
13.04.1
88.74.9
76.820.2
129.887.691.8
2.0511.429.651.77
7.6-2.9
91.05.6
78.320.1
129.383.887.1
1.348.917.49
6.2-6.2
92.68.5
77.018.3
117.872.973.4
1.168.667.08
17.92.3
94.87.7
79.419.0
130.579.581.1
1.5410.128.63
26.87.3
97.47.0
82.419.7
138.281.982.7
1.9911.139.07
27.44.2
100.46.0
86.420.5
146.184.485.6
2.0211.299.27
23.9-2.5
102.95.9
89.521.0
152.185.587.3
1.6910.628.23
17.6-11.5
104.87.9
89.220.1
149.480.582.4
1.419.547.57
1.42 1.58 1.50 2.06 2.02 2.39 1.96
1/ Balance of payments data underlying these estimates are shown in the International Developments section of thispart of the Greenbook.
2/ Components of purchases and total receipts and total expenditures are shown in the Federal Sector Accounts tablewhich follows.
1975
1528.81539.61201.21180.8
979.1541.5437.5
190.951.5
150.2-10.7-14.3
20.4147.3126.9
338.4123.1215.4
1202.3
1255.5r15.9
1086.77.7
95.9120.4
1976
1702.21692.11330.81322.8
1089.9601.3488.5
243.068.1
164.910.012.1
8.0163.3155.4
361.3129.7231.6
1273.0
1381.6890.0
1184.55.8
126.8156.0
1977
1899.51877.61481.41491.3
1210.0660.1549.8
303.391.9
189.421.920.7
-9.9175.9185.8
396.2144.4251.8
1340.5
1531.6984.0
1305.15.0
150.0177.1
1399.2
1717.41103.31458.4
4.9
167.7206.0
1426.2
1920.21224.61621.9
4.7
181.6236.8
1401.5
2095.91306.11765.0
4.8
173.8225.2
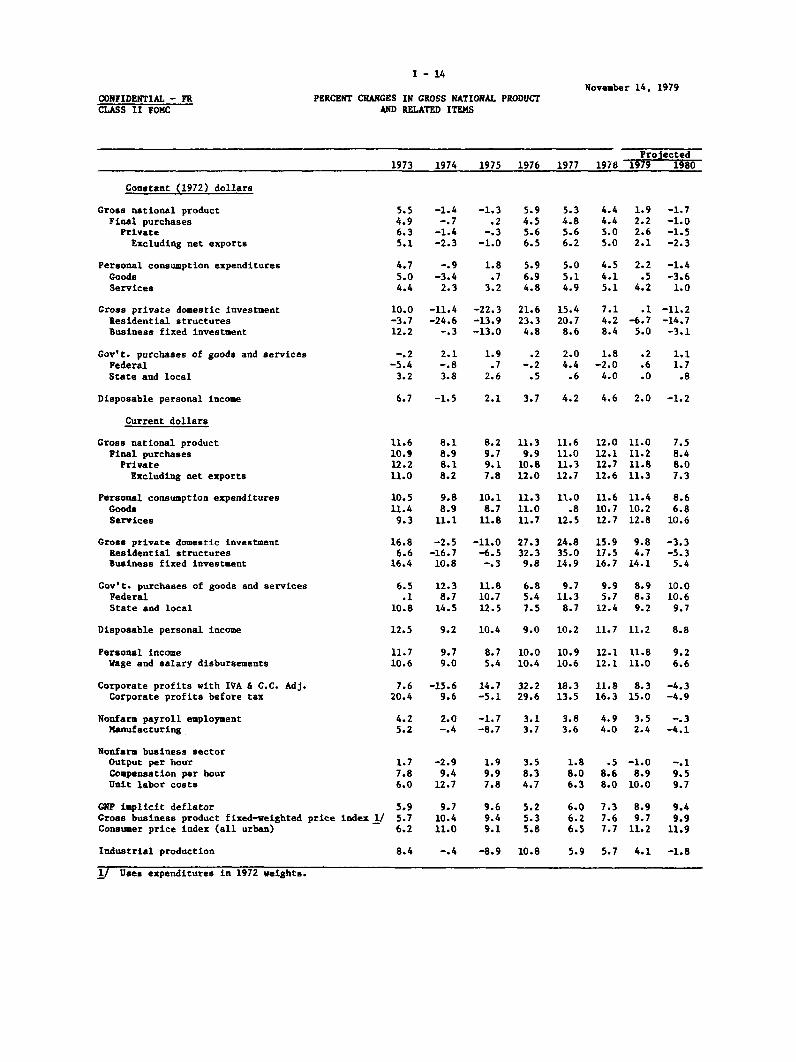
I - 14
PERCENT CHANGES IN GROSS NATIONAL PRODUCTAND RELATED ITEMS
CONFIDENTIAL - FRCLASS II FOMC
November 14, 1979
Projected1973 1974 1975 1976 1977 1978 1979 1980
Constant (1972) dollars
Gross national productFinal purchases
Private
Excluding net exports
Personal consumption expendituresGoodsServices
Gross private domestic investmentResidential structuresBusiness fixed investment
Gov't. purchases of goods and servicesFederalState and local
Disposable personal income
Current dollars
Gross national productFinal purchasesPrivateExcluding net exports
Personal consumption expendituresGoodsServices
5.5 -1.4 -1.3 5.9 5.3 4.4 1.9 -1.74.9 -. 7 .2 4.5 4.8 4.4 2.2 -1.06.3 -1.4 -. 3 5.6 5.6 5.0 2.6 -1.55.1 -2.3 -1.0 6.5 6.2 5.0 2.1 -2.3
4.7 -. 9 1.8 5.9 5.0 4.5 2.2 -1.45.0 -3.4 .7 6.9 5.1 4.1 .5 -3.64.4 2.3 3.2 4.8 4.9 5.1 4.2 1.0
10.0 -11.4 -22.3 21.6 15.4 7.1 .1 -11.2-3.7 -24.6 -13.9 23.3 20.7 4.2 -6.7 -14.712.2 -. 3 -13.0 4.8 8.6 8.4 5.0 -3.1
-. 2 2.1 1.9 .2 2.0 1.8 .2 1.1-5.4 -. 8 .7 -. 2 4.4 -2.0 .6 1.73.2 3.8 2.6 .5 .6 4.0 .0 .8
6.7 -1.5 2.1 3.7 4.2 4.6 2.0 -1.2
11.6 8.1 8.2 11.3 11.6 12.0 11.0 7.510.9 8.9 9.7 9.9 11.0 12.1 11.2 8.412.2 8.1 9.1 10.8 11.3 12.7 11.8 8.011.0 8.2 7.8 12.0 12.7 12.6 11.3 7.3
10.5 9.8 10.1 11.3 11.0 11.6 11.4 8.611.4 8.9 8.7 11.0 .8 10.7 10.2 6.89.3 11.1 11.8 11.7 12.5 12.7 12.8 10.6
Gross private domestic investment 16.8 -2.5 -11.0 27.3 24.8 15.9 9.8 -3.3Residential structures 6.6 -16.7 -6.5 32.3 35.0 17.5 4.7 -5.3Business fixed investment 16.4 10.8 -.3 9.8 14.9 16.7 14.1 5.4
Gov't. purchases of goods and services 6.5 12.3 11.8 6.8 9.7 9.9 8.9 10.0Federal .1 8.7 10.7 5.4 11.3 5.7 8.3 10.6State and local 10.8 14.5 12.5 7.5 8.7 12.4 9.2 9.7
Disposable personal income 12.5 9.2 10.4 9.0 10.2 11.7 11.2 8.8
Personal income 11.7 9.7 8.7 10.0 10.9 12.1 11.8 9.2Wage and salary disbursements 10.6 9.0 5.4 10.4 10.6 12.1 11.0 6.6
Corporate profits with IVA & C.C. Adj. 7.6 -15.6 14.7 32.2 18.3 11.8 8.3 -4.3Corporate profits before tax 20.4 9.6 -5.1 29.6 13.5 16.3 15.0 -4.9
Nonfarm payroll employment 4.2 2.0 -1.7 3.1 3.8 4.9 3.5 -.3Manufacturing 5.2 -.4 -8.7 3.7 3.6 4.0 2.4 -4.1
Nonfarm business sectorOutput per hour 1.7 -2.9 1.9 3.5 1.8 .5 -1.0 -.1Compensation per hour 7.8 9.4 9.9 8.3 8.0 8.6 8.9 9.5Unit labor costs 6.0 12.7 7.8 4.7 6.3 8.0 10.0 9.7
GNP implicit deflator 5.9 9.7 9.6 5.2 6.0 7.3 8.9 9.4Gross business product fixed-weighted price index 1/ 5.7 10.4 9.4 5.3 6.2 7.6 9.7 9.9Consumer price index (all urban) 6.2 11.0 9.1 5.8 6.5 7.7 11.2 11.9
Industrial production 8.4 -.4 -8.9 10.8 5.9 5.7 4.1 -1.8
1/ Uses expenditures in 1972 weights.

FEDERAL SECTOR ACCOUNTS(billions of dollars) November 14, 1979
I FRB Staff EstimatesFiscal FY 1980 e/3/ CY79e/ Calendar quarters; unadjusted dataYear Admin. F.R. 1978 F.R. 1978 1979 19801979* 1/2/ Board Board IV* I* II* III* IV I II III
Unified budget receipts 465.94/ 513.9 504.9 416.9 478.1 99.5 102.1 144.4 119.9 111.6 111.4 149.0 132.8Unified budget outlays 493.2- 547.1 546.7 460.6 507.8 123.2 122.6 123.1 124.4 137.8 134.0 135.6 139.3
Surplus(+)/Deficit(-), unifiedbudget -27.3 -33.2 -41.8 -43.7 -29.7 -23.7 -20.5 21.4 -4.5 -26.2 -22.6 13.4 -6.5
Surplus(+)/Deficit(-), off-budgetagencies 7/ -12.4 -20.0- -18.0 -9.1 -14.1 -0.1 -3.0 -5.1 -4.1 -1.8 -5.9 -5.8 -4.4
Combined deficit to be financed -39.7 -53.2 -59.8 -52.8 -43.8 -23.8 -23.5 16.3 -8.6 -28.0 -28.5 7.6 -10.9
Means of financing combined deficits:Net borrowing from public 33.7 42.06/ 48.1 53.6 32.4 15.3 10.6 -4.6 12.4 14.0 21.6 1.7 10.9Decrease in cash operating balance -1.8 9.2- 9.2 -4.0 4.3 6.1 8.6 -9.8 -6.7 12.2 4.0 -8.0 1.0Other 8/ 7.7 2.0' 2.5 3.2 7.0 2.5 4.2 -1.9 2.9 1.8 3.0 -1.3 -1.0
Cash operating balance, end of period 24.2 15.0 15.0 16.3 12.0 16.3 7.7 17.5 24.2 12.0 8.0 16.0 15.0
Memo: Sponsored agency borrowing 9/ 22.l1 / n.a. 26.0 22.0 25.2 4.9 6.4 6.0 4.8 8.0 6.0 6.0 6.0
NIA Budget 10/ Seasonally adjusted annual rates
Receipts 480.0 525.3 521.1 432.1 495.2 463.5 475.0 485.8 507.1 512.8 513.7 520.2 531.9Expenditures 493.7 546.9 552.5 459.8 507.4 479.7 486.8 492.9 515.3 534.6 545.0 555.6 575.0
purchases (total) 161.7 178.7 178.5 152.6 165.2 159.0 163.6 161.7 162.5 173.1 176.9 180.4 183.7Defense 104.8 116.0 116.4 99.0 107.8 101.2 103.4 106.0 108.5 113.2 115.2 117.5 119.6Non-defense 56.9 62.7 62.1 53.6 57.5 57.8 60.2 55.7 54.0 59.9 61.7 62.9 64.1
All other expenditures 332.0 368.2 374.0 307.2 342.2 320.7 323.2 331.2 352.8 361.5 368.1 375.2 391.3Surplus(+)/Deficit(-) 11/ -13.7 -21.6 -31.4 -27.7 -12.2 -16.3 -11.7 -7.1 -8.2 -21.8 -31.3 -35.4 -43.1
High Employment Surplus(+)/Deficit(-) (NIA basis) 12/ 11.6 n.a. 36.1 -6.7 17.9 -0.8 7.9 20.2 19.1 24.6 32.4 43.5 44.1
*--actual e--estimated n.a.--not available
1/ Administration estimates as of October 11, 1979, except as noted.2/ Administration NIA estimates are from OMB Mid-Session Review of the 1980 Budget, July 12, 1979.3/ In the Conference Committee Report on the Second Concurrent Budget Resolution. Fiscal Year 1980, Congress expects receipts of $517.8 billion and
outlays of $547.6 billion.4/ Excludes $0.4 billion of outlays for the Exchange Stabilization Fund in order to be consistent with all historical data and Treasury reporting
practices.5/ Confidential Administration estimate as of September 4, 1979.6/ Estimate from OMB Mid-Session Review of the 1980 Budget , July 12, 1979.7/ Includes Federal Financing Bank, Postal Service Fund, Rural Electrification and Telephone Revolving Fund, Rural Telephone Bank, and Pension Benefit
Guaranty Corporation.8/ Checks issued less checks paid, accrued items and other transactions./ Includes Federal Home Loan Banks, FNMA, Federal Land Banks, Federal Intermediate Credit Banks, and Banks for Cooperatives marketable debt on an
offerings basis.10/ All NIA data incorporate the Department of Commerce's July 1979 GNP revisions.11/ The fiscal year totals are translations of the 0MB Mid-Session Review of the 1980 Budget, July 1979; the translations are based on unadjusted data
and do not conform to the average of four seasonally adjusted quarters. The FRB staff estimates, therefore, have been adjusted in order to make theBEA and staff estimates comparable.
12/ FRB staff estimates are consistent with the Council's new potential GNP series as reported in the Economic Report of the President, January 1979.

I-16
DOMESTIC FINANCIAL DEVELOPMENTS
Summary. Interest rates rose sharply in October in response to
the System's policy actions announced on October 6. Part of these advances
have been retraced in recent days, as markets have rallied in reaction to
recent signs of a weakening in economic activity and a slowing in monetary
growth. On balance, however, for the intermeeting period short-term market
rates still show gains of about 1-1/4 to 2-1/4 percentage points and bond
yields about 3/4 to 1-1/4 percentage points. In addition, bank prime rates
have been raised two percentage points to 15-1/2 percent, home mortgage rates
in the primary markets appear generally to have increased about 1-1/2 per-
centage points and rates on consumer loans have moved up appreciably. Banks
and other institutions also are reported to have tightened credit standards
and nonprice lending terms for both business and household customers.
Against this background and with concerns growing about a likely weakening
in economic activity over the near term, major stock indexes have declined
8 to 10 percent.
Conditions in financial markets were quite unsettled in the weeks
immediately following the October 6 announcement, and both short- and long-
term interest rates were subject to unusual day-to-day and intra-day fluc-
tuation. Given this volatility, the general erosion of security values and
uncertainty surrounding the System's new operating procedures, bid-asked
spreads widened, differences between rates on higher- and lower-rated debt
instruments increased, and a large number of corporate and municipal secu-
rities scheduled to come to market were postponed or cancelled. While many
mortgage companies and securities firms suffered large losses in the wake
of the sharp advance in rates, to date there have been few reports of bank-
ruptcies or of firms voluntarily deciding to go out of business.
I-17
The flow of credit to nonfinancial businesses dropped off somewhat
in October, apparently in response to both the tightening of credit supplies
and perhaps some decline in demand resulting from a further cutback in inven-
tory accumulation. Growth in business loans at banks (adjusted for bankers
acceptance sales) slowed somewhat from September's rapid pace, and only a
marginal additional volume of commercial paper was sold in the market by
nonfinancial firms. The volume of publicly offered corporate bonds in
October about matched that for September, but it was swollen by a large pre-
October 6 offering of IBM. The volume of issues declined markedly after the
System's announcement, in part reflecting the aforementioned postponements
and cancellations of issues.
Household mortgage indebtedness also is likely to have expanded at
a slower pace in October, the result in large measure of the sharp tightening
in the cost and availability of such credits. Given the tightening consumer
credit supplies and drop in new car sales, consumer loan growth also likely
moderated in October after posting a sizable gain in September.
State and local governments also reduced their borrowing in October,
as a large volume of short-term note offerings were cancelled, in many in-
stances because market rates moved above legal ceilings. The volume of
longer-term offerings, on the other hand, remained relatively large. Reflect-
ing its enlarged fourth quarter deficit, Treasury demands for funds have been
quite strong in recent weeks.
M-1 increased at only a 2-1/2 percent annual rate in October, down
markedly from an 11-1/4 percent rate of increase in September. With M-1
expansion reduced, M-2 growth slowed to about an 8.6 percent annual rate.
The interest-bearing component of this measure, however, continued to in-
crease at September's rapid pace despite a sharp drop in savings deposits,

I-18
as growth in small time deposits (presumably mainly in the form of MMCs) and
large time deposits accelerated. Deposit flows at nonbank thrift institu-
tions weakened as strong further advances in MMCs and in large time deposits
were more than offset by outflows from savings and other time deposits.
Bank credit growth also moderated in October, reflecting a cut-
back in investment acquisitions, a sharp rundown in security loans and a
sell-off of holdings of bankers acceptances. With growth in deposits in-
cluded in the key aggregates slowing, commercial banks also raised a sub-
stantial volume of funds through issuance of managed liabilities, despite
the new marginal reserve requirements on these funds.
Outlook. Following the recent rally in securities markets, market
interest rates may have reached sustainable levels for the near term. De-
mands for money and credit are expected to continue to moderate in con-
junction with a weakening in the economy, however, and it thus appears likely
that rates will become subject to further downward pressures in coming months.
The flow of funds to households, in particular, is likely to drop
over the current quarter. Given a further erosion of real income growth and
with uncertainty over the economic outlook intensifying, demands for houses,
autos, and other durable goods are expected to decline. At the same time,
deposit flows to lending institutions are expected to remain moderate, and
thus interest rates charged on mortgages and consumer installment credit
should stay comparatively high and the availability of such credit remain
relatively tight.
Business demands for credit are also expected to moderate in coming
months. The corporate financing gap is expected to narrow, mainly because
of the cutback in inventory outlays. Business loan demands at banks, how-
ever, may remain relatively strong for a while, if firms decide to delay
I-19
funding their short-term debt in anticipation of an eventual sharp decline
in long-term rates. However, the relatively high proportion of short-term
business indebtedness should induce firms to increase their issuance of
bonds and this should tend to offset downward pressures on bond yields.
The outlook for credit demands in the government sector is mixed.
The calendar of state and local government offerings for the remainder of
the current quarter appears quite light. On the other hand, the Treasury
with large deficits in prospect is expected to continue raising new funds
in coming weeks as well as in the first quarter of next year.

I - 20
INTERNATIONAL DEVELOPMENTS
Summary. Since early October exchange markets have been
dominated first by the repercussions of the tightening of monetary
policy in the United States and then by evaluations of the effects
of accelerating oil prices and a possible cutback of Iranian supplies.
The effect of these events was to raise the weighted-average value
of the dollar by about 4 per cent from the beginning of October to
November 13. On November 14 the report that Iran might withdraw
funds from U.S. banks, followed by the U.S. action to freeze such assets,
brought some pressure on the dollar.
Following the October 6 measures taken by the Federal
Reserve there was a series of increases in discount rates by other
central banks (Canada, Germany, the Netherlands, Japan and Switzerland.
The need to combat inflation was usually cited as a chief consideration
in the increases but Switzerland and Canada also cited their concern
about exchange rate relationships.
Since early October the yen has declined about 7 per cent
against the dollar (25 per cent since the beginnning of the year),
mainly influenced by concerns about Japan's oil supply.
. In the
case of sterling some downward pressure on the pound developed when

I - 21
exchange controls on U.K residents' dealings in foreign currencies
were eliminated on October 23
After mid-year the costs of Eurodollar bank loans rose more
rapidly than costs to prime borrowers at U.S. banks, possibly causing
some shift of borrowing to U.S. banking offices. However, recent
increases in the U.S. prime rate have brought it closer to a more
normal relationship to Euro-dollar lending rates.
The gold price peaked at about $450 per ounce at the beginning
of October, and has been under $400 since that time partly under the
influence of uncertainty caused by changes in the U.S. Treasury's gold
auction program and an increased amount sold at the first auction
thereafter.
In U.S. international transactions, the trade deficit was
reduced to about $28 billion (SAAR) in the third quarter from $31 billion
in the second. Petroleum imports rose sharply to average $67 billion
at an annual rate for the quarter, and reached a $72 billion rate in
September. Oil import prices rose nearly 30 per cent from the second
quarter. Other imports have been nearly flat since the first quarter,
with prices up and volume down somewhat. On the export side agricultural
sales rose sharply in the third quarter with both volumes and prices
rising substantially. Non-agricultural exports were also up considerably

I - 22
in the third quarter, with industrial materials (especially chemicals),
aircraft and machinery all showing increases.
Data from balance-of-payments sources indicate a net inflow
of about $6 billion through interbank transactions in the third quarter,
raising the total for the year to about $27 billion. U.S. banks'
net outflows to nonbanks abroad rose to about $5 billion in the quarter.
Official foreign assets of G-10 countries and Switzerland
held in the United States rose nearly $5 billion in the third quarter,
when the dollar was under heavy pressure. In October foreign official
assets of these countries fell substantially ($2.5 billion at the FRBNY),
. OPEC assets in the United States rose about $1-1/2 billion
in the third quarter, and by another $1 billion at the FRBNY in
October.
Economic activity abroad was fairly vigorous in the second
quarter, but data for industrial production suggest some moderation
in the third quarter. Japan's growth has continued quite strong, and
Germany has also held up well. This strength, coupled with the
persistence of high inflation rates, has brought forth the increases
in interest rates mentioned above.
Outlook. The staff's assumption of a further major increase
in petroleum prices has resulted in a less optimistic outlook for

I - 23
economic activity abroad in the year ahead and reduced the gains
projected for the U.S. current account. Foreign GNP is now projected
to rise by only 1-1/2-2 per cent from the fourth quarter of 1979 to
the fourth quarter of 1930, assuming some stimulative policy actions
will be taken abroad. Economic growth in the less developed countries
will be hampered by the weakening of their export markets and their
rising petroleum costs.
The U.S. import price for a barrel of oil is projected to
average $23 in the fourth quarter of 1979 (up 73 per cent since the
fourth quarter of 1978) and to rise a further 23 per cent by the fourth
quarter of 1930. By the fourth quarter of 1980 the import price is
now projected to reach $28 per barrel, 17 per cent higher than the
$24 level used in the previous projections. After allowing for a
substantial drop in the volume of petroleum imports next year, the
year-over-year value of oil imports is projected to rise by $15
billion. The net effect of the revised oil price assumption, and
other changes, is that a trade deficit of about $19 billion is now
projected for 1980 (about $9 billion less than the 1979 figure) and a
current account surplus of about $14 billion (compared with near zero
in 1979).
In the framework of the green book projections for the year
ahead, the staff expects that the weighted-average foreign exchange
value of the dollar in the fourth quarter of 1980 will not differ
significantly from the average level in recent weeks (about 88.5 on
the Federal Reserve Board staff's index, March 1973 = 100).

CONFIDENTIAL (FR)CLASS II FOMC
Outlook for U.S. Net Exports and Related Items(billions of dollars, seasonally adjusted annual rates) November 14, 1979
1978 1979P 1980p
1. GNP Net ExportsCurrent $, Net
Exports of G&SImports of G&S
Constant 72 $, NetExports of G&SImports of G&S
Terms of trade (1972=100) 2/
-10.3207.2217.5
11.0108.997.9
-3.5256.0259.5
17.5119.4101.8
9.6296.0286.3
26.8122.595.7
85.7 84.2 80.7
1 9 7 9I II III IVp
4.0238.5234.4
17.0117.0100.0
86.9
-8.1243.7251.9
13.1116.0102,9
85.8
-5.3266.4271.7
19.4122.5103.1
82.5
-4.5275,4279.9
20.7121.9101.3
81.7
1 9 8 Op
I II III IV
3.4287.6284.3
24.9123.198.2
80.7
9.6293.3283,7
27.3122.795,4
80.4
12.2298.1285.9
27.5121.9
94.4
80.7
13.3304.8291.5
27,6122.394.7
81.0
2. U.S. Merchandise Trade Balance 1/ -34.2 -27.9 -18.4 -24.5 -30.9 -27.8 -28.2 -23.6 -17.6 -16.8 -15.5
Exports (excl. military) 141.9 180.4 209.0 165.4 171.2 190.3 194.9 201.9 207.6 210.4 215.9Agricultural 29.9 34.5 37.6 30.6 30.9 38.4 38.0 38.1 38.2 36.4 37.5Nonagricultural 112.0 146.0 171.4 134.8 140.2 151.9 156.9 163.8 169.4 174.0 178.4
Imports 176.1 208.3 227.3 189.9 202.0 218.2 223.1 225.5 225.2 227.2 231.4Petroleum and Products 42.3 58.6 73.9 46.6 51.6 66.5 69.7 73.1 73.6 74.0 74.8Nonpetroleum 133.8 149.7 153.4 143.3 150.4 151.7 153.4 152.5 151.6 153.2 156,6
3. U.S. Current Account Balance -13.9 0.3 14.4 1.7 -3.9 1.7p 1.7 7.1 14.5 17.4 18.7of which: Net Investment Income 21.6 29.7 32.4 27.5 29.6 30.9P 31.0 31.4 31.8 33.2 33,1
4. Foreign Outlook - Ten Industrial Countries 3/Real GNP, 7 change, annual rates 3.3 3.4 2.2 2.1 4.1 2.6P 3.3 1.8 1.3 1.7 2.0Consumer Prices, 4/, % change, annual rates 5.4 7.8 9.2 8.7 10.1 11.7P 9.5 9.2 8.4 8.0 7.5
/ International accounts basis.
2/ GNP export implicit deflator Z GNP import implicit deflator./ Geometric weights used to aggregate foreign real GNP and consumer prices -- per cent share in ten-country total multilateral trade. Canada (9.1%),Japan (13.6%), United Kingdom (11.97), Germany (20.8%), France (13.1%), Italy (9.0%), Belgium (6.4%), the Netherlands (8.3%), Switzerland (3.6%),Sweden ($4.2%).
4/ Wholesale prices for Japan.p/ Projected.
197 1979P 1"0