final tech report wildcat em-mag spec · electromagnetic survey on a second block, named siderock,...
TRANSCRIPT

HELIBORNE HIGH RESOLUTION AEROMAGNETIC, SPECTROMETRIC AND
ELECTROMAGNETIC SURVEY Project: McVicar and Siderock
Pickel Lake Area, Ontario and Bissett Area, Manitoba
For:
WILDCAT EXPLORATION LTD Unit 203 - 1780 Wellington Ave. Winnipeg, Manitoba R3H 1B3
Phone: (204) 944-8916
By:
Geo Data Solutions GDS Inc. 1054 Des Pervenches Laval, Quebec H7Y 2C7 Phone: (450) 689-3153
Project Ref.: P10-027 Technical and Operation Report
July 2011

WILDCAT EXPLORATION LTD
HELIBORNE HIGH RESOLUTION AEROMAGNETIC, SPECTROMETRIC AND
ELECTROMAGNETIC SURVEY
Project: McVicar and Siderock Pickel Lake Area, Ontario and Bissett Area, Manitoba
Project Ref.: P10-027
TECHNICAL AND OPERATION REPORT
July 2011

i
TABLE OF CONTENTS 1.0 INTRODUCTION .............................................................................................................................................. 1
2.0 SURVEY SPECIFICATIONS .......................................................................................................................... 4
3.0 AIRCRAFT, EQUIPMENT AND PERSONNEL ........................................................................................... 5 3.1 AIRCRAFT AND EQUIPMENT ............................................................................................................................. 5 3.2 PERSONNEL .................................................................................................................................................... 10
4.0 SURVEY SCHEDULE .................................................................................................................................... 11
5.0 DATA ACQUISITION .................................................................................................................................... 11
6.0 DATA COMPILATION AND PROCESSING ............................................................................................. 12 6.1 BASE MAPS ..................................................................................................................................................... 12 6.2 PROCESSING OF BASE STATION DATA ............................................................................................................ 12 6.3 PROCESSING OF THE POSITIONING DATA (GPS) ............................................................................................. 12 6.4 PROCESSING OF THE ALTIMETER DATA ......................................................................................................... 12 6.5 PROCESSING OF MAGNETIC DATA .................................................................................................................. 13 6.6 PROCESSING OF ELECTROMAGNETIC DATA ................................................................................................... 14 6.7 PROCESSING OF SPECTROMETRIC DATA ......................................................................................................... 16
7.0 FINAL PRODUCTS ........................................................................................................................................ 18 7.1 MAPS ............................................................................................................................................................. 18 7.2 FINAL DIGITAL ARCHIVE OF LINE DATA .......................................................................................................... 18 7.3 MISCELLANEOUS............................................................................................................................................ 19
8.0 CONCLUSION ................................................................................................................................................. 19 Appendix A: Digital Archive Description Appendic B: Calibration and Tests
LIST OF TABLES Table 1: Survey Specifications ...................................................................................................... 1 Table 2: McVicar Lake block co-ordinates (Nad83, UTM zone 15N) .......................................... 3 Table 3: Siderock block co-ordinates (Nad83, UTM zone 15N) ................................................... 3 Table 4: The Robinson R44 Helicopter Characteristics ................................................................. 5 Table 5: EM Windows .................................................................................................................... 9 Table 6: Field and Office Crew .................................................................................................... 10
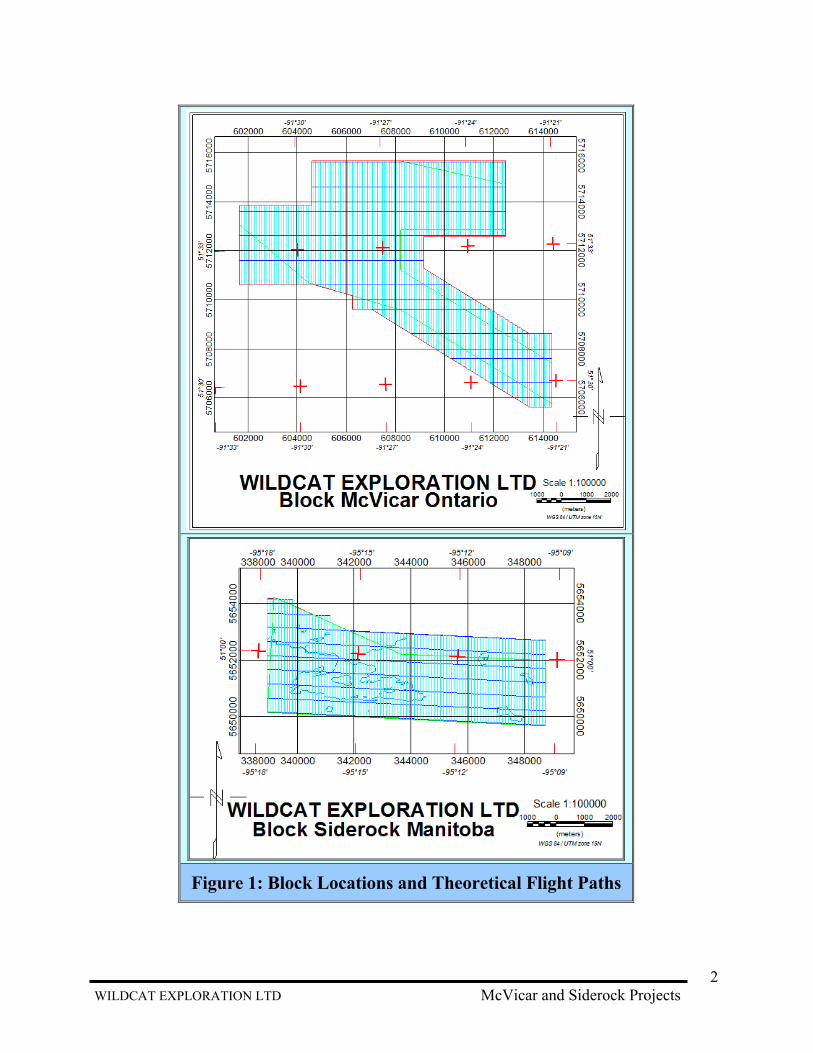
LIST OF FIGURES Figure 1: Block Locations and Theoretical Flight Paths ................................................................ 2 Figure 2: Base Station Magnetometer and Console ........................................................................ 6 Figure 3: The Geophysical System ................................................................................................. 7 Figure 4: Configuration of the Geophysical System ....................................................................... 8 Figure 5: Ground Clearance (metres) ........................................................................................... 13 Figure 6: EM Profile and Anomaly Legend ................................................................................. 15

WILDCAT EXPLORATION LTD McVicar and Siderock Projects
1
1.0 INTRODUCTION On May 25th, 2011, GEO DATA SOLUTIONS GDS INC. (GDS) was awarded contract P10-027 by WILDCAT EXPLORATION LTD (WILDCAT). The contract required GDS to carry out a high-resolution helicopter borne magnetic and spectrometric survey on one block, named McVicar, located approximately 86 km West of Pickle Lake, Ontario, and a magnetic and electromagnetic survey on a second block, named Siderock, located approximately 28 km East of Bissett, Manitoba. The field base of operation was established at Pickel Lake, for the McVicar project, and Bissett, Manitoba, for the Siderock project. On both blocks, traverses were 100-metres spaced and oriented North-South while control-lines were 500-metres spaced and oriented East-West. Table 1 presents survey specifications, figure 1 shows block locations and flight paths, and tables 2 and 3 define block co-ordinates. The helicopter nominal ground clearance was 40 metres, for the McVicar block, and 85 metres, for the Siderock block. Four production flights, flown on June 11th and 12th, were needed to cover the McVicar block, and three production flights, flown on June 22nd and 23rd, were needed for the Siderock block. This report describes survey procedures and data verification, which were carried out in the field, and data processing, which followed at the office.
Table 1: Survey Specifications
Block Technique Traverse
Spacing (m)Traverse Azimuths
Tie Line Spacing (m)
Tie Line Azimuths
Total Line-km
McVicar Lake Ontario
Mag-Spectro 100 N-S 500 E-W 711
Siderock Manitoba
Mag-EM
100 N-S 500 E-W 391
Total 1 102
WILDCAT EXPLORATION LTD McVicar and Siderock Projects
2
Figure 1: Block Locations and Theoretical Flight Paths

WILDCAT EXPLORATION LTD McVicar and Siderock Projects
3
Table 2: McVicar Lake block co-ordinates (Nad83, UTM zone 15N)
Vertex Latitude Longitude X (UTM) Y (UTM)
1 51° 29’ 24.30” N 91° 21” 09.46” W 614 370 5 705 613 2 51° 29’ 24.96” N 91° 21” 56.36” W 613 465 5 705 613 3 51° 31’ 38.90” N 91° 27” 25.38” W 607 033 5 709 613 4 51° 31’ 39.43” N 91° 28” 05.22” W 606 265 5 709 613 5 51° 31’ 57.51” N 91° 28” 04.62” W 606 265 5 710 172 6 51° 32’ 12.79” N 91° 29” 21.97” W 604 765 5 710 613 7 51° 32’ 14.85” N 91° 32” 04.12” W 601 640 5 710 613 8 51° 33’ 59.92” N 91° 32” 00.74” W 601 640 5 713 860 9 51° 33’ 57.97” N 91° 29” 26.53” W 604 610 5 713 860 10 51° 34’ 56.21” N 91° 29” 24.61” W 604 610 5 715 660 11 51° 34’ 50.75” N 91° 22” 35.34” W 612 490 5 715 660 12 51° 33’ 11.35” N 91° 22” 38.88” W 612 490 5 712 588 13 51° 33’ 13.70” N 91° 25” 31.46” W 609 165 5 712 588 14 51° 32’ 31.76” N 91° 25” 32.91” W 609 165 5 711 292 15 51° 31’ 02.03” N 91° 21” 52.89” W 613 465 5 708 613 16 51° 31’ 01.37” N 91° 21” 06.21” W 614 365 5 708 613
Table 3: Siderock block co-ordinates (Nad83, UTM zone 15N)
Vertex Latitude Longitude X (UTM) Y (UTM)
1 50° 58’ 43.72” N 95° 09’ 17.33” W 348 736 5 649 679 2 50° 58’ 49.49” N 95° 17’ 40.30” W 338 935 5 650 153 3 51° 00’ 59.88” N 95° 17’ 46.69” W 338 936 5 654 184 4 51° 00’ 59.76” N 95° 17’ 34.77” W 339 168 5 654 173 5 51° 01’ 02.02” N 95° 17’ 34.68” W 339 172 5 654 243 6 51° 00’ 59.68” N 95° 17’ 25.63” W 339 346 5 654 165 7 51° 00’ 59.39” N 95° 17’ 00.46” W 339 836 5 654 141 8 51° 00’ 52.99” N 95° 17’ 00.15” W 339 836 5 653 943 9 51° 00’ 42.77” N 95° 16’ 21.05” W 340 588 5 653 604 10 51° 00’ 42.48” N 95° 15’ 52.91” W 341 136 5 653 578 11 51° 00’ 35.33” N 95° 15’ 52.56” W 341 136 5 653 357 12 51° 00’ 25.86” N 95° 15’ 16.48” W 341 830 5 653 043 13 51° 00’ 21.78” N 95° 09’ 21.88” W 348 736 5 652 710
WILDCAT EXPLORATION LTD McVicar and Siderock Projects
4
2.0 SURVEY SPECIFICATIONS Airborne survey and noise specifications were as follows: a) Traverse and tie-line spacing and direction
Table 1 presents traverse/tie-line spacing and direction requested. b) Total number of line-km flown:
McVicar Block: 711 km Siderock Block: 391 km c) Nominal terrain clearances
McVicar Block Helicopter nominal terrain clearances: 40 metres Spectrometer nominal ground clearance: 40 metres Magnetometer nominal terrain clearances: 40 metres Siderock Block (figure 4) Helicopter nominal terrain clearances: 85 metres Magnetometer nominal terrain clearances: 60 metres EM receiver nominal terrain clearances: 60 metres EM transmitter nominal terrain clearance: 35 metres
d) Magnetic diurnal variation
A maximum diurnal deviation of 5.0 nT (peak to peak) from a long chord equivalent to a period of one minute was not tolerated without re-flight
e) Magnetometer noise envelope
base station noise envelope did not exceeded 0.2 nT on board magnetometer noise envelope did not exceeded 0.02 nT over 500 metres line-
length without re-flight f) Re-flights and turns
line spacing did not varied by more than 50 % from the indicated spacing over a distance of more than 1 km. The minimum length of any survey line was 3 km.
all reflights of line segments intersected at least two control lines g) Helicopter speed
helicopter speed was approximately 90 km/h and distance between samples along survey lines was typically 2.5 meters for the magnetic and ProspecTEM data
h) Soil moisture
no gamma-ray spectrometric survey was flown during or for 3 hours after measurable precipitation
in the event of heavy precipitation yielding more than 2 cm of ground soaking rain, flying was suspended for at least 12 hours after end of precipitation or until soil returns to its "normal" moisture level.
WILDCAT EXPLORATION LTD McVicar and Siderock Projects
5
3.0 AIRCRAFT, EQUIPMENT AND PERSONNEL
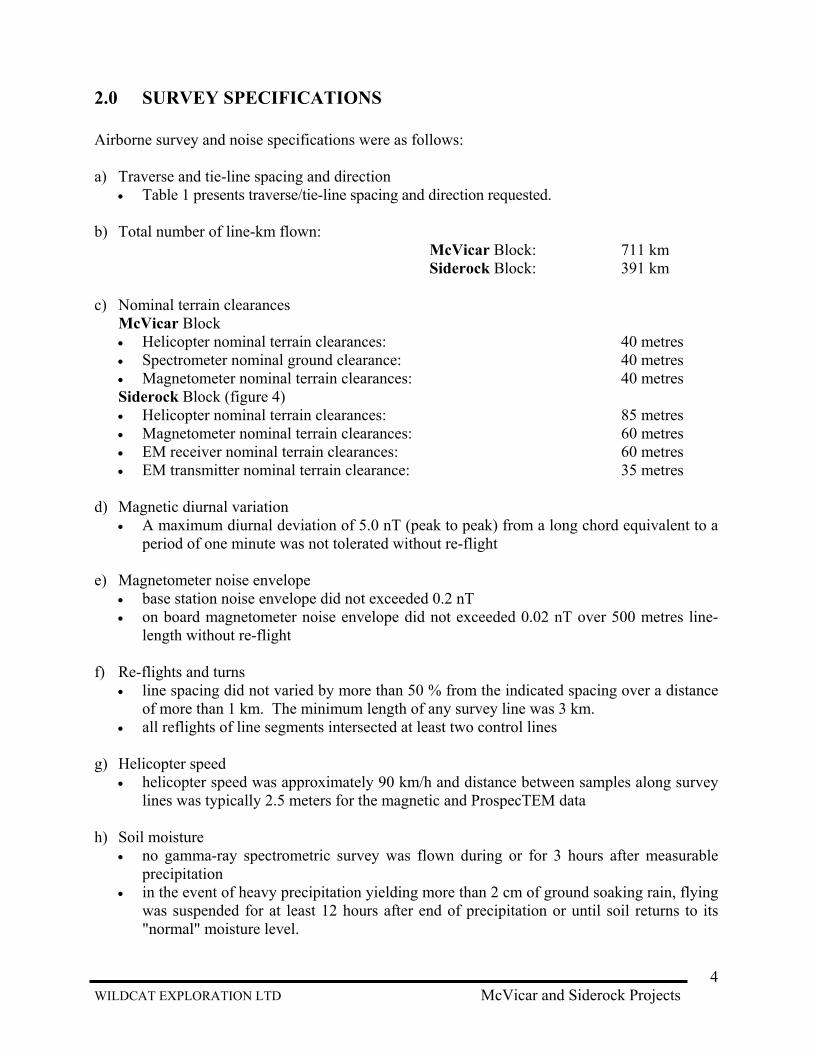
3.1 Aircraft and Equipment Table 4 presents the helicopter characteristics used during data acquisition.
Table 4: The Robinson R44 Helicopter Characteristics
Power plant One 195kW (260hp) Textron Lycoming O-540 flat six piston engine
Rate of climb 1000 ft/min 1000 ft/min
Number of main rotor blades 2
Cruising speed at 75% power 209 MPH
Service ceiling 14,000 ft
Range with no reserve 645 km
Empty weight 635 kg
Maximum takeoff 1,090 kg
Magnetometer: Geometrics Cesium split-beam total field magnetic sensor
installed in a towed bird with a sensitivity of 0.01 nT, a sampling rate of 10 Hz and a resolution better than 0.025 nT per measurement. The sensor tolerates gradients up to 10 000 nT/m, and operates in a range from 20 000 nT to 100 000 nT. A 0.5 nT noise envelope was not exceeded over 500 metres line-length without a reflight.
Magnetometer Base Station: A GEM GSM-19 Overhauser magnetometer base station was
mounted in a magnetically quiet area. The base station measures total intensities of the earth's magnetic field in units of 0.01 nT at intervals of 1 second and within a noise envelope of 0.10 nT. The base station magnetometer was located near the base of operation.
At the end of the data acquisition periods, the averaged values
of the base station magnetometer were 57 512 nT (McVicar Block) and 55 598 nT (Siderock Block).

WILDCAT EXPLORATION LTD McVicar and Siderock Projects
6
Figure 2: Base Station Magnetometer and Console Electromagnetic System: Transient helicopter-borne EM system (ProspecTEM), with
the following specifications (figures 3 and 4): 1. 2.4-kW generator in the transmitter, electrically isolated
from the helicopter; 2. Alternating 2.8 ms half-sine pulses with intervening off-
times of 12.5 ms; 3. 1024 samples of transmitter current per cycle. 4. Orthogonal (X-Y-Z) component receiver in bird above
transmitter; 5. 1024 samples of response per component per cycle; 6. 10-Hz output rate of 10 on-time and 20 off-time channels
of transmitter current, Z-component. 7. Cable Cable- length (helicopter-transmitter): 55 metres Distance helicopter-receiver: 28 metres Nominal EM transmitter ground-clearance: 35 metres Nominal EM receiver ground-clearance: 60 metres Cable dip: 63° 8. Transmitter Maximum Current: 1 500 A Diameter: 7.5 metres Dipolar moment: 170 000 A-t (Z-axis) Total number of wire turns: 2 9. Receiver Windows (Table 5) The two-turn ProspecTEM transmitter has a rapid and stable turn-off, minimizing primary-field artefacts in early-time response. This clarifies the identification of poorly conductive features, enabling more reliable ranking of highly conductive targets for drilling. With its diameter of 7.5 m, the rigid PropecTEM transmitter has inherent in-flight stability. This helps the pilot maintaining a

WILDCAT EXPLORATION LTD McVicar and Siderock Projects
7
stable geometry and contour the ground more accurately to obtain strong, consistent and interpretable measurements. This stability is particularly important in rough terrain and turbulent conditions.
Figure 3: The Geophysical System

WILDCAT EXPLORATION LTD McVicar and Siderock Projects
8
Figure 4: Configuration of the Geophysical System

WILDCAT EXPLORATION LTD McVicar and Siderock Projects
9
Table 5: EM Windows Channel Starting
time (msec)
Width (msec)
Pulse Channel Starting time (msec)
Width (msec)
Pulse
1 0,16667 0,01667 ON 21 3,15 0,53333 OFF
2 0,25 0,01667 ON 22 3,26667 0,53333 OFF
3 0,33333 0,01667 ON 23 3,4 0,53333 OFF
4 1,3 0,01667 ON 24 3,26667 1,1 OFF
5 1,31667 0,01667 ON 25 3,45 1,1 OFF
6 1,33333 0,01667 ON 26 3,65 1,1 OFF
7 2,58333 0,01667 ON 27 3,88333 1,1 OFF
8 2,66667 0,01667 ON 28 4,13333 1,1 OFF
9 2,8 0,08333 ON 29 4,43333 1,1 OFF
10 2,81667 0,08333 ON 30 4,76667 1,1 OFF
11 2,83333 0,08333 ON 31 5,16667 1,1 OFF
12 2,85 0,16667 RAMP 32 5,05 2,2 OFF
13 2,86667 0,18333 OFF 33 5,55 2,2 OFF
14 2,86667 0,25 OFF 34 6,13333 2,2 OFF
15 2,86667 0,36667 OFF 35 6,78333 2,2 OFF
16 2,91667 0,36667 OFF 36 7,51667 2,2 OFF
17 2,91667 0,53333 OFF 37 8,36667 2,2 OFF
18 2,95 0,53333 OFF 38 9,33333 2,2 OFF
19 3 0,53333 OFF 39 10,45 2,2 OFF
20 3,03333 0,53333 OFF 40 11,7 2,2 OFF
Spectrometric System: A crystal pack containing 4 downward-looking crystals
(16.8 litres) and 1 upward-looking crystal (4.2 litres) analyzed gamma radiations with a Radiation Solutions Inc. RSX-5 1024-channel spectrometer. The RSX-5 is self-calibrating and has automatic gain control, which eliminates the use of radioactive sources in the field. The spectrometer records total count, counts for potassium, uranium and thorium, along with the entire 1024-channel spectra and live-time at a rate of 1 Hz.

WILDCAT EXPLORATION LTD McVicar and Siderock Projects
10
Digital Acquisition System: A data acquisition system (AGIS Pico Envirotec Instruments) recorded geophysical and ancillary data on a removable media every 0.1 s.
Radar Altimeter: TRA-3000, accuracy 5%, sensitivity one foot, range 0 to
2,500 feet, 1 sec. recording interval Electronic Navigation: Real-Time Differentially Corrected Omnistar System, 1.0 sec.
recording interval, accuracy of ±5 metres. Ancillary Equipment: Computer workstation, complement of spare parts and test
equipment
3.2 Personnel Project general management was monitored offsite by Mr. Mouhamed Moussaoui, GDS’s President. Mr. Alain Tremblay was responsible for the field electronic system maintenance. Final data evaluation and processing was carried out at the Laval GDS office by Mr. Saleh Elmoussaoui, for magnetic data, and Mrs My Phuong Vo, for EM data, on the Siderock Block, and Mr. Carlos Cortada, for magnetic and spectrometric data, on the McVicar Block. Survey crew and office personnel are listed in table 6.
Table 6: Field and Office Crew
Position Name
Project Manager Mr. Mouhamed Moussaoui, P.Eng.
Electronic maintenance Mr. Frank Beillard
Field Operator Mr. Alain Tremblay
Pilot Mr. Alain Tremblay
Field Quality Control Mr. Carlos Cortada
Final Processing Mr. Saleh Elmoussaoui (mag. data, Siderock Block) Mrs. My Phuong Vo (EM data, Siderock Block) Mr. Carlos Cortada (mag. and spectro. data, McVicar Block)
Survey Report Mr. Camille St-Hilaire, P.Geo

WILDCAT EXPLORATION LTD McVicar and Siderock Projects
11
4.0 SURVEY SCHEDULE The survey was flown over two blocks with flight line bearing selected to run perpendicular to the average trend of the local geological structures. Survey steps were: For the McVicar Block (Mag. And Spectro.): Mobilization to Pickel Lake: June 11th, 2011 Survey: June 11th and 12th, 2011 Demobilization: June 12th, 2011 For the Siderock Block (Mag. and EM):
Mobilization to Bissett: June 21st, 2011 Survey: June 22nd and 23rd, 2011 Demobilization: June 23rd, 2011 Preliminary maps were sent to WILDCAT few days after survey completion while final maps and data were delivered at the end of July 2011.
5.0 DATA ACQUISITION After each day, profiles were examined as a preliminary assessment of the noise level on the recorded data. Altimeter deviations from the prescribed flying altitudes were also closely examined as well as the magnetic diurnal activity, as recorded at the base station. All digital data were verified for validity and continuity. Data from helicopter and base station were transferred to the PC's hard disk. Basic statistics were generated for each parameter recorded. These included the minimum, maximum and mean values, the standard deviation and any null values located. Editing of all recorded parameters for spikes or datum shifts was done, followed by final data verification via an interactive graphic screen with on-screen editing and interpolation routines. The quality of the GPS navigation was controlled on a daily basis by recovering the helicopter flight path. Checking all data for adherence to specifications was carried out before crew and aircraft demobilization by GDS’s geophysicist.

WILDCAT EXPLORATION LTD McVicar and Siderock Projects
12
6.0 DATA COMPILATION AND PROCESSING
6.1 Base maps Base maps of the survey area were plotted from topographic maps of the Department of Natural Resources Canada at a scale of 1:50 000. Projection description Datum: Nad 83 Projection: Universal Transverse Mercador, UTM Zone 15N False Easting: 500 000 False Northing: 0 Scale Factor: 0.9996
6.2 Processing of Base Station Data Recorded magnetic diurnal data from the magnetometer base station were reformatted and loaded into the OASIS database. After initial verification of the integrity of the data from statistical analysis, the appropriate portion of the data was selected to correspond to the exact start and end time of the flight. Data were then checked and corrected for spikes using a fourth difference editing routine. Following this, interactive editing of data was done, via a graphic editing tool, to remove events caused by man-made disturbances. A small low pass noise filter (30 seconds) was then applied. Averages of the Total Field Magnetic Intensity measured at the Base Station were 57 512 nT, for the McVicar Block, and 55 598 nT for the Siderock Block.
6.3 Processing of the Positioning Data (GPS) The raw GPS data were recovered and corrected from spikes. The resulting corrected latitudes and longitudes were then converted to the local map projection and datum (Nad83). A point-to-point speed calculation was then done from the final X, Y coordinates and reviewed as part of the quality control. The flight data were then cut back to the proper survey line limits and a preliminary plot of the flight path was done and compared to the planned flight path to verify the navigation. The positioning data were then exported to the other processing files.
6.4 Processing of the Altimeter Data The altimeter data, which includes the radar altimeter and the GPS elevation values, were checked and corrected for spikes using a fourth difference editing routine. A small low pass filter of 2 seconds was then applied to the data. Following this, a digital terrain trace was computed by subtracting the radar altimeter values from the corrected GPS elevation values. All resulting parameters were then checked, in profile form, for integrity and consistency, using a graphic viewing editor. Aircraft ground clearance was well maintained during this survey (figure 5).

WILDCAT EXPLORATION LTD McVicar and Siderock Projects
13
6.5 Processing of Magnetic Data The airborne magnetic data were reformatted and loaded into the OASIS database. After initial verification of the data by statistical analysis, the values were adjusted for system lag. The data were then checked and corrected for any spikes using a fourth difference editing routine and inspected on the screen using a graphic profile display. Interactive editing, if necessary, was done at this stage. Following this, the long wavelength component of the diurnal was subtracted from
30 80
10%
30%
50%
70%
90%
Samples:Minimum:Maximum:Mean:Geo.Mean:
205482 30.37 75.22 41.11 40.85
mRaltlc McVicar area
McVicar Block
60 130
10%
30%
50%
70%
90%
Samples:Minimum:Maximum:Mean Helicopter:Mean Mag:Mean EM:
134382 65.5
126.3 85.7
56.530.68
Radar
Siderock Block
Figure 5: Ground Clearance (metres)

WILDCAT EXPLORATION LTD McVicar and Siderock Projects
14
the data as a pre micro-levelling step. A preliminary grid of the values was then created and verified for obvious problems, such as errors in positioning or bad diurnal. Appropriate corrections were then applied to the data, as required.
6.5.1 Micro-Levelling Complex airborne datasets acquired on parallel lines often exhibit subtle artefacts in the line direction. Micro-levelling is used to filter the primary gridded data in order to reduce or remove long-wavelength noise along survey lines, caused by non-geological effects. For this survey, GDS used a proprietary micro-levelling technique. It uses modified median filters that are designed to match the statistical nature of geophysical data. Along-line and cross-line directional filters plus clean-up filters are used to isolate and remove this sort of noise from the gridded images. Naudy-type thresholds are used to limit the amplitude of change at any data point. Once the micro-levelling process is applied, colour-shaded images are studied to verify that the line noise has been minimized, and that new line noise has not been introduced. The micro-level correction grid is reviewed to confirm that no significant geological signal had been lost. The final stage is to sample the correction grid and apply these corrections to the geophysical data profile. Micro-levelling was applied on both blocks.
6.5.2 Total Magnetic field and First Vertical Derivative Grids The reprocessed total field magnetic grid was calculated from the final reprocessed profiles by a minimum curvature algorithm. The accuracy standard for gridding was that the grid values fit the profile data to within 0.01 nT for 99.99% of the profile data points. The grid cell size was 25 metres. Minimum curvature gridding provides the smoothest possible grid surface that also honours the profile line data. However, sometimes this can cause narrow linear anomalies cutting across flight lines to appear as a series of isolated spots. The first vertical derivative of the total magnetic field was computed to enhance small and weak near-surface anomalies and as an aid to delineate the geologic contacts having contrasting susceptibilities. The calculation was done in the frequency domain, using Win-Trans FFT algorithms.
6.6 Processing of Electromagnetic Data After initial verification of the integrity of the EM data from statistical analysis, the off-time data from dB/dt Z Coil channels 13-36 were checked and corrected for spikes and lag. Drift correction was applied to each of the channels (13 to 36) using a low order polynomial function, generated from chosen background segments. Afterwards, interactive editing of the profiles was done, via a graphical editing tool, and levelling routines were then applied.

WILDCAT EXPLORATION LTD McVicar and Siderock Projects
15
The following off-time profiles were finally plotted: channel 16, channel 20, channel 27, channel 30 and channel 36 along with the interpreted anomalies (figure 6). Time constant calculation for a line of EM data is based on the impulse/step response at each time fid decays piece-wise exponentially. If the amplitude of the impulse/step response signals at
is , at any further time it can be predicted by:
where is the window center time (ms) of the j-th time gate, and τ (TAU) is the decay constant. A slow rate of decay, reflecting a high conductivity, will be represented by a high decay constant. For the present datasets, decay constants were calculated by fitting dB/dt Z coil responses from channels 13 to 27 to the exponential function (Ref.: Reford S. and Rainsford D., 2001. Report on Reid-Mahaffy Airborne Geophysical Test Site (2000-2002). Ontario Geological Survey, Geophysical Data Set 1111).
ANOMALY LEGEND :
High Anomaly
Medium High Anomaly
Medium Low Anomaly
Low Anomaly
Surface Anomaly
Wnd 30
Wnd 27 Middle Time
Wnd 20
Wnd 36 Late Time
Wnd 16 Early Time
Off Time
1 U
nit =
120
nT
/sec
.
Z-COMPONENT OFF-TIME PROFILE
2100
175014001050
700350
75062550037525012500U
nits
: Nan
ote
slas
/ S
ec.
Distance : Metres
Figure 6: EM Profile and Anomaly Legend

WILDCAT EXPLORATION LTD McVicar and Siderock Projects
16
6.7 Processing of Spectrometric Data
6.7.1 Field Processing The following tests and calibrations were performed prior to survey commencement and during survey flying:
Compton stripping coefficients; aircraft and cosmic backgrounds; height attenuation coefficient; radioelement sensitivities; radon removal parameters.
These calibrations and tests were flown either near the Breckenridge test site or over the survey site, as part of the start-up and monitoring procedures. Details of each test and their results are given in Appendix B. A periodic AGS test line was performed daily pre- and post flight. The Airborne Gamma-ray Spectrometric data was subjected to primary quality control, complete data reduction, gridding and imaging in the field during the data acquisition phase.
6.7.2 Office Processing GDS utilized an improved methodology for AGS data reduction based on the standard techniques outlined in the following references:
IAEA-Tecdoc-1363, Guidelines for radioelement mapping using gamma ray spectrometric data;
AGSO Record 1995/60, A Guide to the Technical Specifications for Airborne Gamma-Ray Surveys.
IAEA-TECDOC-1363, “Guidelines for radioelement mapping using gamma ray spectrometry data” (July 2003).
Parameters used for this processing were based on those determined during the calibration and testing phase of the survey (see Appendix B) and on subsequent analysis of the whole AGS data set including background-over-water measurements. Primary AGS data consists of the 1024 channel spectra collected at 1 Hz for both the downward-looking (16.8 litres) and upward-looking (4.2 litres) crystal packs. Major data reduction stages are:
Analysis of the 1024 channel AGS spectra and applying of in-house specific filters Appropriate filtering of auxiliary data (ground clearance, temperature, pressure and cosmic) Calculation of effective height (at STP = “Hstp”) Background removal (aircraft, cosmic and atmospheric radon) Compton stripping (spectral unfolding)

WILDCAT EXPLORATION LTD McVicar and Siderock Projects
17
Adjustment for height attenuation Conversion to radioelement ground concentrations (TC, K U, TH) Gridding and evaluation Calculation of derivative products
Each of the radioelement results: total count (TC); potassium (K); uranium (U); and thorium (TH) were evaluated using statistical and image analysis techniques.
6.7.3 Noise Reduction GDS’s personnel have extensive experience with reduction of noise presents on the gamma-ray spectrometric data. Specific in-house filters were applied to both downward and upward 1024 channel spectra in order to reduce statistical noise. The noise–reduced spectra were then used to extract new TC, K, U and TH and UPU (upward-looking uranium) ROI count rates, which then have less noise than the original raw ROI. For the uranium measurement, in particular, it is possible to achieve a significant reduction in statistical noise. With this particular pre-processing, we obtain more precise measures of the radioelement ground concentrations, which improve the discrimination between different geologic units with similar concentration values. However, no significant improvement occurs for the total count measurement since it already incorporates a major part of the gamma-ray spectrum. The improved maps or images can reveal patterns and shapes previously hidden or barely discernible in the noise.
6.7.4 Spikes and Corrupted Data Removal
All primary data was edited in the field to eliminate rare instances of spikes and corrupted data points. During data reduction, appropriate filtering was applied to selected AGS fields in order to match measurement parameters to the primary gamma-ray data and/or improve accuracy.
6.7.5 Ground Clearance Helicopter ground clearance was well maintained during this survey. AGS data is quite sensitive to height of the spectrometer above ground. The effective height at STP (Hstp) is used in data reduction. Note that the mean ground clearance obtained over the McVicar block is quite close to the planned survey height of 40 m (figure 5).
6.7.6 Atmospheric Radon Background Removal The upward-looking detector method was used to remove the effects of atmospheric radon from the downward spectrometer count rates. The determination of the coefficients to be applied in this process, are described in Appendix B. The upward-looking spectrometer measures count rates in a “uranium” ROI. The atmospheric radon levels, during this survey, fell within the expected range of concentrations.

WILDCAT EXPLORATION LTD McVicar and Siderock Projects
18
In order to determine the AGS system response to atmospheric radon, a series of data were collected at survey height over a large lake in the survey area. All measurement points were at least 500 metres from shore, which results in negligible gamma contribution from the land. The background-over-water measurements (BOW) were made under a range of times-of-day and weather conditions in order to encounter a range of atmospheric radon concentrations. The resulting data are analyzed to obtain:
(a) Radon response coefficients for use with the upward-looking radon-removal technique; (b) An improved estimate of the aircraft background.
6.7.7 Gridding Total Count, uranium, thorium and potassium contributions were gridded using a minimum curvature algorithm (Oasis Montaj) with controls optimized for AGS data. A grid cell size of 25 metres was used. Tie lines were not included in the gridding process. The grids were evaluated at all stages using image analysis techniques.
7.0 FINAL PRODUCTS
7.1 Maps GDS made base maps from information present on published topographic maps. Each map was produce at a scale of 1:20 000 and displayed base-map features, flight path and UTM co-ordinates. One paper copy of the following final maps was delivered to WILDCAT: For the McVicar Block: (a) Shaded Magnetic Total Field (colour interval)
(b) Shaded Magnetic First Vertical Derivative (colour interval) (c) Gamma-Ray Total-Count (d) Apparent Potassium-Concentration (%) (e) Equivalent Thorium-Concentration (ppm) (f) Equivalent Uranium-Concentration (ppm) (g) Uranium/Thorium Ratio (h) Uranium/Potassium Ratio
For the Siderock Block: (a) Shaded Magnetic Total Field (colour interval) (b) Shaded Magnetic First Vertical Derivative (colour interval) (c) ProspecTEM Z-Component Off-Time stacked profiles with EM anomalies picked (d) Decay constant (TAU) Maps
7.2 Final digital archive of line data GDS produced three copies of a CD-ROM containing digital archives and maps (PDF and Map formats). Digital archives, described in Appendix A, contain Geosoft databases of all survey data. Databases are referenced to the standard UTM co-ordinates for the area. A list of all EM

WILDCAT EXPLORATION LTD McVicar and Siderock Projects
19
anomalies was also included on the CD-ROM. GDS stored a copy of the digital archive for one year after the production of the final products.
7.3 Miscellaneous Three paper copies of this technical report, with the corresponding digital PDF file, have been produced and delivered to WILDCAT.
8.0 CONCLUSION Flown on June 11th and 12th, 2011 (McVicar Block) and on June 22nd and 23rd, 2011 (Siderock Block), the helicopter borne magnetic, spectrometric and electromagnetic survey were completed inside the estimated time frame. All airborne and ground-based records were of excellent quality. Magnetic data acquisition was done in good diurnal conditions. The noise level for the measured Total Magnetic Field was well within the accepted limits, determined from the fourth difference of the lagged, edited airborne magnetic data. The acquisition of the electromagnetic data was done in excellent noise conditions. Final maps and database show that the noise level (sferics) was low on all EM channels. Acquisition of the Gamma-Ray Spectrometric data was done in excellent weather conditions. Atmospheric radon levels fell within expected range of concentrations. Final maps and database show that noise levels were very low on all the spectrometric channels. GPS results proved to be of high quality. The flight path was surveyed accurately and speed checks showed no abnormal jumps in the data. It is hoped that the information presented in this report, and on the accompanying products, will be useful both in planning subsequent exploration efforts and in the interpretation of related exploration data. Respectfully Submitted,
Camille St-Hilaire, M.Sc.A. P.Geo.

APPENDIX A
DIGITAL ARCHIVE DESCRIPTION

Magnetic and Spectrometric Channels McVicar Block
Magnetic and Spectrometric Channel List
Channel Description Sampling Unit Format fid RMS Fiducial 10Hz d8.1 date Date flown 10Hz yyyy/mm/dd f11.0 flt Flight number 10Hz s5.0 line Line number 10Hz I6.0 UTC UTC Time (seconds after midnight) corrected 10Hz sec d8.1 lat Latitude, WGS84 10Hz dd.mm.ss.s d13.2 lon Longitude WGS84 10Hz dd.mm.ss.s d14.2 x X, WGS84 UTM Z21N 10Hz m d9.2 y Y, WGS84 UTM Z21N 10Hz m d10.2 z Z, (MSL) 10Hz m d7.2 raltlc Radar Corrected (final) 10Hz m d8.2 DTM Digital Terrain Model (corrected) 10Hz m d7.2 basea Edited and filtered base mag 10Hz nT d10.3 MBc Tail Raw compensated mag 10Hz nT d10.3 MBclc Tail mag Edited and filtered 10Hz nT d10.3 drift_LF Low-Frequency diurnal correction 10Hz nT d10.3 magbc Mag Diurnal corrected (TMI) 10Hz nT d10.3 coralt Altitude correction 10Hz nT d10.3 magalt Altitude corrected mag 10Hz nT d10.3 cormicro Microlevelling correction 10Hz nT d10.3 magmicro Final mag after all corrections 10Hz nT d10.3
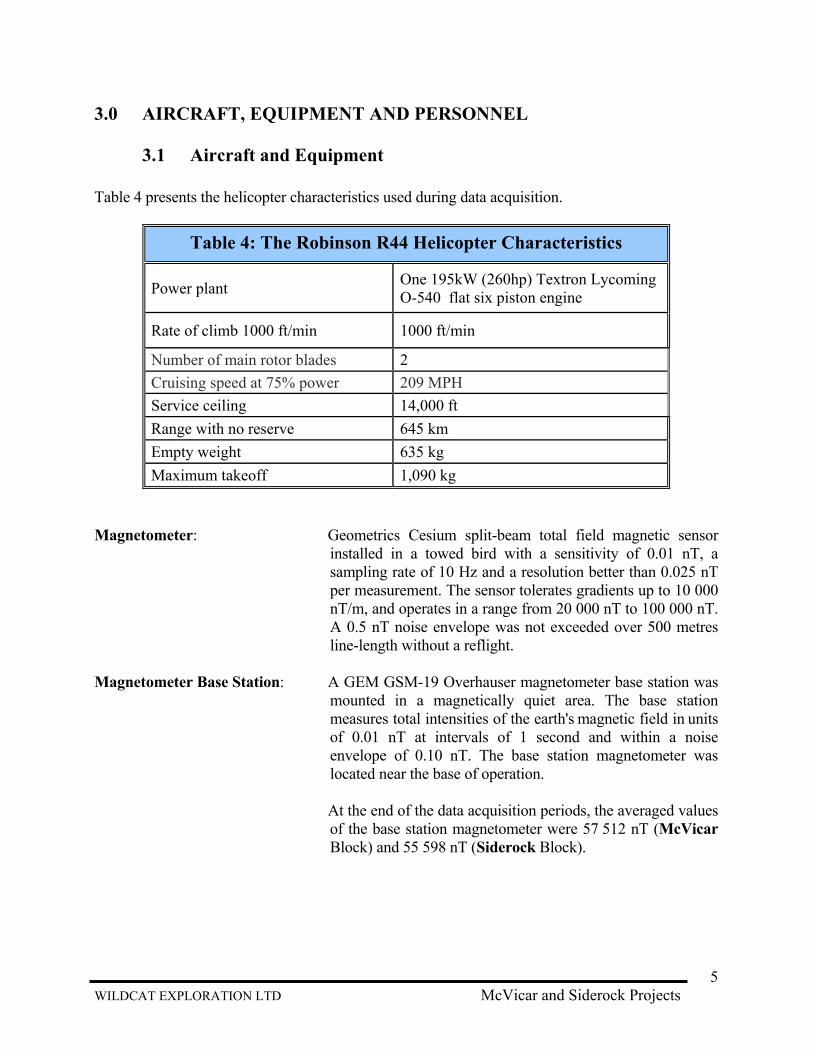
pressc Pressure 1Hz mBar d10.1 oatc Temperature 1Hz °C d10.1 Hstp Effective height 1Hz m d7.2 stime Sample time 1Hz ms s8.0 ltime Live Time 1Hz ms s7.0 rawCOS Raw Cosmic channel 1Hz cps s8.0 filCOS Filtered Cosmic channel (Hanning 35 sec) 1Hz cps d8.3 rawspecD Raw Downward array 256 channels 1Hz cps s[256] rawspecU Raw Upward array 256 channels 1Hz cps s[256] rawTC Raw Total Count 1Hz cps l8.0 rawK Raw Potassium 1Hz cps l8.0 rawU Raw Uranium 1Hz cps l8.0 rawTH Raw Thorium 1Hz cps l8.0 rawUPU Raw Up Uranium 1Hz cps l8.0 ltcTC Live-Time Cor. Total Count 1Hz cps d10.3 ltcK Live-Time Cor. Potassium 1Hz cps d10.3 ltcU Live-Time Cor. Uranium 1Hz cps d10.3 ltcTH Live-Time Cor. Thorium 1Hz cps d10.3 ltcUPU Live-Time Cor. Up Uranium 1Hz cps d10.3 filTC Filtered Total Count 1Hz cps d10.3
filK Filtered Potassium 1Hz cps d10.3 filU Filtered Uranium 1Hz cps d10.3 filTH Filtered Thorium 1Hz cps d10.3 filUPU Filtered Up Uranium 1Hz cps d10.3 bakTC Background and Cosmic Cor. Total Count 1Hz cps d10.3 bakK Background and Cosmic Cor. Potassium 1Hz cps d10.3 bakU Background and Cosmic Cor. Uranium 1Hz cps d10.3 bakTH Background and Cosmic Cor. Thorium 1Hz cps d10.3 bakUPU Background and Cosmic Cor. Up Uranium 1Hz cps d10.3 rnrTC Radon Removed Total Count 1Hz cps d10.3 rnrK Radon Removed Potassium 1Hz cps d10.3 rnrU Radon Removed Uranium 1Hz cps d10.3 rnrTH Radon Removed Thorium 1Hz cps d10.3 csK Compton Stripping Potassium 1Hz cps d10.3 csU Compton Stripping Uranium 1Hz cps d10.3 csTH Compton Stripping Thorium 1Hz cps d10.3 attTC Altitude Attenuation Cor. Total Count 1Hz cps d10.3 attK Altitude Attenuation Cor. Potassium 1Hz cps d10.3 attU Altitude Attenuation Cor. Uranium 1Hz cps d10.3 attTH Altitude Attenuation Cor. Thorium 1Hz cps d10.3 conTCngyh Total Count air adsorbed Dose Rate 1Hz nGgy/h d10.3 conKper Potassium Concentration 1Hz % d10.3 conUppm Uranium Concentration 1Hz ppm d10.3 conTHppm Thorium Concentration 1Hz ppm d10.3 ratioTHK Thorium over Potassium Ratio 1Hz ppm/% d10.3 ratioUK Uranium over Potassium Ratio 1Hz ppm/% d10.3 ratioUTH Uranium over Thorium Ratio 1Hz ppm/ppm d10.3

Magnetic and Electromagnetic Channels Siderock Block
EM Channel list
General line information: Line Line number UTC Sec UTC time in second after midnight Flt Flight number Date Flight date (yyyy/mm/dd) Edited GPS channels X m Easting, WGS-84 UTM Z15N Y m Northing, WGS-84 UTM Z15N Lon Deg Longitude, WGS-84 Lat Deg Latitude, WGS-84 Z m Zgps Altimeter Radar m Radar Altimeter DTMC m Digital Terrain Model (from Zgps and Radar) Electromagnetic Data: Wnd1 - 40 nT/s Raw dB/dt Z Coil Channels 1-40 Wnd13_l - Wnd36_l nT/s Lagged dB/dt Z Coil Channels 13-36 Wnd13_ld1f0_tr5f – Wnd36_ld1f0_tr5f nT/s Drift-corrected dB/dt Z Coil Channels 13-36 mm13fm0_tr5f – mm36fm0_tr5f nT/s Final dB/dt Z Coil Channels 13-36 TAUz13_27us_f µs Decay Constant (Tau) from dB/dt Z Channels 13-27 Anomaly 0 – Surface Anomaly (Channels 13-16)
1 – Low Anomaly (Channels 13-20) 2 – Medium Low Anomaly (Channels 13-27) 3 – Medium High Anomaly (Channels 13-30) 4 – High Anomaly (Channels 13-36)
TAU_SR.grd: Decay Constant (Tau) from dB/dt Z Coil Channels 13-27 EM_SideRock.gdb: Electromagnetic database Gridding cell size is 25 m
Magnetic Channel List Channel Description Sampling Unit Format Fid RMS Fiducial 10Hz d8.1 Date Date flown 10Hz yyyy/mm/dd f11.0 flt Flight number 10Hz s5.0 Line Line number 10Hz I6.0 UTC UTC Time (seconds after midnight) corrected 10Hz sec d8.1 lat Latitude, WGS84 10Hz dd.mm.ss.s d13.2 lon Longitude WGS84 10Hz dd.mm.ss.s d14.2 x X, WGS84 UTM Z15N 10Hz m d9.2 y Y, WGS84 UTM Z15N 10Hz m d10.2 z Z, (MSL) 10Hz m d7.2 raltlc Radar Corrected (final) 10Hz m d8.2 DTM Digital Terrain Model (corrected) 10Hz m d7.2 basea Edited and filtered base mag 10Hz nT d10.3 MBc Tail Raw compensated mag 10Hz nT d10.3 MBclc Tail mag Edited and filtered 10Hz nT d10.3 drift_LF Low-Frequency diurnal correction 10Hz nT d10.3 magbc Mag Diurnal corrected (TMI) 10Hz nT d10.3 cormicro Microlevelling correction 10Hz nT d10.3 magmicro Final mag after all corrections 10Hz nT d10.3

APPENDIX B
CALIBRATION AND TESTS
Location: Date:
Pilot: Aircraft:
Operator: Compiled by:
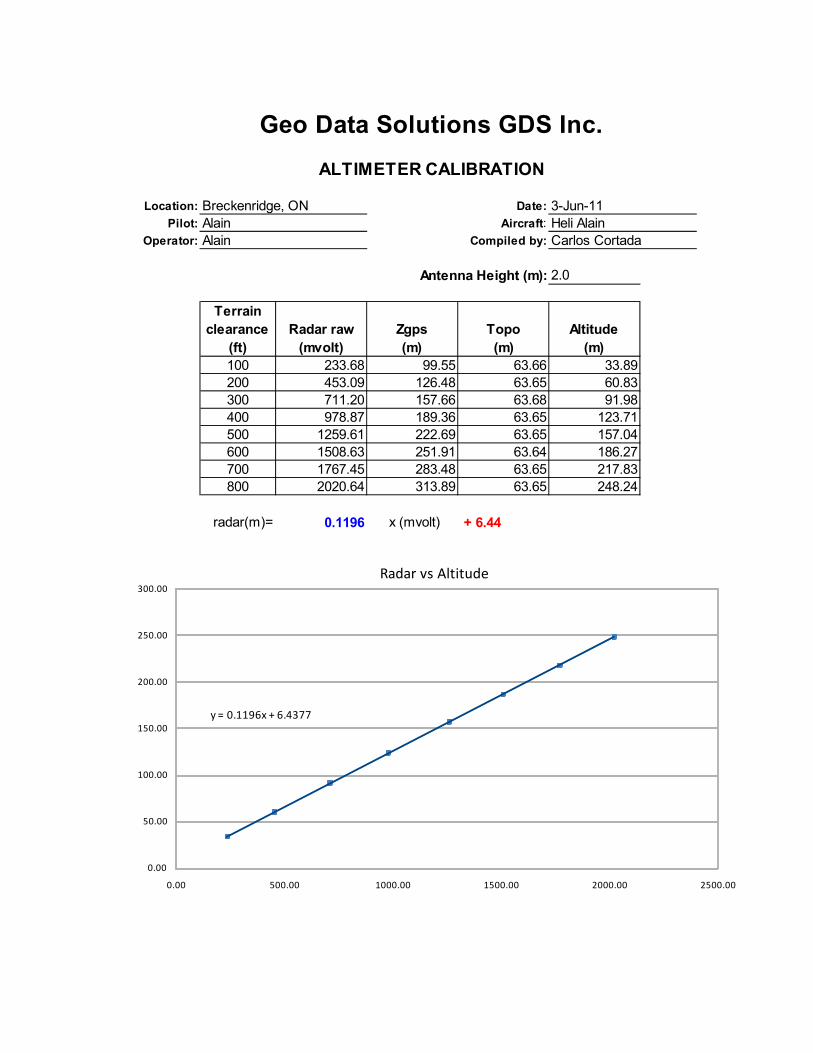
Antenna Height (m): 2.0
Terrain clearance
(ft)Radar raw
(mvolt)Zgps(m)
Topo(m)
Altitude(m)
100 233.68 99.55 63.66 33.89200 453.09 126.48 63.65 60.83300 711.20 157.66 63.68 91.98400 978.87 189.36 63.65 123.71500 1259.61 222.69 63.65 157.04600 1508.63 251.91 63.64 186.27700 1767.45 283.48 63.65 217.83800 2020.64 313.89 63.65 248.24
radar(m)= 0.1196 x (mvolt) + 6.44
Alain Carlos Cortada
Geo Data Solutions GDS Inc.
ALTIMETER CALIBRATION
Breckenridge, ON 3-Jun-11Alain Heli Alain
y = 0.1196x + 6.4377
0.00 500.00 1000.00 1500.00 2000.00 2500.00
0.00
50.00
100.00
150.00
200.00
250.00
300.00
Radar vs Altitude


Location: Date:Operator: Aircraft:
Compiled by: No. Crystal Packs:
TC K U TH(feets) (meters) c/sec c/sec c/sec c/sec c/sec c/sec2000 598.31 83.54 115.71 13.12 4.25 4.10 0.943000 905.65 95.91 126.44 13.74 4.41 5.22 1.114000 1208.44 105.80 141.53 15.15 5.15 6.29 1.255000 1505.46 122.61 157.16 16.11 5.94 6.37 1.746000 1811.87 138.85 176.83 17.15 6.79 8.03 1.547000 2130.06 161.94 201.74 17.73 8.43 9.95 2.338000 2419.96 187.02 233.42 21.60 9.54 11.13 2.549000
(Data have been livetime corrected, except for Cosmic-counts)
TCKU
THUPU
Cosmic Coeff. (c/sec) Aircraft Background
COSMIC CALIBRATIONMarathon, ON 09/06/2011Alain HeliCarlso Cortada 1
Nominal Elevation Z GPS COS
DOWNWARD SPECTROMETER WINDOWSUPU
1.1357 19.3690.0749 6.7820.0541 -0.5650.0677 -1.3590.0159 -0.399
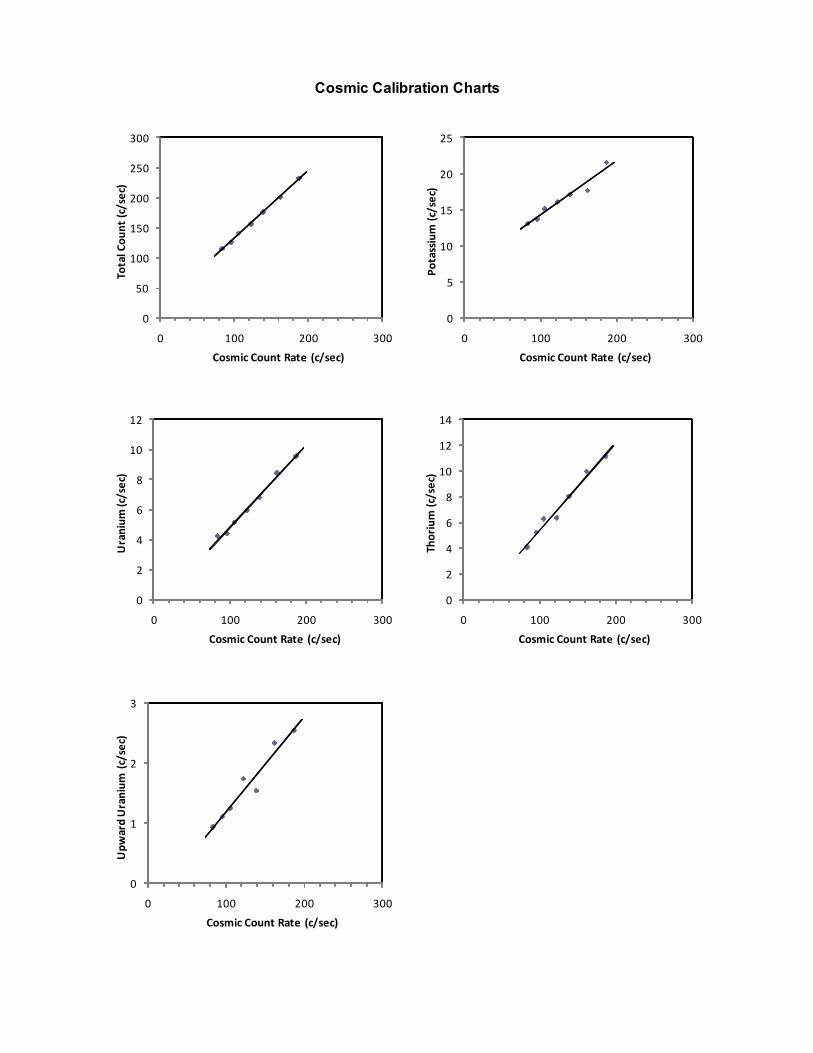
Cosmic Calibration Charts
0
50
100
150
200
250
300
0 100 200 300
Total Count (c/sec)
Cosmic Count Rate (c/sec)
0
5
10
15
20
25
0 100 200 300
Potassium (c/sec)
Cosmic Count Rate (c/sec)
0
2
4
6
8
10
12
0 100 200 300
Uranium (c/sec)
Cosmic Count Rate (c/sec)
0
2
4
6
8
10
12
14
0 100 200 300
Thorium (c/sec)
Cosmic Count Rate (c/sec)
0
1
2
3
0 100 200 300
Upward Uranium (c/sec)
Cosmic Count Rate (c/sec)

Location: Date:Operator: Aircraft:
Compiled by: No. Crystal Packs:
TC K U TH UPUCosmic coeff. 1.1357 0.0749 0.0541 0.0677 0.0159Aircraft BKGD 19.3685 6.7816 -0.5652 -1.3594 -0.3991
Adjusted Aircraft BKGD 23.8916 7.5679 -0.5652 -1.1098 -0.4677
TC K U TH UPU80010 32.57 18.050 1.600 1.440 -0.220 0.39080021 30.42 21.070 1.990 1.050 0.720 0.33080030 43.44 34.530 2.810 1.970 0.650 0.62080051 51.11 31.800 2.240 1.760 0.370 0.49080060 43.37 17.030 1.180 0.450 0.500 0.35080080 43.28 11.510 1.530 0.320 0.190 -0.12080101 46.56 7.900 0.610 0.610 0.130 -0.05080110 37.13 6.260 1.150 0.330 0.270 0.090
aTC = 14.1192
aK = 0.8599
aTH = 0.0773
aUPU = 0.3340
Line
Alain Heli
RADON CALIBRATION
All ‘b’ ratios = 0
Radon Ration
Survey Area
1
RadarBackground corrected counts (cps)
Carlos Cortada
Radon Regression Charts Radon Regression Charts
y = 14.119x + 4.5231R² = 0.8145
0
5
10
15
20
25
30
35
40
0.0 0.5 1.0 1.5 2.0 2.5
TC vs U
y = 0.8599x + 0.7863R² = 0.6743
0.0
0.5
1.0
1.5
2.0
2.5
3.0
0.0 0.5 1.0 1.5 2.0 2.5
K vs U
y = 0.1818x + 0.2357R² = 0.3043
0.0
0.1
0.2
0.3
0.4
0.5
0.6
0.7
0.8
0.0 0.5 1.0 1.5 2.0 2.5
TH vs U
y = 0.2308x + 0.109R² = 0.779
0.0
0.1
0.2
0.3
0.4
0.5
0.6
0.7
0.0 0.5 1.0 1.5 2.0 2.5
UPU vs U