february 2015 manhattan beach real estate market trends update
TRANSCRIPT
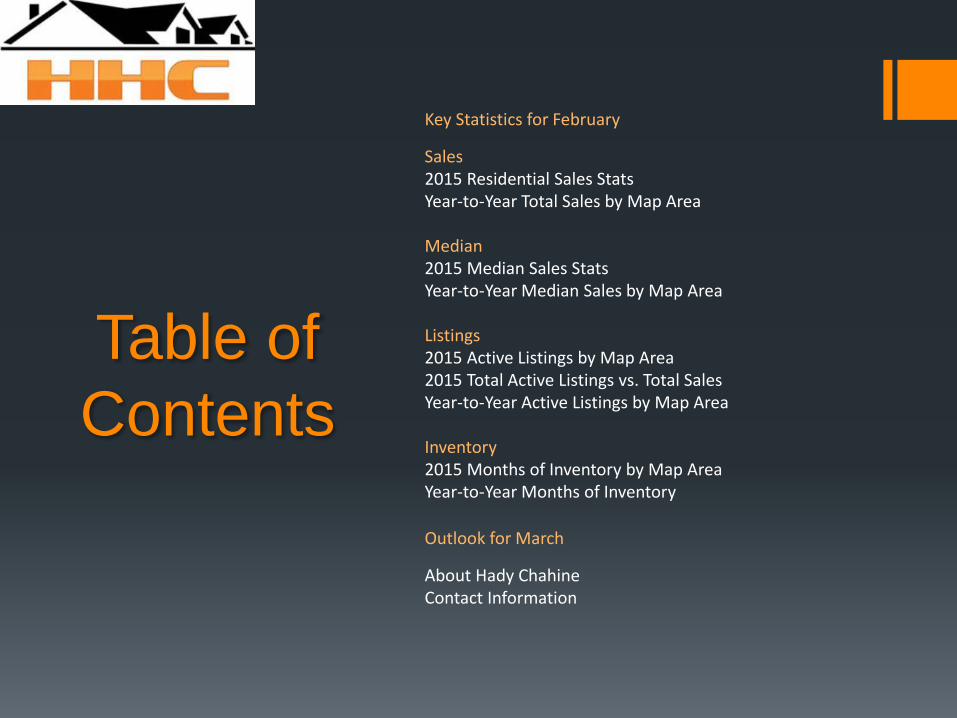
Table of
Contents
Key Statistics for February
Sales 2015 Residential Sales Stats Year-to-Year Total Sales by Map Area Median 2015 Median Sales Stats Year-to-Year Median Sales by Map Area Listings 2015 Active Listings by Map Area 2015 Total Active Listings vs. Total Sales Year-to-Year Active Listings by Map Area Inventory 2015 Months of Inventory by Map Area Year-to-Year Months of Inventory
Outlook for March
About Hady Chahine Contact Information
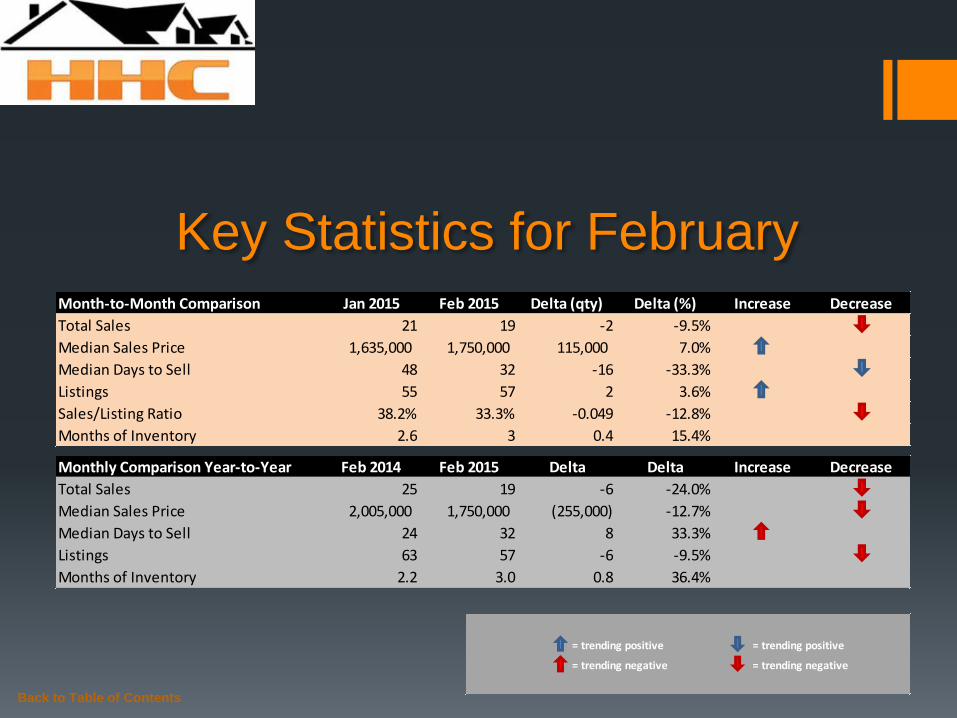
Key Statistics for February
Back to Table of Contents
= trending positive = trending positive
= trending negative = trending negative
Month-to-Month Comparison Jan 2015 Feb 2015 Delta (qty) Delta (%) Increase Decrease
Total Sales 21 19 -2 -9.5%
Median Sales Price 1,635,000 1,750,000 115,000 7.0%
Median Days to Sell 48 32 -16 -33.3%
Listings 55 57 2 3.6%
Sales/Listing Ratio 38.2% 33.3% -0.049 -12.8%
Months of Inventory 2.6 3 0.4 15.4%
Monthly Comparison Year-to-Year Feb 2014 Feb 2015 Delta Delta Increase Decrease
Total Sales 25 19 -6 -24.0%
Median Sales Price 2,005,000 1,750,000 (255,000) -12.7%
Median Days to Sell 24 32 8 33.3%
Listings 63 57 -6 -9.5%
Months of Inventory 2.2 3.0 0.8 36.4%

Back to Table of Contents
0
5
10
15
20
25
Jan Feb Mar
2015 Total Sales Month-to-Month by Map Area
Manhattan Bch Sand
Manhattan Bch Tree
Manhattan Bch Hill
Manhattan Village
Manhattan Bch Heights/Lib Vlg
Manhattan Bch Mira Costa
Total Sales
Total Sales Month-to-Month by Map Area Jan Feb Mar
Manhattan Bch Sand 6 3
Manhattan Bch Tree 1 6
Manhattan Bch Hill 3 2
Manhattan Village 3 2
Manhattan Bch Heights/Lib Vlg 2 3
Manhattan Bch Mira Costa 6 3
Total Sales 21 19
Back to Table of Contents
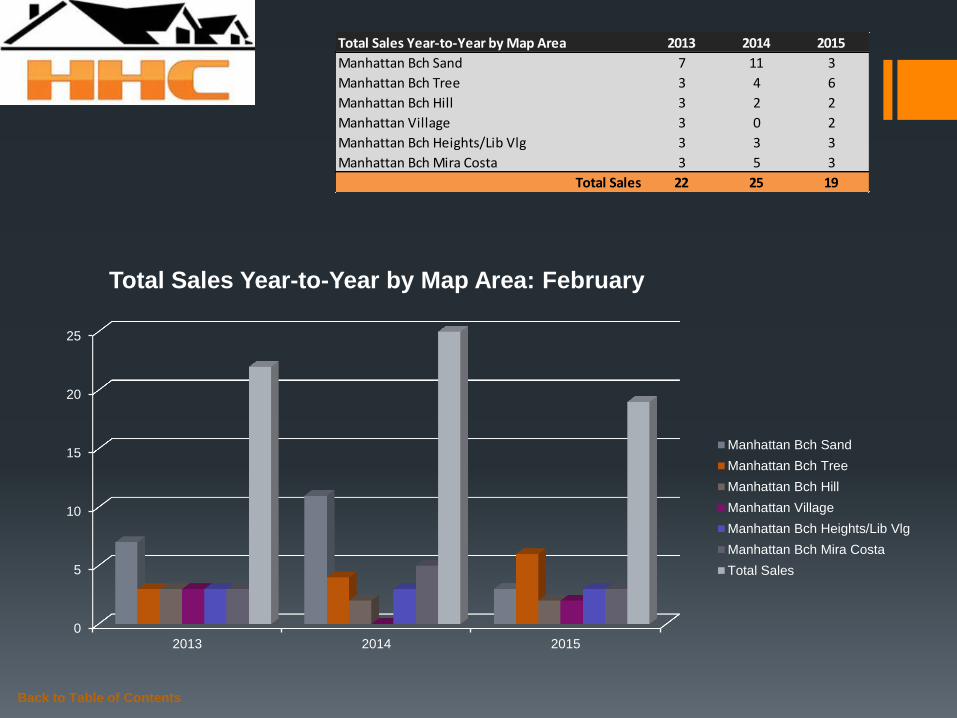
Total Sales Year-to-Year by Map Area 2013 2014 2015
Manhattan Bch Sand 7 11 3
Manhattan Bch Tree 3 4 6
Manhattan Bch Hill 3 2 2
Manhattan Village 3 0 2
Manhattan Bch Heights/Lib Vlg 3 3 3
Manhattan Bch Mira Costa 3 5 3
Total Sales 22 25 19
0
5
10
15
20
25
2013 2014 2015
Total Sales Year-to-Year by Map Area: February
Manhattan Bch Sand
Manhattan Bch Tree
Manhattan Bch Hill
Manhattan Village
Manhattan Bch Heights/Lib Vlg
Manhattan Bch Mira Costa
Total Sales

Back to Table of Contents
Median Sales Price Month-to-Month by Map Area Jan Feb Mar
Manhattan Bch Sand 1,577,500 2,826,000
Manhattan Bch Tree 2,400,000 2,360,000
Manhattan Bch Hill 3,500,000 2,525,000
Manhattan Village 1,260,000 855,000
Manhattan Bch Heights/Lib Vlg 908,125 1,291,875
Manhattan Bch Mira Costa 1,667,500 1,335,000
Market Median Sales Price 1,635,000 1,750,000
-
500,000
1,000,000
1,500,000
2,000,000
2,500,000
3,000,000
3,500,000
Jan Feb Mar
2015 Median Sales Price Month-to-Month by Map Area
Manhattan Bch Sand
Manhattan Bch Tree
Manhattan Bch Hill
Manhattan Village
Manhattan Bch Heights/Lib Vlg
Manhattan Bch Mira Costa
Market Median Sales Price
Back to Table of Contents
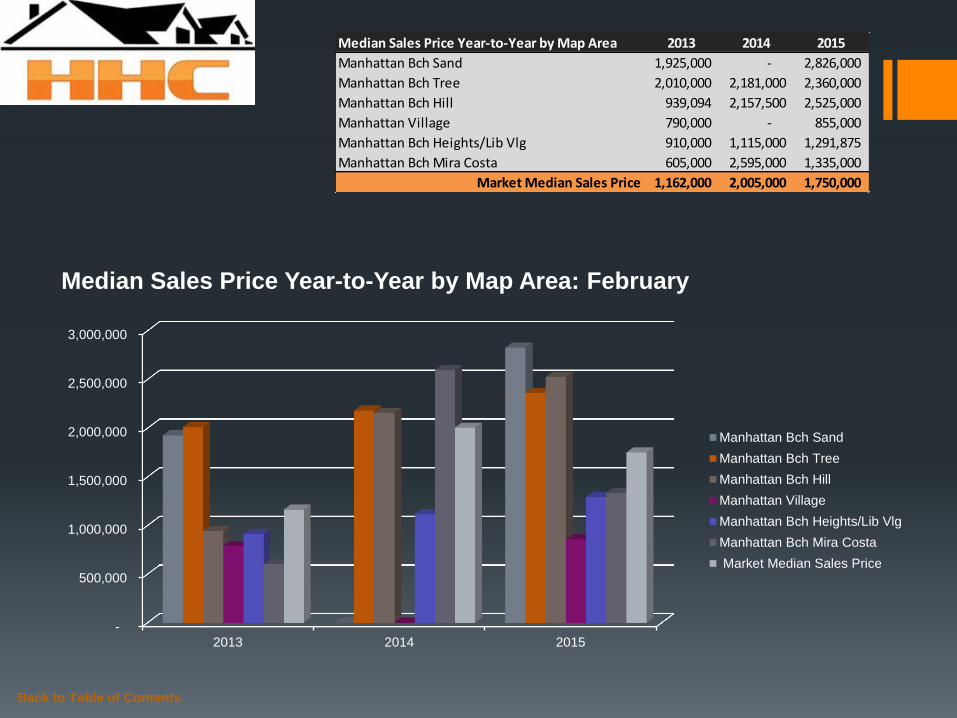
Median Sales Price Year-to-Year by Map Area 2013 2014 2015
Manhattan Bch Sand 1,925,000 - 2,826,000
Manhattan Bch Tree 2,010,000 2,181,000 2,360,000
Manhattan Bch Hill 939,094 2,157,500 2,525,000
Manhattan Village 790,000 - 855,000
Manhattan Bch Heights/Lib Vlg 910,000 1,115,000 1,291,875
Manhattan Bch Mira Costa 605,000 2,595,000 1,335,000
Market Median Sales Price 1,162,000 2,005,000 1,750,000
-
500,000
1,000,000
1,500,000
2,000,000
2,500,000
3,000,000
2013 2014 2015
Median Sales Price Year-to-Year by Map Area: February
Manhattan Bch Sand
Manhattan Bch Tree
Manhattan Bch Hill
Manhattan Village
Manhattan Bch Heights/Lib Vlg
Manhattan Bch Mira Costa
Market Median Sales Price

Back to Table of Contents
Active Listings vs. Total Sales by Map Area Jan Feb Mar Apr May Jun Jul Aug Sep Oct Nov Dec
Manhattan Bch Sand 14 19
Manhattan Bch Tree 16 14
Manhattan Bch Hill 2 3
Manhattan Village 6 5
Manhattan Bch Heights/Lib Vlg 4 5
Manhattan Bch Mira Costa 13 11
Total Active Listings 55 57
-
2
4
6
8
10
12
14
16
18
20
Jan Feb Mar Apr May Jun Jul Aug Sep Oct Nov Dec
2015 Active Listings by Map Area
Manhattan Bch Sand
Manhattan Bch Tree
Manhattan Bch Hill
Manhattan Village
Manhattan Bch Heights/Lib Vlg
Manhattan Bch Mira Costa
Back to Table of Contents
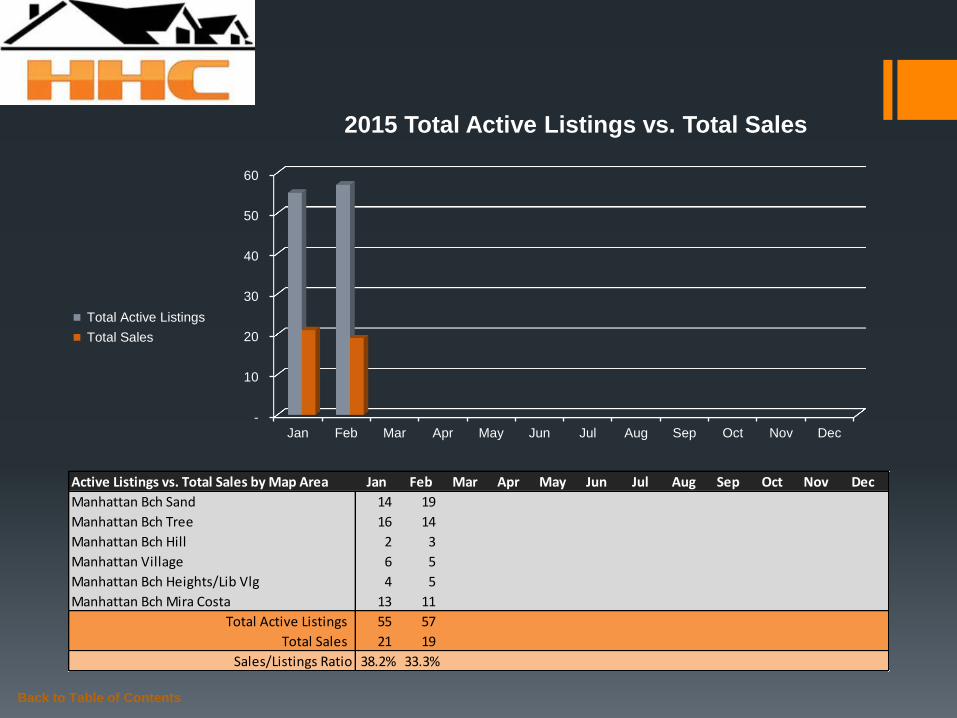
Active Listings vs. Total Sales by Map Area Jan Feb Mar Apr May Jun Jul Aug Sep Oct Nov Dec
Manhattan Bch Sand 14 19
Manhattan Bch Tree 16 14
Manhattan Bch Hill 2 3
Manhattan Village 6 5
Manhattan Bch Heights/Lib Vlg 4 5
Manhattan Bch Mira Costa 13 11
Total Active Listings 55 57
Total Sales 21 19
Sales/Listings Ratio 38.2% 33.3%
-
10
20
30
40
50
60
Jan Feb Mar Apr May Jun Jul Aug Sep Oct Nov Dec
2015 Total Active Listings vs. Total Sales
Total Active Listings
Total Sales
Back to Table of Contents
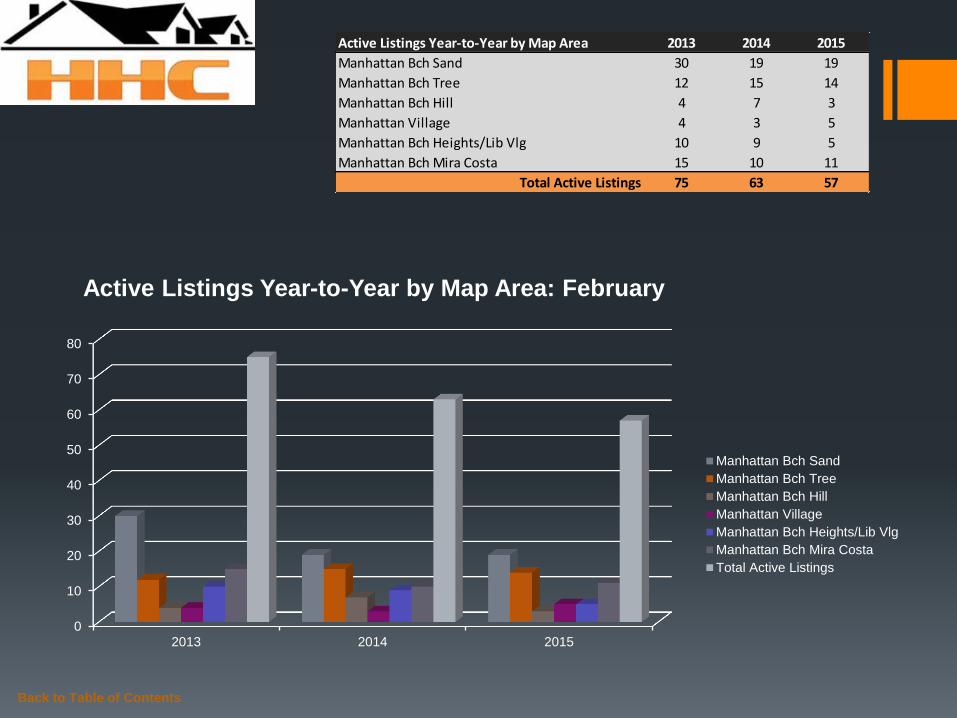
Active Listings Year-to-Year by Map Area 2013 2014 2015
Manhattan Bch Sand 30 19 19
Manhattan Bch Tree 12 15 14
Manhattan Bch Hill 4 7 3
Manhattan Village 4 3 5
Manhattan Bch Heights/Lib Vlg 10 9 5
Manhattan Bch Mira Costa 15 10 11
Total Active Listings 75 63 57
0
10
20
30
40
50
60
70
80
2013 2014 2015
Active Listings Year-to-Year by Map Area: February
Manhattan Bch Sand
Manhattan Bch Tree
Manhattan Bch Hill
Manhattan Village
Manhattan Bch Heights/Lib Vlg
Manhattan Bch Mira Costa
Total Active Listings
Back to Table of Contents
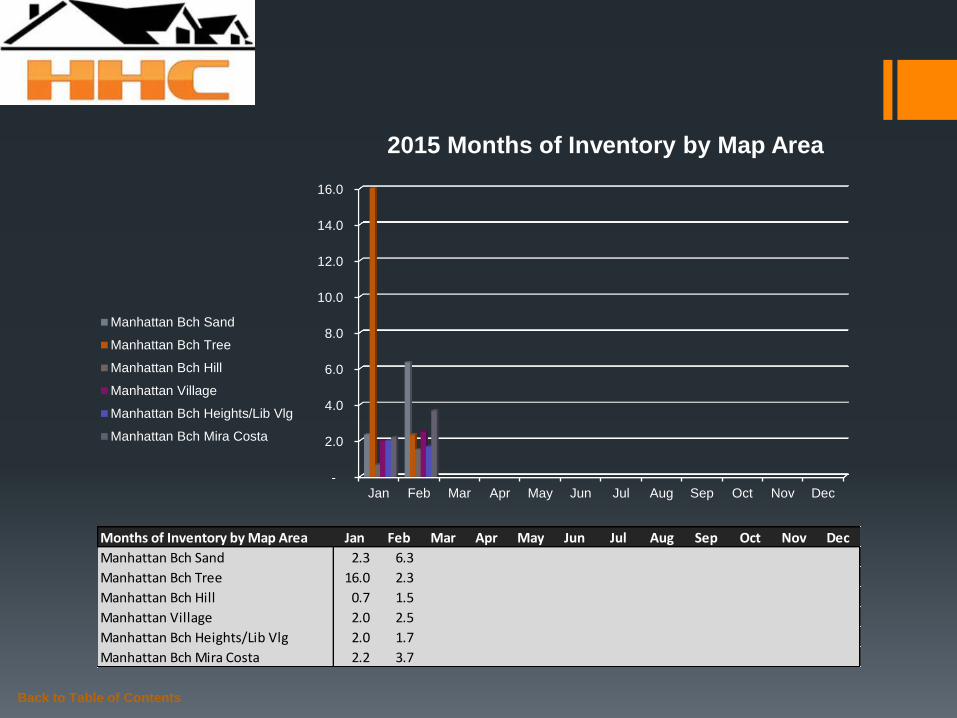
Months of Inventory by Map Area Jan Feb Mar Apr May Jun Jul Aug Sep Oct Nov Dec
Manhattan Bch Sand 2.3 6.3
Manhattan Bch Tree 16.0 2.3
Manhattan Bch Hill 0.7 1.5
Manhattan Village 2.0 2.5
Manhattan Bch Heights/Lib Vlg 2.0 1.7
Manhattan Bch Mira Costa 2.2 3.7
-
2.0
4.0
6.0
8.0
10.0
12.0
14.0
16.0
Jan Feb Mar Apr May Jun Jul Aug Sep Oct Nov Dec
2015 Months of Inventory by Map Area
Manhattan Bch Sand
Manhattan Bch Tree
Manhattan Bch Hill
Manhattan Village
Manhattan Bch Heights/Lib Vlg
Manhattan Bch Mira Costa
Back to Table of Contents
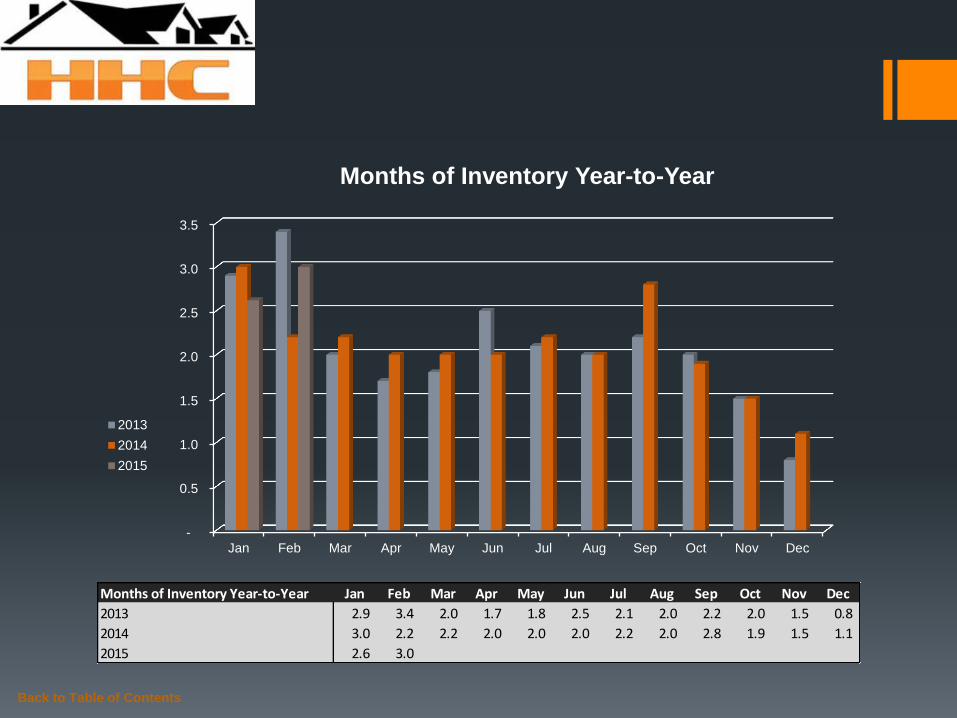
Months of Inventory Year-to-Year Jan Feb Mar Apr May Jun Jul Aug Sep Oct Nov Dec
2013 2.9 3.4 2.0 1.7 1.8 2.5 2.1 2.0 2.2 2.0 1.5 0.8
2014 3.0 2.2 2.2 2.0 2.0 2.0 2.2 2.0 2.8 1.9 1.5 1.1
2015 2.6 3.0
-
0.5
1.0
1.5
2.0
2.5
3.0
3.5
Jan Feb Mar Apr May Jun Jul Aug Sep Oct Nov Dec
Months of Inventory Year-to-Year
2013
2014
2015

Outlook for March
Real estate activity in Manhattan Beach for February 2015 proved encouraging as the highly-coveted
Pacific Ocean beach community posted 19 closed escrows, recorded a 7% increase in the market
median sales price, saw a 3.6% bump in active listings, and logged a 33.3% drop in the median days to
sell. Trending slightly off pace was the sales/listing ratio, which fell from 38.2% in January to 33.3% in
February, and a marginal rise in the months of inventory, which climbed from 2.6 in January to 3.0 in
February. Looking ahead (based on the trailing 6 months of MLS data) it is reasonable to assume this
healthy demand-supply relationship will continue, excluding unforeseen market influences of course.
To schedule a free consultation to discuss your real estate needs please contact me today! Real estate
is my passion. Let me share it with you!
Your recap…
Back to Table of Contents
Month-to-Month Comparison Jan 2015 Feb 2015 Delta (qty) Delta (%) Increase Decrease
Total Sales 21 19 -2 -9.5%
Median Sales Price 1,635,000 1,750,000 115,000 7.0%
Median Days to Sell 48 32 -16 -33.3%
Listings 55 57 2 3.6%
Sales/Listing Ratio 38.2% 33.3% -0.049 -12.8%
Months of Inventory 2.6 3 0.4 15.4%

Serving South Bay Home Buyers and Sellers Since 2001
RE/MAX Top 4 Team in California – 2012
RE/MAX 100% Club - 2011
Shorewood Realtors Top 5% in Overall Sales 2001-2006, 2008-2010
Back to Table of Contents
About
Hady Chahine…

The information being provided by CARETS (CLAW, CRISNet MLS, DAMLS, CRMLS, i-Tech MLS, and/or VCRDS) is for the visitor’s personal, non-commercial use and may not be used for
any purpose other than to identify prospective properties visitor may be interested in purchasing. Any information relating to a property referenced on this web site comes from the Internet
Data Exchange (IDX) program of CARETS. This web site may reference real estate listing(s) held by a brokerage firm other than the broker and/or agent who owns this web site. The accuracy
of all information, regardless of source, including but not limited to square footages and lot sizes, is deemed reliable but not guaranteed and should be personally verified through personal
inspection by and/or with the appropriate professionals.
Back to Table of Contents
Listings MLS BLOG Website