factors influencing grip strength testing in
TRANSCRIPT
22
CHAPTER 2
HAND ASSESSMENT INSTRUMENTS
When a person experiences a hand injury, an accurate assessment of the type and
extent of the injury can indicate the length of time to recovery and any residual
impairment and disability. Whilst a person undergoes treatment for their injury,
whether that treatment is pharmaceutical, surgical, or conservative therapies, the
consumer (the patient) and the service payee (the patient, or insurance company) will
want to know if the intervention is effective. This chapter will focus on assessment
methods commonly used by clinicians, especially Hand Therapists1 as baseline
assessments and as indicators of changes in hand function as a response to treatment.
1. PEN AND PAPER TESTS
There are many ways to assess an injury and measure the effects of intervention.
Typically, clinicians measure such aspects as range of motion, grip strength and
sensory function. However, these parameters do not directly measure hand function,
or the perception that a patient has of his or her own health. One indirect way to
measure function is to ask the patient to self-assess how they are progressing. This
approach is often not seen as objective, or accurate, as small improvements from day
to day may not be recognised by the patient. Also, this approach may be seen as open
to either over or under-exaggeration, either intentionally, or unintentionally. However,
the self-reporting of functional abilities has been shown to be reliable and valid when
standardised self-report questionnaires are given to patients. Over the last 30 years
many such questionnaires have been developed. Some are pathology-specific, others
are age, or culture specific. Specific tools are usually more sensitive to change, than
generic ones, but only a few have been developed for the upper limb.
1 Hand Therapists are either Occupational Therapists, or Physiotherapists who have acquired specialist skills in the treatment of pathology to the hand and upper limb.
23
One commonly used self-report questionnaire that has been developed for the upper
limb is the Disability of Arm Shoulder and Hand (DASH). It was developed
conjointly by the American Academy of Orthopaedic Surgeons, the Council of
Musculoskeletal Specialty Society, and the Institute of Work and Health in Toronto
(McConnell, Beaton & Bombardier, 1999). This 30-item questionnaire provides
information about how the patient perceives his or her symptoms and functional status
for activities of daily living, with four extra questions each specifically for
sports/performing arts and work. Although it is not pathology-specific, it has been
shown to be valid and reliable for measuring functional changes in various upper limb
conditions, and has been promoted as being able to compare functional outcomes
across upper limb pathologies (Beaton, Katz, Fossel, Wright, Tarasuk & Bombardier,
2001). Since its introduction in 1997 it has been translated and adapted for many
language and cultural groups, one of the most recent being an adaptation into French-
Canadian (Durand, Vachon, Hong & Loisel, 2005).
Upper limb joint-specific questionnaires include such examples as the Patient-Rated
Wrist Evaluation (PRWE). This is also a short, self-assessment questionnaire. It has
been shown to be sensitive to improvements in patients with distal radial fractures
over a one-year follow-up period (MacDermid, Richards & Roth, 2001). Clinicians
are encouraged to use such assessment tools for comparing the abilities of a patient
over time and for comparisons with average scores for other similarly diagnosed
patients over the same recovery stages. It is believed that “baseline patient scores are
the most influential predictors of final status” (MacDermid et al., 2001).
MacDermid et al. (2001) assessed and followed 250 patients with distal radial
fractures for one year post-trauma. They used a number of assessment tools, including
active range of motion (ROM), the DASH, the PRWE and grip strength scores. When
these indices were plotted over a year, the improvements in all four measures were
similar. Thus each of these tools resulted in an assessment with a certain degree of
overlap that could be used to validate the other tools.
24
2. TOOLS TO MEASURE SENSORY NERVES
A hand that cannot feel, or is slow to respond to painful stimuli, is not a hand that is
safe and efficient to use for everyday tasks (Brand & Hollister, 1999). Although
sensation is a vital function, in comparison to grip strength assessment tools, there are
only a few tools available to measure its integrity. The common sensory assessment
tools can be divided into two classes, functional and physiological.
Functional tests include all tests which require the patient to give an intentional
response, such as tests of vibration threshold, electrical current perception threshold
(the NeurometerTM by Neurotron, Baltimore), light touch, pin prick, one and two point
discrimination, Tinel’s tapping test, hot or cold perception thresholds and pressure
sense. Novak (2001) points out the difficulties with quality control and monitoring of
contact time and application of force with one and two point discrimination, light
touch tests such as the monofilament tests. With the exceptions of the NeurometerTM
and the monofilaments, the patient must be able to remember and compare the
stimulus on the normal hand with that presented to the injured hand. Thus most of
these tests assume unilateral neuropathology (Novak, 2001).
There are also functional tests that rely on the integration of various aspects of
sensory abilities, such as timed pick-up tests that require the patient to pick up and
identify small items, with vision occluded. Brand and Hollister (1999) recommend the
approach of Omer, whereby the speed and accuracy of one hand is compared to that
of the other hand. However, if both hands have been injured, the quality of the
performance must be compared with normative data from healthy people.
Common physiological tests for sensory function are tests such as the sensory nerve
velocity condition test (sNVCT). The sNVCT is limited to assessing only the large
myelinated sensory nerve fibres in a measured section of a peripheral nerve.
Conduction velocities can be obtained without cortical input, and so can be taken
from unconscious patients and up to six hours after death. They are thus not
functional tests assessing the whole finger-tip to cortex integrity of the sensory
nerves. Heybeli, Kutluhan, Demirci, Kerman and Mumcu (2002) found no correlation
25
between improvements in nerve conduction and clinical outcome questionnaire scores
of carpal tunnel syndrome at 3 and 6 months post-surgical release, as compared to
preoperative values. Thus accurate and clinically useful sensory nerve testing is far
more difficult to achieve than that of grip strength unless clinicians wish to invest in
sophisticated tools such as the NeurometerTM.
3. MEDICO-LEGAL IMPLICATIONS OF LOSS OF HAND
FUNCTION, AS REFLECTED IN LOSS OF GRIP STRENGTH,
ACCORDING TO VARIOUS AUTHORITIES
AMA Guides
The authors of The Guides to the Evaluation of Permanent Impairment (American
Medical Association, 2000) consider that grip strength tests are influenced by factors
that are difficult to control, such as fatigue, handedness, time of day, age, nutritional
state, pain, and the individual’s cooperation. Accordingly, the Guides main
weightings are based on “anatomical impairment”. The authors state “increased
strength does not necessarily equate with increased function” (p. 507). However, the
Guides do allow for an examiner to rate the loss of strength separately if the loss of
strength represents an impairing factor that has not been considered adequately by
other methods in the Guides. For example, if there is a loss of strength due to a severe
muscle tear that has healed leaving a palpable muscle defect, the examiner can rate
the loss of strength separately in an arm that has other impairments, such as a joint
range of motion limitation. When maximal force cannot be generated due to pain,
neuromuscular conditions, or amputations etc., these other factors must be rated in
preference to the strength loss.
These Guides are currently used by many legal and insurance companies in Australia
as a means of assessing upper limb impairment (Le Leu & Shanahan, 1994; Streeton,
1994). The authors of the Guides consider that “maximal strength is usually not
regained for at least a year after an injury or surgical procedure” (p. 508). Thus they
recommend taking measurements over a “period of time”. The authors consider that
pinch and grip strengths are used to “evaluate power weakness relating to the
26
structures of the hand, wrist, or forearm. Manual muscle testing of major muscle
groups is used for testing about the elbow and shoulder” (p. 508). However, many
other authorities consider grip strength to be a good general reflection of upper limb
strength (Bohannon, 1991; Innes, 1999) or whole body strength (Kerr, Syddall,
Cooper, Turner, Briggs & Sayer, 2006).
The Guides authors consider that there is insufficient evidence to consider dominance
in the impairment ratings, but at the same time they present grip strength norms for
use with bilateral injuries, including separate averages for the “major” and “minor”
hands, as reproduced from Swanson, Matev and de Groot (1970). In the chapter on
the principles of assessment it is stated that for some people hand dominance can have
a major impact on activities of daily living (p. 435).
Queensland injury settlement groups
In assessing common law claims for general damages in Queensland, Newton (2005)
quoted the Civil Liability Act (2003) section 61 as dictating that the injury scale value
(ISV) system should be used. The ISV is a 100-point scale from 0 to 100 and relates
directly to a dollar value awarded for compensation. Thus an ISV of 35 to 40 equates
to $56,000 to $68,000 and it is capped at $250,000. The ISV is calculated according
to schedule 4 of the Civil Liability Act and is based heavily on the AMA Guides (5th
edition). An ISV of not more than 10 is considered appropriate if there is a ‘whole
person impairment’ of 8% caused by soft tissue injury for which there is no
radiological evidence. This ‘whole person impairment’ is calculated from the Guides.
Veteran Affairs
The Department of Veteran Affairs has its own guides for evaluating permanent
impairment. Their personnel use the Guides to Assessment of Degree of Permanent
Impairment for Comcare, which is taken from the Safety, Rehabilitation and
Compensation Act of the Comcare Act of 1988 (SRC8 of 1988). They may also use
the other Guides.
27
SUMMARY
As can be seem from the above discussion, measuring grip strength is considered to
be an important part of any injury assessment and outcome measure. Grip strength
testing tools have advanced to sophisticated isokinetic tools. The next part of this
chapter presents the design, advancement and utilisation of these grip strength
assessment tools.
4. HISTORY OF GRIP STRENGTH TOOLS
The history of the evolution of strength assessment tools reflects the history of the
professions that have developed and used them (Davis, 1978). The chronology of their
development also describes the direction and the problems encountered with their
adaptations, some of which are still pertinent. There has been variation in the rationale
for comparing the strength of a person from time to time, and in the motivations for
comparing one person to another. These have ranged from the monitoring of health
status (Kellogg, 1893), assessing the impact of an injury (Geckler, 1939), identifying
‘superior human breeding stock’ (Galton, 1907), to assessing the effects of
electrotherapy (Cheing & Luk, 2005; Hammond, 1868), and to pure ego (Horne &
Talbot, 2002).
William A. Hammond MD, wanted to elevate the status of neurologists above that of
general practitioners, partly by the use of “sophisticated tools” such as the handgrip
dynamometer and dynamograph (Hammond, 1876). The people who invented the
machines were often the people who used them, such as Dr. John Harvey Kellogg, Dr.
William Hammond and Sir Francis Galton.
There is scant information about early strength assessment tools. Much of the ancient
writings have been lost during wars in which libraries have been destroyed, such as
the library in Alexandria, which at its peak around 330 B.C. is said to have possessed
over 750,000 papyrus scrolls (Parsons, 1952). Thus, as far as can be determined, the
first information pertaining to instruments that measure upper limb strength appeared
in 1699 A.D. It was then that the Frenchman De La Hire produced the first scientific
28
study of muscle strength. Upper limb strength was measured by the ability to lift loads
of known weights (Evans, 1981; Hunsicker & Donnelly, 1955). This method was
impractical for field researchers as the loads were too heavy to take on data-gathering
expeditions. In the early 1700s there was growing anthropological curiosity about
strength differences between the genders and between different racial groups, as
English and European explorers discovered the occupants of distant lands (Pearn,
1978a, 1978b). Anthropologists (or naturalists) became interested in measuring
strength with tools that were portable and accurate.
EARLY DYNAMOMETERS
At the beginning of the 18th century, a Frenchman at Oxford University named John
Theophilus Desaguliers had a “great interest in the physics of human muscle action,
[thus]… he designed the dynamometer, which bears his name” (Pearn, 1978b, ¶ 8).
The device was only a slight modification of one made a few years earlier by George
Graham, the clock maker. There are no records of the exact construction of the one
made by Graham. The dynamometer Desaguilers produced in 1763 was named the
Graham-Desaguliers dynamometer to recognise the contribution of Graham (as cited
in Pearn, 1978b).
Desaguliers was the first to establish a standard position for muscle testing, which in
turn made quantitative dynamometry possible. He established that there was
variability in the strength of individual muscles from person to person even though
their physical appearance was comparable.
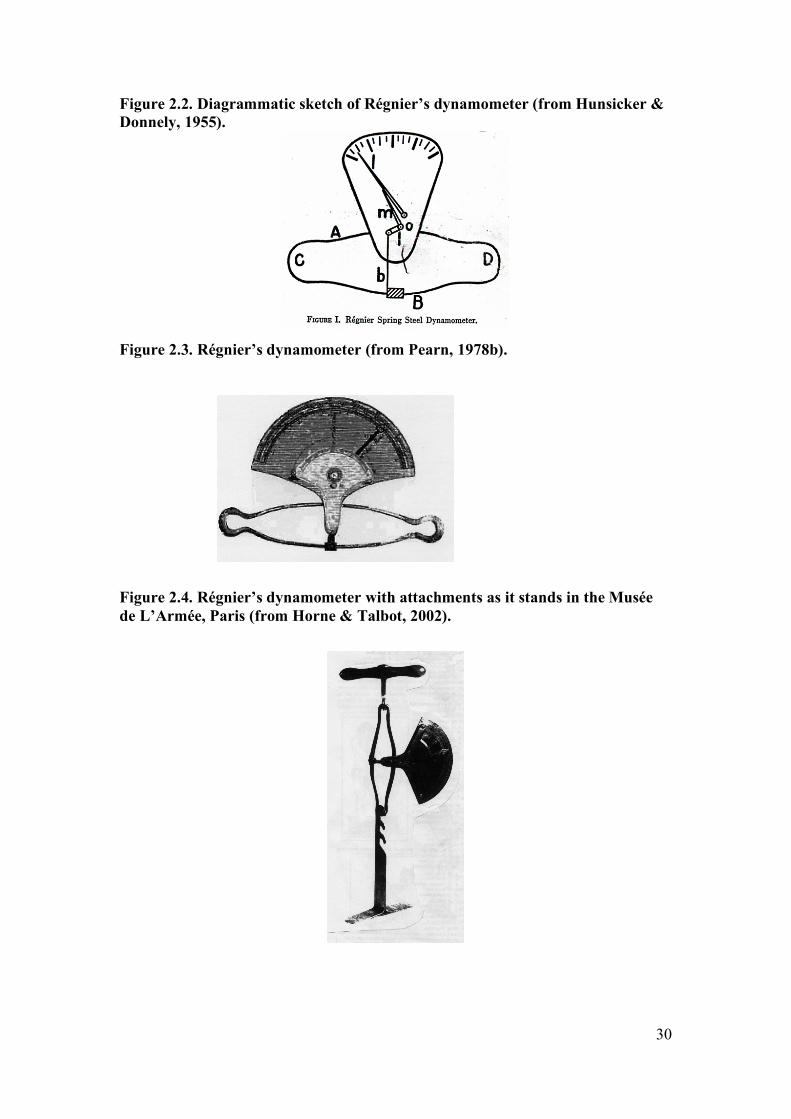
In 1798 Régnier (a Parisian mechanical engineer) described a dynamometer invented
by Leroy, circa 1790. This dynamometer was able to test the strength of individual
fingers or a hand as described in Horne & Talbot (2002, ¶ 2):
It consisted of a metal tube, ten to twelve inches long, which stood on a base.
Inside the tube was a spring and surmounting this, a rod with a scale, which
was graded for difficulty. At the top of this rod was a small globe/plunger,

29
which could be pressed with resistance by a finger or hand, and the strength
was indicated by the level that could be read on the scale.
In 1798 Régnier wrote that the French anthropologists Buffon and Gueneau of
Montbelliard wanted to compare the strength of men across a number of muscle
groups. They thought that the dynamometer made by Graham was “too large and too
heavy to be carried” and that which was made by Leroy was considered to be too
specific (as cited in Pearn, 1978b, ¶13). They thus commissioned Régnier to invent a
multi-purpose dynamometer, but before it was completed they died in the French
revolution. The physician Coulomb, who encouraged Régnier to continue work on his
design, wanted the instrument to measure a large range of forces, from human
strength to the pulling strength of bridled animals (see Figures 2.1, 2.2 and 2.3). The
mechanics of the dynamometer were described as “Distortion of a sprung steel bar,
which operated a pointer, the movement being magnified through a lever system”
(¶13). Various attachments were also designed (see Figure 2.4). Régnier was the first
person to give a medical reference to the use of dynamometers as being for measuring
“relative strength at the different stages of life, and in different states of health” (¶13).
Figure 2.1. The dynamometer invented by Edme Régnier in 1798 and used by Péron in his Australian experiments. From the original engraving accompanying Régnier’s work Description et usage du dynamomètre. S: position to test the muscular strength of the thighs; R: the handgrip position to test the force of the grasp (from Pearn, 1978a).
30
Figure 2.2. Diagrammatic sketch of Régnier’s dynamometer (from Hunsicker & Donnely, 1955).
Figure 2.3. Régnier’s dynamometer (from Pearn, 1978b).
Figure 2.4. Régnier’s dynamometer with attachments as it stands in the Musée de L’Armée, Paris (from Horne & Talbot, 2002).
31
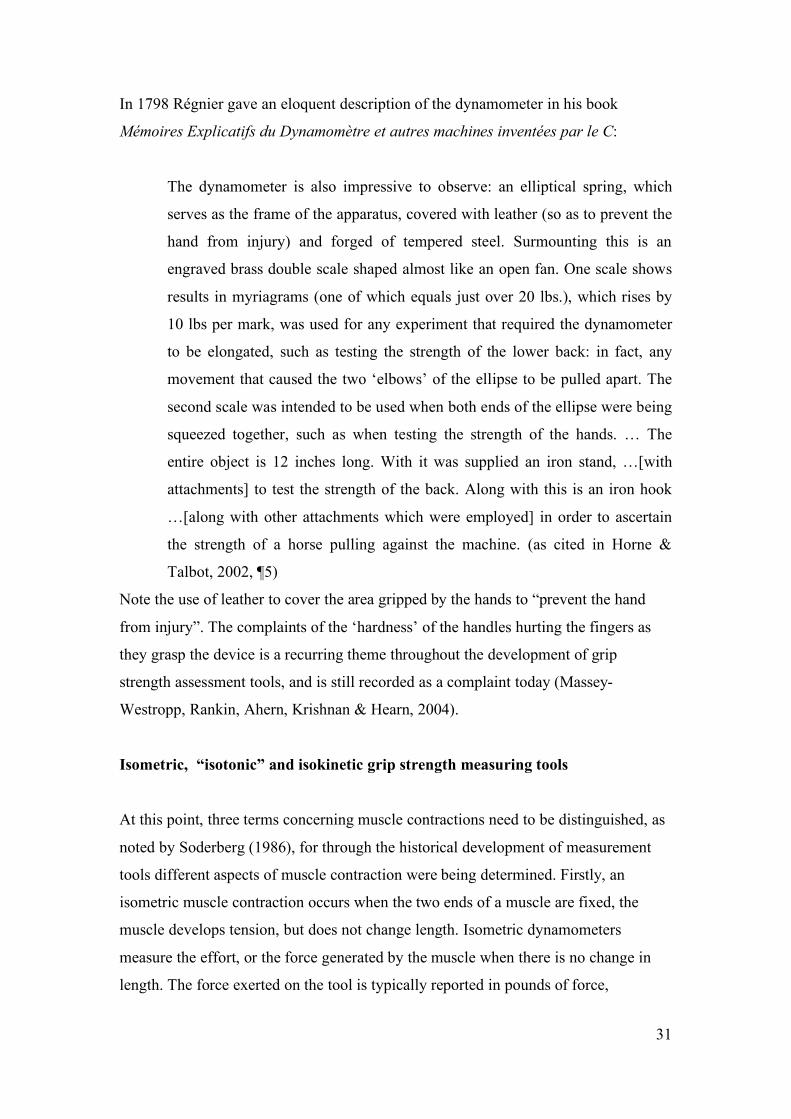
In 1798 Régnier gave an eloquent description of the dynamometer in his book
Mémoires Explicatifs du Dynamomètre et autres machines inventées par le C:
The dynamometer is also impressive to observe: an elliptical spring, which
serves as the frame of the apparatus, covered with leather (so as to prevent the
hand from injury) and forged of tempered steel. Surmounting this is an
engraved brass double scale shaped almost like an open fan. One scale shows
results in myriagrams (one of which equals just over 20 lbs.), which rises by
10 lbs per mark, was used for any experiment that required the dynamometer
to be elongated, such as testing the strength of the lower back: in fact, any
movement that caused the two ‘elbows’ of the ellipse to be pulled apart. The
second scale was intended to be used when both ends of the ellipse were being
squeezed together, such as when testing the strength of the hands. … The
entire object is 12 inches long. With it was supplied an iron stand, …[with
attachments] to test the strength of the back. Along with this is an iron hook
…[along with other attachments which were employed] in order to ascertain
the strength of a horse pulling against the machine. (as cited in Horne &
Talbot, 2002, ¶5)
Note the use of leather to cover the area gripped by the hands to “prevent the hand
from injury”. The complaints of the ‘hardness’ of the handles hurting the fingers as
they grasp the device is a recurring theme throughout the development of grip
strength assessment tools, and is still recorded as a complaint today (Massey-
Westropp, Rankin, Ahern, Krishnan & Hearn, 2004).
Isometric, “isotonic” and isokinetic grip strength measuring tools
At this point, three terms concerning muscle contractions need to be distinguished, as
noted by Soderberg (1986), for through the historical development of measurement
tools different aspects of muscle contraction were being determined. Firstly, an
isometric muscle contraction occurs when the two ends of a muscle are fixed, the
muscle develops tension, but does not change length. Isometric dynamometers
measure the effort, or the force generated by the muscle when there is no change in
length. The force exerted on the tool is typically reported in pounds of force,
32
kilogrammes of force, or more correctly Newtons. This force is also called ‘static
strength’.
Secondly, there are two types of isotonic contractions. Concentric isotonic
contractions occur when the muscle contracts, develops tension and then when this
tension exceeds the load (or the external counterforce) the muscle is able to shorten
and move the load, thereby performing work. Eccentric isotonic contractions occur
when the muscle is activated to contract, but then because the external load is greater
than the internal tension developed, the muscle lengthens whilst maintaining tension.
Because the muscle is shortening, or lengthening as it contracts, this type of strength
development is called ‘dynamic strength’.
Some tools have been developed that can measure the maximum load that a muscle
can move, or lift (using dynamic strength), for example, the Ergograph by Mosso
(Hunsicker & Donnelly, 1955). Other devices such as pneumatic (air-filled) and
hydraulic (liquid-filled) manometers, and spring-loaded resistive devices, have all
allowed the hand to contract around a yielding handpiece and have the muscles
shorten with effort against the measurement tool. The outcome measurements
produced from these devices are in essence a final maximum isometric force, or
effort, at a new final muscle length, peculiar to that device. These devices have often
incorrectly been labelled as isotonic measurement tools. There are no true isotonic
tools, because an isotonic contraction should be measured by muscle shortening, or
lengthening, not force. But the tools that are typically employed to measure weak
grip, are these soft, yielding, bulb-like devices that allow the hand to contract and the
flexors to shorten as much as pain and strength allow. There are components of static
and dynamic muscle activity in these measurements and changes in muscle length to
be considered, when appraising the nature of these measurement devices.
Because the early dynamometers measured the distortions to elliptical steel rods
through a lever system to magnify the distortion on a display dial, there would have
been some small isotonic component to the applied forces, but the force was
considered to be isometric. These ‘near isometric’ dynamometers, were used for many
years before true isometric (and later isokinetic) tools were invented.
33
Thirdly, there are isokinetic contractions, which literally mean “constant, or same
speed”. Thus an isokinetic device allows a muscle to perform at a constant velocity
whilst it is lengthening or shortening. Isokinetic muscle force is sometimes called
“dynamic muscle strength” (Dvir, 1997). It is “commonly measured using isokinetic
dynamometry and it refers to the torque-generation capacity of muscles during their
concentric (muscle shortening) or eccentric (muscle lengthening) contractions” (Dvir,
1999, ¶4). Isokinetic handgrip dynamometers measure effort against a two-piece
handle moving either together or apart from each other at a set speed. The hand
strength measurement tools measure concentric, or eccentric strength, of the finger
flexor muscles anywhere along the movement continuum of full finger flexion to full
finger extension. Their force units of measurement are usually displayed as Newtons,
or Newton/meters. These tools were not available until the late 20th century.
The first recorded comparative grip strength study
The first recorded comparative grip strength study between a number of racial groups
was conducted by the Frenchmen François Péron and Louis de Freycinet. In Australia
in the year 1800, they used the Régnier dynamometer to compare the strength of five
racial groups (Pearn, 1978a).
One hundred years later, the Régnier dynamometer was still in use for recording the
progress of strength training in athletes. In 1902 Professor Edmond Desbonnet, the
famous French physical culturist, trainer of strongmen and wrestlers, asked “Apollon”
(Louis Uni) to try the Régnier dynamometer. Apollon recorded a force of 153 Kg. He
refused to perform more than one trial; he complained that it hurt his hands (as cited
in Horne & Talbot, 2002).
Other dynamometers followed the design of that of Régnier. Amongst these were the
George Tiemann dynamometer (see Figure 2.5) from the 1800s and the Marine
Compass Company’s apparatus from circa 1910 (Horne & Talbot, 2002).
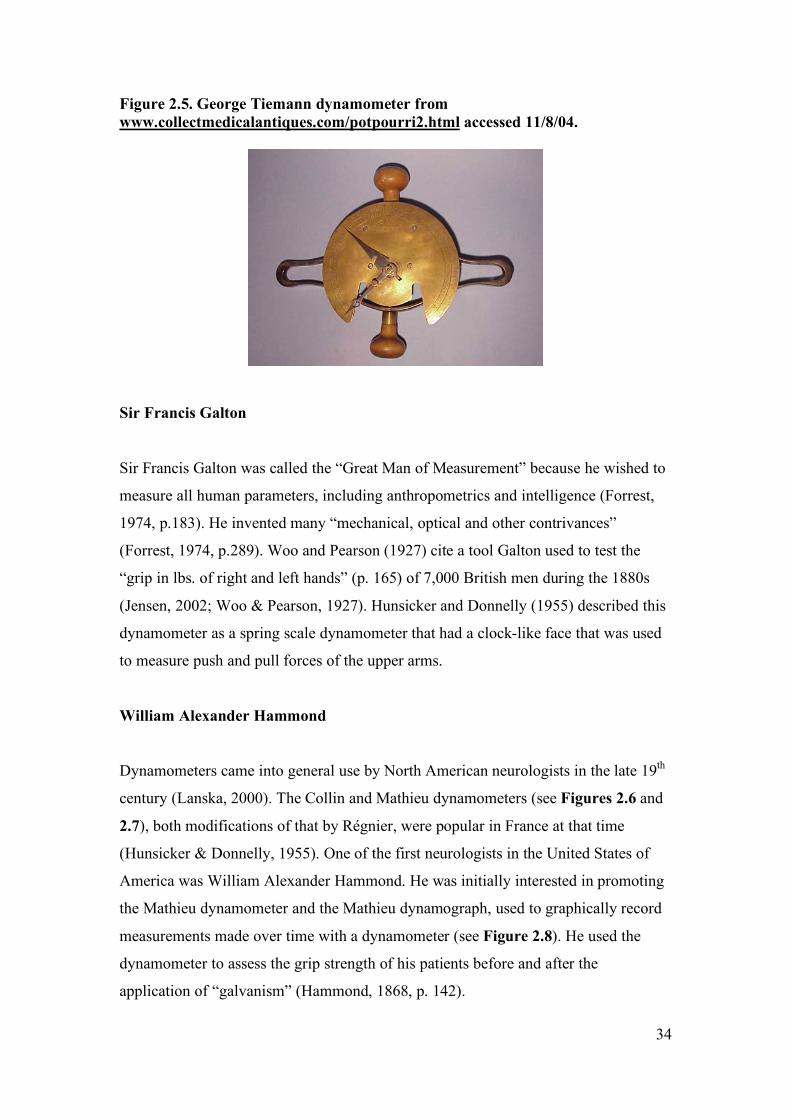
34
Figure 2.5. George Tiemann dynamometer from www.collectmedicalantiques.com/potpourri2.html accessed 11/8/04.
Sir Francis Galton
Sir Francis Galton was called the “Great Man of Measurement” because he wished to
measure all human parameters, including anthropometrics and intelligence (Forrest,
1974, p.183). He invented many “mechanical, optical and other contrivances”
(Forrest, 1974, p.289). Woo and Pearson (1927) cite a tool Galton used to test the
“grip in lbs. of right and left hands” (p. 165) of 7,000 British men during the 1880s
(Jensen, 2002; Woo & Pearson, 1927). Hunsicker and Donnelly (1955) described this
dynamometer as a spring scale dynamometer that had a clock-like face that was used
to measure push and pull forces of the upper arms.
William Alexander Hammond
Dynamometers came into general use by North American neurologists in the late 19th
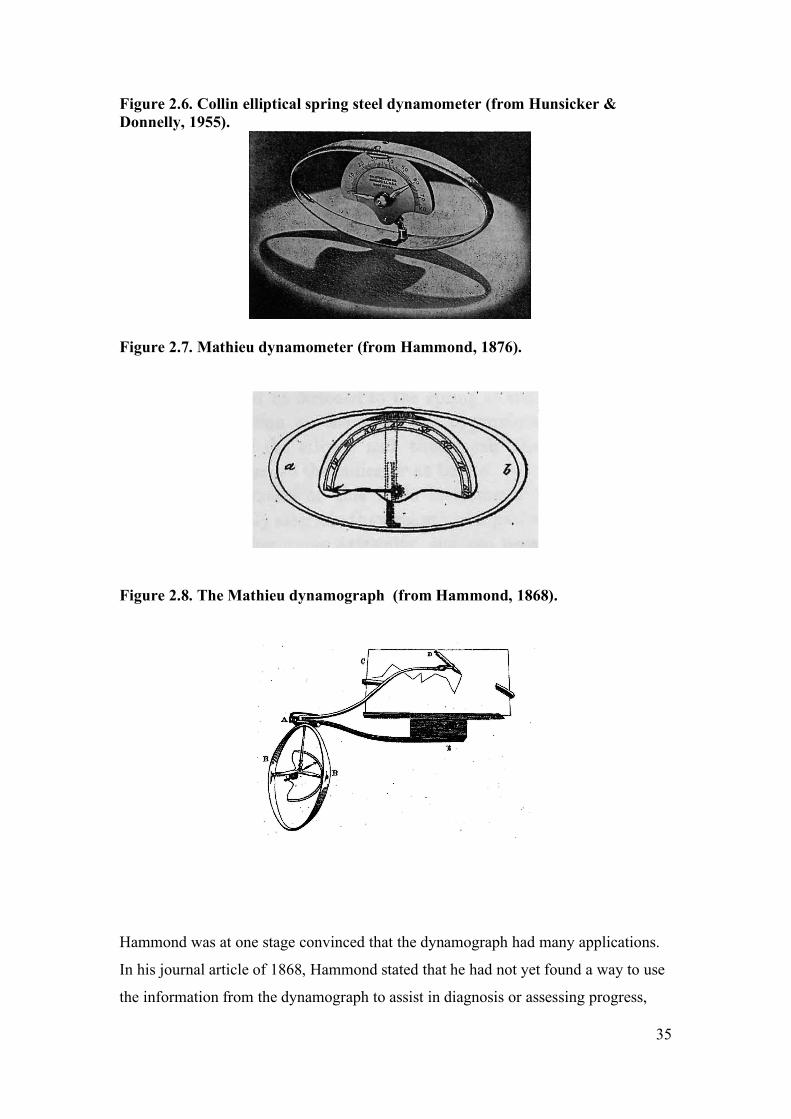
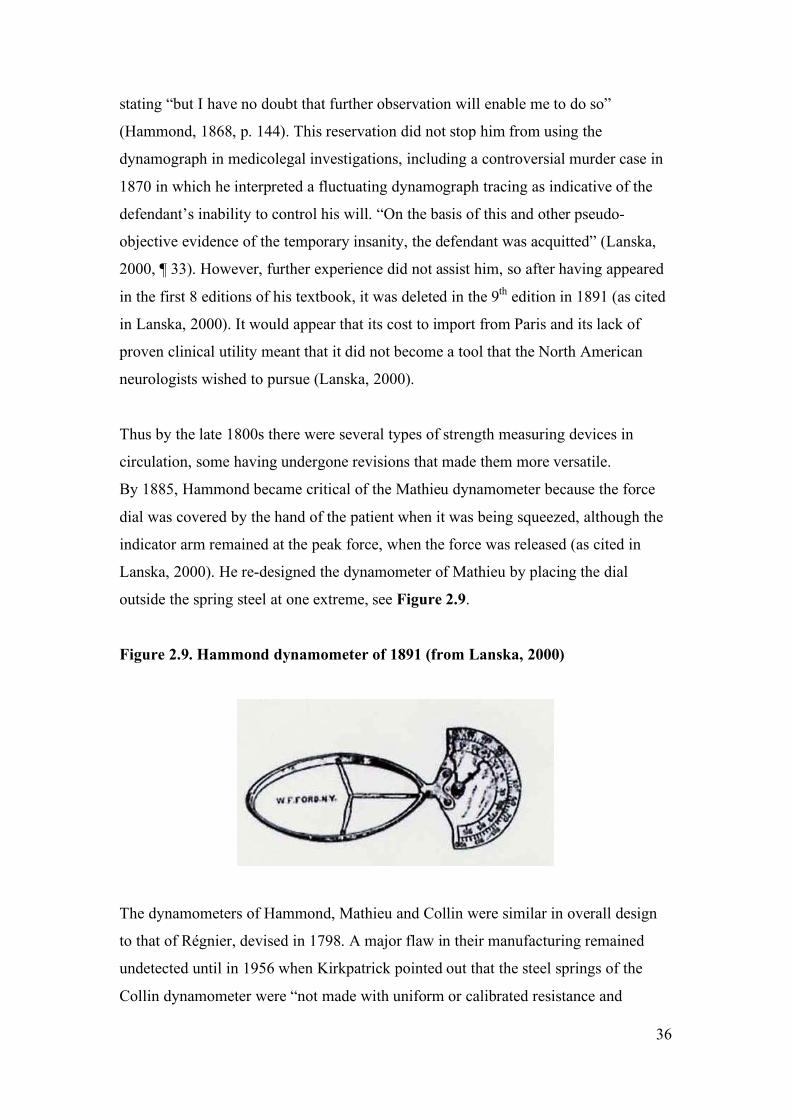
century (Lanska, 2000). The Collin and Mathieu dynamometers (see Figures 2.6 and
2.7), both modifications of that by Régnier, were popular in France at that time
(Hunsicker & Donnelly, 1955). One of the first neurologists in the United States of
America was William Alexander Hammond. He was initially interested in promoting
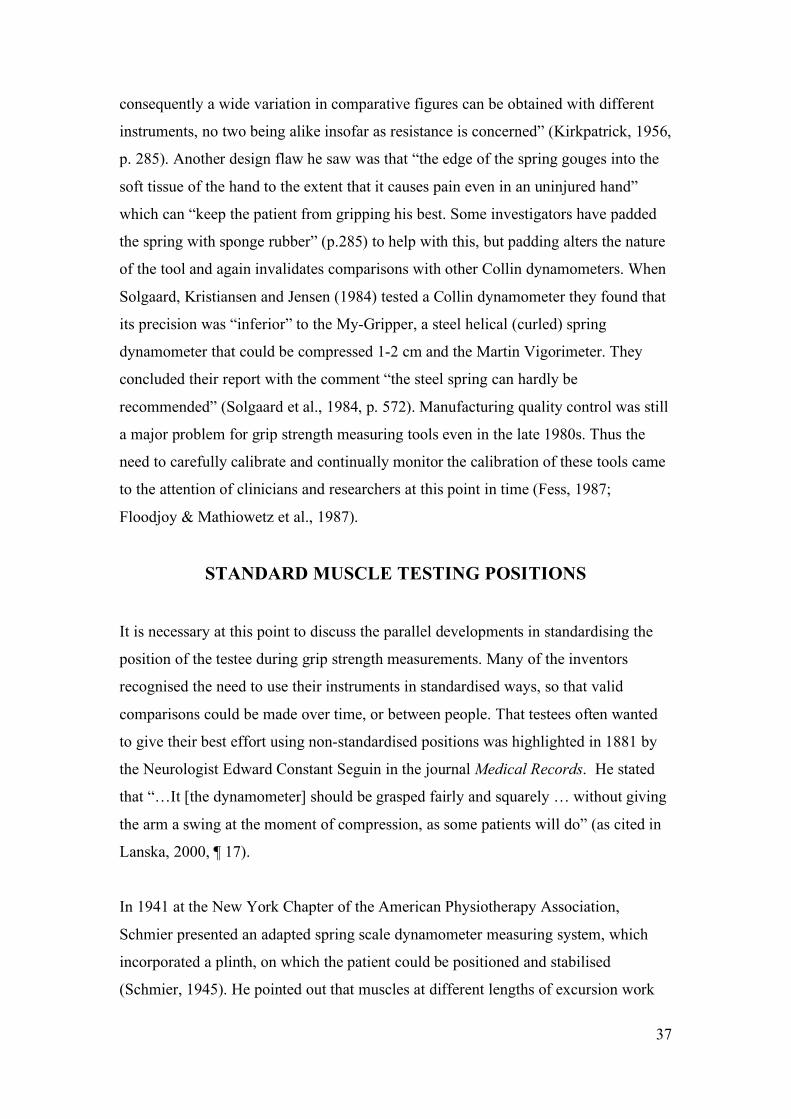
the Mathieu dynamometer and the Mathieu dynamograph, used to graphically record
measurements made over time with a dynamometer (see Figure 2.8). He used the
dynamometer to assess the grip strength of his patients before and after the
application of “galvanism” (Hammond, 1868, p. 142).
35
Figure 2.6. Collin elliptical spring steel dynamometer (from Hunsicker & Donnelly, 1955).
Figure 2.7. Mathieu dynamometer (from Hammond, 1876).
Figure 2.8. The Mathieu dynamograph (from Hammond, 1868).
Hammond was at one stage convinced that the dynamograph had many applications.
In his journal article of 1868, Hammond stated that he had not yet found a way to use
the information from the dynamograph to assist in diagnosis or assessing progress,
36
stating “but I have no doubt that further observation will enable me to do so”
(Hammond, 1868, p. 144). This reservation did not stop him from using the
dynamograph in medicolegal investigations, including a controversial murder case in
1870 in which he interpreted a fluctuating dynamograph tracing as indicative of the
defendant’s inability to control his will. “On the basis of this and other pseudo-
objective evidence of the temporary insanity, the defendant was acquitted” (Lanska,
2000, ¶ 33). However, further experience did not assist him, so after having appeared
in the first 8 editions of his textbook, it was deleted in the 9th edition in 1891 (as cited
in Lanska, 2000). It would appear that its cost to import from Paris and its lack of
proven clinical utility meant that it did not become a tool that the North American
neurologists wished to pursue (Lanska, 2000).
Thus by the late 1800s there were several types of strength measuring devices in
circulation, some having undergone revisions that made them more versatile.
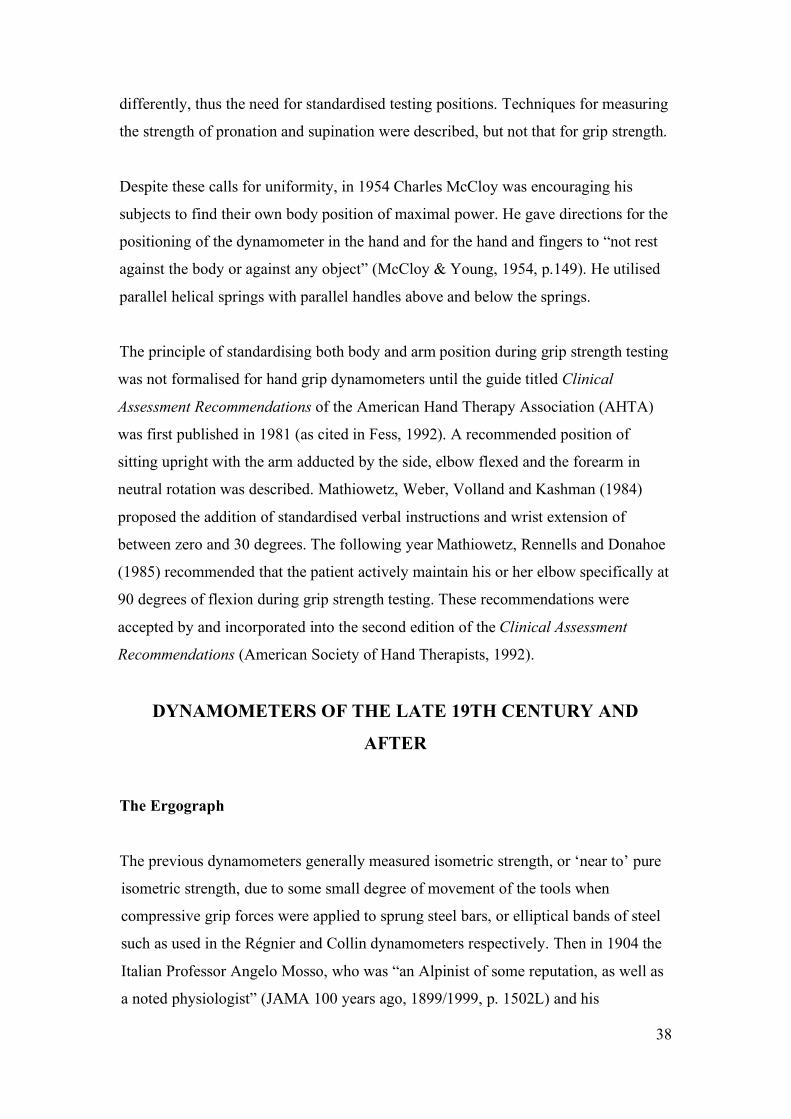
By 1885, Hammond became critical of the Mathieu dynamometer because the force
dial was covered by the hand of the patient when it was being squeezed, although the
indicator arm remained at the peak force, when the force was released (as cited in
Lanska, 2000). He re-designed the dynamometer of Mathieu by placing the dial
outside the spring steel at one extreme, see Figure 2.9.
Figure 2.9. Hammond dynamometer of 1891 (from Lanska, 2000)
The dynamometers of Hammond, Mathieu and Collin were similar in overall design
to that of Régnier, devised in 1798. A major flaw in their manufacturing remained
undetected until in 1956 when Kirkpatrick pointed out that the steel springs of the
Collin dynamometer were “not made with uniform or calibrated resistance and
37
consequently a wide variation in comparative figures can be obtained with different
instruments, no two being alike insofar as resistance is concerned” (Kirkpatrick, 1956,
p. 285). Another design flaw he saw was that “the edge of the spring gouges into the
soft tissue of the hand to the extent that it causes pain even in an uninjured hand”
which can “keep the patient from gripping his best. Some investigators have padded
the spring with sponge rubber” (p.285) to help with this, but padding alters the nature
of the tool and again invalidates comparisons with other Collin dynamometers. When
Solgaard, Kristiansen and Jensen (1984) tested a Collin dynamometer they found that
its precision was “inferior” to the My-Gripper, a steel helical (curled) spring
dynamometer that could be compressed 1-2 cm and the Martin Vigorimeter. They
concluded their report with the comment “the steel spring can hardly be
recommended” (Solgaard et al., 1984, p. 572). Manufacturing quality control was still
a major problem for grip strength measuring tools even in the late 1980s. Thus the
need to carefully calibrate and continually monitor the calibration of these tools came
to the attention of clinicians and researchers at this point in time (Fess, 1987;
Floodjoy & Mathiowetz et al., 1987).
STANDARD MUSCLE TESTING POSITIONS
It is necessary at this point to discuss the parallel developments in standardising the
position of the testee during grip strength measurements. Many of the inventors
recognised the need to use their instruments in standardised ways, so that valid
comparisons could be made over time, or between people. That testees often wanted
to give their best effort using non-standardised positions was highlighted in 1881 by
the Neurologist Edward Constant Seguin in the journal Medical Records. He stated
that “…It [the dynamometer] should be grasped fairly and squarely … without giving
the arm a swing at the moment of compression, as some patients will do” (as cited in
Lanska, 2000, ¶ 17).
In 1941 at the New York Chapter of the American Physiotherapy Association,
Schmier presented an adapted spring scale dynamometer measuring system, which
incorporated a plinth, on which the patient could be positioned and stabilised
(Schmier, 1945). He pointed out that muscles at different lengths of excursion work
38
differently, thus the need for standardised testing positions. Techniques for measuring
the strength of pronation and supination were described, but not that for grip strength.
Despite these calls for uniformity, in 1954 Charles McCloy was encouraging his
subjects to find their own body position of maximal power. He gave directions for the
positioning of the dynamometer in the hand and for the hand and fingers to “not rest
against the body or against any object” (McCloy & Young, 1954, p.149). He utilised
parallel helical springs with parallel handles above and below the springs.
The principle of standardising both body and arm position during grip strength testing
was not formalised for hand grip dynamometers until the guide titled Clinical
Assessment Recommendations of the American Hand Therapy Association (AHTA)
was first published in 1981 (as cited in Fess, 1992). A recommended position of
sitting upright with the arm adducted by the side, elbow flexed and the forearm in
neutral rotation was described. Mathiowetz, Weber, Volland and Kashman (1984)
proposed the addition of standardised verbal instructions and wrist extension of
between zero and 30 degrees. The following year Mathiowetz, Rennells and Donahoe
(1985) recommended that the patient actively maintain his or her elbow specifically at
90 degrees of flexion during grip strength testing. These recommendations were
accepted by and incorporated into the second edition of the Clinical Assessment
Recommendations (American Society of Hand Therapists, 1992).
DYNAMOMETERS OF THE LATE 19TH CENTURY AND
AFTER
The Ergograph
The previous dynamometers generally measured isometric strength, or ‘near to’ pure
isometric strength, due to some small degree of movement of the tools when
compressive grip forces were applied to sprung steel bars, or elliptical bands of steel
such as used in the Régnier and Collin dynamometers respectively. Then in 1904 the
Italian Professor Angelo Mosso, who was “an Alpinist of some reputation, as well as
a noted physiologist” (JAMA 100 years ago, 1899/1999, p. 1502L) and his
39
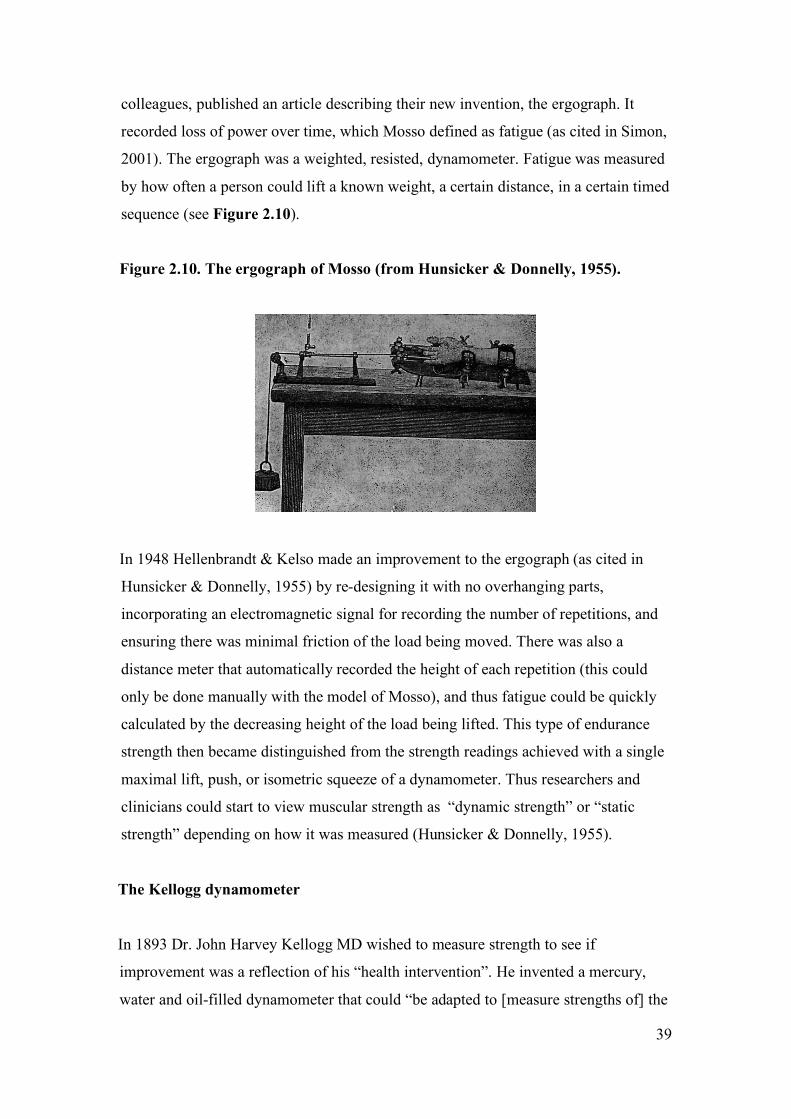
colleagues, published an article describing their new invention, the ergograph. It
recorded loss of power over time, which Mosso defined as fatigue (as cited in Simon,
2001). The ergograph was a weighted, resisted, dynamometer. Fatigue was measured
by how often a person could lift a known weight, a certain distance, in a certain timed
sequence (see Figure 2.10).
Figure 2.10. The ergograph of Mosso (from Hunsicker & Donnelly, 1955).
In 1948 Hellenbrandt & Kelso made an improvement to the ergograph (as cited in
Hunsicker & Donnelly, 1955) by re-designing it with no overhanging parts,
incorporating an electromagnetic signal for recording the number of repetitions, and
ensuring there was minimal friction of the load being moved. There was also a
distance meter that automatically recorded the height of each repetition (this could
only be done manually with the model of Mosso), and thus fatigue could be quickly
calculated by the decreasing height of the load being lifted. This type of endurance
strength then became distinguished from the strength readings achieved with a single
maximal lift, push, or isometric squeeze of a dynamometer. Thus researchers and
clinicians could start to view muscular strength as “dynamic strength” or “static
strength” depending on how it was measured (Hunsicker & Donnelly, 1955).
The Kellogg dynamometer
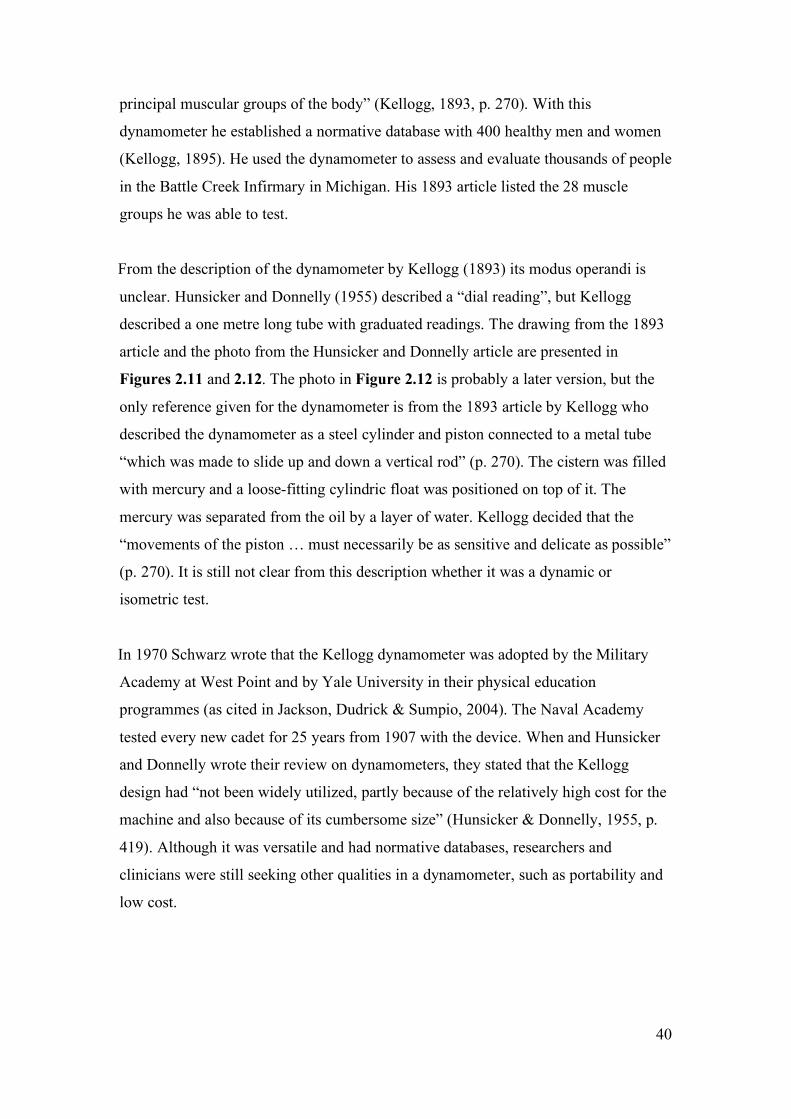
In 1893 Dr. John Harvey Kellogg MD wished to measure strength to see if
improvement was a reflection of his “health intervention”. He invented a mercury,
water and oil-filled dynamometer that could “be adapted to [measure strengths of] the
40
principal muscular groups of the body” (Kellogg, 1893, p. 270). With this
dynamometer he established a normative database with 400 healthy men and women
(Kellogg, 1895). He used the dynamometer to assess and evaluate thousands of people
in the Battle Creek Infirmary in Michigan. His 1893 article listed the 28 muscle
groups he was able to test.
From the description of the dynamometer by Kellogg (1893) its modus operandi is
unclear. Hunsicker and Donnelly (1955) described a “dial reading”, but Kellogg
described a one metre long tube with graduated readings. The drawing from the 1893
article and the photo from the Hunsicker and Donnelly article are presented in
Figures 2.11 and 2.12. The photo in Figure 2.12 is probably a later version, but the
only reference given for the dynamometer is from the 1893 article by Kellogg who
described the dynamometer as a steel cylinder and piston connected to a metal tube
“which was made to slide up and down a vertical rod” (p. 270). The cistern was filled
with mercury and a loose-fitting cylindric float was positioned on top of it. The
mercury was separated from the oil by a layer of water. Kellogg decided that the
“movements of the piston … must necessarily be as sensitive and delicate as possible”
(p. 270). It is still not clear from this description whether it was a dynamic or
isometric test.
In 1970 Schwarz wrote that the Kellogg dynamometer was adopted by the Military
Academy at West Point and by Yale University in their physical education
programmes (as cited in Jackson, Dudrick & Sumpio, 2004). The Naval Academy
tested every new cadet for 25 years from 1907 with the device. When and Hunsicker
and Donnelly wrote their review on dynamometers, they stated that the Kellogg
design had “not been widely utilized, partly because of the relatively high cost for the
machine and also because of its cumbersome size” (Hunsicker & Donnelly, 1955, p.
419). Although it was versatile and had normative databases, researchers and
clinicians were still seeking other qualities in a dynamometer, such as portability and
low cost.
41
Figure 2.11. Kellogg mercurial dynamometer (from Kellogg, 1893).
Figure 2.12. Kellogg mercurial dynamometer (from Hunsicker & Donnelly, 1955).
A dynamometer with adjustable handle size
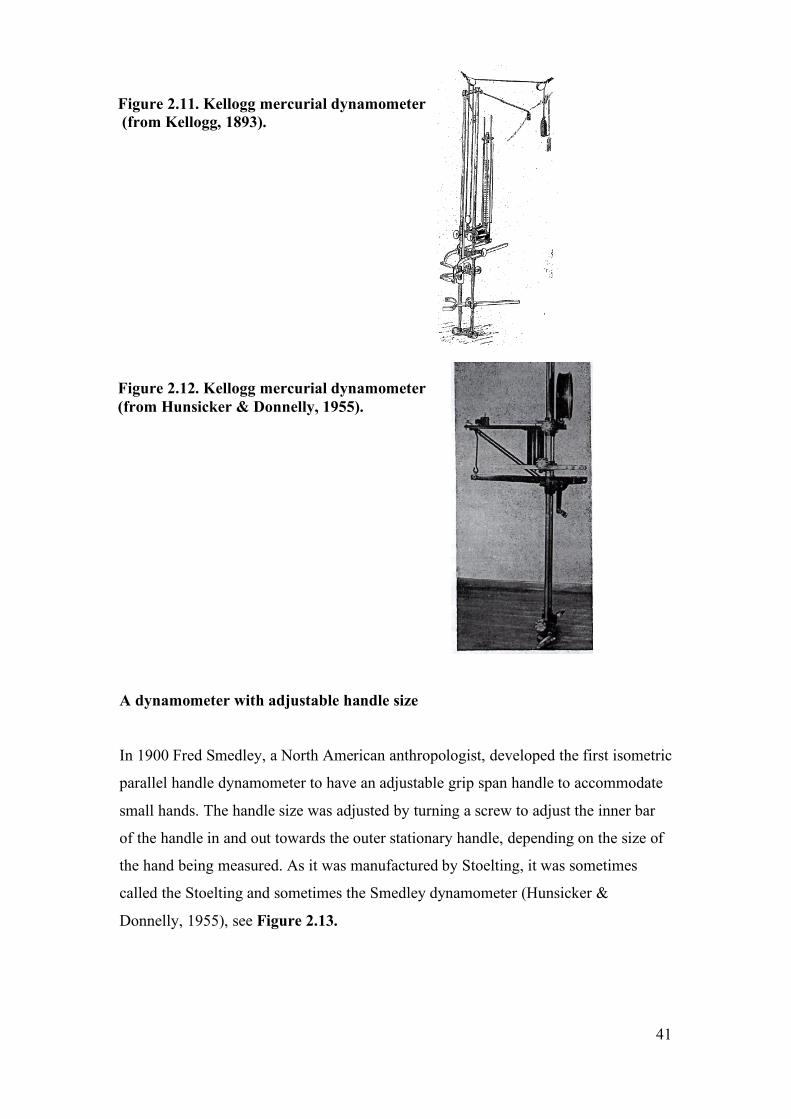
In 1900 Fred Smedley, a North American anthropologist, developed the first isometric
parallel handle dynamometer to have an adjustable grip span handle to accommodate
small hands. The handle size was adjusted by turning a screw to adjust the inner bar
of the handle in and out towards the outer stationary handle, depending on the size of
the hand being measured. As it was manufactured by Stoelting, it was sometimes
called the Stoelting and sometimes the Smedley dynamometer (Hunsicker &
Donnelly, 1955), see Figure 2.13.
42
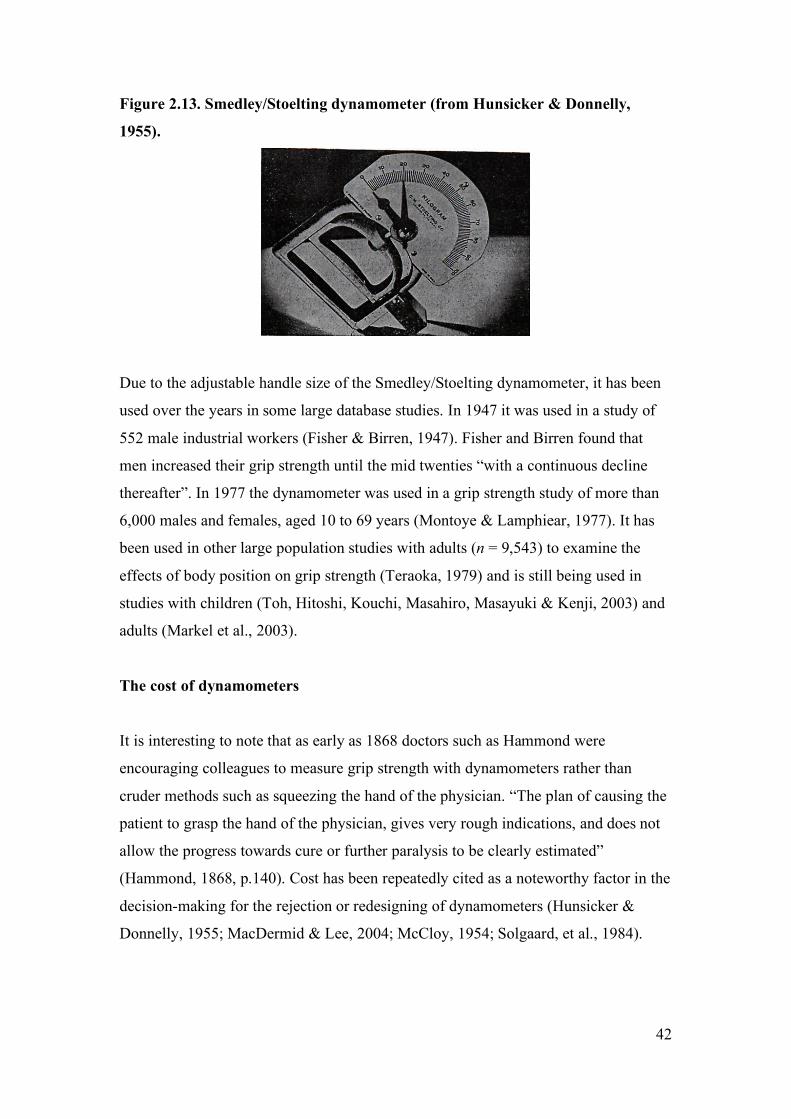
Figure 2.13. Smedley/Stoelting dynamometer (from Hunsicker & Donnelly,
1955).
Due to the adjustable handle size of the Smedley/Stoelting dynamometer, it has been
used over the years in some large database studies. In 1947 it was used in a study of
552 male industrial workers (Fisher & Birren, 1947). Fisher and Birren found that
men increased their grip strength until the mid twenties “with a continuous decline
thereafter”. In 1977 the dynamometer was used in a grip strength study of more than
6,000 males and females, aged 10 to 69 years (Montoye & Lamphiear, 1977). It has
been used in other large population studies with adults (n = 9,543) to examine the
effects of body position on grip strength (Teraoka, 1979) and is still being used in
studies with children (Toh, Hitoshi, Kouchi, Masahiro, Masayuki & Kenji, 2003) and
adults (Markel et al., 2003).
The cost of dynamometers
It is interesting to note that as early as 1868 doctors such as Hammond were
encouraging colleagues to measure grip strength with dynamometers rather than
cruder methods such as squeezing the hand of the physician. “The plan of causing the
patient to grasp the hand of the physician, gives very rough indications, and does not
allow the progress towards cure or further paralysis to be clearly estimated”
(Hammond, 1868, p.140). Cost has been repeatedly cited as a noteworthy factor in the
decision-making for the rejection or redesigning of dynamometers (Hunsicker &
Donnelly, 1955; MacDermid & Lee, 2004; McCloy, 1954; Solgaard, et al., 1984).
43
Testing weakened people
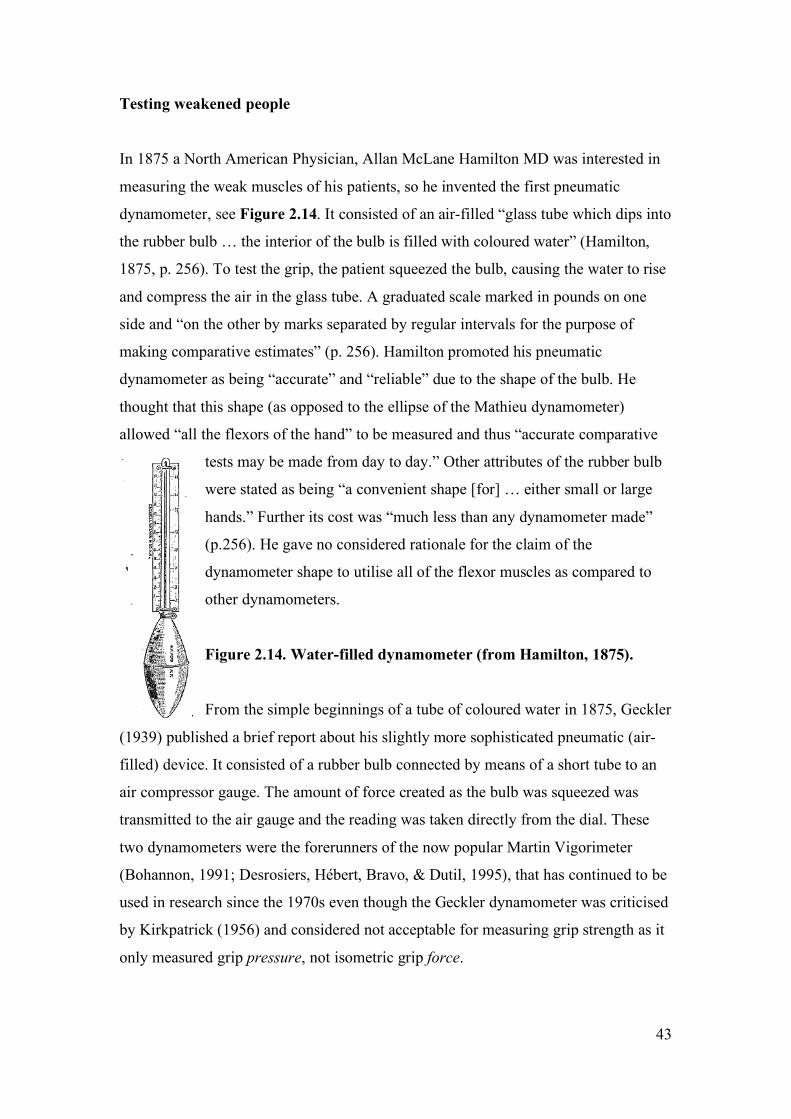
In 1875 a North American Physician, Allan McLane Hamilton MD was interested in
measuring the weak muscles of his patients, so he invented the first pneumatic
dynamometer, see Figure 2.14. It consisted of an air-filled “glass tube which dips into
the rubber bulb … the interior of the bulb is filled with coloured water” (Hamilton,
1875, p. 256). To test the grip, the patient squeezed the bulb, causing the water to rise
and compress the air in the glass tube. A graduated scale marked in pounds on one
side and “on the other by marks separated by regular intervals for the purpose of
making comparative estimates” (p. 256). Hamilton promoted his pneumatic
dynamometer as being “accurate” and “reliable” due to the shape of the bulb. He
thought that this shape (as opposed to the ellipse of the Mathieu dynamometer)
allowed “all the flexors of the hand” to be measured and thus “accurate comparative
tests may be made from day to day.” Other attributes of the rubber bulb
were stated as being “a convenient shape [for] … either small or large
hands.” Further its cost was “much less than any dynamometer made”
(p.256). He gave no considered rationale for the claim of the
dynamometer shape to utilise all of the flexor muscles as compared to
other dynamometers.
Figure 2.14. Water-filled dynamometer (from Hamilton, 1875).
From the simple beginnings of a tube of coloured water in 1875, Geckler
(1939) published a brief report about his slightly more sophisticated pneumatic (air-
filled) device. It consisted of a rubber bulb connected by means of a short tube to an
air compressor gauge. The amount of force created as the bulb was squeezed was
transmitted to the air gauge and the reading was taken directly from the dial. These
two dynamometers were the forerunners of the now popular Martin Vigorimeter
(Bohannon, 1991; Desrosiers, Hébert, Bravo, & Dutil, 1995), that has continued to be
used in research since the 1970s even though the Geckler dynamometer was criticised
by Kirkpatrick (1956) and considered not acceptable for measuring grip strength as it
only measured grip pressure, not isometric grip force.
44
The Martin Vigorimeter first appeared in it current form in a normative study
published by Thorngren and Werner in 1979. By 1983 Fraser and Benten declared the
Martin Vigorimeter to be “the most common type of instrument available in British
occupational therapy departments…” (p.296). The Martin Vigorimeter has continued
to be compared to other grip strength measuring tools (Desrosiers, Hébert et al., 1995)
and is still in use (Sheldon, 2003). Over the decades other alternative hand strength
measuring tools, such as the rolled sphygmomanometer cuff, have been promoted, but
they do not measure the same parameter with the same units of measurement and thus
comparisons between these instruments have not been possible (Desrosiers, Hébert et
al., 1995; Solgaard et al., 1984).
Tensiometers
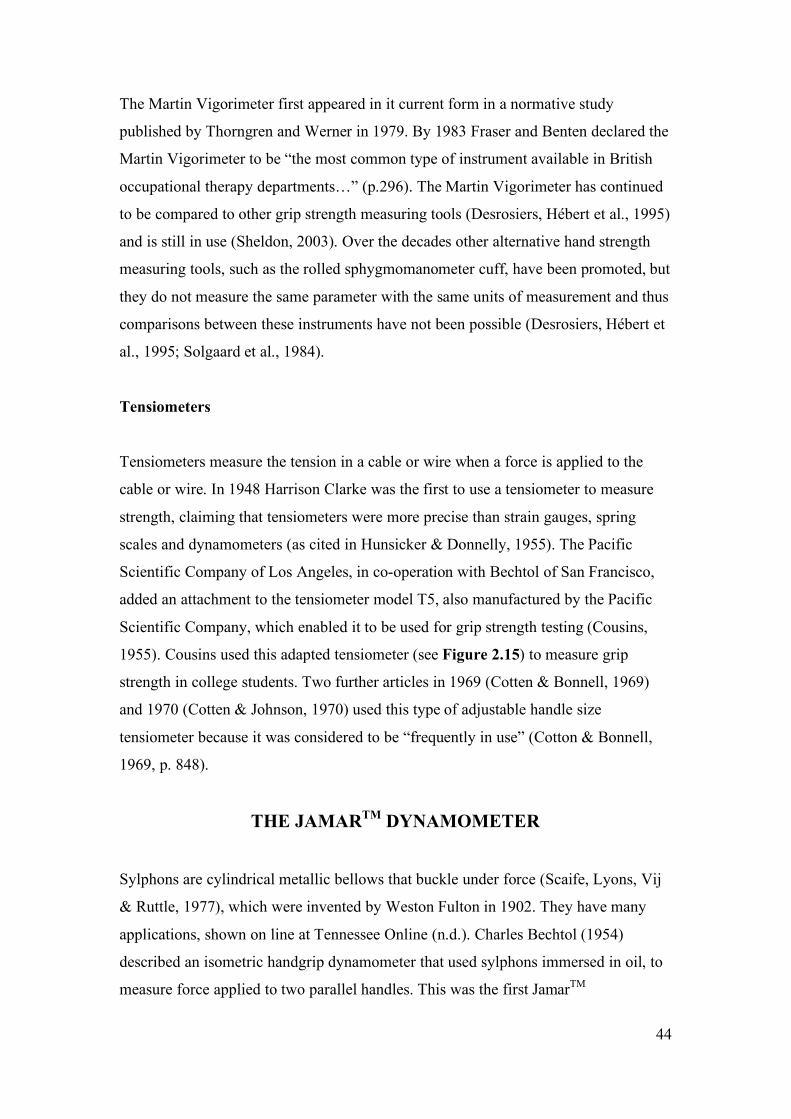
Tensiometers measure the tension in a cable or wire when a force is applied to the
cable or wire. In 1948 Harrison Clarke was the first to use a tensiometer to measure
strength, claiming that tensiometers were more precise than strain gauges, spring
scales and dynamometers (as cited in Hunsicker & Donnelly, 1955). The Pacific
Scientific Company of Los Angeles, in co-operation with Bechtol of San Francisco,
added an attachment to the tensiometer model T5, also manufactured by the Pacific
Scientific Company, which enabled it to be used for grip strength testing (Cousins,
1955). Cousins used this adapted tensiometer (see Figure 2.15) to measure grip
strength in college students. Two further articles in 1969 (Cotten & Bonnell, 1969)
and 1970 (Cotten & Johnson, 1970) used this type of adjustable handle size
tensiometer because it was considered to be “frequently in use” (Cotton & Bonnell,
1969, p. 848).
THE JAMARTM DYNAMOMETER
Sylphons are cylindrical metallic bellows that buckle under force (Scaife, Lyons, Vij
& Ruttle, 1977), which were invented by Weston Fulton in 1902. They have many
applications, shown on line at Tennessee Online (n.d.). Charles Bechtol (1954)
described an isometric handgrip dynamometer that used sylphons immersed in oil, to
measure force applied to two parallel handles. This was the first JamarTM
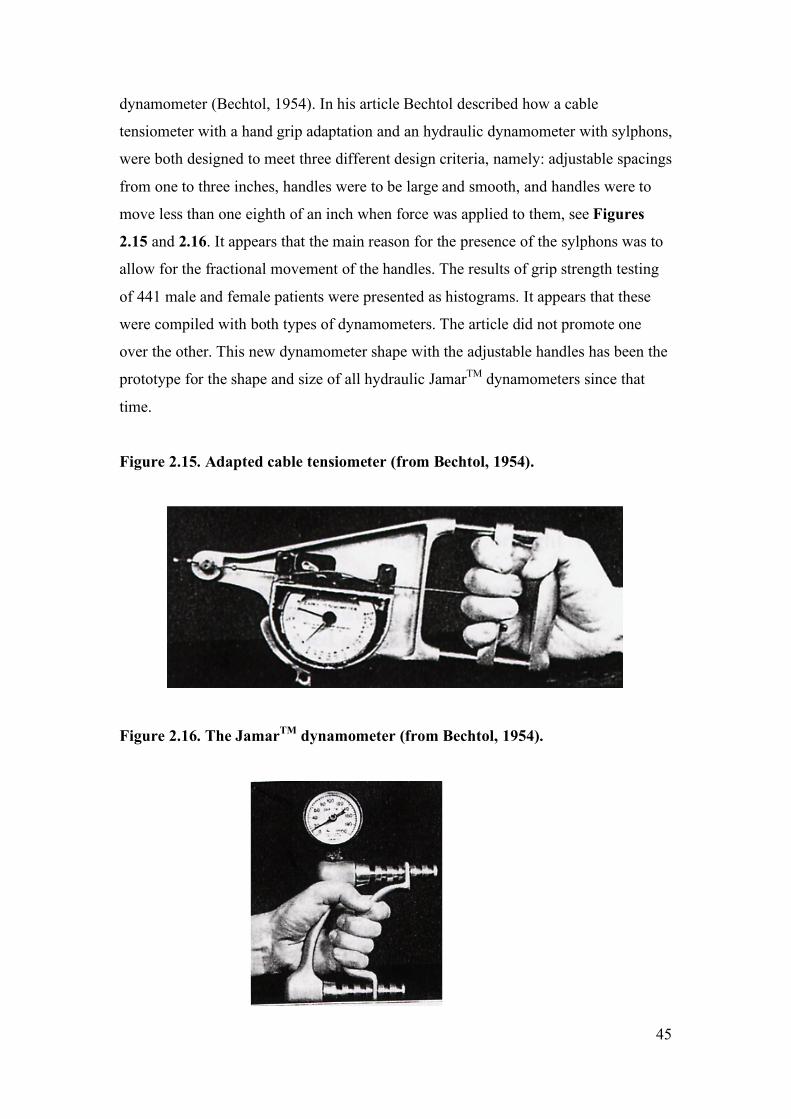
45
dynamometer (Bechtol, 1954). In his article Bechtol described how a cable
tensiometer with a hand grip adaptation and an hydraulic dynamometer with sylphons,
were both designed to meet three different design criteria, namely: adjustable spacings
from one to three inches, handles were to be large and smooth, and handles were to
move less than one eighth of an inch when force was applied to them, see Figures
2.15 and 2.16. It appears that the main reason for the presence of the sylphons was to
allow for the fractional movement of the handles. The results of grip strength testing
of 441 male and female patients were presented as histograms. It appears that these
were compiled with both types of dynamometers. The article did not promote one
over the other. This new dynamometer shape with the adjustable handles has been the
prototype for the shape and size of all hydraulic JamarTM dynamometers since that
time.
Figure 2.15. Adapted cable tensiometer (from Bechtol, 1954).
Figure 2.16. The JamarTM dynamometer (from Bechtol, 1954).
46
In 1956 a committee of the Californian Medical Association, the Subcommittee for
the Study of Grasping Power, represented by Dr. Kirkpatrick, stated that they had
tested and then fully “recommended the new JamarTM dynamometer as the most
acceptable instrument manufactured at this time”. They also added that “with progress
in engineering some better method or instrument may be developed to more
accurately study comparative grasping power” (Kirkpatrick, 1956, p.320). No details
were given about what the dynamometers were tested against; it may have been that
the dynamometers were compared to the Geckler pneumatic and Collin
dynamometers.
H. C. Sanderson (of the Committee of Industrial Health and Rehabilitation of the
California Medical Association), was quoted as supporting force-measuring
dynamometers above the dynamometers with the soft, yielding handles by saying that
“devices which measure grip pressure by squeezing a bulb filled with fluid, liquid or
air, or one of the common spring dynamometers, can only measure the pressure of
grip” (Kirkpatrick, 1956, p. 315). Sanderson ascertained that grip strength was a
force, not a pressure, therefore grip strength could only be measured by instruments
such as isometric hand force dynamometers, like the JamarTM, as opposed to
manometers. Kirkpatrick also claimed that there were “only three types of instruments
available to determine comparative loss of grasping power” (p. 314). The present
discussion shows this statement to be incorrect as there were many types of cable-
tensiometers, manometers, electrical strain gauges and dynamometers. Despite these
inaccuracies, this influential article possibly explains why by 1985 the JamarTM
dynamometer had become popular. Smith and Benge (1985) sent a survey to 510
occupational therapy clinics and 115 occupational therapy schools in the USA asking
them about the type of grip strength tool they used. Out of the 195 valid responses
79% used a JamarTM in their setting, with 40% using more than one type of tool for
measuring grip strength.
Despite many advances in instrumentation since the mid 1950s, the JamarTM handgrip
dynamometer is today quoted as being “recognised as the gold standard for grip
strength measurement” (Shechtman, Davenport, Malcolm & Nabavi, 2003). The
development of small microprocessors and specific electronic sensors that form the
basis of load cells (pressor sensors), and progress in analogue to digital technology
47
have enabled the production of computer-linked versions. These have been accessible
to researchers and clinicians since the 1990s. The National Isometric Muscle Strength
Database Consortium used a digital electronic version of the JamarTM in 1996, to
measure the grip strength of 493 people (National Isometric Muscle Strength
Database Consortium, 1996). With this data they developed regression equations for
strength predictions that incorporated age, gender and BMI. Use of the computer-
linked, JamarTM-like dynamometers has been promoted to reduce interpretation and
recording errors (Brand & Hollister, 1999).
Manufacturers have added JamarTM-like adjustable handles to their strength
assessment tools, such as the BTE-Work Simulator. This device added the BTE-
Primus in 1994, which was a grip attachment resembling the shape of the JamarTM,
with its 5 handle positions. It was not until 2003 that occupational therapists studied
the reliability of the values taken with this tool in relation to the original analogue
JamarTM (Shechtman et al., 2003). They found that there were no significant
differences in the grip strength scores generated by using either of these two tools.
Other computer-linked, JamarTM-like tools, such as the GripTrackTM, by JTech
Medical (Utah) have been tested in laboratories and deemed acceptable to be used
with databases compiled with the analogue JamarTM devices (Mathiowetz, personal
correspondence to JTech Medical, December 12, 1996). However a recent study
reported that data collected with one GripTrackTM dynamometer were not transferable
to the norms created on the JamarTM dynamometers (Svens & Lee, 2005).
Accuracy of the JamarTM
Kirkpatrick (1956) stated that the JamarTM could be calibrated and recalibrated if
necessary, because they do lose calibration and do develop errors, as other researchers
can testify (Floodjoy & Mathiowetz, 1987; King & Finet, 2003). Thus although the
JamarTM and its various versions are still considered to be the “gold standard” by the
American Society of Hand Therapists, and others (Desrosiers, Hébert et al., 1995;
Shechtman et al., 2003), they are not without their deficiencies (Svens & Lee, 2005).
48
Electrical strain gauges
In 1979 Pearn and Bullock supported the idea of isometric strength testing for
patients, even though by this time there was a large body of literature advocating the
use of the pneumatic manometers, such as the Vigorimeter. However, they were
assumedly not content with the JamarTM due to its design flaws. They stated that the
dynamic (which they called isotonic) strength measuring tools had “relatively narrow
ranges” and that “the interpretation of serial isotonic measurements [was] very
difficult, simply because of changing mechanical advantages as the instrument hand-
grip moves” (Pearn & Bullock, 1979, p. 107). They considered that “cable-
tensiometers tend[ed] to be cumbersome” (p. 107). They were likely referring to
tensiometers such as that in Figure 2.15. Thus Pearn and Bullock designed an
electronic strain gauge that was “sensitive yet robust … [with a] wide force-
application range, … rapid and simple to operate” (p.107). It had a linear load-
response curve, suitable for a wide range of loads. It was a portable isometric test that
could therefore by used in the clinic and for fieldwork. Because of its wide force
range (from 0.5 to 1,500 Newtons) it was possible to use it “in neonates (e.g. analysis
of the grasp reflex), or in adult sportsmen” (p. 107). Despite these attributes it appears
to have been used for only one other study. That study was in Brisbane, where the tool
was developed (Newman et al., 1984). The tool has not reappeared in the grip strength
testing literature.
THE PRESENT AND THE FUTURE
Thus researchers have continued to develop other hand strength measuring tools (An,
Chao & Askew, 1980; Bassey, Dudley & Harris, 1986; Dawson, Felle & O’Donovan,
1998; Pronk & Niesing, 1981). These four studies have all developed their own
version of strain gauges with digital read-outs. Such tools have been developed to
avoid the main flaw in the hydraulic-based, JamarTM-like tools; namely that they can
develop “slow leaks [of the oil] and hysteresis” (Pronk & Niesing, 1981, p. 127).
Hysteresis is the development of a slowed response when forces are applied to a
force-reading tool.
49
Throughout the years, researchers have compared the JamarTM with newer isometric
(King & Berryhill, 1988; MacDermid, Alyafi, Richards & Roth, 2001; Shechtman, et
al., 2005), dynamic (moving under the person’s own efforts) (Desrosiers Hébert et al.,
1995) and isokinetic tools, which move at a set speed (Dvir, 1997). Although not
interchangeable, these five research groups found the JamarTM to have a high
correlation between its grip strength readings and that of the other tools. Shechtman et
al. found that the average measurement error for suspended known weights with three
JamarTM dynamometers was 7.74% as compared to an average measurement error of
1.63% with three of the new electronic DynEx dynamometers.
Dvir (1999), an Israeli Physiotherapist, argued that the JamarTM lacks the ability to
discriminate feigned maximal grip effort, so when a patient is to be assessed for
compensation purposes they should be tested with an isokinetic dynamometer. He
stated that isokinetic dynamometers monitor eccentric and concentric force
components that are unable to be consciously altered by a patient without obvious
signs of feigned effort.
The ability to link computers to force sensors has assisted in the development of more
complex tools and more sophisticated analyses of hand strength for activities. Some
of these tools measure the isometric force generated by each individual finger phalanx
(An et al., 1980; Radhakrishan & Nagaravindra, 1993), some also measure the
tangential shear forces imposed by each phalangeal segment of each finger during
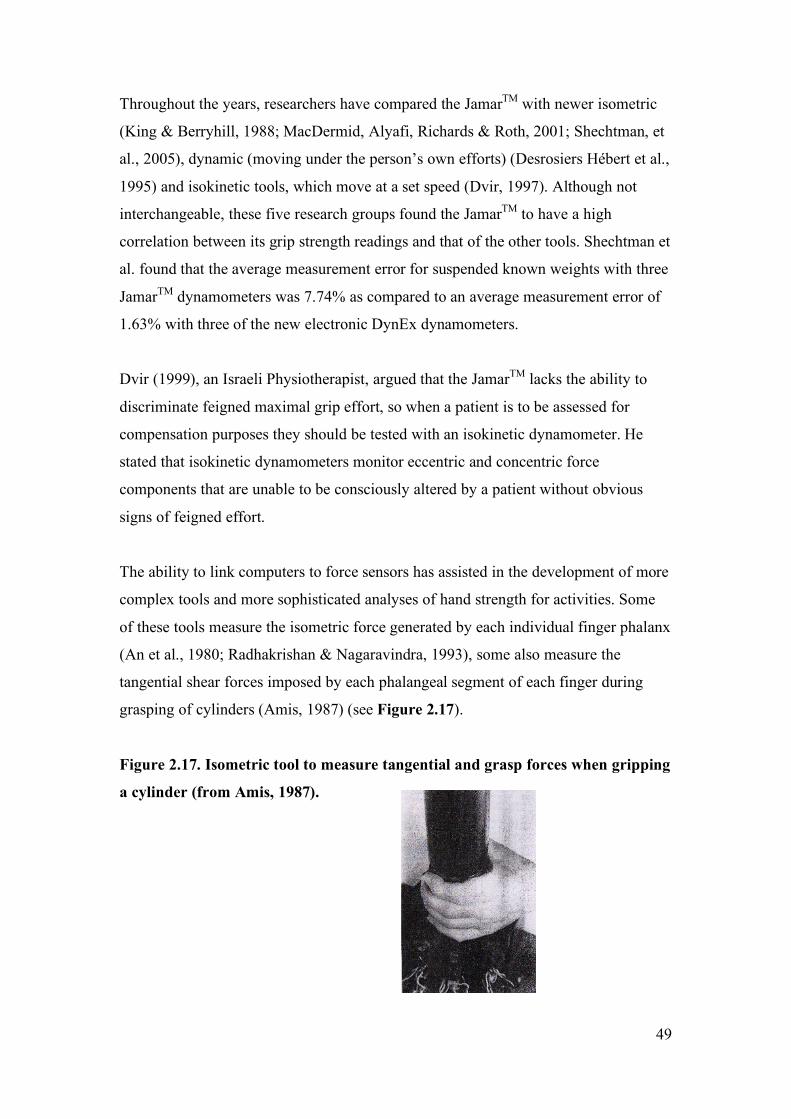
grasping of cylinders (Amis, 1987) (see Figure 2.17).
Figure 2.17. Isometric tool to measure tangential and grasp forces when gripping
a cylinder (from Amis, 1987).
50
A practical application of this technology can be seen in a study of oil-rig workers.
Imrahan and Farahmand (1999) used a torque transducer interfaced with an
analogue/digital converter linked to a computer to examine the grip force required to
turn various handles with clean or grease-smeared gloves. This level of force analysis
equipment is not often seen in the hand therapy literature, but is more common in the
ergonomics literature, as shown in the reference list of the article by Imrahan and
Farahmand (1999).
Another group of researchers are using computer technology to analyse forces
required by the hand to hold a glass bottle in a standardised position. They have used
small conductive polymer sensors attached to 20 different points on the volar surface
of a hand (Kargov, Pylatiuk, Martin, Schulz & Döderlein, 2004).
In contrast to these detailed studies with numerous sensors, the American Journal of
Hand Therapy recently published an article about hand function whilst wearing Lycra
burns gloves (Weinstock-Zlotnick, Torres-Gray & Segal, 2004). One way to
indirectly measure function is commonly accepted to be via measuring grip strength
(Brand & Hollister, 1999). Weinstock-Zlotnick et al. used a JamarTM dynamometer to
measure the maximum grip strength achieved whilst wearing burns gloves with or
without suede patches on the palmar surface. It would seem that using a more
sophisticated force-analysis tool such as those cited above could have better assisted
the authors in future burns gloves modifications to improve function whilst wearing
the gloves.
The JamarTM, or a computer-linked or electronic version, are still in common use as
demonstrated by the number of recent articles in the American Journal of Hand
Therapy that have used it to measure grip strength and confirm its reliability
(Bohannon & Schaubert, 2005). A recent Australian study examined the outcomes
from compliance to treatment for radius fractures using a JamarTM-equivalent
dynamometer to measure grip strength (Lyngcoln, Taylor, Pizzari & Baskus, 2005). It
is also being used to assist in the prediction of the length of stay in hospitalised
elderly patients (Kerr et al., 2006). Although not stated as a reason for the continued
use of the JamarTM-equivalent dynamometers, cost may be a consideration, as these
tools are typically the cheapest type of isometric dynamometer available. Also they
51
have multiple normative databases spanning virtually all ages, which clinicians can
readily access.
SUMMARY
Grip strength assessment tools have evolved over the last 250 years from ‘nearly
isometric’ elliptical steel frames, with no calibration methods or standard test
positions, to highly sophisticated force sensors which can record adjustments in force
readings in individual finger phalanges. There is now a range of tools that can
measure static, or dynamic muscle forces. Along with the development of the tools
and testing methodologies, there have been an increasing number of normative
databases available for these tools. This has been accompanied by a greater
understanding of the factors that influence grip strength between individuals, within
disease processes and from day to day.
The data collection for this present thesis was performed with the GripTrackTM (JTech
Medical Industries, Utah). This tool has the same size and configuration as the most
commonly used tool in Australia, the JamarTM dynamometer. Thus by using a
JamarTM-like dynamometer in the present research, other therapists can apply the
current findings to their clinical situation.