data collection & processing hand grip strength p339-341 textbook
TRANSCRIPT
Data Collection & Processing
Hand Grip StrengthP339-341 textbook
ProblemIs there a stronger correlation between hand grip strength and body mass or hand grip strength and
age?
Independent Variable: body massage
Dependent Variable:Hand Grip Strength
HypothesisChoose one of the following
There is a stronger correlation between hand grip strength and body mass.
Or
There is a stronger correlation between hand grip strength and age.
Aspect 1: Raw Data (quantitative data)
• Raw (Unmodified) data is data that you collect in your experiment using various instruments/ tools.
• Presented in an easy to read table. • Has a specific title (This table shows the effect of ….) • Each column heading has proper units (metric units)• Measures of uncertainty of all tools used (+/-1mm)
• Smallest unit of possible measurement of each tool)
•Consistent and correct number of decimals for each measurement.•Decimal points are aligned in the data table (neatness counts)•If data was pooled make sure you label each set of data.
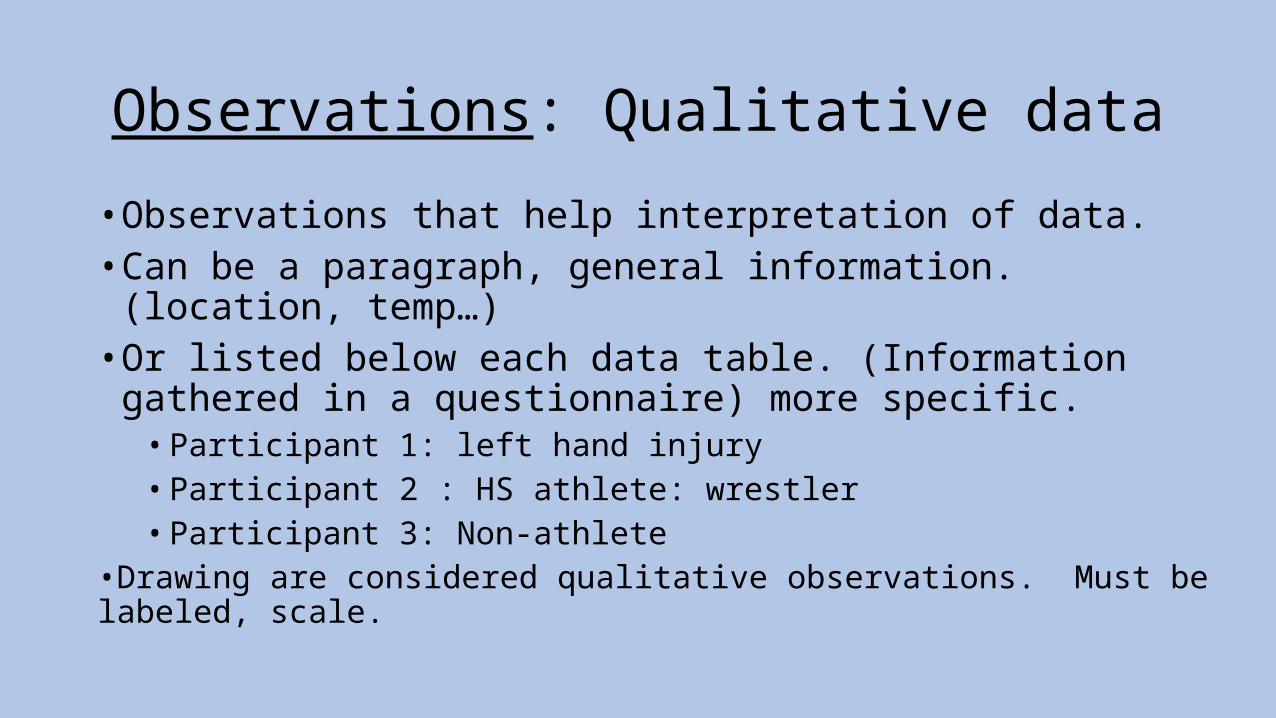
Observations: Qualitative data
• Observations that help interpretation of data.• Can be a paragraph, general information. (location, temp…)• Or listed below each data table. (Information gathered in a
questionnaire) more specific.• Participant 1: left hand injury• Participant 2 : HS athlete: wrestler• Participant 3: Non-athlete
•Drawing are considered qualitative observations. Must be labeled, scale.
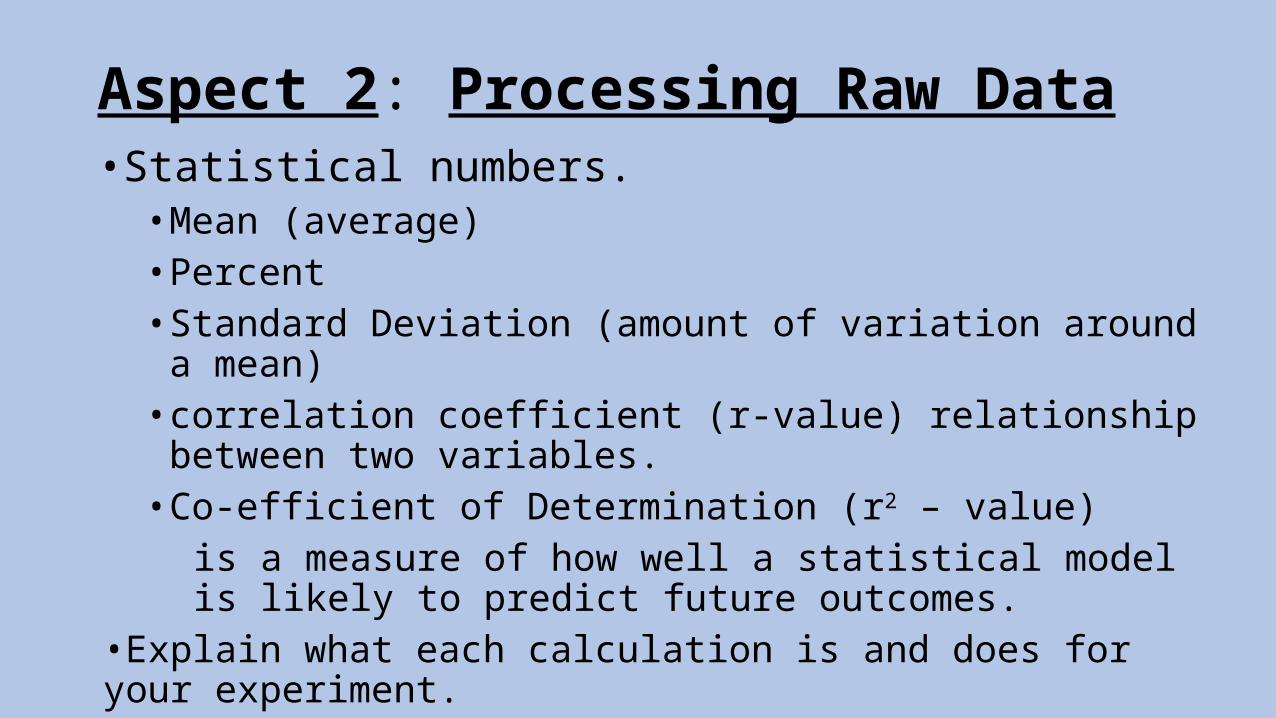
Aspect 2: Processing Raw Data• Statistical numbers.
• Mean (average)• Percent • Standard Deviation (amount of variation around a mean)• correlation coefficient (r-value) relationship between two variables.• Co-efficient of Determination (r2 – value)
is a measure of how well a statistical model is likely to predict future outcomes.
•Explain what each calculation is and does for your experiment.
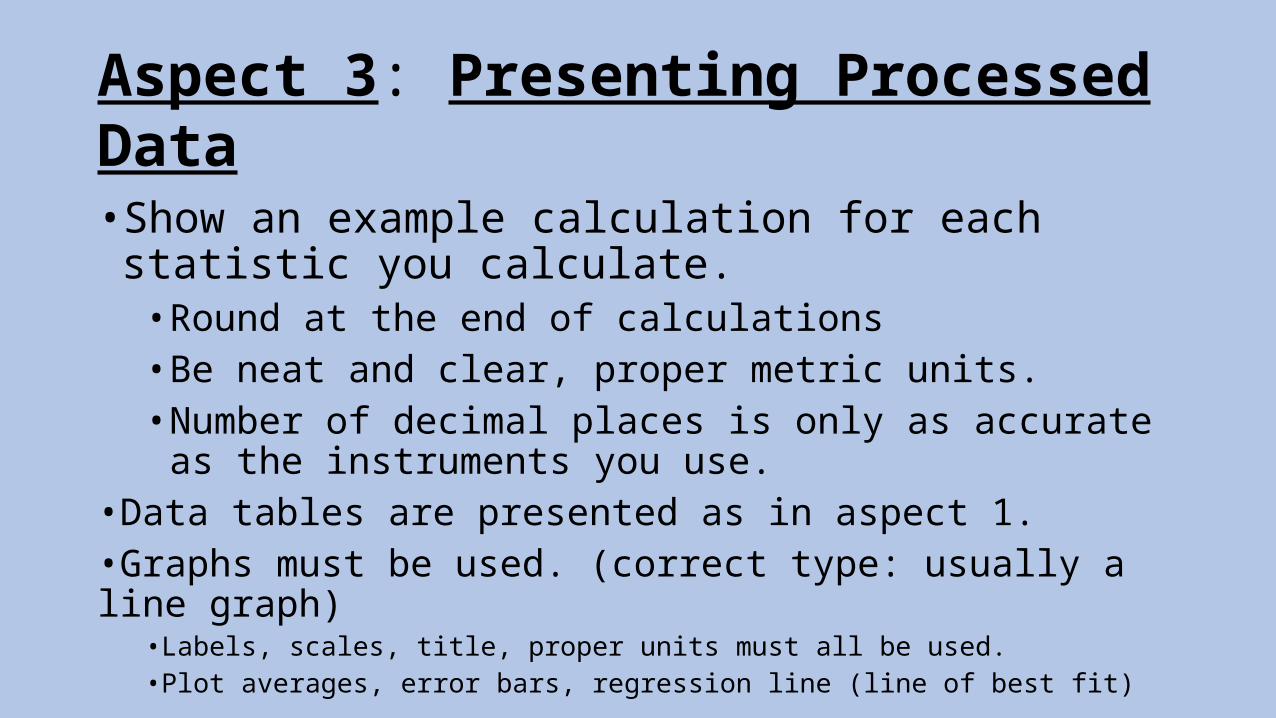
Aspect 3: Presenting Processed Data• Show an example calculation for each statistic you calculate.
• Round at the end of calculations• Be neat and clear, proper metric units.• Number of decimal places is only as accurate as the instruments
you use. •Data tables are presented as in aspect 1. •Graphs must be used. (correct type: usually a line graph)
•Labels, scales, title, proper units must all be used. •Plot averages, error bars, regression line (line of best fit)
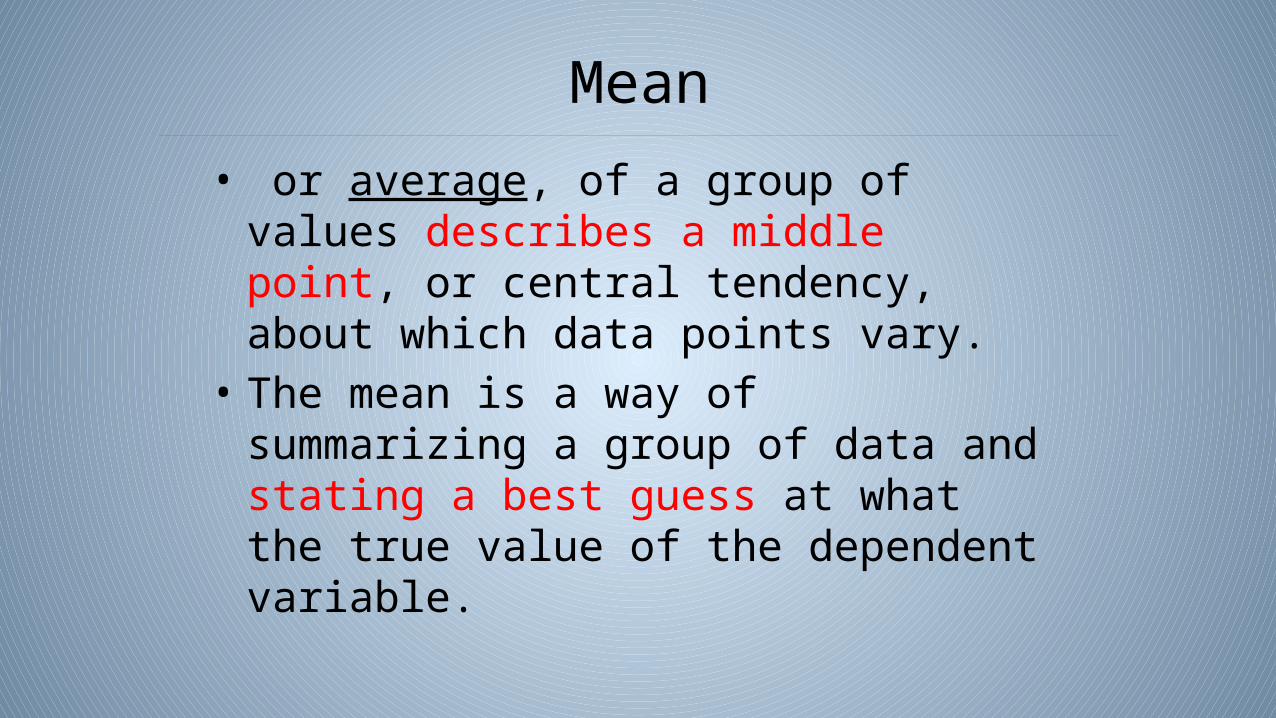
Mean
• or average, of a group of values describes a middle point, or central tendency, about which data points vary.
• The mean is a way of summarizing a group of data and stating a best guess at what the true value of the dependent variable.
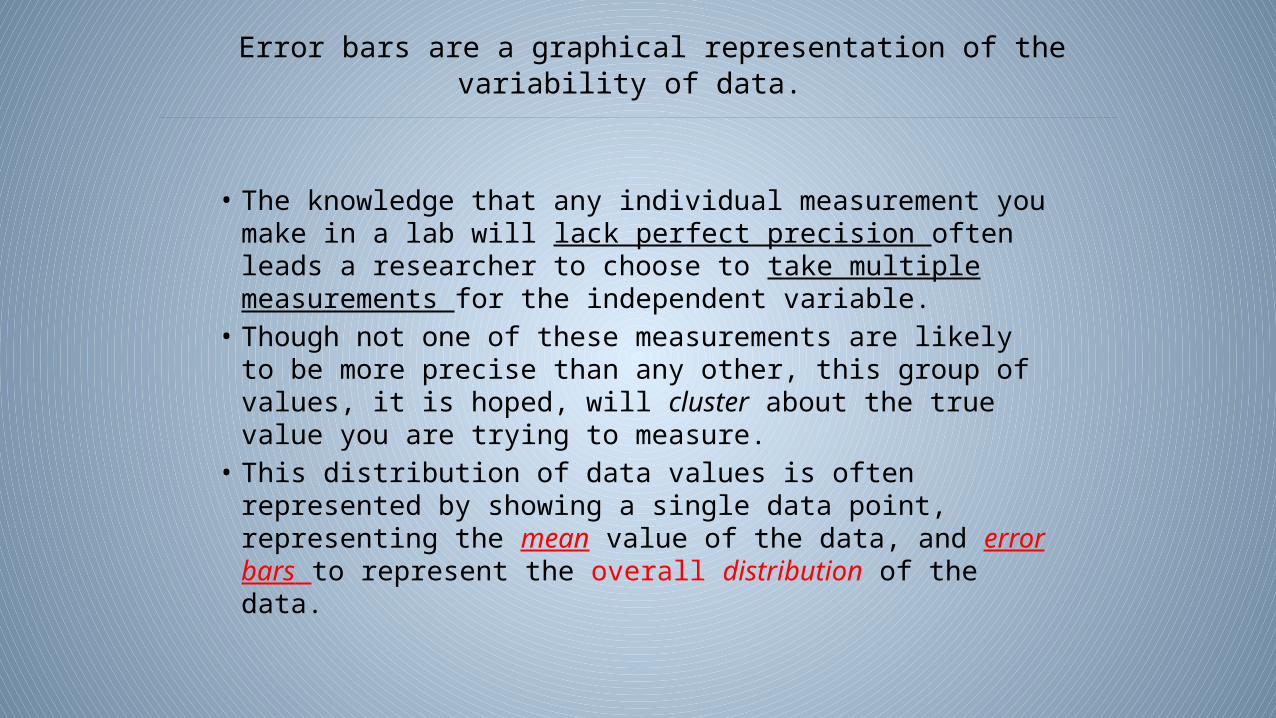
Error bars are a graphical representation of the variability of data.
• The knowledge that any individual measurement you make in a lab will lack perfect precision often leads a researcher to choose to take multiple measurements for the independent variable.
• Though not one of these measurements are likely to be more precise than any other, this group of values, it is hoped, will cluster about the true value you are trying to measure.
• This distribution of data values is often represented by showing a single data point, representing the mean value of the data, and error bars to represent the overall distribution of the data.
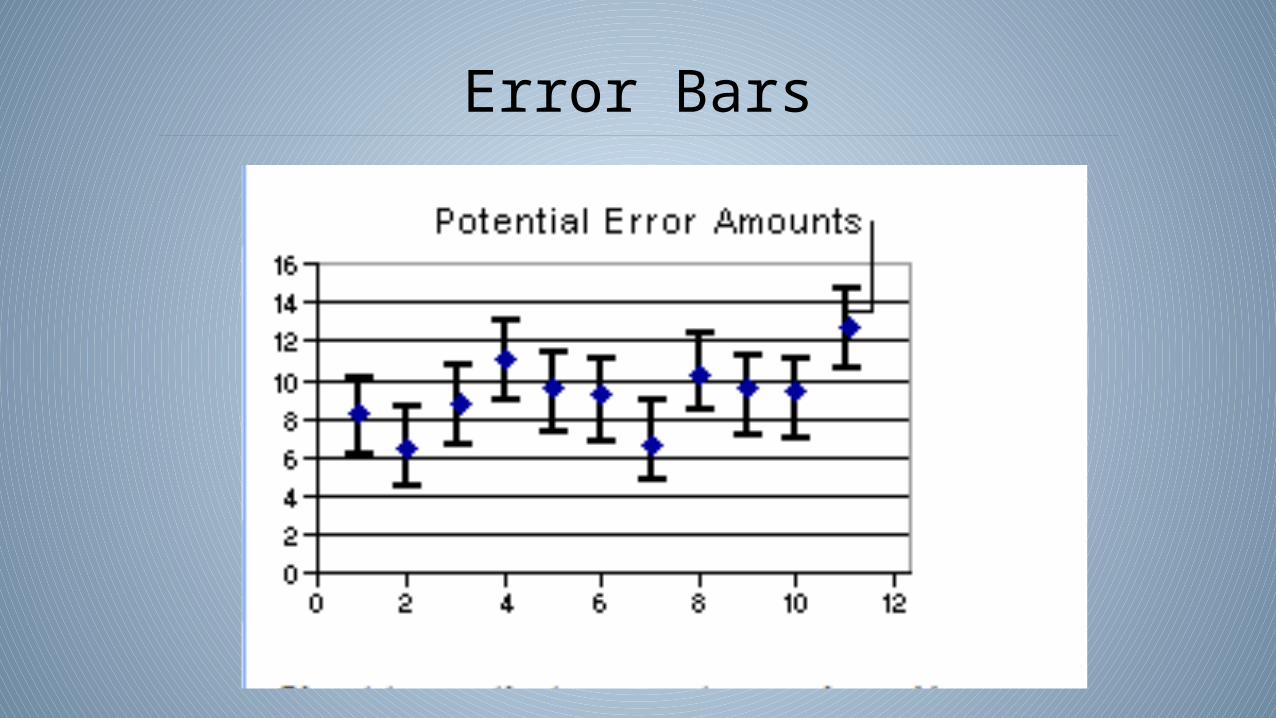
Error Bars
Error Bars
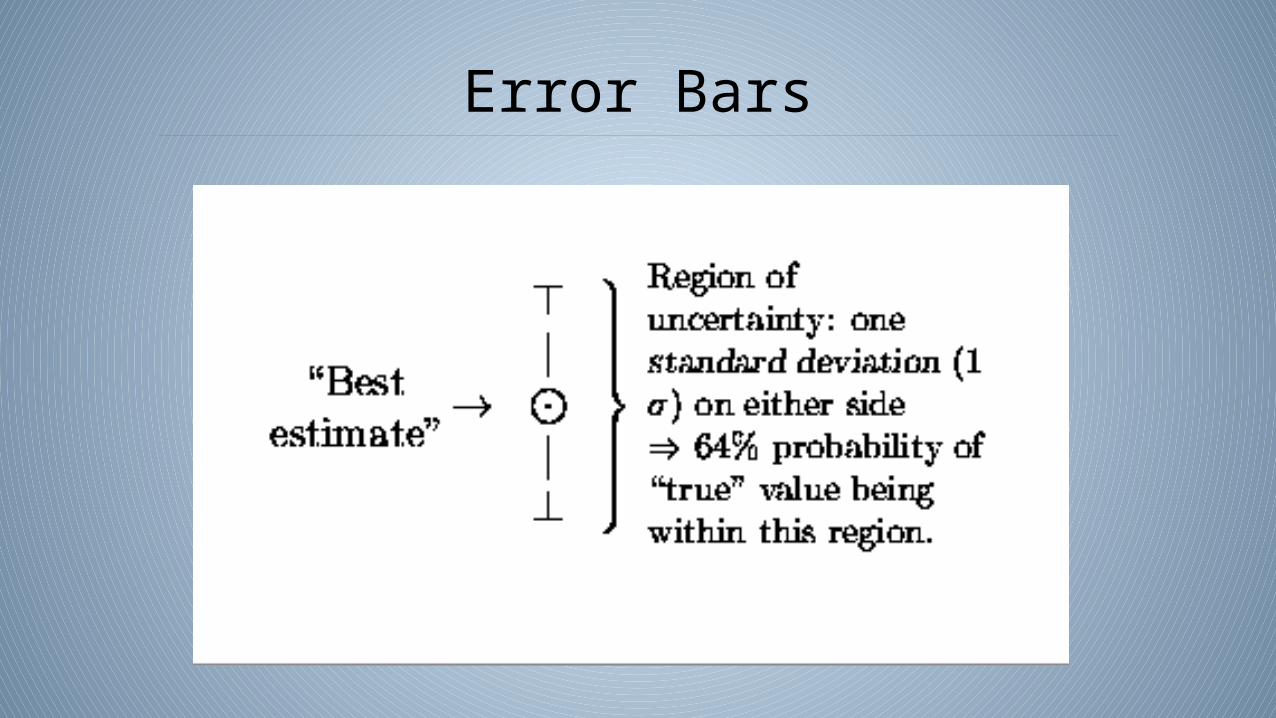
Error Bars
• The error bars shown in a line graph represent a description of how confident you are that the mean represents the true value.
• The more the original data values range above and below the mean, the wider the error bars and less confident you are in a particular value.
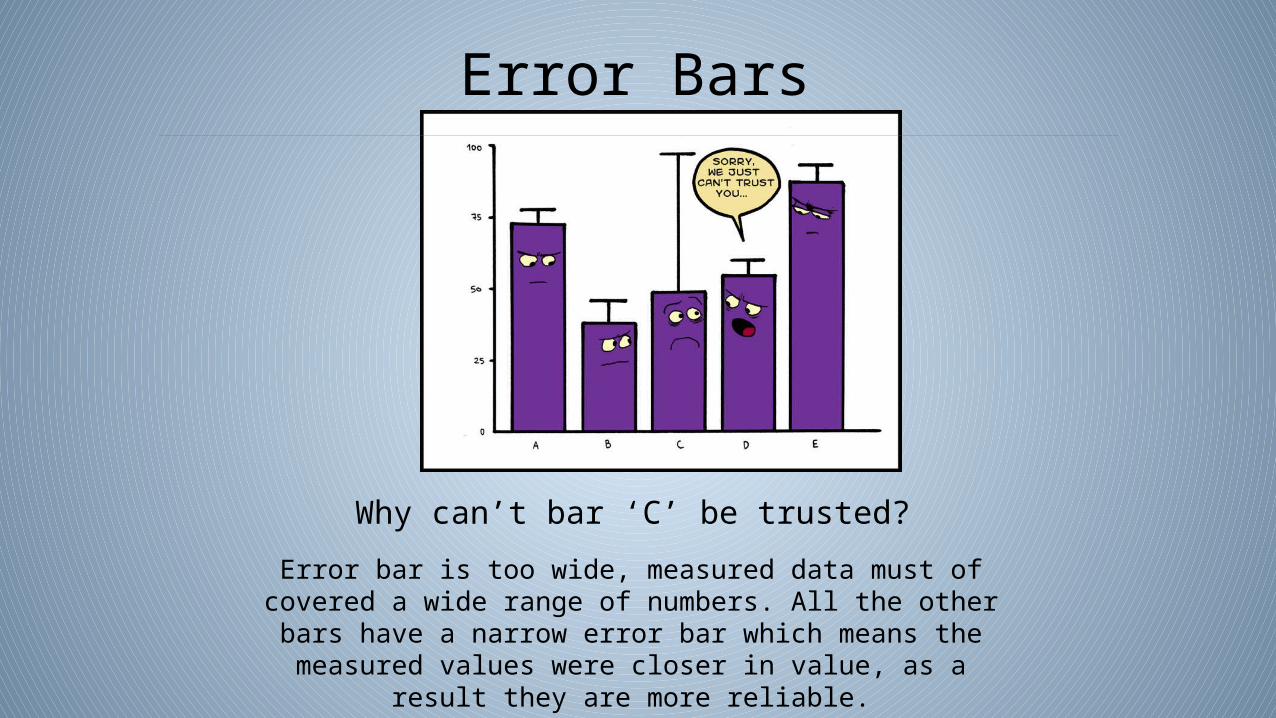
Error Bars
Why can’t bar ‘C’ be trusted?
Error bar is too wide, measured data must of covered a wide range of numbers. All the other bars have a narrow error bar which means the measured values were closer in value, as a
result they are more reliable.
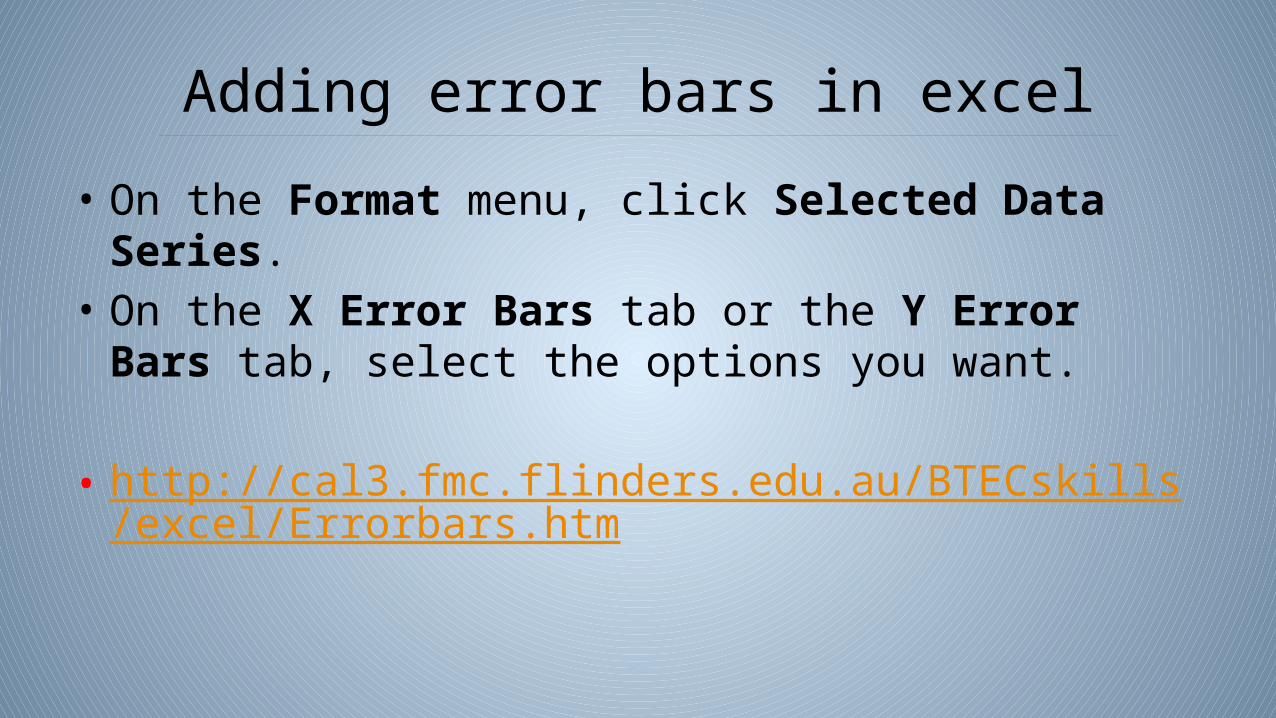
Adding error bars in excel
• On the Format menu, click Selected Data Series. • On the X Error Bars tab or the Y Error Bars tab, select the
options you want.
• http://cal3.fmc.flinders.edu.au/BTECskills/excel/Errorbars.htm
Standard Deviation
• is a simple measure of the variability or dispersion of a data set.
• A low standard deviation indicates that the data points tend to be very close to the same value (the mean),
• while high standard deviation indicates that the data are “spread out” over a large range of values.
Standard Deviation
• For example, the average height for adult men in the United States is about 70 inches, with a standard deviation of around 3 inches. This means that most men (about 68%, assuming a normal distribution) have a height within 3 inches of the mean (67 inches – 73 inches),
• while almost all men (about 95%) have a height within 6 inches of the mean (64 inches – 76 inches).
Standard Deviation
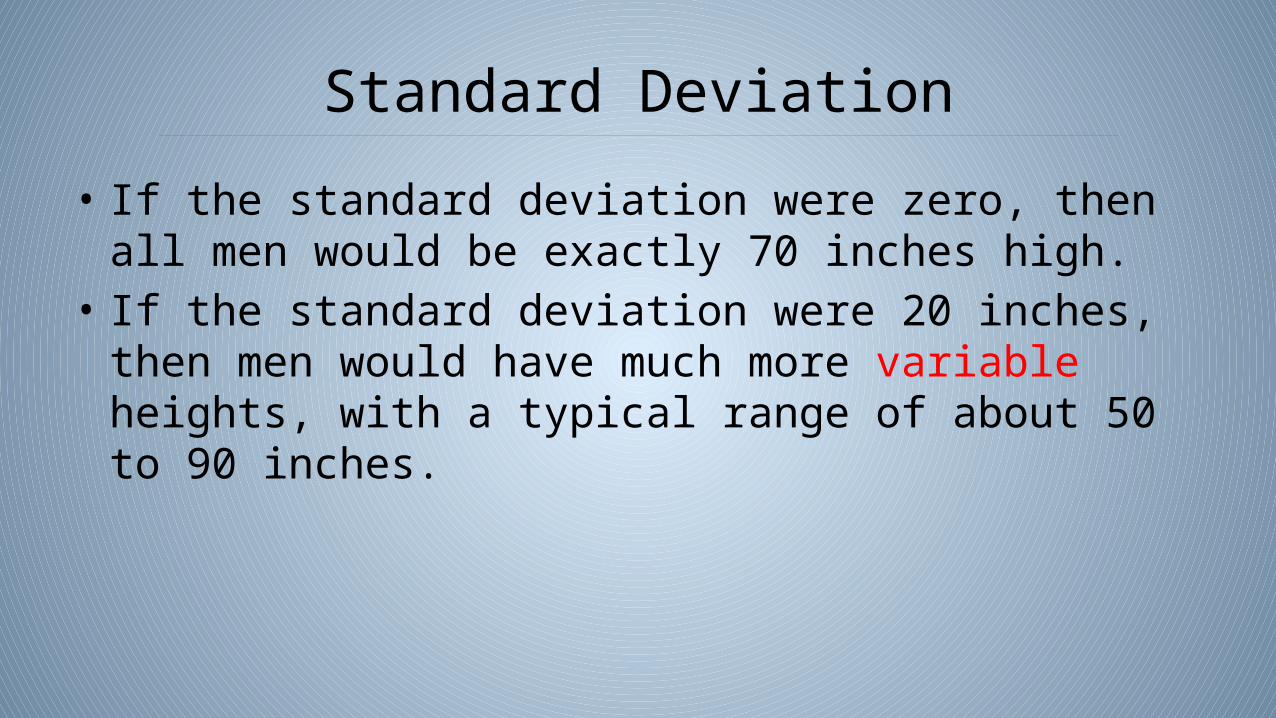
• If the standard deviation were zero, then all men would be exactly 70 inches high.
• If the standard deviation were 20 inches, then men would have much more variable heights, with a typical range of about 50 to 90 inches.
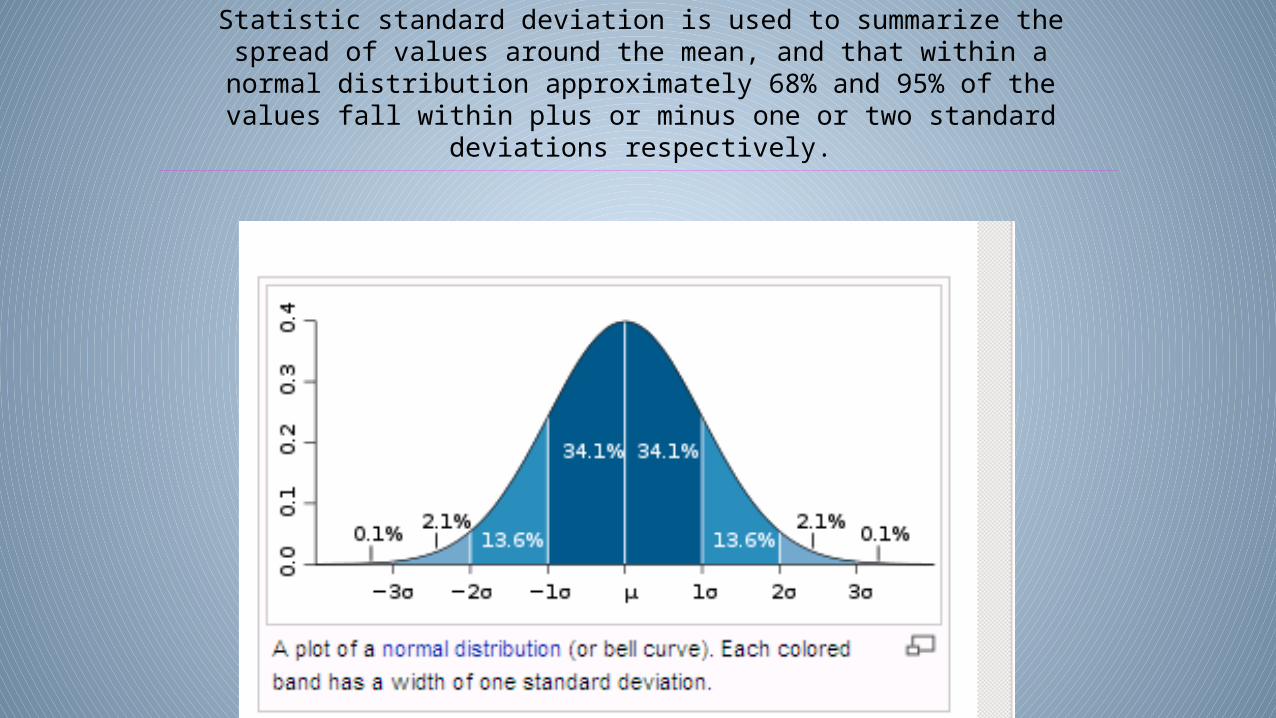
Statistic standard deviation is used to summarize the spread of values around the mean, and that within a normal distribution approximately 68% and 95% of the
values fall within plus or minus one or two standard deviations respectively.
Standard Deviation
• A small standard deviation indicates that the data is clustered closely around the mean value.
• Conversely, a large standard deviation indicates a wider spread around the mean.
Calculate SD
• Excel will calculate standard deviation.• http://www.gifted.uconn.edu/siegle/research/normal/stdexcel.htm• Textbook pages 138-140
Correlation Coefficient (r-value)
• (Pearson product-moment) correlation coefficient (r) is the correlation between two variables (X and Y)
• This calculation provides a measure of the linear relationship between the two variables. Does X and Y increase or decrease together or is their relationship due to random chance.
• The correlation coefficient will be a value between +1.000 and -1.000.
• The closer the number is to 0 the less likely there is a linear relationship with a value of 0 is there is no linear relationship between X and Y.
Correlation Coefficient (r-value)
• The closer the number is to 1 the more likely there is a linear relationship between X and Y with a value of 1.0 indicating a perfect linear relationship. The sign (+ or -) indicates the direction of the relationship. A plus (+) sign tells you that as X increase so does Y. A minus (-) sign tells you as X increases, Y decreases or as X decrease, Y increases. (direct or inverse relationships)
Coefficient of determination (r2-value)
• Helps determine (in percentage) how much the variation of Y is based on the variation of X, or is it a relationship based on chance.
• Is the variation in Y (hand strength) related to the linear relationship between X (age or body mass) and Y (hand strength).
• is a measure of how well a statistical model is likely to predict future outcomes.
r2-value
• Example• “If your r2 = 0.850, which means that 85% of the total variation
in y can be explained by the linear relationship between X and Y (as described by the regression equation).
• The other 15% of the total amount of variation in Y remains unexplained.”