factors influencing grip strength testing in … · 2016-06-16 · thesis “factors influencing...
TRANSCRIPT

FACTORS INFLUENCING GRIP STRENGTH TESTING
IN TEENAGERS
Anita Clerke B.App.Sc.O.T.
A thesis submitted in fulfilment of the requirements for the degree of
Doctor of Philosophy
Faculty of Health Science University of Sydney
2006

STATEMENT OF AUTHORSHIP
The work presented in this thesis is the original work of the author except where as
acknowledged in the text. I hereby declare that I have not submitted this material
either in whole or in part for any degree at this or any other institute.
i

SUPERVISOR’S STATEMENT BY DR. RON BALNAVE
As co-supervisor of Anita M. Clerke’s doctoral work, I certify that I consider her
thesis “Factors influencing grip strength testing in teenagers” to be suitable for
examination.
Dr. Ron Balnave School of Biomedical Sciences
Faculty of Health Sciences University of Sydney
ii
SUPERVISOR’S STATEMENT BY DR. ROGER ADAMS
As co-supervisor of Anita M. Clerke’s doctoral work, I certify that I consider her
thesis “Factors influencing grip strength testing in teenagers” to be suitable for
examination.
Dr. Roger D. Adams
School of Physiotherapy Faculty of Health Sciences
University of Sydney
iii

STATEMENT FROM CO-AUTHOR CONFIRMING THE
AUTHORSHIP CONTRIBUTION OF THE PhD CANDIDATE
As co-author of the paper entitled “A Literature Review of the Effect of Handedness
on Isometric Grip Strength Differences of the Left and Right Hands ” published in the
American Journal of Occupational Therapy (Vol. 55, 206-211, 2001) I confirm that
Anita M. Clerke has made the following contributions:
1. Conception and design of the research project;
2. Data collection, analysis and interpretation of the findings;
3. Writing the paper and critical appraisal of content;
4. Corresponding author for communication with journals.
iv

STATEMENT FROM CO-AUTHORS CONFIRMING THE
AUTHORSHIP CONTRIBUTION OF THE PhD CANDIDATE
As co-authors of the paper entitled “Effects of hand shape on maximal isometric grip
strength and its reliability in teenagers” published in the Journal of Hand Therapy
(Vol. 18, 19-29, 2005) we confirm that Anita M. Clerke has made the following
contributions:
1. Conception and design of the research project;
2. Data collection, analysis and interpretation of the findings;
3. Writing the paper and critical appraisal of content;
4. Corresponding author for communication with journals.
Dr. Roger D. Adams School of Physiotherapy Faculty of Health Sciences University of Sydney
v

ACKNOWLEDGEMENTS
I would like to extend my thanks and appreciation to my supervisors, Dr. Ron
Balnave and Dr. Roger Adams for their enthusiasm, encouragement and guidance of
the research and in the completion of this thesis. Many other people also need to be
acknowledged and many favours returned. My ever-supportive husband, Jonathan and
ever-patient children, Roshan and Sharmini need the greatest thanks. The retired
Science Master at Albany Creek High School, Mr. Robin Beiers was an immense help
in making the fieldwork possible at his school. Dr. Kylie Baker and other friends have
helped in many ways, thanks to you all. And of course the maker of the universe
needs to be acknowledged, as nothing is possible without Him.
vi

PUBLICATIONS AND PRESENTATIONS
PAPERS PUBLISHED
Clerke, A. M., & Clerke, J. P. (2001). A literature review of the effect of handedness
on isometric grip strength differences of the left and right hands. The American Journal of Occupational Therapy, 55, 206-211.
Clerke, A. M., Clerke, J. P. & Adams, R. D. (2005). Effects of hand shape on maximal isometric grip strength and its reliability in teenagers. Journal of Hand Therapy, 18, 19-29.
PAPERS PRESENTED Clerke, A. M. (2000, November). Is the Strongest Hand Always the Strongest Hand:
A Literature Review? Paper presented at the Post Graduate Symposium of the Biomedical Sciences Department, University of Sydney.
Clerke, A. M. (2001, April). Is the Strongest Hand Always the Strongest Hand: The
Reliability of Grip Strength Ratios. Paper presented at the Australian Association of Occupational Therapists Annual Conference, Gold Coast, Qld.
Clerke, A. M., & Clerke, J. P. (2001, November). The Reliability of Grip Strength
Ratios (Influencing Factors). Paper presented at the Annual Conference of the Queensland Hand Surgical Society, Gold Coast, Qld.
Clerke, A. M., & Clerke, J. P. (2001, November). The Reliability of Grip Strength Ratios in Australian Teenagers. Paper presented at the Post Graduate Students
Symposium, Faculty of Health Sciences, University of Sydney. Clerke, A. M. (2002, November). The Reliability of the Edinburgh Handedness
Inventory: its Relationship to Hand Function. Paper presented at the Post Graduate Students Symposium, Faculty of Health Sciences, University of Sydney.
Clerke, A. M. (2003, August). Reliability and Validity of the Edinburgh Handedness
Inventory: in Adults. Paper presented at the Annual Conference of the Queensland Hand Surgical Society, Sunshine Coast, Qld.
Clerke, A. M. (2003). Reliability and Validity of the Edinburgh Handedness
Inventory in Adults and Teenagers [Abstract]. Proceedings of the Trans-Tasman Hand Therapy Conference, Queenstown, New Zealand, 72.
Clerke, A. M. (2003, November). Hand Shape and its Effect Upon the Grip Strength
[Abstract]. Paper presented at the Biomedical Sciences Post Graduate Research Students Conference, Faculty of Health Sciences, University of Sydney, 44.
vii

Clerke, A. M. (2004, November). An History of Grip Strength Measuring Tools. Paper presented at the Post Graduate Research Students Conference, Faculty of Health Sciences, University of Sydney.
Clerke, A. M., Clerke, J. P. & Adams, R. D. (2004, November). Hand Shape Effects
on Maximal Isometric Grip Strength and its Reliability in Teenagers. Proceedings of the Australian Hand Therapy Association, Perth, Australia, 81-91.
Clerke, A. M. (2005, December). Reliability and Validity of the Modified Edinburgh
Handedness Inventory for Teenagers and Adults [Abstract]. Paper presented at the Higher Degree by Research Colloquium, Faculty of Health Sciences, University of Sydney, 23.
viii

TABLE OF CONTENTS STATEMENT OF AUTHORSHIP ………………………….…….. i
SUPERVISORS’ STATEMENTS .…………...………………...… ii
COAUTHORS’ STATEMENTS …………….………………...… iv
ACKNOWLEDGEMENTS ……………………………………….… vi
PUBLICATIONS AND PRESENTATIONS ………..….….….… vii
TABLE OF CONTENTS ……………..………………….………..… ix
LIST OF TABLES ……………………………….…………………… xv
LIST OF FIGURES …………………………………………………… xix
ABSTRACT ……………………………………….…………………… xxii
CHAPTER 1 INTRODUCTION …………………………… 1 Statement of the problem 1
Research objectives 2
Thesis organization 3
Terminology 4
Functional anatomy and the impact of hand injuries 4
Assessing grip strength 18
Variations in grip strength 19
CHAPTER 2 HAND ASSESSMENT INSTRUMENTS …... 22
1. Pen and paper tests 22
2. Tools to measure sensory nerves 24
3. Medico-legal implications of loss of hand function,
as reflected in loss of grip strength, according to various
authorities 25
4. History of grip strength tools 27
Early dynamometers 28
Standard muscle testing positions 37
Dynamometers of the late 19th century and after 38
ix

The JamarTM dynamometer 44
The present and the future 48
Summary 51
CHAPTER 3 GENDER DIFFERENCES ……………………… 52
Anthropometric differences of the hand between
the genders 52
Gender and dexterity 53
Gender differences in muscles that relate to grip strength 53
Gender differences and muscle fibres 58
Gender differences and occult factors 66
Gender differences in perceived exertion 66
Reliability 67
Conclusion 67
CHAPTER 4 A LITERATURE REVIEW OF THE EFFECT OF
HANDEDNESS ON ISOMETRIC GRIP STRENGTH
DIFFERENCES OF THE LEFT AND RIGHT
HANDS…………………………… 68
Methods for determining grip strength 69
Defining handedness 70
Handedness and grip strength research 72
The search for a suitable handedness inventory 79
Conclusion 80
CHAPTER 5 AIMS AND GENERAL METHODS OF THE
THESIS…….………………………………………... 82
Methods 84
General presentation of and justification for the use
of various statistical analyses 92
x

Experiment 1
CHAPTER 6 RELIABILITY AND VALIDITY OF THE
MODIFIED EDINBURGH HANDEDNESS
INVENTORY ……………………………………… 97
Methods for part A, B and C 99
Methods for part D 101
Results 101
Discussion 108
Limitations and future recommendations 114
Conclusion 115
Experiment 2
CHAPTER 7 REPRESENTATIVENESS OF THE RESEARCH
PARTICIPANTS ………..………………………… 116
Part 7.1A Anthropometric values 117
Methods 122
Statistical analysis 122
Results 124
Discussion 130
Study limitations 136
Summary 138
Part 7.1B Lifetime Injury Prevalence 139
Methods 139
Statistical analysis 140
Results 140
Discussion 142
Summary 144
Part 7.1C Exercise levels 146
Methods 147
Statistical analysis 147
Results 147
Discussion 150
xi

Study limitations 151
Part 7.1D Hand dominance groups 152
Methods 152
Statistical analysis 152
Results 152
Discussion 153
Part 7.2 The isometric grip strength testing of 235 teenagers 154
Methods 157
Statistical analysis 158
Results 159
Discussion 164
Summary and conclusion 168
Part 7.3 Variables affecting grip strength 174
Statistical terms 177
Methods 180
Statistical analysis 181
Results 184
Discussion 191
Limitations of the study 201
Conclusion 202
Experiment 3
CHAPTER 8 RELIABILITY OF GRIP STRENGTH
MEASUREMENTS FOR THE DOMINANT AND
NON-DOMINANT HANDS……………………… 203
Methods 208
Statistical Analysis 209
Results 210
Discussion 223
Limitations of the Experiment 230
Summary Conclusion 231
xii

CHAPTER 9 RELIABILITY OF THE ISOMETRIC
GRIP STRENGTH RATIO OF 154
TEENAGERS…………………………………….. 234
Methods 237
Statistical Analysis 238
Results 240
Discussion 246
Conclusions and future recommendations 248
CHAPTER 10 HAND SHAPE EFFECTS ON MAXIMAL
ISOMETRIC GRIP STRENGTH AND ITS
RELIABILITY IN TEENAGERS…………… 250
Methods 251
Statistical Analysis 251
Results 253
Discussion 258
Implications and future studies 260
Conclusion 260
CHAPTER 11 CONCLUSIONS AND
RECOMMENDATIONS …………………….... 261
Outcomes of the research 261
Recommendations for future research 263
Clinical applications 263
REFERENCES …………………………………………………………… 265
xiii

APPENDIX A A literature review of the effect of handedness on
isometric grip strength differences of the left and right
hands. 294
APPENDIX B Effects of hand shape on maximal isometric grip strength
and its reliability in teenagers. 300
APPENDIX C Movements of the wrist, fingers and thumb 320
APPENDIX D Edinburgh Handedness Inventory 326
APPENDIX E Adults Bio-data forms 327
APPENDIX F School concent and information forms 331
APPENDIX G Personal profile forms (Teenagers) 334
APPENDIX H Anthropometric norms and outliers for anthropometric
comparisons 335
APPENDIX I t test results for height, weight and BMI comparisons 337
xiv
LIST OF TABLES
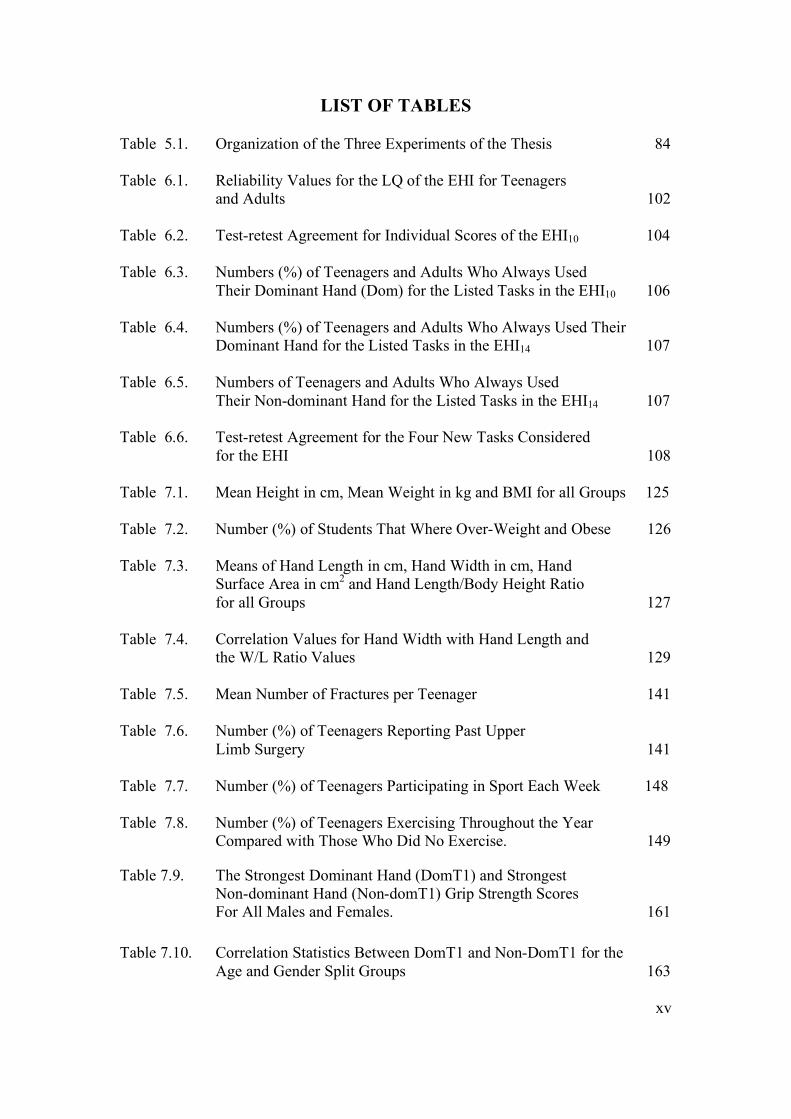
Table 5.1. Organization of the Three Experiments of the Thesis 84 Table 6.1. Reliability Values for the LQ of the EHI for Teenagers
and Adults 102
Table 6.2. Test-retest Agreement for Individual Scores of the EHI10 104
Table 6.3. Numbers (%) of Teenagers and Adults Who Always Used Their Dominant Hand (Dom) for the Listed Tasks in the EHI10 106
Table 6.4. Numbers (%) of Teenagers and Adults Who Always Used Their Dominant Hand for the Listed Tasks in the EHI14 107
Table 6.5. Numbers of Teenagers and Adults Who Always Used Their Non-dominant Hand for the Listed Tasks in the EHI14 107
Table 6.6. Test-retest Agreement for the Four New Tasks Considered for the EHI 108
Table 7.1. Mean Height in cm, Mean Weight in kg and BMI for all Groups 125
Table 7.2. Number (%) of Students That Where Over-Weight and Obese 126
Table 7.3. Means of Hand Length in cm, Hand Width in cm, Hand Surface Area in cm2 and Hand Length/Body Height Ratio for all Groups 127
Table 7.4. Correlation Values for Hand Width with Hand Length and the W/L Ratio Values 129
Table 7.5. Mean Number of Fractures per Teenager 141
Table 7.6. Number (%) of Teenagers Reporting Past Upper
Limb Surgery 141
Table 7.7. Number (%) of Teenagers Participating in Sport Each Week 148 Table 7.8. Number (%) of Teenagers Exercising Throughout the Year
Compared with Those Who Did No Exercise. 149
Table 7.9. The Strongest Dominant Hand (DomT1) and Strongest Non-dominant Hand (Non-domT1) Grip Strength Scores For All Males and Females. 161
Table 7.10. Correlation Statistics Between DomT1 and Non-DomT1 for the
Age and Gender Split Groups 163
xv

Table 7.11. Correlation Statistics Between Left and Right Hands for the Age and Gender Split Groups. 163
Table 7.12. Correlation Statistics Between Dominant and Right Hands for the Age and Gender Split Groups 164
Table 7.13. Correlation Statistics Between Non-dominant and Left Hands for
the Age and Gender Split Groups 164
Table 7.14. Description of Comparable Isometric Grip Strength Studies. 169 Table 7.15. Comparison of Younger Teenage Males Grip Strength in
Kg Force (SD). 170
Table 7.16. Comparison of Younger Teenage Females Grip Strength in Kg Force (SD). 171
Table 7.17. Comparison of Older Teenage Males Grip Strength in Kg Force (SD). 172
Table 7.18. Comparison of Older Teenage Females Grip Strength in
Kg Force (SD). 173
Table 7.19. Bivariate Correlations (R) and Adjusted R2 (R2adj) Between
Dominant and Non-Dominant Hand Grip Strength and Other Variables for the Males and Females. 187
Table 7.20. Prediction Models, R and R2 and R2
adj for the Dominant and Non-dominant Grip Strength. 191
Table 8.1. Sample Numbers and Retest Time Intervals Measured in
Days. 211
Table 8.2. Mean (SD) Strongest Dominant (Dom) and Non-dominant (Non-dom) Grip Strengths in Kilograms Force From Test 1 (T1) to Test 2 (T2) for Each Age and Gender Group. 211
Table 8.3. Correlation Statistics Split by Age and Time Interval for the Dominant Hand. 212
Table 8.4. Correlation Statistics Split by Age and Time Interval for the Non-dominant Hand. 213
Table 8.5. ANOVA for Time Interval and Age for the Dominant Hand 213 Table 8.6. ANOVA for Time Interval and Age for the Non-Dominant
Hand. 214
xvi
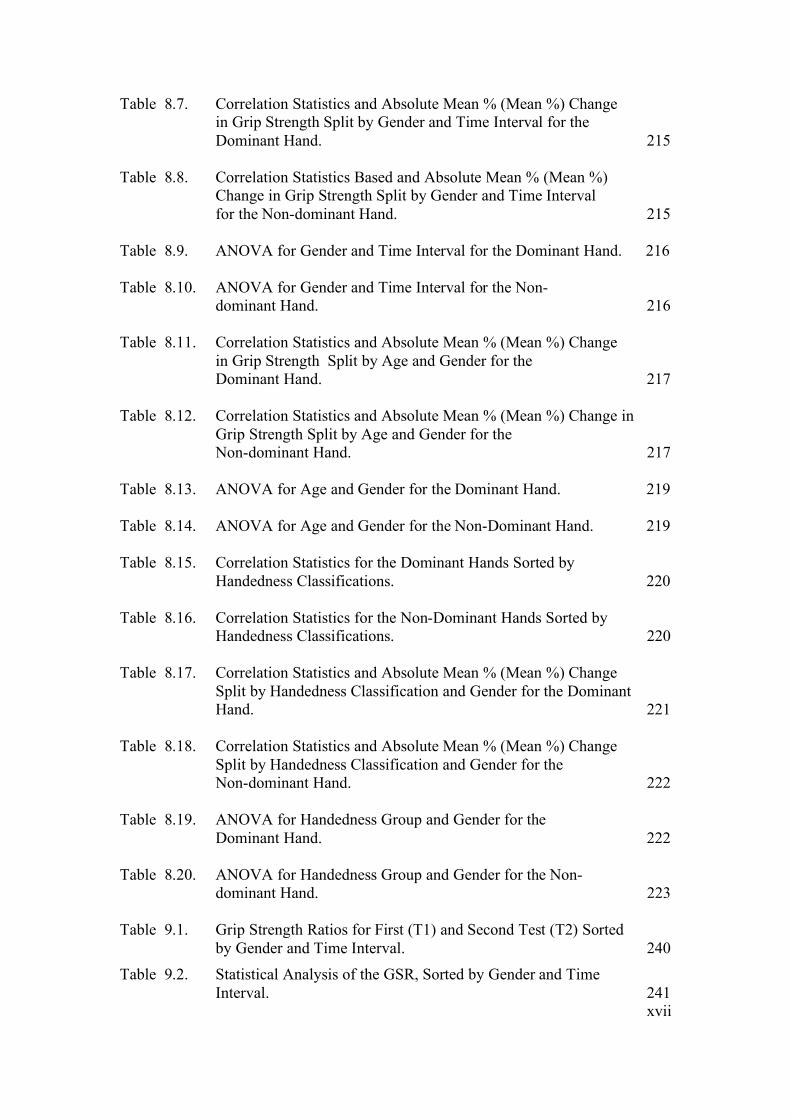
Table 8.7. Correlation Statistics and Absolute Mean % (Mean %) Change in Grip Strength Split by Gender and Time Interval for the Dominant Hand. 215
Table 8.8. Correlation Statistics Based and Absolute Mean % (Mean %) Change in Grip Strength Split by Gender and Time Interval for the Non-dominant Hand. 215
Table 8.9. ANOVA for Gender and Time Interval for the Dominant Hand. 216 Table 8.10. ANOVA for Gender and Time Interval for the Non-
dominant Hand. 216 Table 8.11. Correlation Statistics and Absolute Mean % (Mean %) Change
in Grip Strength Split by Age and Gender for the Dominant Hand. 217
Table 8.12. Correlation Statistics and Absolute Mean % (Mean %) Change in
Grip Strength Split by Age and Gender for the Non-dominant Hand. 217
Table 8.13. ANOVA for Age and Gender for the Dominant Hand. 219 Table 8.14. ANOVA for Age and Gender for the Non-Dominant Hand. 219 Table 8.15. Correlation Statistics for the Dominant Hands Sorted by
Handedness Classifications. 220 Table 8.16. Correlation Statistics for the Non-Dominant Hands Sorted by
Handedness Classifications. 220 Table 8.17. Correlation Statistics and Absolute Mean % (Mean %) Change
Split by Handedness Classification and Gender for the Dominant Hand. 221
Table 8.18. Correlation Statistics and Absolute Mean % (Mean %) Change
Split by Handedness Classification and Gender for the Non-dominant Hand. 222
Table 8.19. ANOVA for Handedness Group and Gender for the
Dominant Hand. 222 Table 8.20. ANOVA for Handedness Group and Gender for the Non-
dominant Hand. 223
Table 9.1. Grip Strength Ratios for First (T1) and Second Test (T2) Sorted by Gender and Time Interval. 240
Table 9.2. Statistical Analysis of the GSR, Sorted by Gender and Time Interval. 241
xvii

Table 9.3. Two-Way Independent Groups ANOVA for Gender and Time Interval for the GSR. 242
Table 9.4. Gender and Age Split GSR for T1 and T2. 243
Table 9.5 Statistical Analysis of the GSR, Sorted by Gender and Age. 244
Table 9.6. Two-Way Independent Groups ANOVA for Gender and Age for the GSR. 245
Table 10.1. Mean Width/Length (W/L) Ratios, SDs and Range for the
Original Male and Female Hand Shape Groups. 253 Table 10.2. Mean Width/Length (W/L) Ratios, SDs and Range for the
Reliability Sample of Male and Female Hand Shape Groups. 254 Table 10.3. Male and Female Mean (SD) Grip Strengths Sorted by
Dominance and Hand Shape. 255 Table 10.4. Mean (SD) Grip Strengths (kg f) Sorted by Dominance and
Hand Shape for Initial Test of Repeat-Tested Group With Standard Errors of Measurement (SEM) in kg f. 257
xviii

LIST OF FIGURES Figure 1.1 The cerebral cortex with the primary motor areas marked as
areas 6 and 4 respectively and the primary somatosensory areas marked as areas 1, 2 and 3. There is also some sensory representation in the motor area 4 (from Werner, 1980). View A is the lateral view of the cortex; view B is the medial view. 6
Figure 1.2 Sensory nerve distribution to the upper limbs (from Swanson,
de Groot Swanson & Göran-Hagert, 1995). 7 Figure 1.3 The tenodesis effect (from Brand & Hollister, 1999). 9 Figure 1.4 Distal ulnar palsy (from Tubiana et al., 1996). 10 Figure 1.5 Proximal ulnar palsy. Note the relative lack of deformity secondary
to paralysis of the long flexors (from Tubiana et al., 1996). 11
Figure 1.6 Figure A normal contact with a cylinder, Figure B contact only with the finger tips and the metacarpal heads (from Brand & Hollister, 1999). 12
Figure 1.7 Similarity between the sensory and motor homunculi (from Penfield & Rasmussen, 1968). 14
Figure 2.1 The dynamometer invented by Edme Régnier in 1798 and
used by Péron in his Australian experiments. From the original engraving accompanying Régnier’s work Description et usage du dynamomètre. S: position to test the muscular strength of the thighs; R: the hand-grip position to test the force of the grasp (from Pearn, 1978a). 29
Figure 2.2. Diagrammatic sketch of Régnier’s dynamometer
(from Hunsicker & Donnely, 1955). 30 Figure 2.3. Régnier’s dynamometer (from Pearn, 1978b). 30 Figure 2.4. Régnier’s dynamometer with attachments as it stands in
the Paris Musée de l’Armée (from Horne & Talbot, 2002). 30
Figure 2.5. George Tiemann dynamometer from www.collectmedicalantiques.com/potpourri2.html accessed 11/8/04. 34
Figure 2.6. Collin elliptical spring steel dynamometer (from Hunsicker & Donnelly, 1955). 35
Figure 2.7. Mathieu dynamometer (from Hammond 1876). 35
Figure 2.8. The Mathieu dynamograph (from Hammond 1868). 35 xix

Figure 2.9. Hammond dynamometer of 1891 (from Lanska, 2000). 36 Figure 2.10. The ergograph of Mosso (from Hunsicker & Donnelly, 1955). 39 Figure 2.11. Kellogg mercurial dynamometer (from Kellogg, 1893). 41 Figure 2.12. Kellogg mercurial dynamometer (from Hunsicker &
Donnelly, 1955). 41
Figure 2.13. Smedley/Stoelting dynamometer (from Hunsicker & Donnelly, 1955). 42
Figure 2.14. Water-filled dynamometer (from Hamilton, 1875). 43 Figure 2.15. Adapted cable tensiometer (from Bechtol, 1954). 45 Figure 2.16. The JamarTM dynamometer (from Bechtol, 1954). 45 Figure 2.17. Isometric tool to measure tangential and grasp forces when
gripping a cylinder (from Amis, 1987). 49 Figure 4.1 Child at 14 weeks gestation sucking thumb. This
image was taken by a sonographer who was able to view the sucking motions of the baby in real time on an ultrasound monitor. This picture is a side profile of the head, nose pointing upward and thumb in mouth, as indicated by the white arrow. 72
Figure 5.1. The author conducting testing in the school laboratory. 92 Figure 6.1. Number of response changes per task. 103 Figure 6.2. Percentage of teenagers and adults who stated that they were
comfortable performing these tasks with either hand. 105 Figure 7.1. Comparison of % of hand dominance groups
between the entire pool of teenagers and the grip strength tested teenagers. 153
Figure 7.2. Relationship between dominant (DomT1) and non-dominant handgrip strength (Non-domT1) in kilograms force (kg f) for the males. 186
Figure 7.3. Relationship between dominant (DomT1) and non-dominant handgrip strength (Non-domT1) in kilograms force (kg f) for the females. 186
Figure 7.4. Relationship between body mass index (BMI) and dominant
handgrip strength in kilograms force (DomT1) for all males. 188 xx

Figure 7.4. Relationship between body mass index (BMI) and dominant handgrip strength in kilograms force (DomT1) for all females. 188
Figure 9.1. Percentage close agreement for GSR sorted by gender
and time interval. 242
Figure 9.2. Percentage close agreement for GSR sorted by age and gender. 244 Figure 10.1. Mean grip strength and 95% CIs for males and females with six
different hand types. 254 Figure 10.2. Reliability indices (ICCs) and 95% CIs for handgrip test-retest
on males and females with six different hand types. 257
xxi

ABSTRACT
The aims of the Thesis were: to investigate and quantify the factors influencing the
production of maximum isometric grip strength force in a sample of Australian
teenagers when using JamarTM-like handgrip dynamometers; to determine the
reliability of this measure over long and short retest intervals; to establish a database
of anthropometric and strength values for this group and prediction equations for pre-
morbid strengths to aid assessment of recovery in those with upper limb pathologies.
The history of these handgrip dynamometers demonstrates that they have been
employed in one form or another for over three hundred years and are still widely
used today in hand rehabilitation and medical examinations. Many new types of
dynamometers have been constructed subsequent to the ubiquitous JamarTM and have
all been briefly reviewed here.
Handedness (dominance) was thought to be a possible factor influencing grip strength
performance and was later evaluated. But first, the Edinburgh Handedness Inventory
was tested with 658 teenagers and 64 adults and confirmed to be a valid tool for
assessing handedness. Its validity was improved by substituting the tasks of sweeping
and opening the lid of a box for hammering and use of a screwdriver. Its excellent
reliability (ICC = .78, p < 0.01) was confirmed with 45 teenagers and 45 adults.
There were 235 teenagers who performed maximal isometric grip strength tests and
from the results a local database was created. It was confirmed that the grip strength
difference in males and females becomes significant after the age of 13 years, and that
the average teenaged male is stronger than the average teenaged female by 11.2 Kg
force (p < .01). Height, weight, BMI, hand dimensions, past upper limb injuries,
degrees of handedness and exercise levels were measured and compared with known
norms to establish that the grip strength tested sample of teenagers was representative
of urban teenagers in Australia.
The influence of handedness on maximal grip strength in dominant and non-dominant
hands was unable to be completely ascertained due to the vast majority of the sample
xxii

of teenagers being right-handed. Only 13 of the 235 teenagers used their left hand for
most tasks, with another 20 using their left hands for a small majority of tasks. There
was a grip strength bias towards the dominant hand of 2.63 kg force (p < .01).
The most accurate way to predict the grip strength of one hand is by knowing the grip
strength of the other hand. Prediction models found that 90% (R2adj .902) and 70%
(R2adj .702) of the variance in one hand could be accounted for by the grip strength of
their other hand for male and female teenagers, respectively. Prediction equations
were also created to assist in estimating the pre-morbid grip strength of teenagers
suffering from bilateral hand injuries. If for the males, measurements for height and
hand surface area were entered into these models, the grip strength of the dominant
and non-dominant hands could be estimated with 62.6 and 63.5% of the variance
between the real and predicted scores accounted for, respectively. For the females the
prediction models using height and hand surface area could only account for 33.9 and
42.8% of the variances, with no other independent variables improving the prediction
equations.
The reliability of the maximal grip strength performance of 154 of these teenagers
was retested after one or four weeks. A number of sub-group permutations were
created for age, gender, retest time interval and handedness groups. The measures of
grip strength for males were highly reliable with ICC (3,1) values ranging from .91 to
.97. These measures were significantly higher than that obtained from the females,
where reliability values ranged from .69 to .83. Handedness played a significant part
in grip strength reliability. The dominant hand of right-handed teenagers achieved an
ICC (3,1) of .97, as contrasted with the non-dominant hand of left-handers who
attained a very poor ICC (3,1) of .27.
The shape of the hands of the males did not influence their grip strength or their
reliability values, which ranged from .954 to .973. The shape of female hands did not
affect their ability to generate maximal grip strength, only its reliability. The females
with hands shaped squarer-than-average had mean grip strength reliability values of
ICC (3,1) at only .48, in contrast to those with longer-than-average hands who
achieved a mean ICC (3,1) of .92. The handle shape of the dynamometer may
disadvantage square-handed females, and this should be further investigated. xxiii