energy: yesterday, today, and the opportunities and challenges of tomorrow
TRANSCRIPT

This article was downloaded by: [The University of British Columbia]On: 09 December 2014, At: 18:07Publisher: Taylor & FrancisInforma Ltd Registered in England and Wales Registered Number: 1072954 Registeredoffice: Mortimer House, 37-41 Mortimer Street, London W1T 3JH, UK
International Geology ReviewPublication details, including instructions for authors andsubscription information:http://www.tandfonline.com/loi/tigr20
Energy: Yesterday, Today, and theOpportunities and Challenges ofTomorrowSusan M. Landon aa Independent scholar, Denver, ColoradoPublished online: 14 Jul 2010.
To cite this article: Susan M. Landon (2002) Energy: Yesterday, Today, and the Opportunitiesand Challenges of Tomorrow, International Geology Review, 44:12, 1105-1114, DOI:10.2747/0020-6814.44.12.1105
To link to this article: http://dx.doi.org/10.2747/0020-6814.44.12.1105
PLEASE SCROLL DOWN FOR ARTICLE
Taylor & Francis makes every effort to ensure the accuracy of all the information (the“Content”) contained in the publications on our platform. However, Taylor & Francis,our agents, and our licensors make no representations or warranties whatsoever as tothe accuracy, completeness, or suitability for any purpose of the Content. Any opinionsand views expressed in this publication are the opinions and views of the authors,and are not the views of or endorsed by Taylor & Francis. The accuracy of the Contentshould not be relied upon and should be independently verified with primary sourcesof information. Taylor and Francis shall not be liable for any losses, actions, claims,proceedings, demands, costs, expenses, damages, and other liabilities whatsoever orhowsoever caused arising directly or indirectly in connection with, in relation to or arisingout of the use of the Content.
This article may be used for research, teaching, and private study purposes. Anysubstantial or systematic reproduction, redistribution, reselling, loan, sub-licensing,systematic supply, or distribution in any form to anyone is expressly forbidden. Terms &Conditions of access and use can be found at http://www.tandfonline.com/page/terms-and-conditions

1105
International Geology Review, Vol. 44, 2002, p. 1105–1114.Copyright © 2002 by V. H. Winston & Son, Inc. All rights reserved.
0020-6814/02/634/1105-10 $10.00
Energy: Yesterday, Today, and the Opportunitiesand Challenges of Tomorrow
SUSAN M. LANDON1
Petroleum Geologist, 1410 High Street, Denver, Colorado 80218
Abstract
As energy consumption has increased over the past 200 years, energy fuels have become cleanerand consumption more efficient. Fossil fuels currently supply approximately 85% of the energyneeds of the world and 80% of the energy needs of the United States. Crude oil, a transportation fuel,supplies about 40% of the energy needs of the U.S., with 56% imported from other nations. Naturalgas and coal each supply nearly a quarter of our energy needs. Half of the nation’s electricity isproduced from coal. Renewable sources including hydropower, geothermal, solar, and wind provideless than 7% of our domestic energy. The remaining 8% is supplied by nuclear power.
Because of our dependence on fossil fuels, the elaborate infrastructure that has been built toproduce, process, and transport these fuels and their products, and the political environment, atransition to other energy sources will not occur before the middle of the 21st century. Moderateprices for fossil fuels will also slow transition to the next energy source. Demand for fossil fuels,especially natural gas, will continue to increase. Hydrogen is currently the dominant candidate forthe first carbon-free fuel and many are working on the transition to hydrogen-based fuel technolo-gies. Based on the existing infrastructure, costs, and availability, natural gas is a logical initialsource for hydrogen. In the transition to an affordable, efficient, reliable, environmentally morebenign, nearly carbon-free energy economy, substantial demand will continue to exist for crude oil,natural gas, and coal, even as they are phased out.
Introduction
AN UNDERSTANDING OF the historical sources ofenergy and energy usage is an important foundationfor any discussion of energy. Also, an appreciationof the current patterns of consumption and the esti-mated remaining resource base is required beforeany projections of future sources and demand can bemade. Controls on energy sources, costs, and usageinclude elements of science, technology, economics,public perception, and politics. Energy and itsimpacts are global issues, and to understand theenergy picture of the United States and especiallyfuture projections of sources and demand, energymust be viewed within a global context. Currentlythe world depends on fossil fuels (coal, crude oil,and natural gas) and an elaborate infrastructure is inplace to produce, process, and transport energy fromthese fuels. In the United States, roughly 80% of ourenergy needs are met by fossil fuels, worldwideabout 85%. Approximately 9% of the world’s energyconsumption is currently supplied by renewableenergy sources.
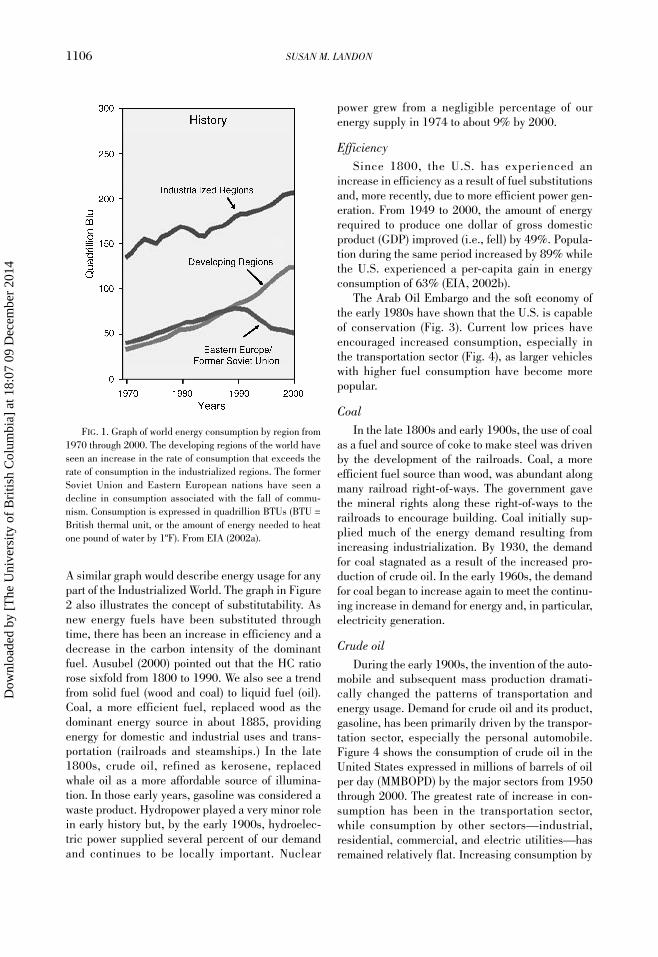
World energy consumption is increasing (Fig. 1).Energy use is generally tied to industrialization andpopulation growth. From 1970 through 2000, energyconsumption has risen most steeply for the develop-ing regions, where industrialization is progressingand population growth rates are high. EasternEurope and the former Soviet Union have actuallyshown a major decline in consumption as a result ofthe fall of the Soviet government and the resultinginstability, although this trend is projected tochange as a result of the strengthening of theseeconomies.
For current statistics on energy, the Energy Infor-mation Agency (EIA) at the U.S. Department ofEnergy (DOE) has an exce l l en t webs i te :www.eia.doe.gov. Most of the statistics included inthis paper were obtained from the EIA website.
Yesterday: Historical View
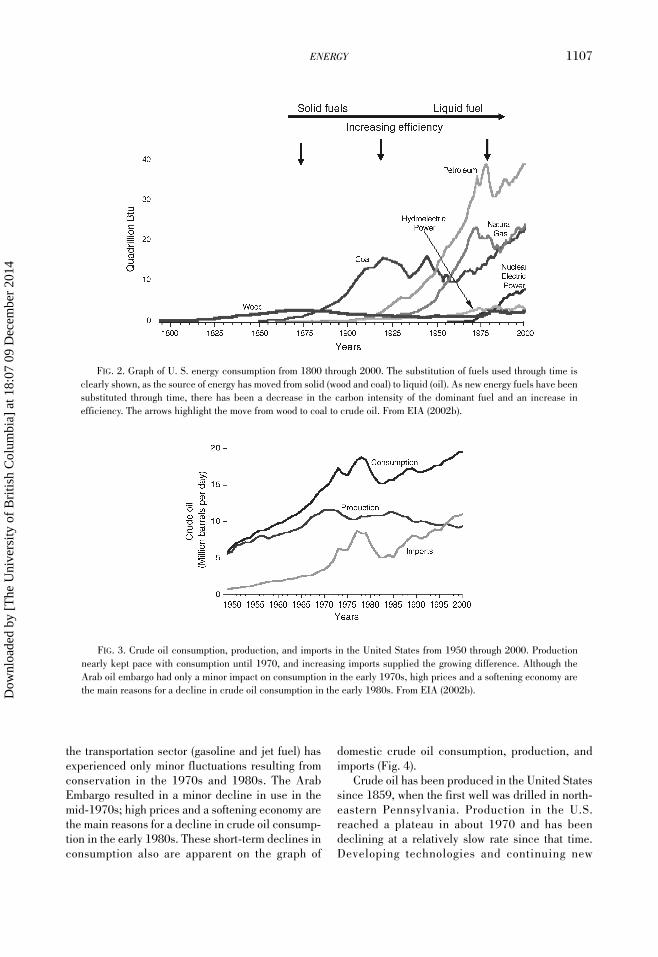
Figure 2 shows energy consumption in theUnited States from 1800 through 2000 in quadril-lion Btu for various types of fuel. The increase inenergy used through time resulting from industrial-ization and population growth is clearly illustrated.1E-mail: [email protected]
Dow
nloa
ded
by [
The
Uni
vers
ity o
f B
ritis
h C
olum
bia]
at 1
8:07
09
Dec
embe
r 20
14
1106 SUSAN M. LANDON
A similar graph would describe energy usage for anypart of the Industrialized World. The graph in Figure2 also illustrates the concept of substitutability. Asnew energy fuels have been substituted throughtime, there has been an increase in efficiency and adecrease in the carbon intensity of the dominantfuel. Ausubel (2000) pointed out that the HC ratiorose sixfold from 1800 to 1990. We also see a trendfrom solid fuel (wood and coal) to liquid fuel (oil).Coal, a more efficient fuel, replaced wood as thedominant energy source in about 1885, providingenergy for domestic and industrial uses and trans-portation (railroads and steamships.) In the late1800s, crude oil, refined as kerosene, replacedwhale oil as a more affordable source of illumina-tion. In those early years, gasoline was considered awaste product. Hydropower played a very minor rolein early history but, by the early 1900s, hydroelec-tric power supplied several percent of our demandand continues to be locally important. Nuclear
power grew from a negligible percentage of ourenergy supply in 1974 to about 9% by 2000.
EfficiencySince 1800, the U.S. has experienced an
increase in efficiency as a result of fuel substitutionsand, more recently, due to more efficient power gen-eration. From 1949 to 2000, the amount of energyrequired to produce one dollar of gross domesticproduct (GDP) improved (i.e., fell) by 49%. Popula-tion during the same period increased by 89% whilethe U.S. experienced a per-capita gain in energyconsumption of 63% (EIA, 2002b).
The Arab Oil Embargo and the soft economy ofthe early 1980s have shown that the U.S. is capableof conservation (Fig. 3). Current low prices haveencouraged increased consumption, especially inthe transportation sector (Fig. 4), as larger vehicleswith higher fuel consumption have become morepopular.
CoalIn the late 1800s and early 1900s, the use of coal
as a fuel and source of coke to make steel was drivenby the development of the railroads. Coal, a moreefficient fuel source than wood, was abundant alongmany railroad right-of-ways. The government gavethe mineral rights along these right-of-ways to therailroads to encourage building. Coal initially sup-plied much of the energy demand resulting fromincreasing industrialization. By 1930, the demandfor coal stagnated as a result of the increased pro-duction of crude oil. In the early 1960s, the demandfor coal began to increase again to meet the continu-ing increase in demand for energy and, in particular,electricity generation.
Crude oilDuring the early 1900s, the invention of the auto-
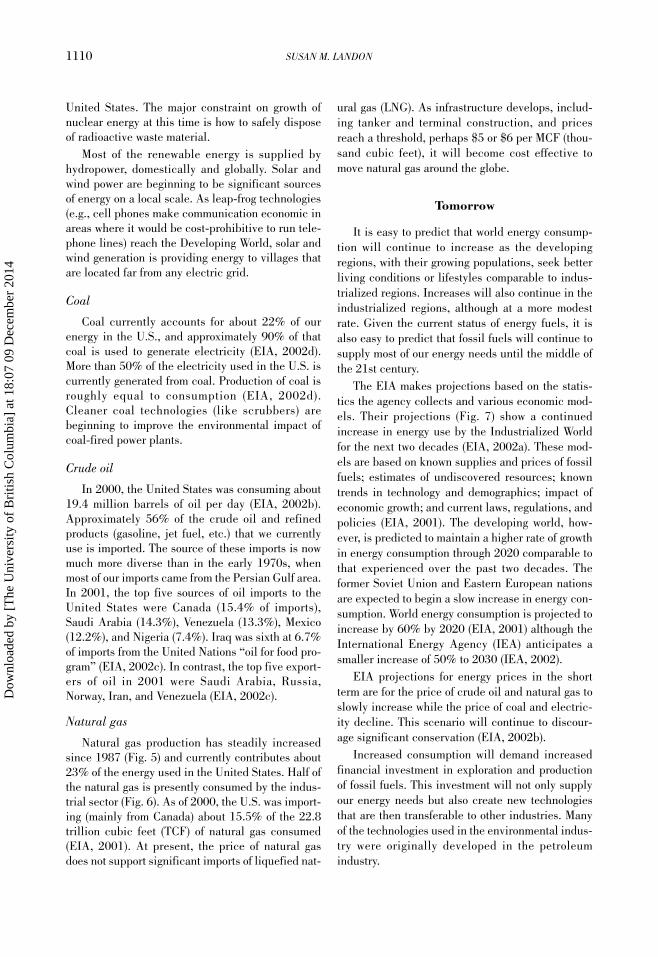
mobile and subsequent mass production dramati-cally changed the patterns of transportation andenergy usage. Demand for crude oil and its product,gasoline, has been primarily driven by the transpor-tation sector, especially the personal automobile.Figure 4 shows the consumption of crude oil in theUnited States expressed in millions of barrels of oilper day (MMBOPD) by the major sectors from 1950through 2000. The greatest rate of increase in con-sumption has been in the transportation sector,while consumption by other sectors—industrial,residential, commercial, and electric utilities—hasremained relatively flat. Increasing consumption by
FIG. 1. Graph of world energy consumption by region from1970 through 2000. The developing regions of the world haveseen an increase in the rate of consumption that exceeds therate of consumption in the industrialized regions. The formerSoviet Union and Eastern European nations have seen adecline in consumption associated with the fall of commu-nism. Consumption is expressed in quadrillion BTUs (BTU =British thermal unit, or the amount of energy needed to heatone pound of water by 1ºF). From EIA (2002a).
Dow
nloa
ded
by [
The
Uni
vers
ity o
f B
ritis
h C
olum
bia]
at 1
8:07
09
Dec
embe
r 20
14
ENERGY 1107
the transportation sector (gasoline and jet fuel) hasexperienced only minor fluctuations resulting fromconservation in the 1970s and 1980s. The ArabEmbargo resulted in a minor decline in use in themid-1970s; high prices and a softening economy arethe main reasons for a decline in crude oil consump-tion in the early 1980s. These short-term declines inconsumption also are apparent on the graph of
domestic crude oil consumption, production, andimports (Fig. 4).
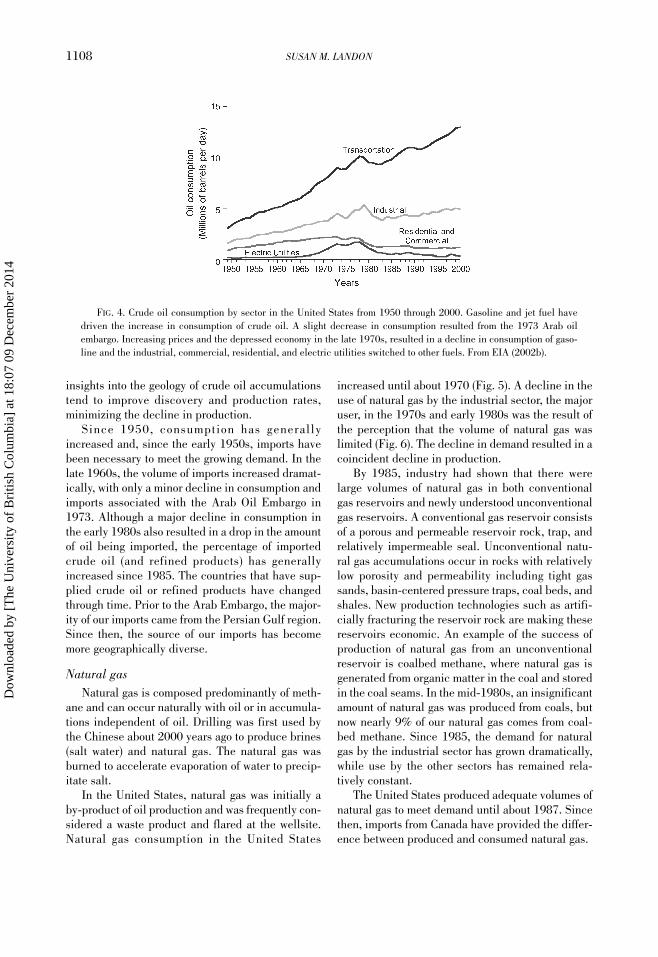
Crude oil has been produced in the United Statessince 1859, when the first well was drilled in north-eastern Pennsylvania. Production in the U.S.reached a plateau in about 1970 and has beendeclining at a relatively slow rate since that time.Developing technologies and continuing new
FIG. 2. Graph of U. S. energy consumption from 1800 through 2000. The substitution of fuels used through time isclearly shown, as the source of energy has moved from solid (wood and coal) to liquid (oil). As new energy fuels have beensubstituted through time, there has been a decrease in the carbon intensity of the dominant fuel and an increase inefficiency. The arrows highlight the move from wood to coal to crude oil. From EIA (2002b).
FIG. 3. Crude oil consumption, production, and imports in the United States from 1950 through 2000. Productionnearly kept pace with consumption until 1970, and increasing imports supplied the growing difference. Although theArab oil embargo had only a minor impact on consumption in the early 1970s, high prices and a softening economy arethe main reasons for a decline in crude oil consumption in the early 1980s. From EIA (2002b).D
ownl
oade
d by
[T
he U
nive
rsity
of
Bri
tish
Col
umbi
a] a
t 18:
07 0
9 D
ecem
ber
2014
1108 SUSAN M. LANDON
insights into the geology of crude oil accumulationstend to improve discovery and production rates,minimizing the decline in production.
Since 1950, consumption has generallyincreased and, since the early 1950s, imports havebeen necessary to meet the growing demand. In thelate 1960s, the volume of imports increased dramat-ically, with only a minor decline in consumption andimports associated with the Arab Oil Embargo in1973. Although a major decline in consumption inthe early 1980s also resulted in a drop in the amountof oil being imported, the percentage of importedcrude oil (and refined products) has generallyincreased since 1985. The countries that have sup-plied crude oil or refined products have changedthrough time. Prior to the Arab Embargo, the major-ity of our imports came from the Persian Gulf region.Since then, the source of our imports has becomemore geographically diverse.
Natural gasNatural gas is composed predominantly of meth-
ane and can occur naturally with oil or in accumula-tions independent of oil. Drilling was first used bythe Chinese about 2000 years ago to produce brines(salt water) and natural gas. The natural gas wasburned to accelerate evaporation of water to precip-itate salt.
In the United States, natural gas was initially aby-product of oil production and was frequently con-sidered a waste product and flared at the wellsite.Natural gas consumption in the United States
increased until about 1970 (Fig. 5). A decline in theuse of natural gas by the industrial sector, the majoruser, in the 1970s and early 1980s was the result ofthe perception that the volume of natural gas waslimited (Fig. 6). The decline in demand resulted in acoincident decline in production.
By 1985, industry had shown that there werelarge volumes of natural gas in both conventionalgas reservoirs and newly understood unconventionalgas reservoirs. A conventional gas reservoir consistsof a porous and permeable reservoir rock, trap, andrelatively impermeable seal. Unconventional natu-ral gas accumulations occur in rocks with relativelylow porosity and permeability including tight gassands, basin-centered pressure traps, coal beds, andshales. New production technologies such as artifi-cially fracturing the reservoir rock are making thesereservoirs economic. An example of the success ofproduction of natural gas from an unconventionalreservoir is coalbed methane, where natural gas isgenerated from organic matter in the coal and storedin the coal seams. In the mid-1980s, an insignificantamount of natural gas was produced from coals, butnow nearly 9% of our natural gas comes from coal-bed methane. Since 1985, the demand for naturalgas by the industrial sector has grown dramatically,while use by the other sectors has remained rela-tively constant.
The United States produced adequate volumes ofnatural gas to meet demand until about 1987. Sincethen, imports from Canada have provided the differ-ence between produced and consumed natural gas.
FIG. 4. Crude oil consumption by sector in the United States from 1950 through 2000. Gasoline and jet fuel havedriven the increase in consumption of crude oil. A slight decrease in consumption resulted from the 1973 Arab oilembargo. Increasing prices and the depressed economy in the late 1970s, resulted in a decline in consumption of gaso-line and the industrial, commercial, residential, and electric utilities switched to other fuels. From EIA (2002b).
Dow
nloa
ded
by [
The
Uni
vers
ity o
f B
ritis
h C
olum
bia]
at 1
8:07
09
Dec
embe
r 20
14

ENERGY 1109
FIG. 5. Natural gas consumption, production, and imports in the United States from 1950 through 2000. Productionand consumption of natural gas tracked well until increasing demand in ca. 1985 resulted in an increase in imports.From EIA (2002b).
FIG. 6. Natural gas consumption by sector in the United States from 1950 through 2000. Natural gas consumption hasbeen dominated by the industrial sector. In the early 1970s, the perception of a limited natural gas resource base resultedin many industrial uses switching to other fuel sources, with a dramatic decline in consumption. Since the late 1980s,this trend has reversed and consumption has grown. Since 1970, usage by other sectors has been relatively consistent.From EIA (2002b).
Today: Current Energy Picture
Fossil fuels are the dominant energy source inthe world. Since 1900, an elaborate infrastructurehas been constructed to produce, refine or process,transport, and market the products from fossil fuels.Currently, fossil fuels provide about 85% of theworld needs and 80% of the energy needs of theUnited States. Today, domestic energy is supplied asfollows: crude oil 39%; natural gas 23%; coal 22%;nuclear 9%; and renewable sources 7% (EIA,2002b).
The distinctions between crude oil and naturalgas are important. Crude oil is a transportation fuel.
The refining process is designed to optimize thevolumes of gasoline and jet fuel obtained from eachbarrel of crude oil. As a liquid, crude oil is easilytransported by a variety of mechanisms includingocean-going tankers and, therefore, is a global com-modity. Natural gas, in contrast, is used for homeheating, manufacturing, and electricity generation.Transportation of natural gas other than by pipelineis more difficult; therefore, natural gas is, at currentprices, a domestic commodity.
Nuclear and renewable energy sourcesAs noted above, nuclear energy currently suppliesonly about 9% of the energy consumed in the
Dow
nloa
ded
by [
The
Uni
vers
ity o
f B
ritis
h C
olum
bia]
at 1
8:07
09
Dec
embe
r 20
14
1110 SUSAN M. LANDON
United States. The major constraint on growth ofnuclear energy at this time is how to safely disposeof radioactive waste material.
Most of the renewable energy is supplied byhydropower, domestically and globally. Solar andwind power are beginning to be significant sourcesof energy on a local scale. As leap-frog technologies(e.g., cell phones make communication economic inareas where it would be cost-prohibitive to run tele-phone lines) reach the Developing World, solar andwind generation is providing energy to villages thatare located far from any electric grid.
Coal
Coal currently accounts for about 22% of ourenergy in the U.S., and approximately 90% of thatcoal is used to generate electricity (EIA, 2002d).More than 50% of the electricity used in the U.S. iscurrently generated from coal. Production of coal isroughly equal to consumption (EIA, 2002d).Cleaner coal technologies (like scrubbers) arebeginning to improve the environmental impact ofcoal-fired power plants.
Crude oil
In 2000, the United States was consuming about19.4 million barrels of oil per day (EIA, 2002b).Approximately 56% of the crude oil and refinedproducts (gasoline, jet fuel, etc.) that we currentlyuse is imported. The source of these imports is nowmuch more diverse than in the early 1970s, whenmost of our imports came from the Persian Gulf area.In 2001, the top five sources of oil imports to theUnited States were Canada (15.4% of imports),Saudi Arabia (14.3%), Venezuela (13.3%), Mexico(12.2%), and Nigeria (7.4%). Iraq was sixth at 6.7%of imports from the United Nations “oil for food pro-gram” (EIA, 2002c). In contrast, the top five export-ers of oil in 2001 were Saudi Arabia, Russia,Norway, Iran, and Venezuela (EIA, 2002c).
Natural gas
Natural gas production has steadily increasedsince 1987 (Fig. 5) and currently contributes about23% of the energy used in the United States. Half ofthe natural gas is presently consumed by the indus-trial sector (Fig. 6). As of 2000, the U.S. was import-ing (mainly from Canada) about 15.5% of the 22.8trillion cubic feet (TCF) of natural gas consumed(EIA, 2001). At present, the price of natural gasdoes not support significant imports of liquefied nat-
ural gas (LNG). As infrastructure develops, includ-ing tanker and terminal construction, and pricesreach a threshold, perhaps $5 or $6 per MCF (thou-sand cubic feet), it will become cost effective tomove natural gas around the globe.
Tomorrow
It is easy to predict that world energy consump-tion will continue to increase as the developingregions, with their growing populations, seek betterliving conditions or lifestyles comparable to indus-trialized regions. Increases will also continue in theindustrialized regions, although at a more modestrate. Given the current status of energy fuels, it isalso easy to predict that fossil fuels will continue tosupply most of our energy needs until the middle ofthe 21st century.
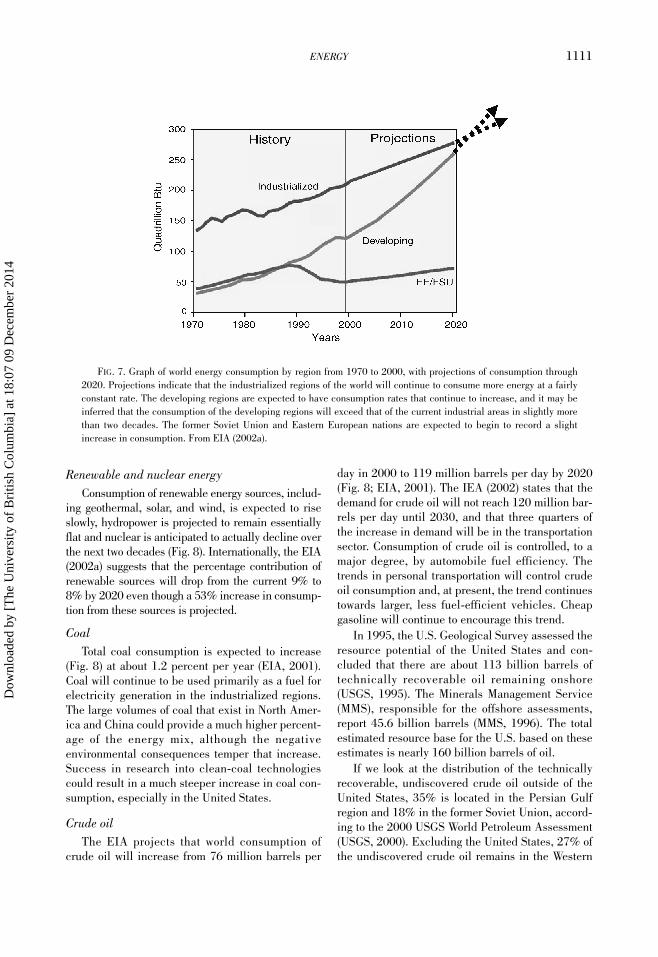
The EIA makes projections based on the statis-tics the agency collects and various economic mod-els. Their projections (Fig. 7) show a continuedincrease in energy use by the Industrialized Worldfor the next two decades (EIA, 2002a). These mod-els are based on known supplies and prices of fossilfuels; estimates of undiscovered resources; knowntrends in technology and demographics; impact ofeconomic growth; and current laws, regulations, andpolicies (EIA, 2001). The developing world, how-ever, is predicted to maintain a higher rate of growthin energy consumption through 2020 comparable tothat experienced over the past two decades. Theformer Soviet Union and Eastern European nationsare expected to begin a slow increase in energy con-sumption. World energy consumption is projected toincrease by 60% by 2020 (EIA, 2001) although theInternational Energy Agency (IEA) anticipates asmaller increase of 50% to 2030 (IEA, 2002).
EIA projections for energy prices in the shortterm are for the price of crude oil and natural gas toslowly increase while the price of coal and electric-ity decline. This scenario will continue to discour-age significant conservation (EIA, 2002b).
Increased consumption will demand increasedfinancial investment in exploration and productionof fossil fuels. This investment will not only supplyour energy needs but also create new technologiesthat are then transferable to other industries. Manyof the technologies used in the environmental indus-try were originally developed in the petroleumindustry.
Dow
nloa
ded
by [
The
Uni
vers
ity o
f B
ritis
h C
olum
bia]
at 1
8:07
09
Dec
embe
r 20
14
ENERGY 1111
Renewable and nuclear energy Consumption of renewable energy sources, includ-
ing geothermal, solar, and wind, is expected to riseslowly, hydropower is projected to remain essentiallyflat and nuclear is anticipated to actually decline overthe next two decades (Fig. 8). Internationally, the EIA(2002a) suggests that the percentage contribution ofrenewable sources will drop from the current 9% to8% by 2020 even though a 53% increase in consump-tion from these sources is projected.
CoalTotal coal consumption is expected to increase
(Fig. 8) at about 1.2 percent per year (EIA, 2001).Coal will continue to be used primarily as a fuel forelectricity generation in the industrialized regions.The large volumes of coal that exist in North Amer-ica and China could provide a much higher percent-age of the energy mix, although the negativeenvironmental consequences temper that increase.Success in research into clean-coal technologiescould result in a much steeper increase in coal con-sumption, especially in the United States.
Crude oilThe EIA projects that world consumption of
crude oil will increase from 76 million barrels per
day in 2000 to 119 million barrels per day by 2020(Fig. 8; EIA, 2001). The IEA (2002) states that thedemand for crude oil will not reach 120 million bar-rels per day until 2030, and that three quarters ofthe increase in demand will be in the transportationsector. Consumption of crude oil is controlled, to amajor degree, by automobile fuel efficiency. Thetrends in personal transportation will control crudeoil consumption and, at present, the trend continuestowards larger, less fuel-efficient vehicles. Cheapgasoline will continue to encourage this trend.
In 1995, the U.S. Geological Survey assessed theresource potential of the United States and con-cluded that there are about 113 billion barrels oftechnically recoverable oil remaining onshore(USGS, 1995). The Minerals Management Service(MMS), responsible for the offshore assessments,report 45.6 billion barrels (MMS, 1996). The totalestimated resource base for the U.S. based on theseestimates is nearly 160 billion barrels of oil.
If we look at the distribution of the technicallyrecoverable, undiscovered crude oil outside of theUnited States, 35% is located in the Persian Gulfregion and 18% in the former Soviet Union, accord-ing to the 2000 USGS World Petroleum Assessment(USGS, 2000). Excluding the United States, 27% ofthe undiscovered crude oil remains in the Western
FIG. 7. Graph of world energy consumption by region from 1970 to 2000, with projections of consumption through2020. Projections indicate that the industrialized regions of the world will continue to consume more energy at a fairlyconstant rate. The developing regions are expected to have consumption rates that continue to increase, and it may beinferred that the consumption of the developing regions will exceed that of the current industrial areas in slightly morethan two decades. The former Soviet Union and Eastern European nations are expected to begin to record a slightincrease in consumption. From EIA (2002a).
Dow
nloa
ded
by [
The
Uni
vers
ity o
f B
ritis
h C
olum
bia]
at 1
8:07
09
Dec
embe
r 20
14
1112 SUSAN M. LANDON
Hemisphere (ibid.). The USGS estimates that theworld total volume of undiscovered oil technicallyrecoverable under current technologies and pricesis about 649 billion barrels with a potential reservegrowth of 612 billion barrels for a total of 1261 bil-lion barrels of (USGS, 2000). Reserve growth is thevolume of oil known to occur in existing fields thatwill be recoverable with new production technolo-gies. Remaining reserves, reserve growth, andundiscovered recoverable resources are estimated tototal 2.28 trillion barrels of crude oil remaining inthe world, according to Ahlbrandt and McCabe(2002).
Natural gasNatural gas will continue to supply an increasing
percentage of our energy demand, both in theUnited States and globally. As a relatively abundantand more environmentally benign resource, naturalgas consumption will grow in the U.S. (Fig. 8) atabout 2% per year from 22.8 to 33.8 TCF. Thatincrease can be compared to the projected 1.2%increase in coal consumption. Natural gas consump-tion as expressed by BTUs surpassed coal consump-tion in 1999 and the EIA predicts that by 2020,natural gas consumption will exceed that of coal by38%.
Currently, the U.S. imports about 15.5% but theIEA predicts that by 2030, the U.S. will importabout 26% of the natural gas consumed. Worldwide,
the IEA (2002) projects a doubling in the use of nat-ural gas by 2030, exceeding 160 TCF.
The USGS (1995) has estimated that there isabout 1074 TCF of technically recoverable domesticnatural gas onshore. Another very large contributionwill come from the Gulf of Mexico, where significantgas discoveries continue to add to our knownreserves. Including conservative numbers for theoffshore (MMS, 1996) brings the total U.S. undis-covered resource base to over 1400 TCF. Other verylarge sources of natural gas are not included in theseestimates, such as methane hydrates that are not yettechnically accessible, and other accumulations notas yet geologically understood.
Worldwide, outside of the United States, theUSGS estimates that the undiscovered volume oftechnically recoverable natural gas is about 4669TCF. More than half (64%) of this resource base is inthe former Soviet Union and the Middle East andNorth Africa (USGS, 2000). Adding these numbersto the U.S. resource base gives a total current esti-mate of over 6000 TCF of undiscovered natural gasin the world.
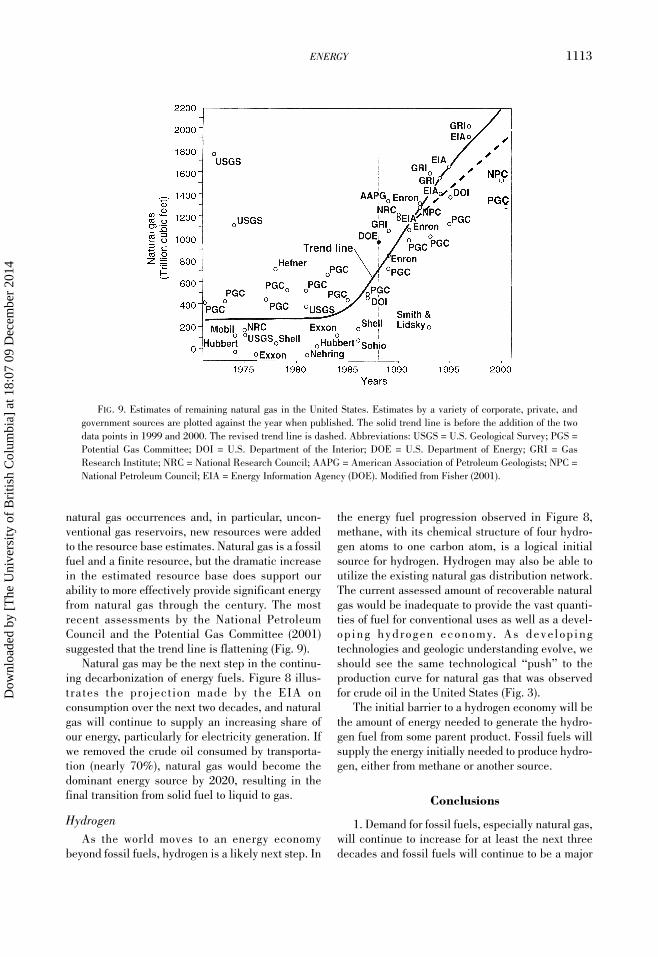
Figure 9 is a graph created by Fisher (2002) doc-umenting various natural gas resource estimatessince 1970 for the U.S. As stated earlier, there was aperception before about 1985 that natural gas was alimited resource and this is reflected in the consis-tent average estimates of about 300 TCF until thelate 1980s. As the industry learned more about
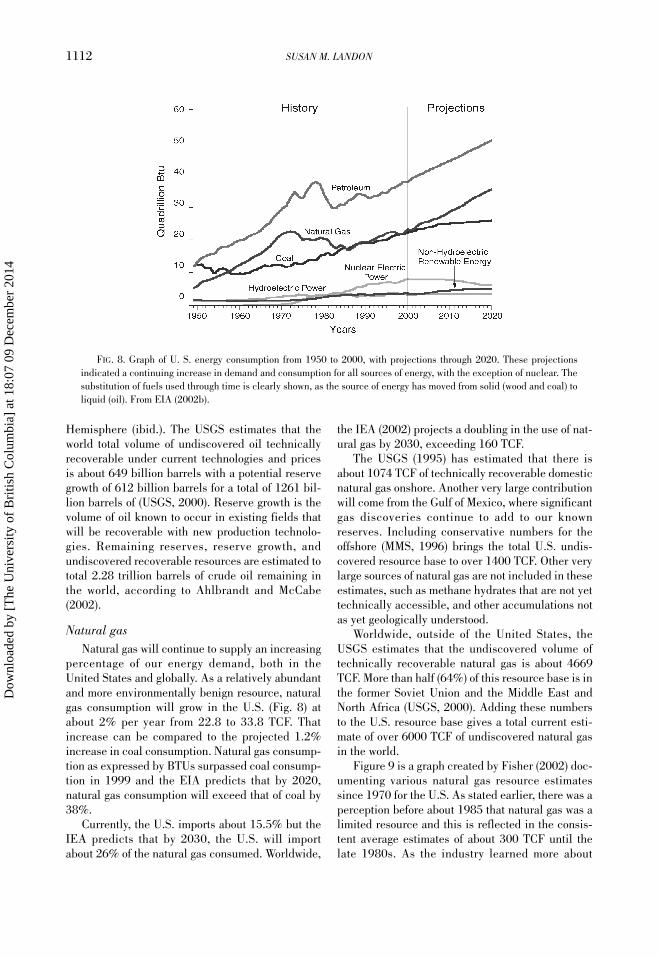
FIG. 8. Graph of U. S. energy consumption from 1950 to 2000, with projections through 2020. These projectionsindicated a continuing increase in demand and consumption for all sources of energy, with the exception of nuclear. Thesubstitution of fuels used through time is clearly shown, as the source of energy has moved from solid (wood and coal) toliquid (oil). From EIA (2002b).
Dow
nloa
ded
by [
The
Uni
vers
ity o
f B
ritis
h C
olum
bia]
at 1
8:07
09
Dec
embe
r 20
14
ENERGY 1113
natural gas occurrences and, in particular, uncon-ventional gas reservoirs, new resources were addedto the resource base estimates. Natural gas is a fossilfuel and a finite resource, but the dramatic increasein the estimated resource base does support ourability to more effectively provide significant energyfrom natural gas through the century. The mostrecent assessments by the National PetroleumCouncil and the Potential Gas Committee (2001)suggested that the trend line is flattening (Fig. 9).
Natural gas may be the next step in the continu-ing decarbonization of energy fuels. Figure 8 illus-trates the projection made by the EIA onconsumption over the next two decades, and naturalgas will continue to supply an increasing share ofour energy, particularly for electricity generation. Ifwe removed the crude oil consumed by transporta-tion (nearly 70%), natural gas would become thedominant energy source by 2020, resulting in thefinal transition from solid fuel to liquid to gas.
HydrogenAs the world moves to an energy economy
beyond fossil fuels, hydrogen is a likely next step. In
the energy fuel progression observed in Figure 8,methane, with its chemical structure of four hydro-gen atoms to one carbon atom, is a logical initialsource for hydrogen. Hydrogen may also be able toutilize the existing natural gas distribution network.The current assessed amount of recoverable naturalgas would be inadequate to provide the vast quanti-ties of fuel for conventional uses as well as a devel-oping hydrogen economy. As develop ingtechnologies and geologic understanding evolve, weshould see the same technological “push” to theproduction curve for natural gas that was observedfor crude oil in the United States (Fig. 3).
The initial barrier to a hydrogen economy will bethe amount of energy needed to generate the hydro-gen fuel from some parent product. Fossil fuels willsupply the energy initially needed to produce hydro-gen, either from methane or another source.
Conclusions
1. Demand for fossil fuels, especially natural gas,will continue to increase for at least the next threedecades and fossil fuels will continue to be a major
FIG. 9. Estimates of remaining natural gas in the United States. Estimates by a variety of corporate, private, andgovernment sources are plotted against the year when published. The solid trend line is before the addition of the twodata points in 1999 and 2000. The revised trend line is dashed. Abbreviations: USGS = U.S. Geological Survey; PGS =Potential Gas Committee; DOI = U.S. Department of the Interior; DOE = U.S. Department of Energy; GRI = GasResearch Institute; NRC = National Research Council; AAPG = American Association of Petroleum Geologists; NPC =National Petroleum Council; EIA = Energy Information Agency (DOE). Modified from Fisher (2001).
Dow
nloa
ded
by [
The
Uni
vers
ity o
f B
ritis
h C
olum
bia]
at 1
8:07
09
Dec
embe
r 20
14

1114 SUSAN M. LANDON
contributor to the energy mix until the second half ofthe 21st century.
2. The extensive infrastructure associated withfossil fuels, moderate prices, and the availableresource base will encourage their continued use.
3. Natural gas will experience the greatestincrease in consumption, initially as a result ofavailability, cost, and reduced environmentalimpact.
4. The investment that will be required for explo-ration and production of undiscovered resourceswill provide new technologies to other industries.
5. Improved efficiency and conservation must beviewed as a resource.
6. As a shift to a hydrogen economy occurs,methane, the major component of natural gas, willbe one of the most likely initial sources of hydrogenfuel.
Although my crystal ball is foggy, I believe thatfossil fuels will be a dominant contributor of energythrough the first half of the 21st century, based onpolitics at both a global and domestic level, existingand yet to be developed technology, new geologicunderstanding, population growth, continued indus-trialization, and the existing resource base. Naturalgas will continue to provide a significant portion ofour energy needs throughout the century as the tran-sition to an ideal energy source is achieved.
Another strong support of the continued domi-nance of fossil fuels is the lack of a viable alterna-t ive on the hor izon …yet . Technolog ica lbreakthroughs have occurred with regularitythroughout our history, and there is reason to believethat new technologies are just over the horizon.
Acknowledgments
The foundations for this article were developedas a paper presented at a symposium sponsored bythe U.S. National Committee for the Geological Sci-ences at the American Geophysical Union meetingin Washington, DC in May 2002. In October 2001,the National Academy of Engineering convened aWorkshop on current and emerging energy issues,and those discussions were the original inspiration
for the AGU presentation and this paper. Discus-sions with Bill Fisher have always been helpful. Iwould like to thank Mark Longman, Dick Dietz,Paul Belanger, and several others for reviewing var-ious versions of the manuscript. Any errors, how-ever, are my own.
REFERENCES
Ahlbrandt, T. S., and McCabe, P. J., 2002, Global petro-leum resources: A view to the future: Geotimes, v. 47,no. 11, p. 14–18.
Ausubel, J. H., 2000, Where is energy going?: The Indus-trial Physicist, February 2000, p. 16–19.
EIA (Energy Information Agency), 2001, Annual energyoutlook 2002 with projections to 2020: Washington,DC: DOE/EIA-0383 [www.eia.doe.gov/oiaf/ieo/index.html] (accessed April 2002).
______, 2002a, International energy outlook 2002, Wash-ington, DC: EIA, DOE/EIA-0484 [www.eia.doe.gov/oiaf/ieo/index.html] (accessed March 26, 2002).
______, 2002b, Energy in the United States: 1635-2000:Washington, DC: EIA [www.eia.doe.gov/emeu/aer/eh/outlook.html] (accessed April 2002).
______, 2002c, Energy situation analysis report: Wash-ington, DC: EIA [www.eia.doe.gov/emeu/security/esar/esar.html] (accessed April 2002).
______, 2002d, Coal quick stats: Washington, DC: EIA[www.eia.doe.gov/neic/quickfacts/quickcoal.html](accessed October 2002).
Fisher, W. L., 2002, Domestic natural gas: The comingmethane economy: Geotimes, v. 47, no. 11, p. 20–22.
Minerals Management Service, 1996, An assessment ofthe undiscovered hydrocarbon potential of the Nation’souter continental shelf: Washington, DC, OCS ReportMMS 96-0034, 40 p.
IEA: World energy demand to grow briskly to 2030: Oiland Gas Journal, October 14, 2002. p. 36–38.
Potential Gas Committee, 2001, Report of the PotentialGas Committee—potential supply of natural gas in theUnited States:: Golden, CO, Colorado School of Mines,346 p.
United States Geological Survey, 1995, 1995 Nationalassessment of United States oil and gas resources: U.S.Geological Survey Circular 1118, 20 p.
______, 2000, World petroleum assessment 2000: USGSDigital Data Series DDS-60.
Dow
nloa
ded
by [
The
Uni
vers
ity o
f B
ritis
h C
olum
bia]
at 1
8:07
09
Dec
embe
r 20
14