energy consumption and comfort analysis for different low- energy cooling systems in a mild climate
TRANSCRIPT

1
Energy consumption and comfort analysis for different low-energy cooling systems in a mild climate
Erik L. Olsen
Building Technology Program, Massachusetts Institute of Technology Room 5-418, 77 Massachusetts Avenue, Cambridge, MA 02139-4307, USA
Qingyan (Yan) Chen
School of Mechanical Engineering, Purdue University 1288 Mechanical Engineering Building, West Lafayette, IN 47907-1288, USA
Keywords: Energy simulation, Experimental validation, Mechanical ventilation, Natural ventilation, Hybrid ventilation, Office buildings
Abstract The mild U.K. climate makes many low-energy cooling systems both technologically and economically feasible. In this study, EnergyPlus, the newest U.S. energy simulation program, is used to evaluate the potential energy savings of several different systems for a recently built building outside of London, U.K. Results from validation studies are briefly presented with the conclusion that EnergyPlus provides sufficient accuracy for most energy simulation applications. Systems evaluated include chilled ceilings, displacement ventilation, natural ventilation, night cooling, and a traditional VAV system. Unusual features of the building model are presented. Results show that systems that maximize free cooling from outside air have the best energy performance, and that natural ventilation alone cannot provide year-round comfort in the building studied, but would be effective as part of a hybrid system. 1. Introduction
Many U.K. office buildings use traditional mechanical cooling systems. However, the mild climate throughout the U.K. makes many alternative, low-energy cooling systems both technologically and economically feasible. These systems often provide additional benefits such as improved indoor air quality, which can enhance worker productivity.
The field of potential systems to choose from is enormous; case studies of buildings using many different technologies are given in [1]. Some systems, such as sea or lake water cooling, require special site conditions which are not always available. This study focuses on systems that could potentially be applied at any site in the U.K. These systems include displacement ventilation, chilled ceilings, traditional variable-air volume mixing systems, night cooling, and natural ventilation.
Many simplified models have been developed to aid in the design of low-energy cooling systems. Examples include a night cooling design tool [2], numerous design strategies for natural ventilation [3], and a design methodology for chilled ceilings [4]. However, most models are only useful for a specific system, and their simplified nature can give incorrect results if design parameters are outside of the region for which they have been validated.
Energy simulation programs, however, are intended to model all energy flows within a building on a more detailed level and predict annual building energy usage and indoor Chen’s telephone: (765) 496-7562, Fax: (765) 494-0787, E-mail: [email protected]
Olsen, E.L. and Chen, Q. 2003. “Energy consumption and comfort analysis for different low-energy cooling systems in a mild climate,” Energy and Buildings, 35(6), 560-571.

2
environmental conditions. Their detailed nature makes them more adaptable to modeling nearly any building design. Although currently primarily used to evaluate a building design when it is complete, energy simulation can be used as a powerful tool for both the architectural and mechanical design of a building. Several researchers have demonstrated the analysis of low-energy cooling systems by energy simulation, including chilled ceilings [5], displacement ventilation [6], and natural and/or night ventilation [7, 8].
In this study, EnergyPlus, a new-generation energy simulation program released in April 2001 by the U.S. Department of Energy [9], is used to evaluate the potential energy savings of the systems presented above for a recently built building outside of London. The energy usage of these alternative systems is compared to the predicted energy usage of the building as built. The systems were selected both for their applicability to the U.K. climate and the fact that they can be modeled in EnergyPlus. However, most systems still required some changes to the EnergyPlus source code in order to be modeled appropriately.
We begin by providing a brief background on EnergyPlus and what differentiates it from previous U.S. energy simulation programs. Because EnergyPlus is not yet in widespread use, several validation studies have been performed to show both the validity of the models used in EnergyPlus and the competence of the users; the results of one of these studies is presented. Next the specific building and systems considered in this study are described, followed by a description of the highlights of the EnergyPlus building model. Finally, the results of the building simulation are compared to experimental data and the performance of the alternative building systems is evaluated. 2. EnergyPlus and its validation
Development of EnergyPlus began in 1995 as an effort to combine the best features of BLAST and DOE-2 and incorporate some other new features [10]. EnergyPlus uses a modular program structure, which makes the code easy to understand and modify. The major improvement in EnergyPlus over previous energy simulation programs is the integrated solution of loads, system, and plant, allowing accurate space temperature predictions. The solution is based on the heat balance technique referred to as the Predictor-Corrector Method [9] and assumes that the room air is well stirred, providing a uniform temperature. The air heat balance is then:
( ) ( ) ( )∑ ∑ ∑= = =
+−+−+−+=sl surfaces zonesN
1isyszinfpinfzzi
N
1ip
N
1iizsiiii
zz QTTcmTTcmTTAhQ
dtdTC (1)
where:
∑=
slN
1iiQ = sum of internal convective loads from people, computers, etc.
( )∑=
−surfacesN
1izsiii TTAh = convective heat transfer from zone surfaces
( )zzip
N
1ii TTcm
zones
−∑=
= heat transfer due to interzone air mixing
( )zinfpinf TTcm − = heat transfer due to infiltration
( )zspsyssys TTcmQ −= = air system output

3
dtdTC z
z = rate of energy storage in air
The zone temperature derivative is calculated with a third order finite difference approximation. The introduction of the zone capacitance term, Cz (dTz/dt), allows the zone air temperature to vary. In previous heat balance-based programs, the left side of the heat balance equation (1) would be zero. The basic strategy behind the Predictor-Corrector Method is to predict the mechanical system load needed to maintain the zone air setpoint, then simulate the mechanical systems to determine their actual capacity, and then recalculate the zone air heat balance to determine the actual zone temperature.
The system input is component-based, allowing users to create many types of systems. Considerable effort has been spent on implementing appropriate system controls, although it should be noted that components are controlled using the “known” zone load, rather than attempting to simulate actual control schemes such as proportional-integral control. Plant equipment is also input and simulated with the component-based approach. Curved-based models are currently used, but the modular code structure makes it easy to implement other models as necessary [10].
Because of its somewhat recent release, EnergyPlus is not yet in widespread use and requires experimental validation before it can confidently be used for building energy simulation. Witte et al. [11] have performed a variety of analytical and inter-model comparative tests and found good agreement with published results. In addition, the authors have performed an additional set of validation tests in order to demonstrate both the validity of EnergyPlus and the authors’ ability to model buildings correctly with EnergyPlus. Due to limited space available in this paper, only the results from one of these tests are presented. A complete report of all the validation cases can be found in [12].
The experimental data collected in the U.K. under the direction of the Building Research Establishment seems to be the most complete dataset available and is widely used for the validation of energy simulation programs [13]. This is referred to as the IEA Empirical Validation study. Hourly temperature data was collected from several small test rooms on the edge of an airfield 70 km northwest of London. The rooms, shown in Fig. 1, are of lightweight, timber framed construction with a concrete slab floor elevated above the ground. The rooms are tightly sealed to prevent infiltration. The roof space above each room is vented. Each building consists of two identical rooms separated by a heavily insulated wall. Data was collected for one room in each building.
Figure 2 shows the measured and predicted room air temperatures for an unheated, double glazed room over a one-week period in May. The prediction matches the measured room temperature very well. There is some slight overprediction of daytime peak temperatures, but the error is within the error bounds due to input uncertainties given by [13]. Figure 3 shows the measured and predicted ceiling surface temperature for an unheated, single glazed room. Again, the prediction and measurement compare very well except for some slight overprediction of daytime peak temperatures. The accuracy of our predictions is similar or better than those performed in the IEA study. We have had similar experiences with other validation cases. Therefore, we conclude that EnergyPlus can be used to predict building thermal performance with good accuracy. 3. Building and systems description
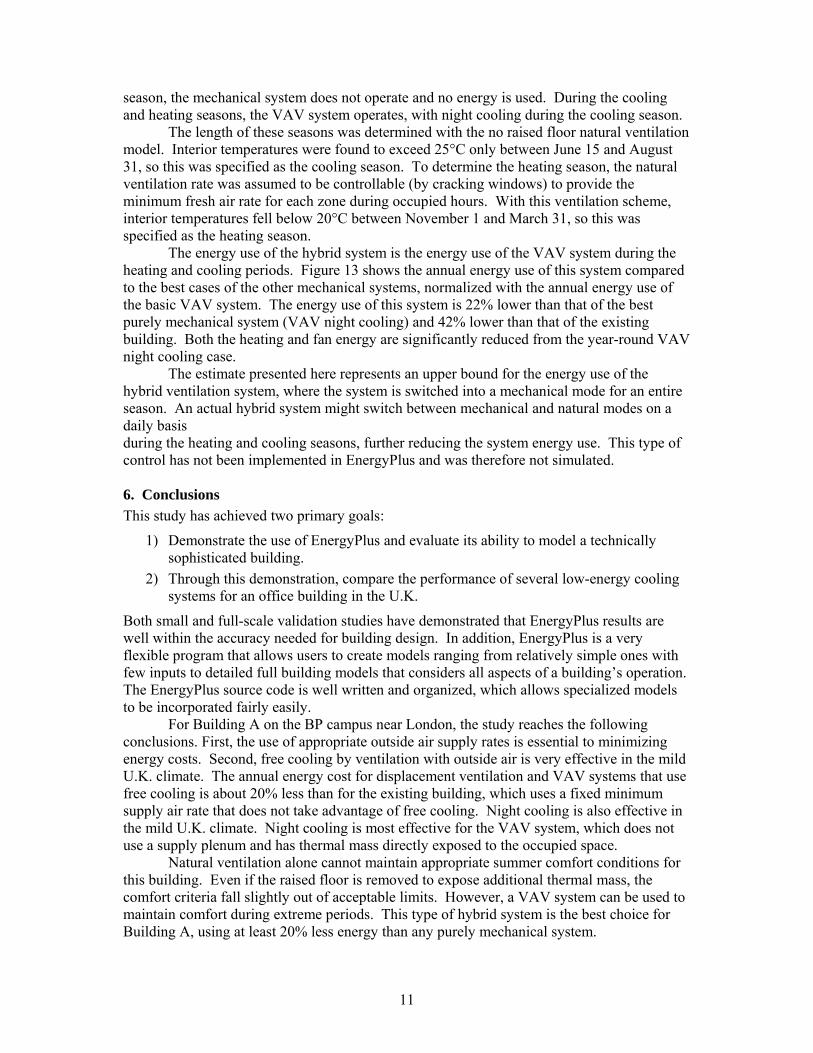
After finding good results from EnergyPlus for a number of validation cases, we have further selected Building A, located on the BP Sunbury campus in suburban London, as an example to explore the benefits of low-energy cooling systems in the U.K. Figure 4 shows an

4
overall view of Building A. This building was selected because the HVAC system is very sophisticated and is meant to have low energy consumption. It therefore provides a good opportunity for the evaluation of an actual, installed low-energy cooling system and the comparison of this system to other potential systems.
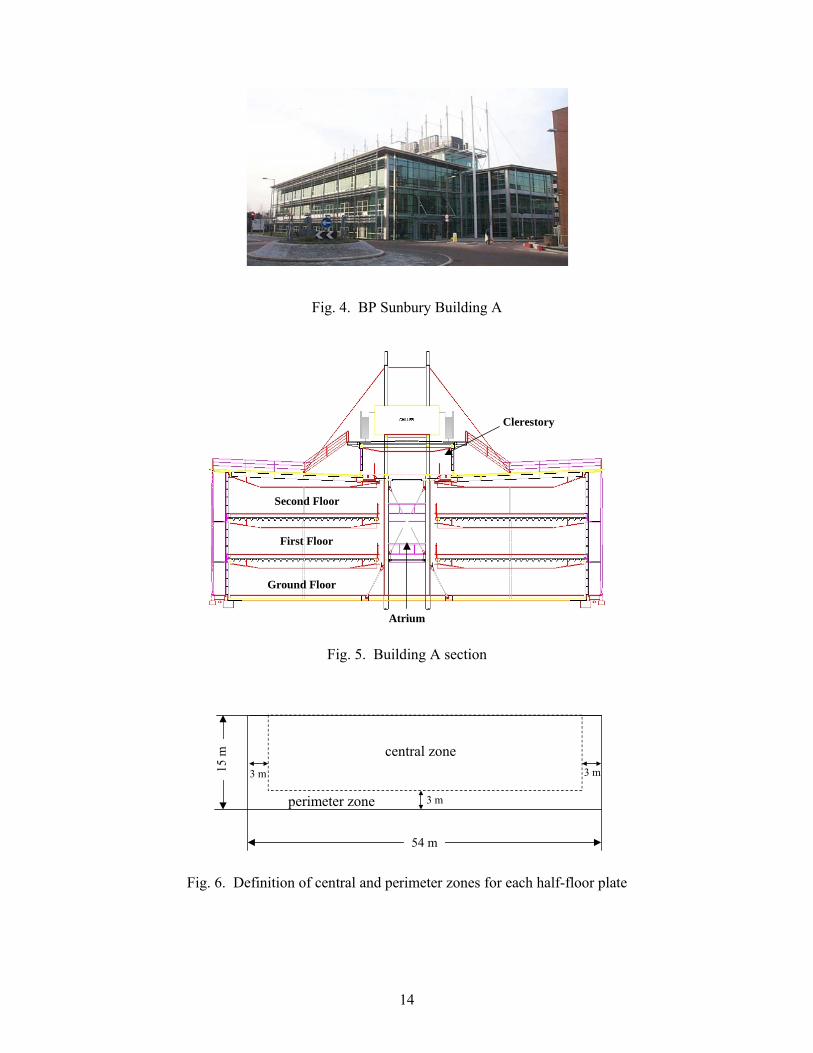
Building A has three floors which all open to a central atrium. The net internal floor area is 4800 m2. Note that throughout this study the floors are referred to by the European numbering convention: ground, first, second (G, 1, 2). Figure 5 shows a general section of the building. The building façade is nearly 100% glazing. The clerestory level provides daylight to the atrium. Central mechanical equipment is located on the upper roof level, above the atrium. Each floor has two major zones: north and south, which are separated by the atrium. Each of these zones will be referred to as a half-floor plate. The location and number of interior partitions varies from floor to floor. In general, the floor plan is very open.
Building A uses underfloor air displacement ventilation with chilled ceilings, perimeter trench heaters, and perimeter chilled beams. Fresh air is supplied through many small diffusers located in the floor, above a supply plenum. The air is extracted through the ceiling light fixtures into a return plenum. The system supplies 100% outside air at a constant rate during occupied hours at a temperature of 18°C. The ceiling is made up of chilled ceiling panels that provide additional cooling. Chilled beams provide additional cooling near perimeter windows to prevent overheating due to solar gains, particularly during summer months. During winter months, trench heaters near the perimeter are used to overcome heat losses due to conduction through windows and infiltration of outside air.
In order to compare the pros and cons of different low energy cooling systems, this investigation considers a few alternative systems, such as displacement ventilation, mixing variable-air volume (VAV), natural ventilation, and night cooling. The displacement ventilation system is similar to the existing building system, except that the chilled ceilings are not operated. Instead, the air supply rate is increased as necessary in order to maintain the head level temperature at setpoint.
The VAV system is the all-air system most commonly used in modern office buildings. The supply plenum is not used; instead the air supply is assumed to be overhead in order achieve a well-mixed condition. The air supply rate is varied in order to meet the cooling load. For the basic VAV system, the chilled beams are removed and the perimeter cooling load is also met by varying the air supply rate.
Natural ventilation draws unconditioned outside air through building openings such as windows without mechanical assistance. Finally, night cooling, where the system operates at night to precool the building, can be used with any of these systems.
Note that two air-cooled chillers provide cooling to the chilled water loop, meaning that free cooling to the chilled water loop is not available. Additional energy savings could be achieved by installing cooling towers in order to obtain free cooling to the chilled water loop for much of the year. However, cooling towers are generally not used in the U.K. because of concerns with Legionnaire’s Disease. They are therefore not considered in this study, which focuses on alternative space-conditioning systems and not alternative plant systems. 4. Building and systems models
Although EnergyPlus has very detailed models and many useful features, our study found that important modeling assumptions must be made in order to deal with the real world challenges encountered in simulating various systems for Building A. The highlights of our model are presented here. 4.1 Basic Building Model

5
The use of perimeter heating and cooling systems in an open plan office presents a modeling challenge. To account for these systems, each half-floor plate was divided into two zones: central and perimeter, as shown in Fig. 6. The perimeter zone was chosen to extend three meters in from all three exterior sides of each half-floor plate; this distance is sufficient to capture all perimeter affects. Mixing of air between these two zones does occur. For simplicity, the mixing rate is assumed to vary linearly, from 0 ach at an interzone temperature difference of 0 K, to 14 ach (based on the perimeter zone volume) at a temperature difference of 5 K. Beyond this temperature difference, the mixing rate is constant at 14 ach.
There is a supply plenum zone below the central and perimeter zones and a return plenum zone above the central and perimeter zones for each half-floor plate, yielding a total of four zones per half-floor plate and 24 total zones. The atrium is not modeled because air flow visualization tests by smoke showed little interaction between the air in the atrium and the rest of the building, and the internal and external gains and losses in the atrium are very small compared to the remainder of the building.
Building A has fairly standard construction, with lightweight concrete floor slabs and green-tinted, double glazed, low-e curtain walls. Both interior and exterior shading systems are included in the EnergyPlus model. Exterior shading is provided by surrounding buildings, roof overhangs, perimeter walkways, and photovoltaic panels on the southern façade. Venetian blinds provide interior shading. The blinds in the model are set to close when solar radiation levels on the window exceed some threshold, chosen from observations of occupant behavior.
Building A was instrumented for long-term energy monitoring in January 2002, providing the unusual opportunity to obtain lighting and equipment gains from measurements. Data from February 2002 was averaged to obtain hourly load profiles for a typical weekday and weekend day for each half-floor plate. Figures 7 and 8 show the hourly electrical equipment and lighting loads for the typical weekday. The equipment load varies greatly from zone-to-zone because of a highly variable equipment density. However, all equipment loads are significantly lower than the 10-15 W/m2 typical for this type of building [14]. This is because of the use of low-energy equipment throughout the building, particularly flat-panel LCD monitors. The lighting load is more constant from zone to zone because the installed lighting density is the same throughout the building. However, daylight-sensitive dimmers and motion sensors control the lights and therefore create some load variation, particularly a load peak in the evening after sunset.
The final internal gain, people, is more difficult to characterize. The maximum number of people in each zone was estimated from the number of desks located in that zone. A building-wide fractional occupancy schedule was estimated from the daytime equipment load variation.
4.2 Existing Building Systems
The building as it is currently operated has many obvious opportunities for energy savings. Therefore, two basic models of the existing building were developed. The first, referred to as the Existing Building model, attempts to model the building as it is actually operated. The second, referred to as the Improved Operations model, changes the operation of the existing building systems to take of these obvious opportunities for energy savings.
Air supply rates for each zone were determined from measurements taken during January 2002. Duct traverses were performed within the supply and return risers at each floor level using a hot-wire anemometer. The total supply air rate is approximately 40 L/s/person, which is much higher than necessary for a system intended to supply only fresh air. This rate is used in the Existing Building model, but in the Improved Operations model and all alternative system models, the minimum supply air rate for each zone is 10 L/s/person.

6
In order to prevent condensation on the chilled ceilings, the supply air humidity is controlled. The humidity ratio setpoint is 9 g/kg, which corresponds to a dewpoint 12.4°C. The actual system is controlled by the air dewpoint; in EnergyPlus this type of control must be based on the humidity ratio. The supply air temperature setpoint is 18.5°C after 8 a.m. and 21.5°C before 8 a.m.
Chilled ceilings, chilled beams, and trench heaters handle any additional heating or cooling load. Chilled ceilings were modeled with the Hydronic Low Temperature Radiant System available in EnergyPlus. Flow to the chilled ceilings throttles from zero to maximum flow across a 1 K temperature range around the central zone setpoint of 25°C. Chilled beams and trench heaters were both modeled with the Convective Water Baseboard Heater available in EnergyPlus. Although it is called a heater, this component can perform cooling as well. The perimeter cooling setpoint is 25°C and the heating setpoint is 20°C. 4.3 Displacement Ventilation System
The displacement ventilation model is very similar to the Improved Operations model. Three major changes are made: the chilled ceilings are removed, the air system has a variable airflow rate, and the displacement ventilation vertical temperature gradient model is used. Although the chilled ceiling model is removed, the insulated ceiling panels remain in place with the same physical properties as the chilled ceiling. The model simply treats the chilled ceilings as if they are always off.
The minimum airflow rate for each zone is the same as in the Improved Operations model, but the airflow rate in the central zones increases as necessary to maintain the head level at setpoint temperature. The supply air rate in the perimeter zones remains at a fixed minimum; additional loads in these zones are still handled by chilled beams and trench heaters.
The supply air temperature for a displacement ventilation system is normally about 18°C. However, this system uses a supply plenum in which there is considerable heat gain, especially during summer months. The air temperature can rise as much as 3°C within the supply plenum due to heat gains from the raised floor. Therefore, a lower supply air setpoint (for the air leaving the air handling unit and entering the supply plenum) was used during warmer months so that the air leaving the supply plenum would be near 18°C. The supply air setpoint was scheduled to reset annually: April through October, the supply air setpoint was 15°C for the entire day; November through March, the supply air setpoint was 18°C after 8 a.m. and 20°C before 8 a.m.
Finally, a displacement ventilation vertical temperature gradient model was used for the central zone with this system. The perimeter zone is assumed to remain well-mixed because the chilled beams would destroy any temperature gradient. A simple three-node model, shown in Fig. 9, was used for the central zone. Existing nodal models from the literature were used to determine the floor level air temperature, Tf, and the head level air temperature, Th. The floor level temperature is determined from the model developed by Mundt [15]:
1α1
α1
Acm
1TTTT
θ
cfr
psysse
sff
+⎟⎟⎠
⎞⎜⎜⎝
⎛+
=−−
= (2)
where: A = floor area αr = radiative heat transfer coefficient from the ceiling to the floor αcf = convective heat transfer coefficient from the floor to the room air

7
sysm = supply air mass flowrate cp = supply air specific heat The head level temperature is determined from the model developed by Yuan et al. [16]:
psys
exloefh cm
Q185.0Q132.0Q295.0TT
++=− (3)
where Qoe = heat from occupants, desks lamps, and equipment Ql = heat from overhead lighting Qex = heat from the exterior wall and window surfaces and the transmitted solar radiation
The air supply rate is controlled to maintain the head level temperature at 25°C. The integration of these nodal models into EnergyPlus introduces new difficulties with the predictor-corrector solution method, because of the interdependence of the supply air rate and temperature gradient. The solution involves introduction of new sub-iterations within both the predictor and corrector steps. Full details of this solution method are given in [12].
Several variations on the displacement ventilation model were considered. A higher humidity model was created with a supply air humidity ratio setpoint of 10 g/kg. There was also some concern that the heat gains in the supply plenum partially resulted from heat from the warm return plenum conducting through the structural floor slab, which is uninsulated. An insulated floor slab model was created with a 25 mm layer of polystyrene insulation on the underside of the first and second floor slabs. Finally, a model without the chilled beams was considered. In the no chilled beams model, the perimeter airflow rate can increase above the minimum airflow rate and is varied in order to maintain the setpoint of 25°C. 4.4 VAV System
The VAV system is identical to the displacement ventilation system except that the supply air is introduced overhead. Note that although the supply plenum is not used, the raised floor is still in place. The return air is still drawn through the return plenum. Because the room air is well mixed, the air flowrate is varied to maintain the mean room temperature at the setpoint of 25°C. The supply air setpoint follows the same seasonal reset schedule as the displacement ventilation supply air setpoint.
Two variations to the VAV model were also considered. In the first, the chilled beams are included, so that the perimeter air flowrate is always at the minimum and the chilled beams provide additional cooling, as in the displacement ventilation system. The second case relaxes the space humidity requirement, as was done with displacement ventilation system. 4.5 Night Cooling
Each of the three systems presented above can also be operated in a night cooling mode, in which the air system is operated at night in order to precool the building. For all three systems, the daytime system operation is unchanged from the cases above. At night, the air system supplies a high flowrate of unconditioned, cool outside air to the central zone.
Night cooling operation begins at 11 p.m. and continues until normal system operation begins at 6 a.m. At night, the system runs at a fixed maximum flowrate until a setpoint of 18°C is reached. The night cooling mode is only operable April through October; the normal operating modes described previously are used November through March. For the VAV system, which does not use the supply plenum, the raised floor was removed for the night cooling model. Without the raised floor removed, there would not be any thermal mass exposed to the supply air and there would be little potential for effective night cooling.

8
Two different nighttime maximum air flowrates were considered. A higher flowrate may help to further precool the building, but it also requires greater fan power. The higher rate was 5 ach for each system. The lower rate was 2.5 ach for the existing building system and 3.5 ach for the displacement ventilation and VAV systems; the slightly higher rate for these two systems was necessary in EnergyPlus in order to allow appropriate peak daytime supply air rates. 4.6 Natural Ventilation
The natural ventilation system is very different from the systems presented above. All of the building systems discussed above are removed. The only conditioning of the building is provided by naturally driven airflow through windows. Pure cross ventilation from one side of the building to the other is assumed. The ventilation rate is calculated from the simple large-opening equation:
airDair
p2ACVρΔ
= (4)
where: airV = volumetric air flowrate through window
CD = opening discharge coefficient A = effective opening area
pΔ = pressure difference between inside and outside The pressure difference is calculated from meteorological wind speed Umet:
( ) 2metairp,2p,1 Uρ
21CCp −=Δ (5)
where Cp,1 and Cp,2 are the surface-averaged pressure coefficients on the two primary facades. These pressure coefficients at each floor level were determined for eight different wind directions. A computational fluid dynamics (CFD) model of Building A and the BP Sunbury campus was used to estimate the pressure coefficients. Linear interpolation is used to determine the pressure coefficient for any given wind direction.
The discharge coefficient for the windows on each façade was assumed to be 0.6. Again, a CFD model was used to estimate the internal building resistance and calculate an internal discharge coefficient of 0.72, yielding an overall discharge coefficient of 0.26. Controls on the natural ventilation rate have not been implemented. The open window area was assumed constant, as if all operable windows are always open. This is acceptable for evaluating summer conditions because in the mild U.K. climate, the outdoor temperature is nearly always lower than the indoor temperature, so the maximum ventilation rate is desirable throughout the day.
Three natural ventilation cases were considered. In the first, the building is left completely unchanged from its existing configuration. However, the raised floors and lowered ceilings in this case prevent any appreciable heat storage in the floor slab and therefore limit the effectiveness of natural ventilation. Therefore, two additional cases were considered: one with the raised floors removed, and one with the lowered ceilings removed. Either of these actions partially exposes the thermal mass of the floor slab and increases the potential for thermal comfort with natural ventilation. 4.7 Changes to EnergyPlus
In order to implement all of the above models, many changes were necessary to EnergyPlus, including:

9
Implementation of displacement ventilation vertical temperature gradient model Implementation of simplified natural ventilation model Modification of crossmixing model to allow variable mixing rate Creation of new “crossover pipe” components to allow secondary plant loops (for
chilled beams, chilled ceilings, and trench heaters) Modification of baseboard heater model for use as chilled beam Modifications to air system models to allow for appropriate air distribution Corrections to economizer control algorithm
Note that many of these changes were quite simple to make and were completed in a matter of hours. Full details of these changes are given in [12]. 5. Results of low energy cooling system analysis
This section first compares simulation results to experimental data obtained in Building A as an additional validation of EnergyPlus and its ability to simulate a complex building and its mechanical systems. This is followed by comparisons of energy consumption, equipment sizing, and thermal comfort for the various low-energy cooling systems. 5.1 Validation
Extensive instrumentation of Building A installed in January 2002 has provided experimental data which can be used for a simple validation of the EnergyPlus Building A model. This validation consists of a comparison of predicted central zone temperatures to measured zone temperatures. Space temperatures in Building A were measured using compact thermocouple dataloggers with an error of ±0.5°C. The average of three measurements distributed evenly across the central zone floor area is taken as the zone temperature. Simulations were performed with input weather data gathered from a weather station installed on the roof of Building A.
Figure 10 shows predicted and measured space temperatures for the southern second floor zone for a single week in February. The agreement is very good; the error is generally less than 1°C with some exceptions to this agreement. The disagreements occur during periods when the building system clearly remained active through the night or over the weekend. For the week shown, the system clearly remained on during the Monday early morning hours, Wednesday night, and during the day on Saturday, because the measured temperature remains very stable over these periods. This indicates a malfunction in the building control system and does not need to be included in the simulation. 5.2 Energy and Equipment Cost
Figure 11 shows the total annual energy cost for each mechanical system, normalized with respect to the basic VAV system annual energy cost. Costs are calculated based on a 3:1 electricity to gas cost ratio. Several major observations can be made. First, the use of appropriate minimum fresh air rates is essential. The existing building (without improved operations) case, which uses 40 L/s/person, uses almost 5 times more energy than any other system. Simply reducing the supply air rate to 10 L/s/person, as in the improved operations case, reduces the total energy cost by a factor of 4.7. The improved operations case actually has the smallest fan energy of any of the systems because the supply air rate is constant at a small value.
Use of free cooling from outside air also provides significant energy savings. The displacement ventilation and VAV systems both save energy over the existing building because they can maximize free cooling by increasing the supply air rate, whereas in the

10
existing building the supply air rate is held at a fixed minimum. Although these systems use more fan energy, the difference is more than accounted for by the savings in chiller energy.
Night cooling is most effective for the VAV system, providing a 12% reduction in energy cost. This is because the thermal mass is exposed directly to the occupied space in this system, whereas it is only exposed to the supply plenum in the displacement ventilation and existing building systems. The night cooling VAV system uses the least energy of all mechanical systems studied. Night cooling does provide some small savings for the displacement ventilation system but has no benefits for the existing building, which does not use the air system for most cooling. Night cooling also has a significant effect on chiller size. The peak chiller load is reduced by about 20% for both the displacement ventilation and VAV systems when night cooling is used.
Insulating the floor slab to prevent heat transfer from the return plenum to the supply plenum has very little effect on energy consumption, indicating that the majority of heat gains in the supply plenum are from the raised floor above. Raising the humidity setpoint has the expected effect of lowering the chiller energy slightly.
Although the displacement ventilation and VAV systems save energy over the existing building, note that they do require much larger fans. The peak supply air rate for the displacement ventilation system is 2.7 times greater than that of the improved operations system, and the all-air VAV system peak flowrate is 4.5 times higher than the minimum flowrate. This is the penalty these systems pay for using free cooling from outside air. The peak flowrate is reduced by about 10% when night cooling is used. 5.3 Natural Ventilation and Thermal Comfort
Figure 12 shows the number of occupied hours that the average building temperature exceeds a given temperature for each natural ventilation case. Removing either the raised floor or lowered ceiling shifts the curve downward because the thermal mass of the floor slab is exposed. This allows more heat gains to be absorbed by the floor slab during the day and released at night. Eliminating the raised floor shifts the curve most because the direct sunlight strikes the floor and can be directly absorbed by the floor slab when the raised floor is removed.
Levermore et al. [17] present two criteria for evaluating thermal comfort within a naturally ventilated building in the U.K.:
1. The temperature shall not exceed 25°C for more than 5% of the occupied year. 2. The temperature shall not exceed 28°C for more than 1% of the occupied year.
The occupied hours for Building A are 8 a.m. to 6 p.m. Monday to Friday, corresponding to 2600 working hours. 5% of the occupied year is 130 hours and 1% of the occupied year is 26 hours.
According to these criteria, sufficient thermal comfort is not achieved with this natural ventilation system. The best case exceeds 25°C for 191 hours and 28°C for 40 hours. However, the building is quite close to being within the comfort criteria. To achieve acceptable comfort conditions, a mechanical system could be installed to provide cooling during peak periods, while natural ventilation could be used for most of the year. This is known as a hybrid ventilation system. An estimate of the energy use of such a system has been performed and is discussed below. 5.4 Hybrid System
The energy use of a hybrid ventilation system has been estimated by dividing the year into three seasons: natural ventilation, cooling, and heating. During the natural ventilation
11
season, the mechanical system does not operate and no energy is used. During the cooling and heating seasons, the VAV system operates, with night cooling during the cooling season.
The length of these seasons was determined with the no raised floor natural ventilation model. Interior temperatures were found to exceed 25°C only between June 15 and August 31, so this was specified as the cooling season. To determine the heating season, the natural ventilation rate was assumed to be controllable (by cracking windows) to provide the minimum fresh air rate for each zone during occupied hours. With this ventilation scheme, interior temperatures fell below 20°C between November 1 and March 31, so this was specified as the heating season.
The energy use of the hybrid system is the energy use of the VAV system during the heating and cooling periods. Figure 13 shows the annual energy use of this system compared to the best cases of the other mechanical systems, normalized with the annual energy use of the basic VAV system. The energy use of this system is 22% lower than that of the best purely mechanical system (VAV night cooling) and 42% lower than that of the existing building. Both the heating and fan energy are significantly reduced from the year-round VAV night cooling case.
The estimate presented here represents an upper bound for the energy use of the hybrid ventilation system, where the system is switched into a mechanical mode for an entire season. An actual hybrid system might switch between mechanical and natural modes on a daily basis during the heating and cooling seasons, further reducing the system energy use. This type of control has not been implemented in EnergyPlus and was therefore not simulated. 6. Conclusions This study has achieved two primary goals:
1) Demonstrate the use of EnergyPlus and evaluate its ability to model a technically sophisticated building.
2) Through this demonstration, compare the performance of several low-energy cooling systems for an office building in the U.K.
Both small and full-scale validation studies have demonstrated that EnergyPlus results are well within the accuracy needed for building design. In addition, EnergyPlus is a very flexible program that allows users to create models ranging from relatively simple ones with few inputs to detailed full building models that considers all aspects of a building’s operation. The EnergyPlus source code is well written and organized, which allows specialized models to be incorporated fairly easily.
For Building A on the BP campus near London, the study reaches the following conclusions. First, the use of appropriate outside air supply rates is essential to minimizing energy costs. Second, free cooling by ventilation with outside air is very effective in the mild U.K. climate. The annual energy cost for displacement ventilation and VAV systems that use free cooling is about 20% less than for the existing building, which uses a fixed minimum supply air rate that does not take advantage of free cooling. Night cooling is also effective in the mild U.K. climate. Night cooling is most effective for the VAV system, which does not use a supply plenum and has thermal mass directly exposed to the occupied space.
Natural ventilation alone cannot maintain appropriate summer comfort conditions for this building. Even if the raised floor is removed to expose additional thermal mass, the comfort criteria fall slightly out of acceptable limits. However, a VAV system can be used to maintain comfort during extreme periods. This type of hybrid system is the best choice for Building A, using at least 20% less energy than any purely mechanical system.

12
References [1] M. Zimmermann, J. Andersson, Case Studies of Low Energy Cooling Technologies,
International Energy Agency, Energy Conservation in Buildings and Community Systems Programme, Annex 28 – Low Energy Cooling, 1998.
[2] M. Kolokotroni, B.C. Webb, S.D. Hayes, Summer cooling with night ventilation for office buildings in moderate climates, Energy and Buildings 27 (3) (1998) 231-237.
[3] F. Allard, et al., Natural Ventilation in Buildings: A Design Handbook, James and James Ltd, London, 1998.
[4] C.L. Conroy, S. A. Mumma, Ceiling radiant cooling panels as a viable distributed Parallel sensible cooling technology integrated with dedicated outdoor air systems, ASHRAE Transactions 107 (1) (2001).
[5] J. Niu, J.v.d. Kooi, H.v.d. Ree, Energy saving possibilities with cooled ceiling systems, Energy and Buildings 23 (2) (1995) 147-158.
[6] S. Hu, Q. Chen, L.R. Glicksman, Comparison of energy consumption between displacement and mixing ventilation systems for different U.S. buildings and climates, ASHRAE Transactions105 (2) (1999).
[7] G. Carrilho da Graça, et al., Simulation of wind-driven ventilative cooling systems for an apartment building in Beijing and Shanghai, Energy and Buildings 34 (1) (2001) 1-11.
[8] V. Geros, et al., Experimental evaluation of night ventilation phenomena, Energy and Buildings 29 (2) (1999) 141-154.
[9] Engineering Reference, EnergyPlus Manual, version 1.0, 2001. [10] R. K. Strand, et al, EnergyPlus: A new-generation energy analysis and load calculation
engine for building design, in: Proceedings of the ACSA Technology Conference, Cambridge, Massachusetts, 2000.
[11] M. J. Witte, et al., Testing and validation of a new building energy simulation program, in: Proceedings of Seventh International IBPSA Conference, Rio de Janeiro, 2001.
[12] E. L. Olsen, Performance comparison of U.K. low-energy cooling systems by energy simulation, M.Sc. Thesis, Department of Architecture, Massachusetts Institute of Technology, Cambridge, Massachusetts, 2002.
[13] K.J. Lomas, et al, Empirical validation of thermal building simulation programs using test room data, Volume 2: Empirical validation package, International Energy Agency Annex 21/Task 12, 1994.
[14] ASHRAE Handbook Fundamentals, ASHRAE, Atlanta, 2001. [15] E. Mundt, Convective flow above common heat source in rooms with displacement
ventilation, in: Proceedings of ROOMVENT ’90, Oslo, 1990. [16] X. Yuan, Q. Chen, L.R. Glicksman, Models for prediction of temperature difference and
ventilation effectiveness with displacement ventilation, ASHRAE Transactions 105 (1) (1999).
[17] G. J. Levermore, A.M. Jones, A.J. Wright, Simulation of a naturally ventilated building at different locations, ASHRAE Transactions 106 (2) (2000) 402-407.

13
Fig. 1. IEA Empirical Validation test rooms
0
5
10
15
20
25
30
35
5/23 5/24 5/25 5/26 5/27 5/28 5/29 5/30Date
Tem
pera
ture
(°C
)
PredictedMeasuredOutdoor
Fig. 2. Unheated, double glazed room temperature
0
5
10
15
20
25
30
35
5/23 5/24 5/25 5/26 5/27 5/28 5/29 5/30Date
Tem
pera
ture
(°C
)
Predicted
Measured
Fig. 3. Ceiling temperature for unheated, single glazed room
14
Fig. 4. BP Sunbury Building A
Ground Floor
First Floor
Second Floor
Atrium
Clerestory
Fig. 5. Building A section
54 m
15 m
3 m
3 m
central zone 3 m
perimeter zone
Fig. 6. Definition of central and perimeter zones for each half-floor plate

15
0
2
4
6
8
10
12
0:00 3:00 6:00 9:00 12:00 15:00 18:00 21:00 0:00Time
Elec
tric
al E
quip
men
t Loa
d (W
/m2 )
SOUTH GNORTH GSOUTH 1NORTH 1SOUTH 2NORTH 2
Fig. 7. Typical weekday electrical equipment load profile
0
2
4
6
8
10
12
0:00 3:00 6:00 9:00 12:00 15:00 18:00 21:00 0:00Time
Ligh
ting
Load
(W/m
2 )
SOUTH GNORTH GSOUTH 1NORTH 1SOUTH 2NORTH 2
Fig. 8. Typical weekday overhead lighting load profile
T
h
Ts Tf
Th
Te
a
b H
Figure 9. Displacement ventilation three-node model

16
16
18
20
22
24
26
28
02/18 02/19 02/20 02/21 02/22 02/23 02/24 02/25Date
Tem
pera
ture
(°C
)
South 2 Simulation
South 2 Measurement
Monday Tuesday Wednesday Thursday Friday Saturday Sunday
Fig. 10. Second floor south measured and simulated zone air temperatures
0.0
0.2
0.4
0.6
0.8
1.0
1.2
1.4
1.6
Exist
ing
Build
ing
Impr
oved
Ope
ratio
nsIn
sula
ted
Slab
Nigh
t Coo
ling
High
Nigh
t Coo
ling
Low
Disp
lace
men
t Ven
tilatio
nIn
sula
ted
Slab
High
er H
umid
ity
No C
hille
d Be
ams
Nigh
t Coo
ling
High
Nigh
t Coo
ling
Low
VAV
High
er H
umid
ityCh
illed
Beam
s
Nigh
t Coo
ling
High
Nigh
t Coo
ling
Low
Nor
mal
ized
Ene
rgy
Cos
t
Fan Energy CostBoiler Energy Cost
Chiller Energy Cost
Existing Building
Displacement Ventilation
VAV
5.74
Fig. 11. Normalized total annual energy costs (3:1 electricity:gas cost ratio) Night cooling high = maximum night ventilation rate 5 ach
Night cooling low = maximum night ventilation rate 3.5 or 2.5 ach

17
0
50
100
150
200
250
25 26 27 28 29 30 31 32 33 34 35Temperature (°C)
# of
Occ
upie
d H
ours
Exc
eede
d
Existing Building
No Lowered Ceiling
No Raised Floor
Fig. 12. Thermal comfort evaluation for naturally ventilated building
0.0
0.2
0.4
0.6
0.8
1.0
1.2
1.4
ExistingBuilding
ImprovedOperations
DisplacementVentilation -
Night CoolingLow
VAV - NightCooling Low
VAV/NaturalVentilation
Hybrid
Nor
mal
ized
Ene
rgy
Cos
t
Fan Energy Cost
Boiler Energy Cost
Chiller Energy Cost
Fig. 13. Normalized total annual energy cost of best-case systems