energy efficiency, thermal and visual comfort study · energy efficiency, thermal and visual...
TRANSCRIPT
Energy Efficiency, Thermal and Visual Comfort Study
of an Integrated Automation Solution
(Shading, Lighting and HVAC Systems)
in a Commercial Building located at Rio de Janeiro - Brazil
Final Report V.3.6
2016, February - São Paulo - Brazil
Performed by
Cooperating companies in this project

Energy Efficiency, Thermal and Visual Comfort Study Page 2
INTRODUCTION
Commercial buildings consume a significant part of the energy generated worldwide,
and most of this consumption is intended for operation of HVAC and lighting.
The increasingly frequent use of glass facades that bring aesthetic freedom and
modernity to commercial buildings projects brings a dual challenge: how to maintain
thermal and visual comfort of the occupants while reducing the energy consumption.
The reduction of this consumption will guide the new criteria for the use of energy, the
legislation, the environmental certifications and the technologies employed in
buildings.
This study was developed for a commercial building located in the city of Rio de
Janeiro - Brazil, with a facade with large exposure to the sun and expressive glass area
and aims to evaluate the reduction in energy consumption as well the improvement in
thermal and lighting comfort level associated with HVAC and lighting systems.
Results were obtained by simulating strategies of automation (integration and control)
with different materials for solar protection and different types of glasses.
Regarding the automation strategies, were evaluated three progressive levels of
integration between the internal shading (interior roller blinds), lighting and HVAC
automation.
Finally, the study highlights the importance of considering the jointly specification of
glasses and automated internal shading for commercial building facades, in order to
achieve more energy efficiency and comfort for the occupants. It also unequivocally
shows the HVAC energy reduction consumption when using automated internal
shading and the additional benefits when integrating it to lighting and HVAC
automation.

Energy Efficiency, Thermal and Visual Comfort Study Page 3
TABLE OF CONTENTS 1. SUMMARY........................................................................................................................4
2. DESCRIPTION OF THE INTEGRATED AUTOMATION SOLUTION............................................ 18
2.1 SHADING DEVICES (INTERIOR ROLLER BLINDS) - UNIFLEX..................................... 18
2.2. SHADING AUTOMATION – SOMFY ..................................................................... 19
2.3 LIGHTING AUTOMATION – PHILIPS ..................................................................... 19
2.4 HVAC AUTOMATION – CCN AUTOMAÇÃO .......................................................... 19
2.5 INTEGRATION LEVELS ........................................................................................ 20
3. CONTROL ALGORITHMS .................................................................................................. 20
3.1. SHADING ......................................................................................................... 20
3.2. LIGHTING ......................................................................................................... 22
3.3. HVAC ............................................................................................................... 22
4. ENERGY EFFICIENCY STUDY ............................................................................................. 23
4.1 METHODOLOGY ................................................................................................ 23
4.2 RESULTS ........................................................................................................... 31
4.3. ENERGY EFFICIENCY STUDY CONCLUSIONS ........................................................ 41
5. THERMAL COMFORT STUDY ............................................................................................ 42
5.1 METHODOLOGY ................................................................................................ 42
5.2. RESULTS .......................................................................................................... 43
5.3. THERMAL COMFORT STUDY CONCLUSIONS ....................................................... 47
6. VISUAL COMFORT STUDY ................................................................................................ 48
6.1 METHODOLOGY ................................................................................................ 48
6.2. RESULTS .......................................................................................................... 49
6.3. VISUAL COMFORT STUDY CONCLUSIONS ........................................................... 53
7. APPENDIX....................................................................................................................... 54

Energy Efficiency, Thermal and Visual Comfort Study Page 4
1. SUMMARY
The study is based on an envelope of an existing building located in the city of Rio de
Janeiro, Brazil and aims to:
Analyze the energy reduction consumption based on different levels of
integration between shading, lighting and HVAC automation (Energy efficiency
study);
Validate the thermal and visual comfort of automated internal shading –
interior roller blinds (Thermal and visual comfort studies).
In addition to the different levels of integration were also assessed in the study two
types of shading fabric (with and without aluminum coating) and seven types of glass,
shown in Table 1.
Glass # 1 2 3 4 5 6 7
Glass Type Coated Insula
ted
Coated Insula
ted
CoatedLamina
ted
CoatedLamina
ted
CoatedLamina
ted
Coated Lamina
ted
Non CoatedSingle Pane
SHGC (g value)
0,27 0,30 0,30 0,33 0,36 0,40 0,87
Visible Light transmittance (Tv)
0,37 0,41 0,19 0,22 0,31 0,38 0,90
Table 1 - Glass specification
Computer simulations have been developed in co-simulation environment using
EnergyPlus + Dialux + EES - Engineering Equation Solver.
The simulations models were based on the technologies of following companies:
Somfy (shading motorization and automation);
Uniflex (Shading manufacturer – interior roller blind);
Philips (lighting and automation);
CCN (HVAC automation and system integration).
ENERGY EFFICIENCY STUDY
The energy efficiency study consists of simulations scenarios with different levels of
automation integration.
The automation integration scenarios are below described:
Integration Level 1 (IL1): Automation of shading driven by Somfy system. No
lighting automation;
Energy Efficiency, Thermal and Visual Comfort Study Page 5
Integration Level 2 (IL2): Integration of Somfy automation system and Philips
automation system by means of presence detectors;
Integration Level 3 (IL3): Integration of Somfy system, Philips and CCN
solutions, which will follow the Level 2 model and change the HVAC set-point
temperature from 23°C to 27°C when the room is unoccupied.
Baseline scenarios with distinct façade arrangement were defined: one without
shading and other with manual operated internal shading. Both baseline models have:
Fluorescent lighting with normal performance and manual controlled;
HVAC with fixed set point;
The climate files which were used in energy simulation, have the TMY format (Test
Meteorological Year) and were developed by the Brazilian National Institute for Space
Research (INPE).
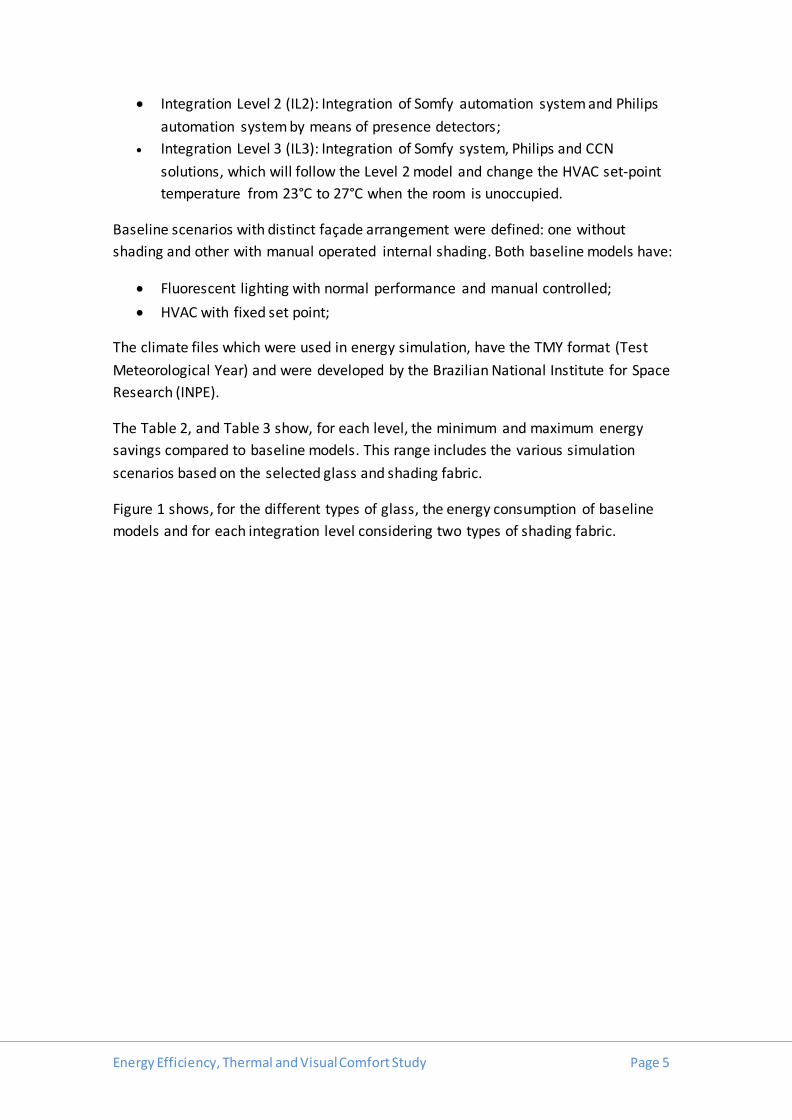
The Table 2, and Table 3 show, for each level, the minimum and maximum energy
savings compared to baseline models. This range includes the various simulation
scenarios based on the selected glass and shading fabric.
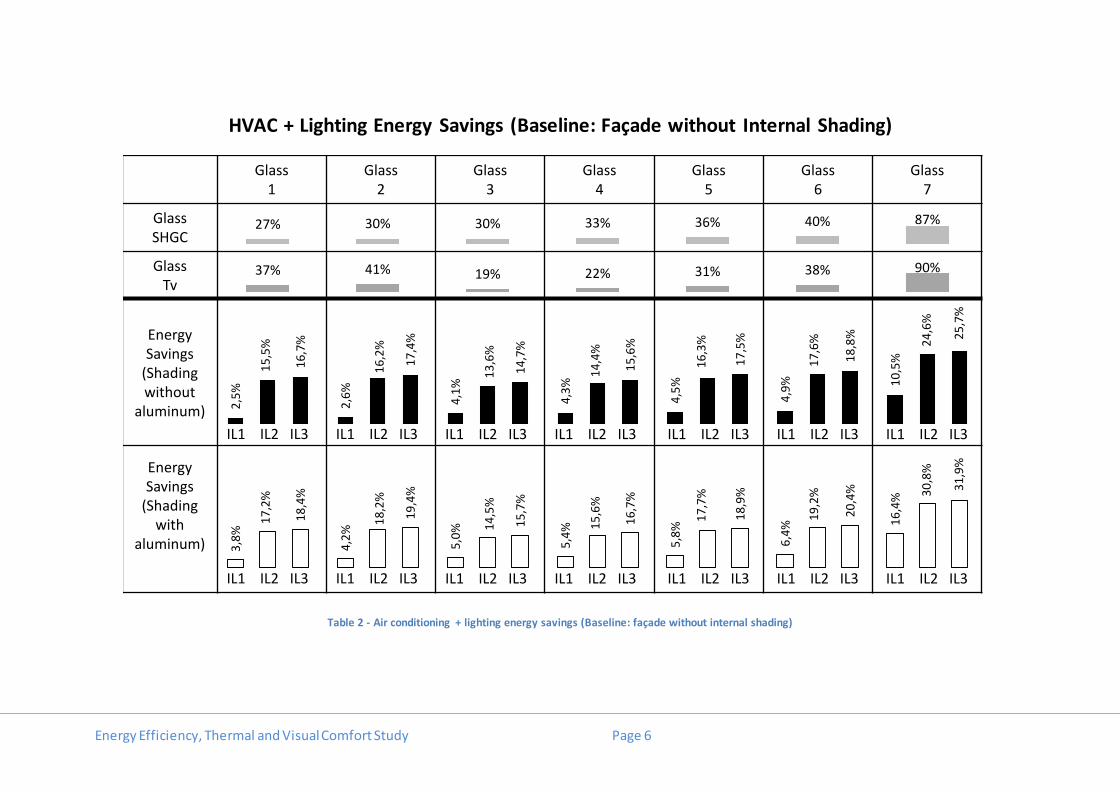
Figure 1 shows, for the different types of glass, the energy consumption of baseline
models and for each integration level considering two types of shading fabric.
Energy Efficiency, Thermal and Visual Comfort Study Page 6
HVAC + Lighting Energy Savings (Baseline: Façade without Internal Shading)
Table 2 - Air conditioning + lighting energy savings (Baseline: façade without internal shading)
Glass1
Glass2
Glass3
Glass4
Glass5
Glass6
Glass7
GlassSHGC
GlassTv
Energy Savings
(Shadingwithout
aluminum)
Energy Savings
(Shading with
aluminum)
37% 41% 19% 22% 31% 38% 90%
2,5
%
2,6
%
4,1
%
4,3
%
4,5
%
4,9
% 10
,5%
15
,5%
16
,2%
13
,6%
14
,4%
16
,3%
17
,6% 24
,6%
16
,7%
17
,4%
14
,7%
15
,6%
17
,5%
18
,8% 25
,7%
IL1 IL2 IL3
27% 30% 30% 33% 36% 40% 87%
IL1 IL2 IL3
3,8
%
4,2
%
5,0
%
5,4
%
5,8
%
6,4
% 16
,4%
17
,2%
18
,2%
14
,5%
15
,6%
17
,7%
19
,2% 3
0,8
%
18
,4%
19
,4%
15
,7%
16
,7%
18
,9%
20
,4% 3
1,9
%
IL1 IL2 IL3 IL1 IL2 IL3 IL1 IL2 IL3 IL1 IL2 IL3 IL1 IL2 IL3
IL1 IL2 IL3 IL1 IL2 IL3 IL1 IL2 IL3 IL1 IL2 IL3 IL1 IL2 IL3 IL1 IL2 IL3 IL1 IL2 IL3

Energy Efficiency, Thermal and Visual Comfort Study Page 7
HVAC + Lighting Energy Savings (Baseline: Façade with Manually Controlled Internal Shading)
Table 3 HVAC + Lighting Energy Savings (Baseline: Façade with Manually Controlled Internal Shading)
Glass1
Glass2
Glass3
Glass4
Glass5
Glass6
Glass7
GlassSHGC
GlassTv
Energy Savings
(Shadingwithout
aluminum)
Energy Savings
(Shading with
aluminum)
37% 41% 19% 22% 31% 38% 90%
2,0
%
2,2
%
2,5
%
2,7
%
2,9
%
3,2
% 8,8
%15
,6%
16
,4%
12
,3%
13
,2%
15
,2%
16
,5% 2
4,6
%
16
,9%
17
,7%
13
,5%
14
,3%
16
,4%
17
,7% 2
5,8
%
IL1 IL2 IL3
27% 30% 30% 33% 36% 40% 87%
IL1 IL2 IL3
2,0
%
2,2
%
2,5
%
2,7
%
2,9
%
3,2
% 8,8
%15
,6%
16
,4%
12
,3%
13
,2%
15
,2%
16
,5% 24
,6%
16
,9%
17
,7%
13
,5%
14
,3%
16
,4%
17
,7% 25
,8%
IL1 IL2 IL3 IL1 IL2 IL3 IL1 IL2 IL3 IL1 IL2 IL3 IL1 IL2 IL3
IL1 IL2 IL3 IL1 IL2 IL3 IL1 IL2 IL3 IL1 IL2 IL3 IL1 IL2 IL3 IL1 IL2 IL3 IL1 IL2 IL3
Energy Efficiency, Thermal and Visual Comfort Study Page 8
HVAC + Lighting Energy Consumption
Figure 1 HVAC + Lighting Energy Consumption
Glass 1SHGC 27%
Tv 37%
Glass 2SHGC 30%
Tv 41%
Glass 3SHGC 30%
Tv 19%
Glass 4SHGC 33%
Tv 22%
Glass 5SHGC 36%
Tv 31%
Glass 6SHGC 40%
Tv 38%
Glass 7SHGC 87%
Tv 90%
ShadingFabric
Manual Shading
Integration LevelNo
ShadingLevel 1
Level2
Level 3
Noncoated
Aluminum coated
x+x+

Energy Efficiency, Thermal and Visual Comfort Study Page 9
Conclusions of energy efficiency study:
The use of automated internal shading (IL1) reduces the HVAC energy
consumption between 2,0% to 16,4% and therefore allows the specification of
a broader options of glasses with higher SHGC value without impairing the
energy consumption;
The performance of internal shading with aluminum coated fabric increases
when combined with glasses with higher SHGC value and should certainly be
considered if higher OPEX are desired;
The adoption of automated internal shading in retrofit of commercial buildings
could allow the maintenance of the original glass with high SHGC values;
The lighting automation integrated with internal shading automation (IL2) has a
significant impact on energy consumption reduction, between 12,3% to 30,8% .
This reduction is higher with glasses with higher transmittance of visible light
(Tv) which enhances the harvesting of natural light into the workplace;
The major savings in energy consumption is achieved when all systems are
integrated (IL3), between 13,5% to 31,9%.
THERMAL COMFORT STUDY
The study evaluates the influence of the automated shading on occupant thermal
comfort along the façade perimeter.
The thermal comfort is measured by reduction of thermal discomfort in degrees hour
above 25°C in operating temperature.
The Table 4 and Table 5 show the achieved reduction and represent the various
simulation scenarios based on the selected glass and shading fabric.
The Figure 2 shows, for the different types of glass, the thermal discomfort for baseline
models and each integration level considering two types of shading fabric.

Energy Efficiency, Thermal and Visual Comfort Study Page 10
Thermal Discomfort Reduction (Baseline: Façade without Internal Shading)
Table 4 Thermal Discomfort Reduction (Baseline Façade without Shading)
Glass1
Glass2
Glass3
Glass4
Glass5
Glass6
Glass7
GlassSHGC
GlassTv
ThermalDiscomfortReduction(Shadingwithout
aluminum)
ThermalDiscomfortReduction(Shading
with aluminum)
37% 41% 19% 22% 31% 38% 90%
53
,8%
52
,0% 69
,5%
68
,0%
65
,9%
63
,6%
59
,5%
IL1
27% 30% 30% 33% 36% 40% 87%
IL1 IL1 IL1 IL1 IL1 IL1
80
,2%
81
,6%
79
,7%
79
,3%
79
,1%
78
,3% 86
,1%
IL1 IL1 IL1 IL1 IL1 IL1 IL1
Energy Efficiency, Thermal and Visual Comfort Study Page 11
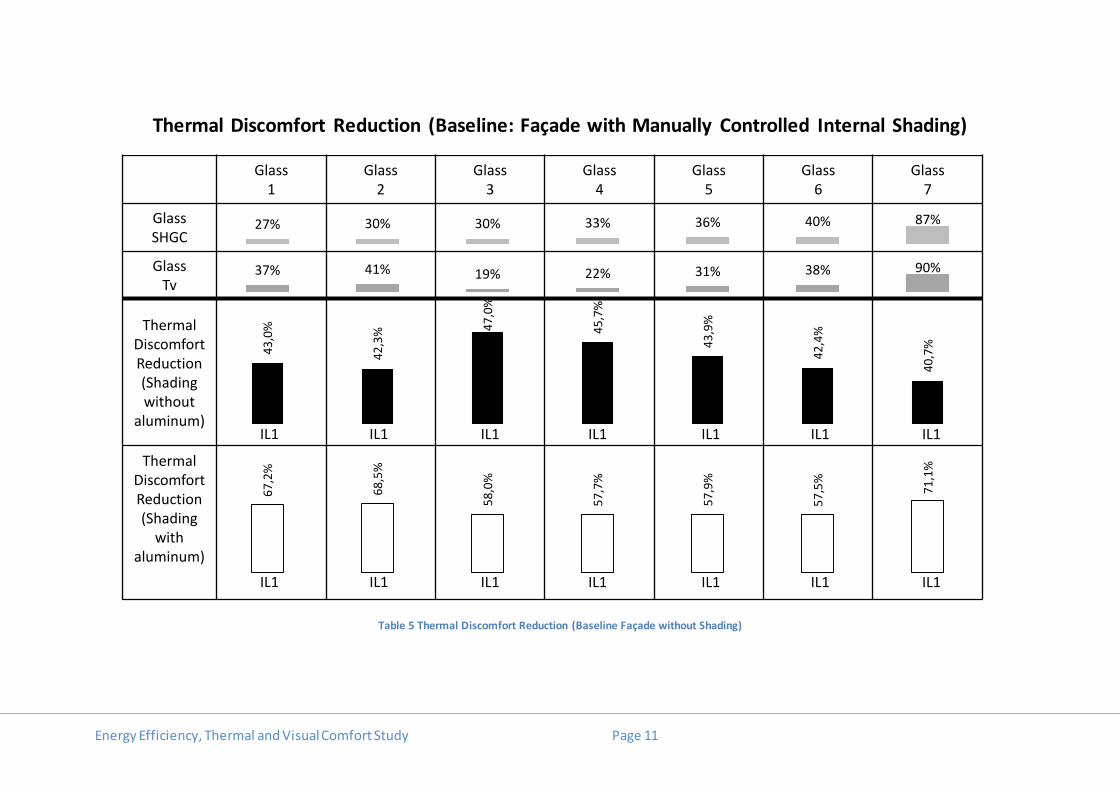
Thermal Discomfort Reduction (Baseline: Façade with Manually Controlled Internal Shading)
Table 5 Thermal Discomfort Reduction (Baseline Façade without Shading)
Glass1
Glass2
Glass3
Glass4
Glass5
Glass6
Glass7
GlassSHGC
GlassTv
ThermalDiscomfortReduction(Shadingwithout
aluminum)
ThermalDiscomfortReduction(Shading
with aluminum)
37% 41% 19% 22% 31% 38% 90%4
3,0
%
42
,3% 4
7,0
%
45
,7%
43
,9%
42
,4%
40
,7%
IL1
27% 30% 30% 33% 36% 40% 87%
IL1 IL1 IL1 IL1 IL1 IL1
67
,2%
68
,5%
58
,0%
57
,7%
57
,9%
57
,5%
71
,1%
IL1 IL1 IL1 IL1 IL1 IL1 IL1

Energy Efficiency, Thermal and Visual Comfort Study Page 12
Figure 2 Thermal discomfort in degrees hour above 25°C in operating temperature.
Glass 1
(27%)
Insulated
Glass 2
(30%)
Insulated
Glass 3
(30%)
Laminated
Glass 4
(33%)
Laminated
Glass 5
(36%)
Laminated
Glass 6
(40%)
Laminated
Glass 7
(87%)
Single Pane
Glass (SHGC Value)
Roller BlindFabric
Base lineIntegration
Level 1No Roller Blinds
Manual Roller Blinds
Non coated
Aluminum coated
x+x+
Thermal discomfort Degrees hour above 25°C in operating temperature

Energy Efficiency, Thermal and Visual Comfort Study Page 13
Conclusions of thermal comfort study:
The use of automated internal shading (IL1) reduces significantly the thermal
discomfort, between 40,7% to 86,1% and therefore allows the specification of
broader options of glasses with higher SHGC value without impairing the
occupant comfort;
The major reduction in discomfort is achieved in glasses with higher SHGC
value;
The internal shading with aluminum coated fabric achieved higher reduction in
thermal discomfort;
Besides the discomfort reduction the study also demonstrates reduction in
radiant discomfort asymmetry usual in buildings with large glass area.
VISUAL COMFORT STUDY
The study evaluates the influence of the automated shading on occupant visual
comfort along the façade perimeter.
The visual comfort is the maximum interior daylight iluminance measured at 0,5 meter
from the façade considering the maximum outside luminance condition along the year.
Several studies show 4.000 lux in interior daylight iluminance as the maximum
acceptable for occupant’s visual comfort.
The Table 6 and Table 7 show the reduction in the interior daylight iluminance and
represent the various simulation scenarios based on the selected glass and shading
fabric.
The Figure 3 shows, for the different types of glass, the interior daylight iluminance for
baseline models and for each integration level considering two types of shading fabric.

Energy Efficiency, Thermal and Visual Comfort Study Page 14
Interior Daylight Iluminance Reduction (Baseline: Façade without Internal Shading)
Table 6 Interior Daylight Iluminance reduction (Baseline Façade without Shading)
Glass1
Glass2
Glass3
Glass4
Glass5
Glass6
Glass7
GlassSHGC
GlassTv
IncomingDaylightingReduction(Shadingwithout
aluminum)
IncomingDaylightingReduction(Shading
with aluminum)
37% 41% 19% 22% 31% 38% 90%8
8,6
%
89
,1%
87
,4%
88
,5%
88
,8%
88
,7% 9
4,3
%
IL1
27% 30% 30% 33% 36% 40% 87%
IL1 IL1 IL1 IL1 IL1 IL1
90
,8%
89
,8%
89
,1%
90
,4%
91
,5%
90
,9%
94
,7%
IL1 IL1 IL1 IL1 IL1 IL1 IL1

Energy Efficiency, Thermal and Visual Comfort Study Page 15
Interior Daylight Iluminance Reduction (Baseline: Façade with Manually Controlled Internal Shading)
Table 7 Interior Daylight Iluminance reduction (Baseline: Façade with Manually Controlled Internal Shading)
Glass1
Glass2
Glass3
Glass4
Glass5
Glass6
Glass7
GlassSHGC
GlassTv
ThermalDiscomfortReduction(Shadingwithout
aluminum)
ThermalDiscomfortReduction(Shading
with aluminum)
37% 41% 19% 22% 31% 38% 90%7
5,8
%
77
,1%
73
,6%
75
,7%
76
,3%
76
,1% 88
,1%
IL1
27% 30% 30% 33% 36% 40% 87%
IL1 IL1 IL1 IL1 IL1 IL1
80
,6%
78
,6%
77
,2%
79
,7%
82
,1%
80
,8% 88
,8%
IL1 IL1 IL1 IL1 IL1 IL1 IL1

Energy Efficiency, Thermal and Visual Comfort Study Page 16
Interior Daylight Iluminance - Maximum Values
Figure 3 Interior Daylight Iluminance - Maximum Values
Roller BlindFabric
Base lineIntegration
Level 1No Roller Blinds
Manual Roller Blinds
Non coated
Aluminum coated
x+x+
Glass 1
(37%)
Insulated
Glass 2
(41%)
Insulated
Glass 3
(19%)
Laminated
Glass 4
(22%)
Laminated
Glass 5
(31%)
Laminated
Glass 6
(38%)
Laminated
Glass 7
(90%)
Single Pane
Glass (Tv)
Energy Efficiency, Thermal and Visual Comfort Study Page 17
Conclusions of visual comfort study:
It can be seen at the photometric curves that the use of automated internal
shading significantly reduces the daylight iluminance levels near windows. This
iluminance reduction brings uniformity of ambient light of the office area
reducing discomfort due to difference in brightness;
The reduction in daylight iluminance is between 73,3% and 94,7% at 0,5 meter
from the façade;
Automatically opening the internal shading at façades that are not having
directly sun incidence, increases the clarity of these areas without creating
discomfort and allows outside viewing to the occupants;
The maximum interior daylight iluminance reduction was achieved with the
glass with higher Tv.
Final conclusion:
The integration of Somfy automation systems, Philips and CCN, linked to the Uniflex
internal shading brings benefits to all areas, reducing the building's consumption and
also improving the thermal and visual comfort levels for office occupants.

Energy Efficiency, Thermal and Visual Comfort Study Page 18
2. DESCRIPTION OF THE INTEGRATED AUTOMATION SOLUTION
The solution integrates the Internal Shading, lighting and HVAC systems.
The use of high performance materials for solar protection and their automation
enables greater use of natural light in the workplace ensuring thermal and visual
comfort and providing better working conditions for its occupants . When integrated to
lighting and HVAC automation significantly increases the energy efficiency of the
building by reducing consumption of HVAC and artificial lighting.
2.1 INTERNAL SHADING (INTERIOR ROLLER BLINDS) - UNIFLEX
In the study two distinct shading fabrics were used:
The “Thermoscreen”, without aluminum layer (Figure 4)
Figure 4 Thermoscreen fabric
The “Platinumscreen”, with aluminum layer (Figure 5)
Figure 5 Platinumscreen fabric
The Figure 6 shows the interior shading (interior roller blinds) installation close to
façade.
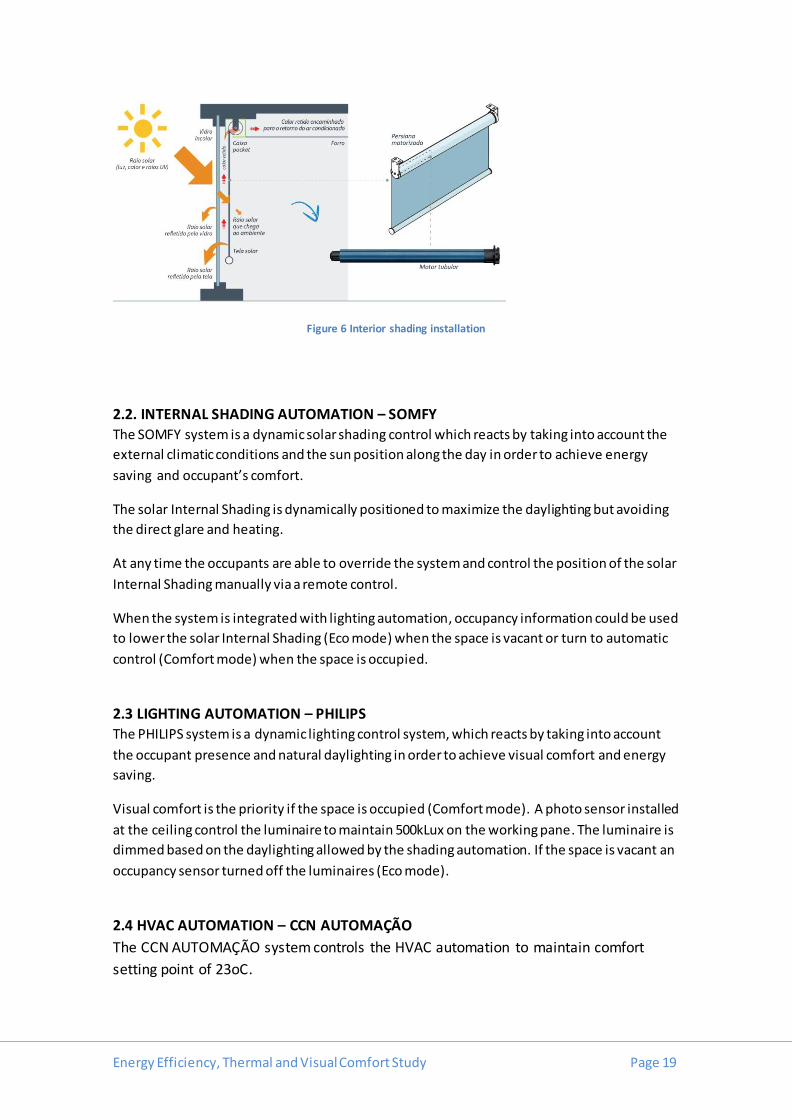
Energy Efficiency, Thermal and Visual Comfort Study Page 19
Figure 6 Interior shading installation
2.2. INTERNAL SHADING AUTOMATION – SOMFY
The SOMFY system is a dynamic solar shading control which reacts by taking into account the
external climatic conditions and the sun position along the day in order to achieve energy
saving and occupant’s comfort.
The solar Internal Shading is dynamically positioned to maximize the daylighting but avoiding
the direct glare and heating.
At any time the occupants are able to override the system and control the position of the solar
Internal Shading manually via a remote control.
When the system is integrated with lighting automation, occupancy information could be used
to lower the solar Internal Shading (Eco mode) when the space is vacant or turn to automatic
control (Comfort mode) when the space is occupied.
2.3 LIGHTING AUTOMATION – PHILIPS The PHILIPS system is a dynamic lighting control system, which reacts by taking into account
the occupant presence and natural daylighting in order to achieve visual comfort and energy
saving.
Visual comfort is the priority if the space is occupied (Comfort mode). A photo sensor installed
at the ceiling control the luminaire to maintain 500kLux on the working pane. The luminaire is
dimmed based on the daylighting allowed by the shading automation. If the space is vacant an
occupancy sensor turned off the luminaires (Eco mode).
2.4 HVAC AUTOMATION – CCN AUTOMAÇÃO
The CCN AUTOMAÇÃO system controls the HVAC automation to maintain comfort
setting point of 23oC.

Energy Efficiency, Thermal and Visual Comfort Study Page 20
When the system is integrated with shading and lighting automation, occupancy information
could be used to increase the setting point to 28oC (Eco mode) when the space is vacant or
turn to 23oC (Comfort mode) when the space is occupied.
2.5 INTEGRATION LEVELS
The integrated automation solution is composed by 3 progressive integration levels
between Internal Shading, lighting and HVAC (Table 8).
The integration is made possible by the use of open communication protocols.
Integration Levels
Systems Remarks
Internal Shading Lighting HVAC
Integration Level 1
Manual lighting Control HVAC not integrated
Integration Level 2
X HVAC not integrated
Integration Level 3
X X All systems integrated
Table 8 Integration levels
3. CONTROL ALGORITHMS
3.1. INTERNAL SHADING
3.1.1. MANUAL CONTROL
In this control mode, the shading is manually operated by the occupants. The control
model of the shading was based on models identified in technical literature. According
to Silva, in 2012 the shades are operated based on three reasons:
The Illuminance on the work plane
The visual discomfort caused by light
Direct sunlight, which influences both the thermal and visual comfort.
According to the literature the shades are open when the first person arrives at the
office and is closed using the parameters described in the paragraph above, and
according to Mahdavi these shades remains closed until the end of the day.
Silva, 2012 presents a compilation of literature and methodologies of the manual
control of shades, amongst them the EN ISO 13790 which assumes that the shadings
are closed when the radiation reaches 300 W/m2. Others assume the value of 50
W/m2. Mahdavi assumes the value of 250W/m2 and distinct occurrence frequency for
each facade.

Energy Efficiency, Thermal and Visual Comfort Study Page 21
Mahdavi, 2009 shows that the probability of the shades be closed will vary with the
level of incidence on the facades. The exception would be the northern and southern
facades that practically do not vary with solar radiation according to a survey done by
him in 5 offices and presented Figure 7.
Figure 7 Percentage of shade deployment according to solar radiation
According to Figure 7 the lowest percentage of usage is 15% closed in south facades
for a maximum of 75% closed in the north facade and between 15% and 75 % for the
other facades. Based on this information the methodology was developed, as shown in
Table 9.
NORTH Facade (22.5° azimuth)
Early in the morning: blinds are opened (15% remain closed) During the day: 75% of the blinds are closed after 250 W/m2 At the end of the workday: Blinds are opened (15% remain closed)
SOUTH facade (Azimuth 202.5°)
Early in the morning: blinds are opened (15% remain closed) During the day: 15% of the blinds are closed after 250 W/m2 At the end of the workday: Blinds are opened (15% remain closed)
EAST -WEST Facade (Azimuth 112.5° and 292.5°)
Early in the morning: blinds are opened (15% remain closed) During the day: 50% of the blinds are closed after 250 W/m2 and 75% are closed after 500 W/m2 At the end of the workday: Blinds are opened (15% remain closed)
Remark: After closing the blinds, they remained closed until the end of the day Table 9 Manual control of blinds
3.1.2. AUTOMATED CONTROL

Energy Efficiency, Thermal and Visual Comfort Study Page 22
3.1.2.1 TIMER AND EXTERNAL ILLUMINANCE BASED CONTROL (INTEGRATION LEVEL
1)
The blind is automatically controlled according to external illuminance level and sun
position along the day according to sun tracking system developed by Somfy. When
the façade does not receive direct radiation from the sun the blinds are 40% lowered
to offer a better visual comfort to the occupants.
There are distinct control modes dependent on the weekday and weekend. During
weekdays the blind control is actively and during the weekend the blinds are lowered
and static to prevent heating.
3.1.2.1 OCCUPANCY, TIMER AND EXTERNAL ILLUMINANCE BASED CONTROL
(INTEGRATION LEVEL 2 AND 3)
The blind is automatically controlled according first to occupancy schedule and then to
external illuminance level and sun position along the day.
3.2. LIGHTING
3.2.1. TIME BASED CONTROL (INTEGRATION LEVEL 1)
The model operates continuously from the early hours until the end of the day, 7.00
until 22.00 during the weekdays.
During the weekends the lights are off.
3.2.2. OCCUPANCY BASED SWITCHING AND DAYLIGHT DIMMING CONTROL
(INTEGRATION LEVEL 2 AND 3)
This is an automated switching control based on the sensed occupancy status and also
adds dimming due to available daylight.
The illumination is controlled by the presence sensor and the light sensor, which is
influenced by the operation of the shadings.
3.3. HVAC
3.3.1. TIME BASED CONTROL (INTEGRATION LEVEL 1 AND 2)
The model operates continuously, maintaining the comfort set point (23oC) from the
early hours until the end of the day, 7.00 until 22.00 during the weekdays.
3.3.2. OCCUPANCY BASED CONTROL (INTEGRATION LEVEL 2 AND 3)

Energy Efficiency, Thermal and Visual Comfort Study Page 23
This is an automated control based on the sensed occupancy status increasing the set
point from 23oC to 27oC when there isn’t occupancy at the controlled zone. With
occupancy the set point is maintained at 23oC (comfort temperature).
4. ENERGY EFFICIENCY STUDY
4.1 METHODOLOGY
Dynamic computer simulation based on an office building model was used to quantify
the impact in energy consumption (kWh/year) of the progressive integration levels
between Internal Shading, lighting and HVAC automation. The energy consumption
with no shading and with manual shading was also calculated in order to indicate the
energy savings provided by each integration level.
The simulation focused on the open plan and meeting room areas , excluding the
circulating area.
4.1.1 CLIMATIC CONDITION
To conduct the heat load simulation and then the analysis of annual energy
performance of the building , files with temperature data, dry bulb and wet bulb , air
pressure, wind speed and direction, solar radiation and cloud cover will be used to
represent the climate conditions of the city of Rio de Janeiro - RJ. The location of Rio
de Janeiro is 22.9° South and 43.17° West and altitude of 3 m. Climate data, which was
used in energy simulation, have the TMY format (Test Meteorological Year) and were
developed by the National Institute for Space Research (INPE). From this climate f ile
gives the parameters; Radiation, Illuminance and Temperatures, dry and wet bulb.
Solar radiation is shown in Figure 8 and is responsible for heat passing through the
window area of the building.

Energy Efficiency, Thermal and Visual Comfort Study Page 24
Figure 8 Direct and global solar radiation on a horizontal plane, total media a day [Wh / sf2]
The external Illuminance is shown in Figure 9 and will be responsible for the lighting of
the work environment, which influenced the rate of natural lighting.
Figure 9 Direct and global illumination on a horizontal plane, hourly average [lux]

Energy Efficiency, Thermal and Visual Comfort Study Page 25
The dry bulb temperature and wet bulb data are shown in Figure 10, and are
responsible for heat exchange in the envelope and the heat load of the renovation air.
Figure 10 Temperature [° C ] of dry bulb ( a) and wet bulb ( b ) of the city of Rio de Janeiro
The design data for calculating the cooling load condition are shown in Table 10. The
peak conditions used to scale the capacity of the equipment are obtained from three
days defined in ASHRAE 90.1-2007 standard design with the following probability of
occurrence: 99.6 % for heating design temperature and 1 % for cooling design
temperature of dry bulb and wet bulb.
Parameter DBT 99,6% Heating
DBT 1,0% Cooling
DBT 1,0% Cooling
Maximum dry bulb temperature
(° C )
16,1 32,7 30,3
Temperature Range (° C)
0 6,1 6,1
Wet bulb temperature (° C)
13,5 25,0 26,2
Atmospheric
pressure ( Pa) 101290 101290 101290
Wind speed (m /s) 2,5 3,9 3,9
Wind direction
(degrees from the northern)
310° 30° 30°
Sky cloud Index 0 ( cloudy sky ) 1,00 (clear sky) 1,00 (clear sky) Day of the month 21 21 21
Month July February February Table 10 Cooling and heating load calculation (São Paulo - SP)

Energy Efficiency, Thermal and Visual Comfort Study Page 26
4.1.2. OFFICE BUILDING MODEL
The extensive use of glass façade on the modeled building is representative of the
current commercial building architecture. The building was modeled in EnergyPlus
software. Its volume and internal layout were shown in Figure 11.
Figure 11 Volume and internal layout of studied building
The characteristics of the building envelope, its materials and dimensions have been
established following the architectural project, which are shown in Table 11.
Characteristics Proposed
Thermal transmittance
(U) [W / m².K]
Façade Glass See Table 2 Wall 1,6
Floor 3,6 Roof 3,6
Façade Glass SHGC See Table 2
Visible Light transmittance See Table 2
Glass area of the facade 63% (of the whole façade)
65% (of the typical floor plan) Table 11 Characteristics of the building envelope
The properties of the seven types of façade glass used in the study are shown in Table
12.

Energy Efficiency, Thermal and Visual Comfort Study Page 27
Glass # 1 2 3 4 5 6 7
Glass Type Coated Insula ted
Coated Insula ted
CoatedLaminated
CoatedLaminated
CoatedLaminated
Coated Laminated
Non CoatedSingle Pane
Thermal transmittance (U value)
2,8 2,8 5,16 5,16 5,16 5,16 XX
SHGC
(g value) 0,27 0,30 0,30 0,33 0,36 0,40 0,87
Visible Light
transmittance (Tv)
0,37 0,41 0,19 0,22 0,31 0,38 0,90
Table 12 Characteristics of simulated glass
The thermal loads used in this model are detailed in Table 13.
Thermal Loads Lighting 6,3 W/m2 (Based on Philips lighting design)
Equipments 16.2 W/m2 (Market average)
Personnel
Office area : 96 people
General Director: 1 person Meeting room 1: 12 people
Meeting room 2 : 6 people 2 Booth Room : 4 people 1 room service : 2 people Coffee room : 4 people
External air 27 m3/h People (117 people)
Table 13 Data of thermal loads
The occupancy pattern was based on the average for a commercial building between
7.00 and 22.00 and followed a pattern of random distribution as adopted by Shen
(2014) and Andersen (2013), and standard Open Office occupation area following the
occupation of Figure 12, as the rest of the rooms operates according to Table 14.
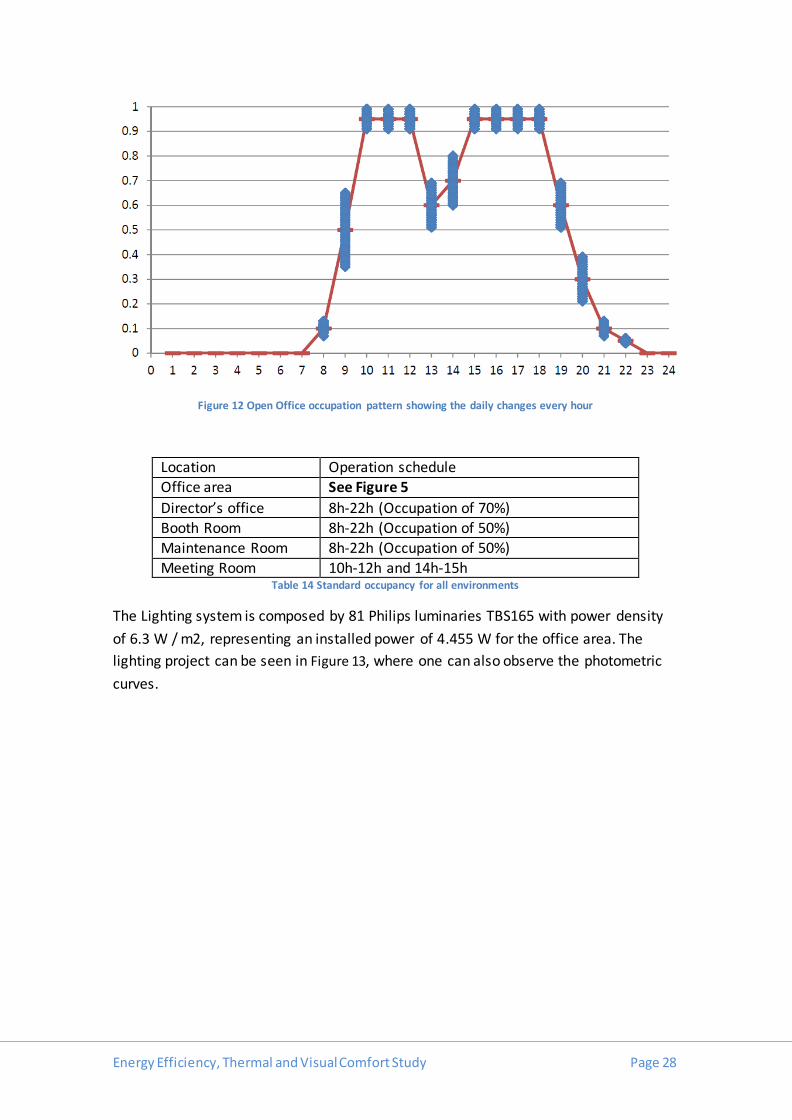
Energy Efficiency, Thermal and Visual Comfort Study Page 28
Figure 12 Open Office occupation pattern showing the daily changes every hour
Location Operation schedule Office area See Figure 5
Director’s office 8h-22h (Occupation of 70%) Booth Room 8h-22h (Occupation of 50%)
Maintenance Room 8h-22h (Occupation of 50%)
Meeting Room 10h-12h and 14h-15h Table 14 Standard occupancy for all environments
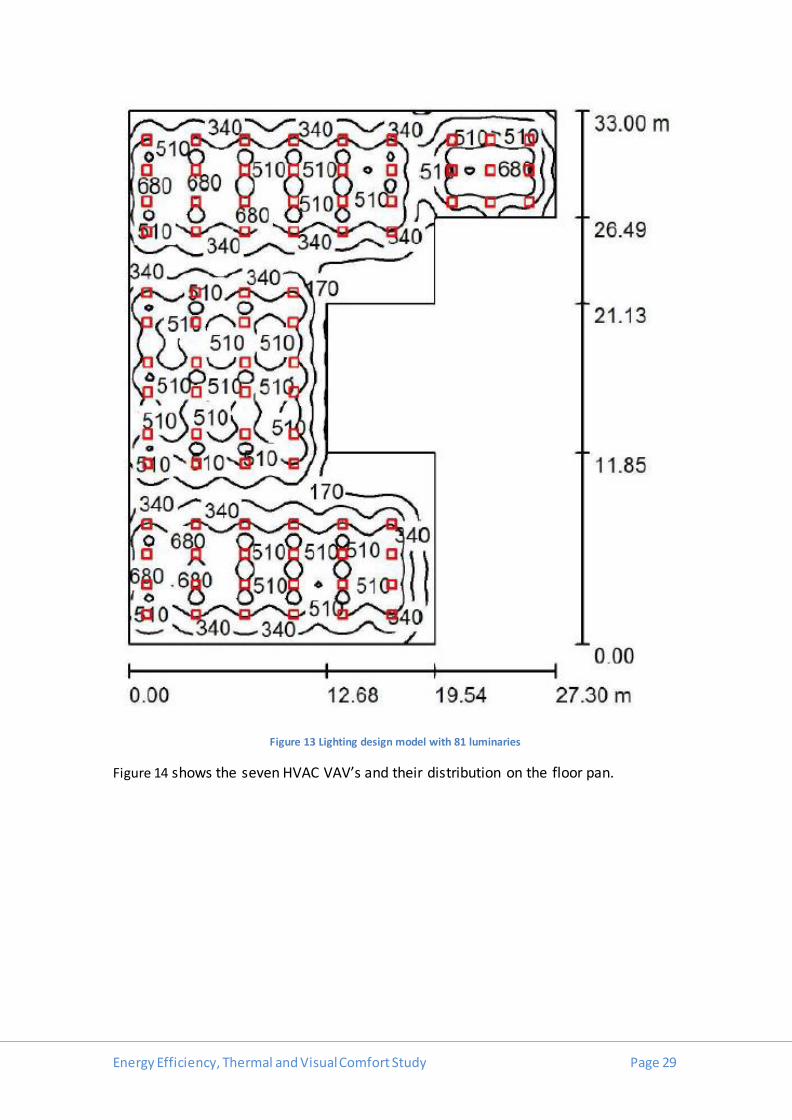
The Lighting system is composed by 81 Philips luminaries TBS165 with power density
of 6.3 W / m2, representing an installed power of 4.455 W for the office area. The
lighting project can be seen in Figure 13, where one can also observe the photometric
curves.
Energy Efficiency, Thermal and Visual Comfort Study Page 29
Figure 13 Lighting design model with 81 luminaries
Figure 14 shows the seven HVAC VAV’s and their distribution on the floor pan.

Energy Efficiency, Thermal and Visual Comfort Study Page 30
Figure 14 HVAC VAV’s and their distribution on the floor pan
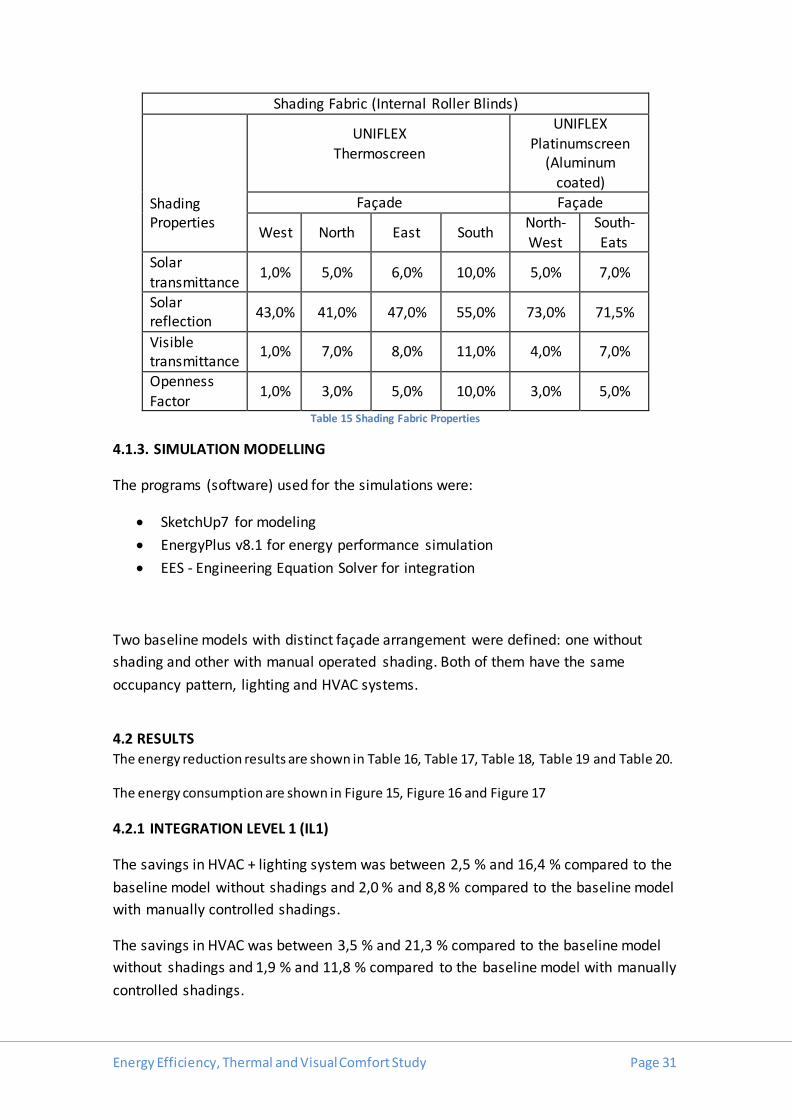
The properties of the two types of Internal Shading fabrics used in the study were
shown in Table 15.
Energy Efficiency, Thermal and Visual Comfort Study Page 31
Shading Fabric (Internal Roller Blinds)
Shading Properties
UNIFLEX Thermoscreen
UNIFLEX Platinumscreen
(Aluminum coated)
Façade Façade
West North East South North-
West
South-
Eats Solar
transmittance 1,0% 5,0% 6,0% 10,0% 5,0% 7,0%
Solar reflection
43,0% 41,0% 47,0% 55,0% 73,0% 71,5%
Visible transmittance
1,0% 7,0% 8,0% 11,0% 4,0% 7,0%
Openness
Factor 1,0% 3,0% 5,0% 10,0% 3,0% 5,0%
Table 15 Shading Fabric Properties
4.1.3. SIMULATION MODELLING
The programs (software) used for the simulations were:
SketchUp7 for modeling
EnergyPlus v8.1 for energy performance simulation
EES - Engineering Equation Solver for integration
Two baseline models with distinct façade arrangement were defined: one without
shading and other with manual operated shading. Both of them have the same
occupancy pattern, lighting and HVAC systems.
4.2 RESULTS
The energy reduction results are shown in Table 16, Table 17, Table 18, Table 19 and Table 20.
The energy consumption are shown in Figure 15, Figure 16 and Figure 17
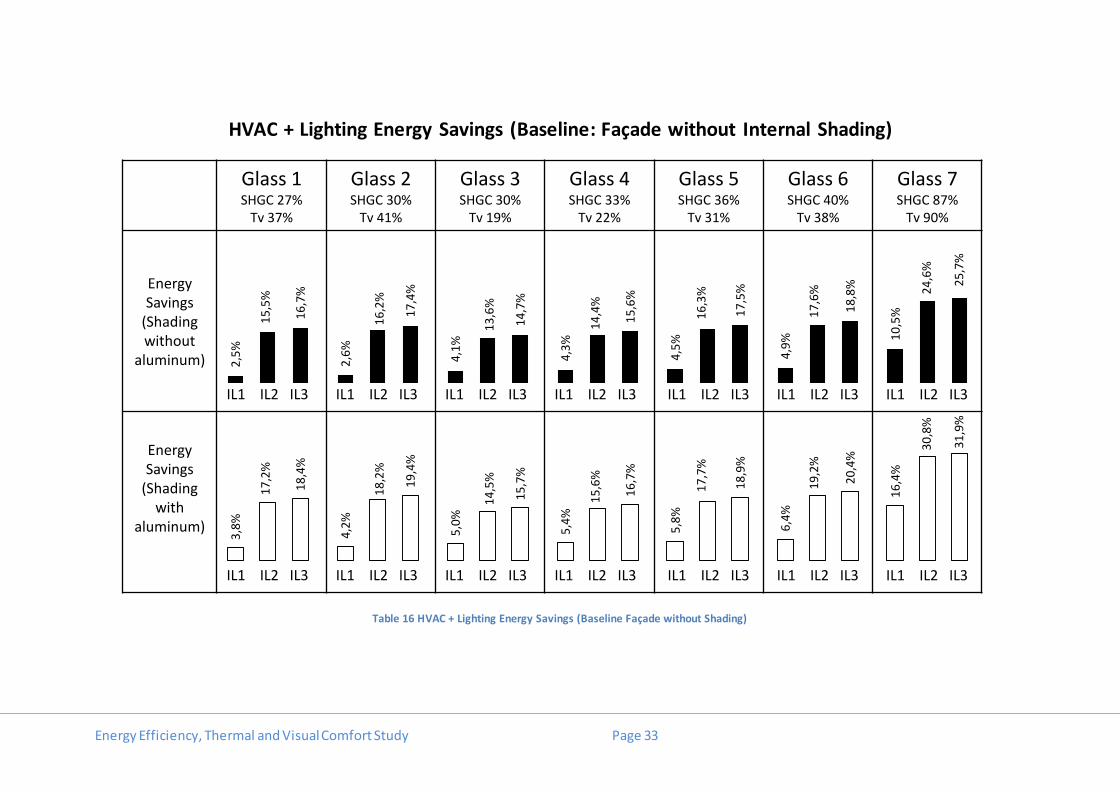
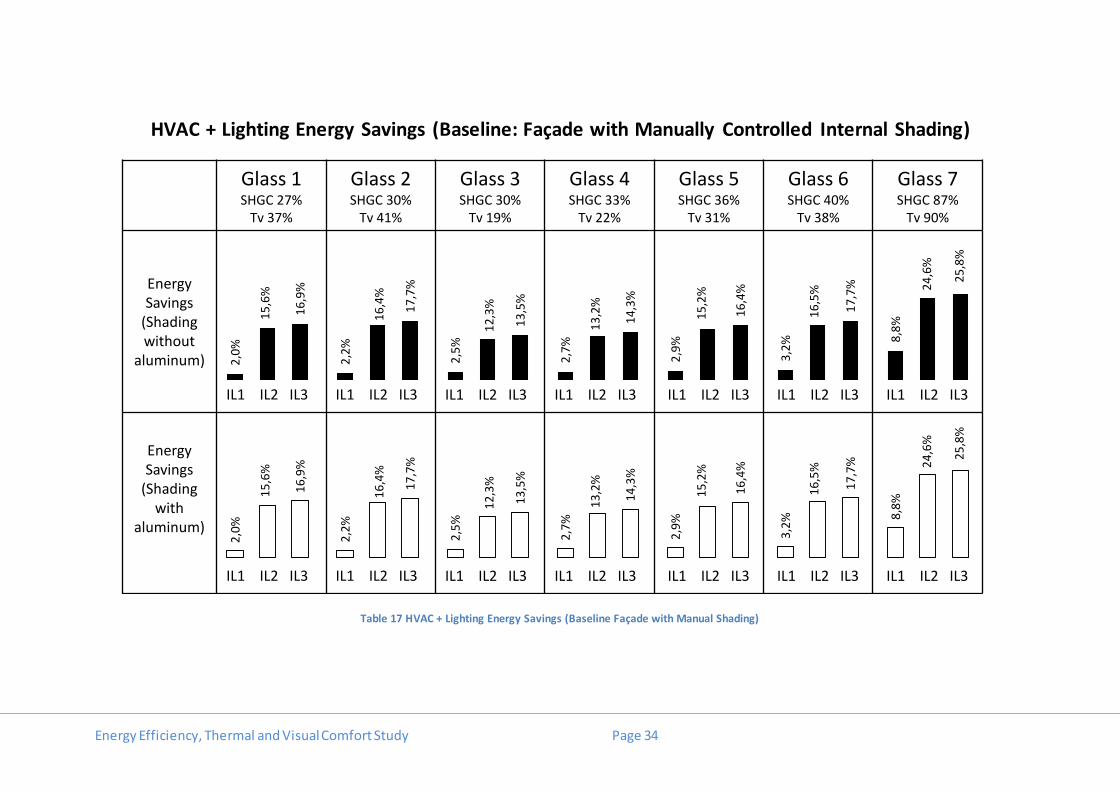
4.2.1 INTEGRATION LEVEL 1 (IL1)
The savings in HVAC + lighting system was between 2,5 % and 16,4 % compared to the
baseline model without shadings and 2,0 % and 8,8 % compared to the baseline model
with manually controlled shadings.
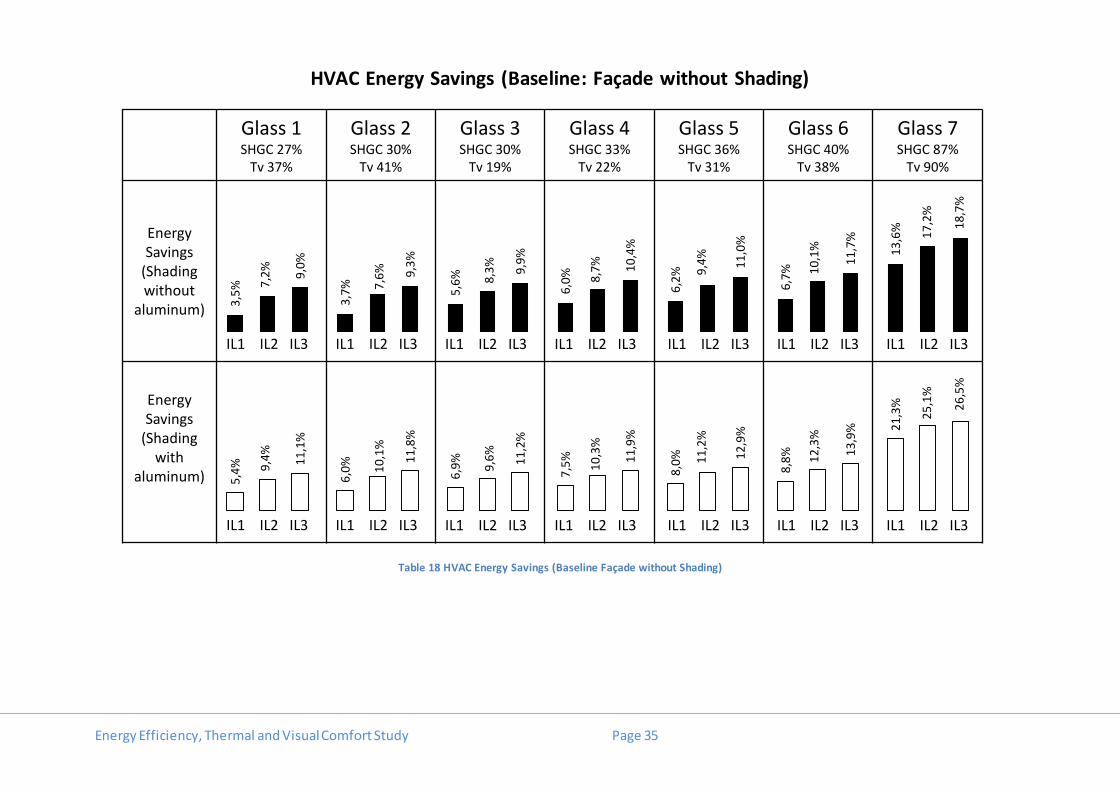
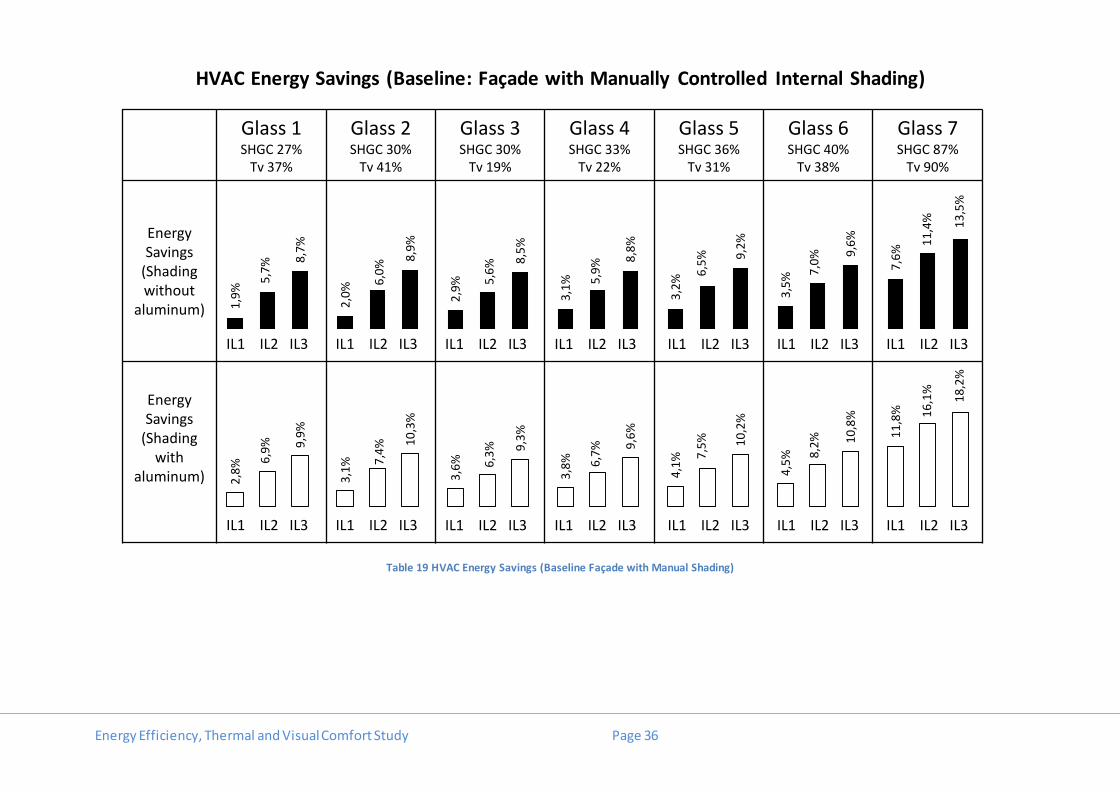
The savings in HVAC was between 3,5 % and 21,3 % compared to the baseline model
without shadings and 1,9 % and 11,8 % compared to the baseline model with manually
controlled shadings.

Energy Efficiency, Thermal and Visual Comfort Study Page 32
4.2.2. INTEGRATION LEVEL 2 (IL2)
The savings in HVAC + lighting system was between 15,5 % and 30,8 % compared to
the baseline model without shadings and 15,6 % and 24,6 % compared to the baseline
model with manually controlled shadings.
The savings in HVAC system was between 7,2 % and 25,1 % compared to the baseline
model without shadings and 5,7 % and 16,1 % compared to the baseline model with
manually controlled shadings.
The savings in lighting system was between 35,9 % and 49,9 % compared to the
baseline model with manually controlled lighting.
4.2.3 INTEGRATION LEVEL 3 (IL3)
The savings in HVAC + lighting system was between 16,7 % and 31,9 % compared to
the baseline model without shadings and 16,9 % and 25,8 % compared to the baseline
model with manually controlled shadings.
The savings in HVAC system was between 9,0 % and 26,5 % compared to the baseline
model without shadings and 8,7 % and 18,2 % compared to the baseline model with
manually controlled shadings.
The savings in lighting system was between 35,9 % and 49,9 % compared to the
baseline model with manually controlled lighting.
Energy Efficiency, Thermal and Visual Comfort Study Page 33
HVAC + Lighting Energy Savings (Baseline: Façade without Internal Shading)
Table 16 HVAC + Lighting Energy Savings (Baseline Façade without Shading)
Glass 1SHGC 27%
Tv 37%
Glass 2SHGC 30%
Tv 41%
Glass 3SHGC 30%
Tv 19%
Glass 4SHGC 33%
Tv 22%
Glass 5SHGC 36%
Tv 31%
Glass 6SHGC 40%
Tv 38%
Glass 7SHGC 87%
Tv 90%
Energy Savings
(Shadingwithout
aluminum)
Energy Savings
(Shading with
aluminum)
2,5
%
2,6
%
4,1
%
4,3
%
4,5
%
4,9
% 10
,5%15
,5%
16
,2%
13
,6%
14
,4%
16
,3%
17
,6% 2
4,6
%
16
,7%
17
,4%
14
,7%
15
,6%
17
,5%
18
,8% 2
5,7
%
IL1 IL2 IL3 IL1 IL2 IL3
3,8
%
4,2
%
5,0
%
5,4
%
5,8
%
6,4
%
16
,4%
17
,2%
18
,2%
14
,5%
15
,6%
17
,7%
19
,2%
30
,8%
18
,4%
19
,4%
15
,7%
16
,7%
18
,9%
20
,4%
31
,9%
IL1 IL2 IL3 IL1 IL2 IL3 IL1 IL2 IL3 IL1 IL2 IL3 IL1 IL2 IL3
IL1 IL2 IL3 IL1 IL2 IL3 IL1 IL2 IL3 IL1 IL2 IL3 IL1 IL2 IL3 IL1 IL2 IL3 IL1 IL2 IL3
Energy Efficiency, Thermal and Visual Comfort Study Page 34
HVAC + Lighting Energy Savings (Baseline: Façade with Manually Controlled Internal Shading)
Table 17 HVAC + Lighting Energy Savings (Baseline Façade with Manual Shading)
Glass 1SHGC 27%
Tv 37%
Glass 2SHGC 30%
Tv 41%
Glass 3SHGC 30%
Tv 19%
Glass 4SHGC 33%
Tv 22%
Glass 5SHGC 36%
Tv 31%
Glass 6SHGC 40%
Tv 38%
Glass 7SHGC 87%
Tv 90%
Energy Savings
(Shadingwithout
aluminum)
Energy Savings
(Shading with
aluminum)
IL1 IL2 IL3 IL1 IL2 IL3 IL1 IL2 IL3 IL1 IL2 IL3 IL1 IL2 IL3 IL1 IL2 IL3 IL1 IL2 IL3
IL1 IL2 IL3 IL1 IL2 IL3 IL1 IL2 IL3 IL1 IL2 IL3 IL1 IL2 IL3 IL1 IL2 IL3 IL1 IL2 IL3
2,0
%
2,2
%
2,5
%
2,7
%
2,9
%
3,2
% 8,8
%15
,6%
16
,4%
12
,3%
13
,2%
15
,2%
16
,5% 2
4,6
%
16
,9%
17
,7%
13
,5%
14
,3%
16
,4%
17
,7% 2
5,8
%
2,0
%
2,2
%
2,5
%
2,7
%
2,9
%
3,2
% 8,8
%15
,6%
16
,4%
12
,3%
13
,2%
15
,2%
16
,5% 2
4,6
%
16
,9%
17
,7%
13
,5%
14
,3%
16
,4%
17
,7% 2
5,8
%
Energy Efficiency, Thermal and Visual Comfort Study Page 35
HVAC Energy Savings (Baseline: Façade without Shading)
Table 18 HVAC Energy Savings (Baseline Façade without Shading)
Glass 1SHGC 27%
Tv 37%
Glass 2SHGC 30%
Tv 41%
Glass 3SHGC 30%
Tv 19%
Glass 4SHGC 33%
Tv 22%
Glass 5SHGC 36%
Tv 31%
Glass 6SHGC 40%
Tv 38%
Glass 7SHGC 87%
Tv 90%
Energy Savings
(Shadingwithout
aluminum)
Energy Savings
(Shading with
aluminum)
3,5
%
3,7
%
5,6
%
6,0
%
6,2
%
6,7
%
13
,6%
7,2
%
7,6
%
8,3
%
8,7
%
9,4
%
10
,1%
17
,2%
9,0
%
9,3
%
9,9
%
10
,4%
11
,0%
11
,7%
18
,7%
IL1 IL2 IL3 IL1 IL2 IL3
5,4
%
6,0
%
6,9
%
7,5
%
8,0
%
8,8
%
21
,3%
9,4
%
10
,1%
9,6
%
10
,3%
11
,2%
12
,3%
25
,1%
11
,1%
11
,8%
11
,2%
11
,9%
12
,9%
13
,9%
26
,5%
IL1 IL2 IL3 IL1 IL2 IL3 IL1 IL2 IL3 IL1 IL2 IL3 IL1 IL2 IL3
IL1 IL2 IL3 IL1 IL2 IL3 IL1 IL2 IL3 IL1 IL2 IL3 IL1 IL2 IL3 IL1 IL2 IL3 IL1 IL2 IL3
Energy Efficiency, Thermal and Visual Comfort Study Page 36
HVAC Energy Savings (Baseline: Façade with Manually Controlled Internal Shading)
Table 19 HVAC Energy Savings (Baseline Façade with Manual Shading)
Glass 1SHGC 27%
Tv 37%
Glass 2SHGC 30%
Tv 41%
Glass 3SHGC 30%
Tv 19%
Glass 4SHGC 33%
Tv 22%
Glass 5SHGC 36%
Tv 31%
Glass 6SHGC 40%
Tv 38%
Glass 7SHGC 87%
Tv 90%
Energy Savings
(Shadingwithout
aluminum)
Energy Savings
(Shading with
aluminum)
IL1 IL2 IL3 IL1 IL2 IL3 IL1 IL2 IL3 IL1 IL2 IL3 IL1 IL2 IL3 IL1 IL2 IL3 IL1 IL2 IL3
IL1 IL2 IL3 IL1 IL2 IL3 IL1 IL2 IL3 IL1 IL2 IL3 IL1 IL2 IL3 IL1 IL2 IL3 IL1 IL2 IL3
1,9
%
2,0
%
2,9
%
3,1
%
3,2
%
3,5
%
7,6
%
5,7
%
6,0
%
5,6
%
5,9
%
6,5
%
7,0
%
11
,4%
8,7
%
8,9
%
8,5
%
8,8
%
9,2
%
9,6
%
13
,5%
2,8
%
3,1
%
3,6
%
3,8
%
4,1
%
4,5
%
11
,8%
6,9
%
7,4
%
6,3
%
6,7
%
7,5
%
8,2
%
16
,1%
9,9
%
10
,3%
9,3
%
9,6
%
10
,2%
10
,8%
18
,2%

Energy Efficiency, Thermal and Visual Comfort Study Page 37
Lighting Energy Savings (Baseline: Manually Controlled Lighting)
Table 20 Lighting Energy Savings (Baseline Manual Control)
Glass 1SHGC 27%
Tv 37%
Glass 2SHGC 30%
Tv 41%
Glass 3SHGC 30%
Tv 19%
Glass 4SHGC 33%
Tv 22%
Glass 5SHGC 36%
Tv 31%
Glass 6SHGC 40%
Tv 38%
Glass 7SHGC 87%
Tv 90%
Energy Savings
(Shadingwithout
aluminum)
Energy Savings
(Shading with
aluminum)
0,0
%
0,0
%
0,0
%
0,0
%
0,0
%
0,0
%
0,0
%
35
,9%
37
,6%
27
,2%
29
,4%
34
,7%
37
,9%
49
,1%
35
,9%
37
,6%
27
,2%
29
,4%
34
,7%
37
,9% 49
,1%
IL1 IL2 IL3 IL1 IL2 IL3
0,0
%
0,0
%
0,0
%
0,0
%
0,0
%
0,0
%
0,0
%
36
,5%
38
,3%
27
,2%
29
,4%
34
,8%
38
,2% 49
,9%
36
,5%
38
,3%
27
,2%
29
,4%
34
,8%
38
,2% 49
,9%
IL1 IL2 IL3 IL1 IL2 IL3 IL1 IL2 IL3 IL1 IL2 IL3 IL1 IL2 IL3
IL1 IL2 IL3 IL1 IL2 IL3 IL1 IL2 IL3 IL1 IL2 IL3 IL1 IL2 IL3 IL1 IL2 IL3 IL1 IL2 IL3

Energy Efficiency, Thermal and Visual Comfort Study Page 38
HVAC + Lighting Energy Consumption
Figure 15 HVAC + Lighting Energy Consumption
Glass 1SHGC 27%
Tv 37%
Glass 2SHGC 30%
Tv 41%
Glass 3SHGC 30%
Tv 19%
Glass 4SHGC 33%
Tv 22%
Glass 5SHGC 36%
Tv 31%
Glass 6SHGC 40%
Tv 38%
Glass 7SHGC 87%
Tv 90%
ShadingFabric
Manual Shading
Integration LevelNo
ShadingLevel 1
Level2
Level 3
Noncoated
Aluminum coated
x+x+
Energy Efficiency, Thermal and Visual Comfort Study Page 39
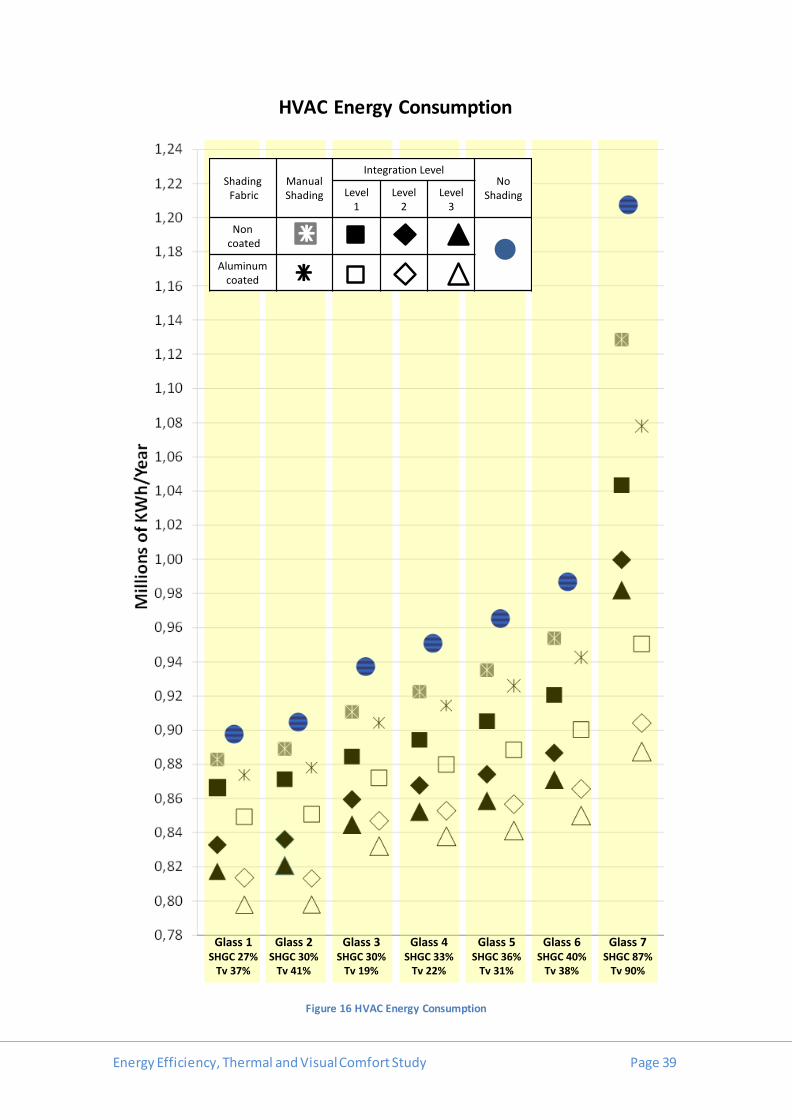
HVAC Energy Consumption
Figure 16 HVAC Energy Consumption
Glass 1SHGC 27%
Tv 37%
Glass 2SHGC 30%
Tv 41%
Glass 3SHGC 30%
Tv 19%
Glass 4SHGC 33%
Tv 22%
Glass 5SHGC 36%
Tv 31%
Glass 6SHGC 40%
Tv 38%
Glass 7SHGC 87%
Tv 90%
ShadingFabric
Manual Shading
Integration LevelNo
ShadingLevel 1
Level2
Level 3
Noncoated
Aluminum coated
x+x+

Energy Efficiency, Thermal and Visual Comfort Study Page 40
Lighting Energy Consumption
Figure 17 Lighting Energy Consumption
Glass 1SHGC 27%
Tv 37%
Glass 2SHGC 30%
Tv 41%
Glass 3SHGC 30%
Tv 19%
Glass 4SHGC 33%
Tv 22%
Glass 5SHGC 36%
Tv 31%
Glass 6SHGC 40%
Tv 38%
Glass 7SHGC 87%
Tv 90%
ShadingFabric
Manual Shading
Integration LevelNo
ShadingLevel 1
Level2
Level 3
Noncoated
Aluminum coated
x+x+

Energy Efficiency, Thermal and Visual Comfort Study Page 41
4.3. ENERGY EFFICIENCY STUDY CONCLUSIONS
The results demonstrate energy efficiency improvement for all analyzed
integration levels;
The use of automated internal shading (IL1) reduces the HVAC energy
consumption between 2,0% to 16,4% and therefore allows the specification of
a broader options of glasses with higher SHGC value without impairing the
energy consumption;
The performance of internal shading with aluminum coated fabric increases
when combined with glasses with higher SHGC value and should certainly be
considered if higher OPEX are desired;
The adoption of automated internal shading in retrofit of commercial buildings
could allow the maintenance of the original glass with high SHGC values;
The lighting automation integrated with internal shading automation (IL2) has a
significant impact on energy consumption reduction, between 12,3% to 30,8% .
This reduction is higher with glasses with higher transmittance of visible light
(Tv) which enhances the harvesting of natural light into the workplace;
The major savings in energy consumption is achieved when all systems are
integrated (IL3), between 13,5% to 31,9%.

Energy Efficiency, Thermal and Visual Comfort Study Page 42
5. THERMAL COMFORT STUDY
5.1 METHODOLOGY
The analysis was based on standard thermal comfort ASHRAE 55-2004. To define the
thermal comfort of occupied areas the parameters used, by HVAC designers, as shown
in Table 21.
Parameter Values Reference
Air temperature Minimum = 21° C Maximum = 25°C
Set point for office area (23°C ± 2 ° C).
Radiant
temperature -
Radiant temperature depends on the solar radiation on the facade of
the building
Operating temperature
Minimum = 21° C Maximum = 25°C
Parameter used to assess the comfort level of the occupants.
It should be close to air temperature, ie 23°C ± 2°C.
Representing a percentage of dissatisfied occupants inside
recommended by ASHRAE 55-2004 : 21°C = 7% of dissatisfied (winter
situation ) 25°C = 6% of dissatisfied (summer situation )
Relative humidity
Between 45 and 55 %
HVAC systems do not have humidity
control, but are designed to keep the relative humidity near 50%
Air velocity Summer < = 0.20m/s Winter < = 0.15 m/s
Air velocity predicted by NBR 16401 - Part 2
Cloth Factor Summer = 0.5 clo
Winter = 0.9 clo
Typical clothing for summer and
winter situations, according to NBR 16401
Activity Level 1,2 met Typical office activity Table 21 Parameters for comfort analysis
The operating temperature is the parameter used for comfort, because it represents
an equivalent temperature between the air temperature and radiant temperature, so
representing the temperature perceived by the human body.
This temperature should be close to the air temperature, but does not necessarily
occur due to high solar radiation rates in Brazil or the large glass area in commercial
buildings.
In this analysis the operating temperatures exceeding 25 ° C will be verified.
Energy Efficiency, Thermal and Visual Comfort Study Page 43
This methodology analyzes the parameter of time equivalent degrees (° C-h), which
represents how many times the temperature limit (25°C) was exceeded and for how
long. For instance, if during the day a working temperature environment reach 27°C
for 2 hours, then we will have an equivalent of (27°C-25°C)*2h = 4°C-h.
5.1.1 CLIMATE CONDITION
Same as used for Energy Efficiency Study.
5.1.2 OFFICE BUILDING MODEL
Same as used for Energy Efficiency Study.
5.1.3. SIMULATION MODELLING
The computer programs (software used for the simulations) were:
SketchUp7 for modeling ;
EnergyPlus v8.1 , for temperatures simulation
EES - Engineering Equation Solver for processing the data.
5.2. RESULTS
The Thermal Discomfort Reduction are shown in Table 22 and Table 23. The reduction
was between 52,0 % and 86,1 % compared to the baseline model without shadings and
40,7 % and 71,1 % compared to the baseline model with manually controlled shadings.
The results degrees-hour for each studied glasses is shown in Figure 18.

Energy Efficiency, Thermal and Visual Comfort Study Page 44
Thermal Discomfort Reduction (Baseline: Façade without Shading)
Table 22 Thermal Discomfort Reduction (Baseline Façade without Shading)
Glass1
Glass2
Glass3
Glass4
Glass5
Glass6
Glass7
GlassSHGC
GlassTv
ThermalDiscomfortReduction(Shadingwithout
aluminum)
ThermalDiscomfortReduction(Shading
with aluminum)
37% 41% 19% 22% 31% 38% 90%
53
,8%
52
,0% 69
,5%
68
,0%
65
,9%
63
,6%
59
,5%
IL1
27% 30% 30% 33% 36% 40% 87%
IL1 IL1 IL1 IL1 IL1 IL1
80
,2%
81
,6%
79
,7%
79
,3%
79
,1%
78
,3% 86
,1%
IL1 IL1 IL1 IL1 IL1 IL1 IL1

Energy Efficiency, Thermal and Visual Comfort Study Page 45
Thermal Discomfort Reduction (Baseline: Façade with Manually Controlled Internal Shading)
Table 23 Thermal Discomfort Reduction (Baseline Façade without Shading)
Glass1
Glass2
Glass3
Glass4
Glass5
Glass6
Glass7
GlassSHGC
GlassTv
ThermalDiscomfortReduction(Shadingwithout
aluminum)
ThermalDiscomfortReduction(Shading
with aluminum)
37% 41% 19% 22% 31% 38% 90%4
3,0
%
42
,3% 4
7,0
%
45
,7%
43
,9%
42
,4%
40
,7%
IL1
27% 30% 30% 33% 36% 40% 87%
IL1 IL1 IL1 IL1 IL1 IL1
67
,2%
68
,5%
58
,0%
57
,7%
57
,9%
57
,5%
71
,1%
IL1 IL1 IL1 IL1 IL1 IL1 IL1

Figure 18 Thermal discomfort in degrees hour above 25°C in operating temperature
Glass 1
(27%)
Insulated
Glass 2
(30%)
Insulated
Glass 3
(30%)
Laminated
Glass 4
(33%)
Laminated
Glass 5
(36%)
Laminated
Glass 6
(40%)
Laminated
Glass 7
(87%)
Single Pane
Glass (SHGC Value)
Roller BlindFabric
Base lineIntegration
Level 1No Roller Blinds
Manual Roller Blinds
Non coated
Aluminum coated
x+x+
Thermal discomfort Degrees hour above 25°C in operating temperature

Energy Efficiency, Thermal and Visual Comfort Study Page 47
5.3. THERMAL COMFORT STUDY CONCLUSIONS
The use of automated internal shading (IL1) reduces significantly the thermal
discomfort, between 40,7% to 86,1% and therefore allows the specification of
broader options of glasses with higher SHGC value without impairing the
occupant comfort;
The reduction in degree -hours value depends on the type of glass and the
major reduction is achieved in glasses with higher SHGC value;
The internal shading with aluminum coated fabric achieved higher reduction in
thermal discomfort;
Besides the discomfort reduction the study also demonstrates reduction in
radiant discomfort asymmetry usual in buildings with large glass area.
Energy Efficiency, Thermal and Visual Comfort Study Page 48
6. VISUAL COMFORT STUDY
6.1 METHODOLOGY
The methodology for visual comfort analyzes how daylight is distributed within the
studied areas. This distribution is mainly affected by three factors:
Reflectance of internal surfaces: affected by the color of surfaces.
Glass Properties: transmittance and light reflection glasses
External Luminance: type of sky
The surfaces reflectance’s are shown in Table 24.
The glasses used in this study are the same seven glasses used in the Energy Efficiency
Study, detailed in Table 2.
These glasses can be divided into 3 groups:
Glasses with high luminous flux (1 , 2, 6 and 7 )
Glasses with average luminous flux (5)
Glasses with low luminous flux (3 and 4)
The types of sky studied were three: Clear, mixed and cloudy sky.
All types of skies were simulated for three days from 9.00 (worst case of the east
facade), 12.00 (worst case of Northern facade) and 15.00 (worst case the west façade).
6.1.1 CLIMATE CONDITION
Same as used for Energy Efficiency Study.
6.1.2 OFFICE BUILDING MODEL
Same as used for Energy Efficiency Study.
6.1.3. SIMULATION MODELLING
The computer programs (software) used for the simulations were:
Dialux 4.12 for simulating natural lighting.
Reflectance Equivalent color
Wall 0,7 Light-colored wall Ceiling 0,7 White ceiling
Floor 0,2 Dark Carpet Table 24 Surfaces reflectance’s
Energy Efficiency, Thermal and Visual Comfort Study Page 49
EES - Engineering Equation Solver to calculate the equivalent factors of
transmittance and reflectance
The study considers 3 models
Open base Model: considers the office with all shades open.
Manual control Base model: considers the office shades operating on manual
control model.
Automated shading Model: considers the shades automation model presented
by Somfy.
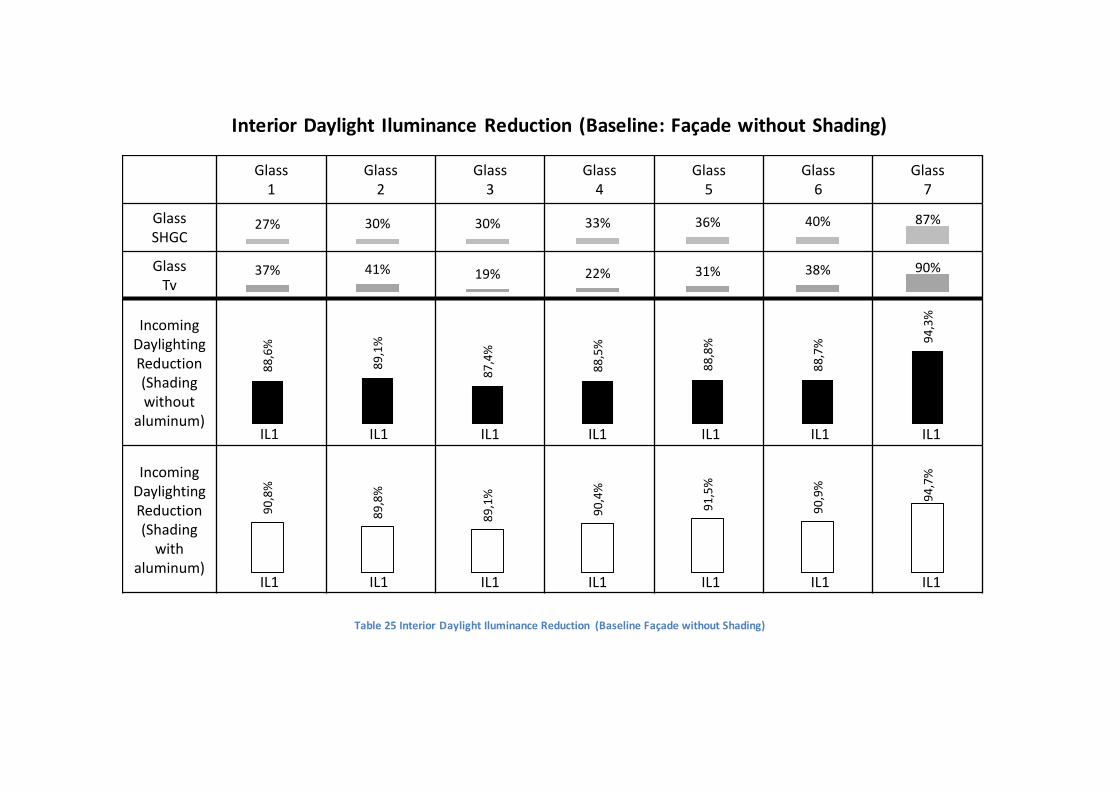
6.2. RESULTS
The interior daylight Reduction are shown in Table 25 and Table 26. The reduction was
between 87,4% and 94,7% compared to the baseline model without shadings and 73,6
% and 88,8 % compared to the baseline model with manually controlled shadings.
The maximum interior daylight iluminances is shown in Figure 18.
Interior Daylight Iluminance Reduction (Baseline: Façade without Shading)
Table 25 Interior Daylight Iluminance Reduction (Baseline Façade without Shading)
Glass1
Glass2
Glass3
Glass4
Glass5
Glass6
Glass7
GlassSHGC
GlassTv
IncomingDaylightingReduction(Shadingwithout
aluminum)
IncomingDaylightingReduction(Shading
with aluminum)
37% 41% 19% 22% 31% 38% 90%8
8,6
%
89
,1%
87
,4%
88
,5%
88
,8%
88
,7% 9
4,3
%
IL1
27% 30% 30% 33% 36% 40% 87%
IL1 IL1 IL1 IL1 IL1 IL1
90
,8%
89
,8%
89
,1%
90
,4%
91
,5%
90
,9%
94
,7%
IL1 IL1 IL1 IL1 IL1 IL1 IL1

Energy Efficiency, Thermal and Visual Comfort Study Page 51
Interior Daylight Iluminance Reduction (Baseline: Façade with Manually Controlled Internal Shading)
Table 26 Interior Daylight Iluminance Reduction (Baseline: Façade with Manually Controlled Internal Shading)
Glass1
Glass2
Glass3
Glass4
Glass5
Glass6
Glass7
GlassSHGC
GlassTv
ThermalDiscomfortReduction(Shadingwithout
aluminum)
ThermalDiscomfortReduction(Shading
with aluminum)
37% 41% 19% 22% 31% 38% 90%7
5,8
%
77
,1%
73
,6%
75
,7%
76
,3%
76
,1% 88
,1%
IL1
27% 30% 30% 33% 36% 40% 87%
IL1 IL1 IL1 IL1 IL1 IL1
80
,6%
78
,6%
77
,2%
79
,7%
82
,1%
80
,8% 88
,8%
IL1 IL1 IL1 IL1 IL1 IL1 IL1

Energy Efficiency, Thermal and Visual Comfort Study Page 52
Interior Daylight Iluminance - Maximum Values
Figure 19 Maximum Incoming Daylighting
Roller BlindFabric
Base lineIntegration
Level 1No Roller Blinds
Manual Roller Blinds
Non coated
Aluminum coated
x+x+
Glass 1
(37%)
Insulated
Glass 2
(41%)
Insulated
Glass 3
(19%)
Laminated
Glass 4
(22%)
Laminated
Glass 5
(31%)
Laminated
Glass 6
(38%)
Laminated
Glass 7
(90%)
Single Pane
Glass (Tv)
Energy Efficiency, Thermal and Visual Comfort Study Page 53
6.3. VISUAL COMFORT STUDY CONCLUSIONS
The automation of blinds generates the following benefits:
It can be seen at the photometric curves that the use of automated internal
shading significantly reduces the daylight iluminance levels near windows. This
iluminance reduction brings uniformity of ambient light of the office area
reducing discomfort due to difference in brightness;
The reduction in daylight iluminance is between 73,3% and 94,7% at 0,5 meter
from the façade;
Automatically opening the internal shading at façades that are not having
directly sun incidence, increases the clarity of these areas without creating
discomfort and allows outside viewing to the occupants;
The maximum interior daylight iluminance reduction was achieved with the
glass with higher Tv.
Energy Efficiency, Thermal and Visual Comfort Study Page 54
7. APPENDIX
7.1 REFERENCE STANDARDS
The analyses in this report were developed based on the standards and / or
procedures listed below:
NRB 16.401 Parts 1, 2, 3-2008 (HVAC plants).
ASHRAE Standard 90.1 Energy Standard for Building except Low- Rise
Residential Buildings
ASHRAE Standard 62.1 Ventilation for Acceptable Indoor Air Quality
ASHRAE Standard 55 Thermal Comfort Conditions for Human Occupancy
PROCEL EDIFICA Regulation for Labeling the Energy Efficiency Level of
Commercial and Public Services Buildings.
SMACNA Sheet Metal and Air Conditioning Contractors National Association.
7. 2 REFERENCES
ASHRAE - AMERICAN SOCIETY OF HEATING, REFRIGERATING AND AIR-
CONDITIONING ENGINEERS. Standard 90.1: Energy Standard for building Except
low-Rise residential Buildings, Atlanta, 2007.
ASHRAE - AMERICAN SOCIETY OF HEATING, REFRIGERATING AND AIR-
CONDITIONING ENGINEERS. Standard 62.1: Ventilation for Acceptable Indoor Air
Quality, Atlanta, 2010.
ASHRAE - AMERICAN SOCIETY OF HEATING, REFRIGERATING AND AIR-
CONDITIONING ENGINEERS. Standard 55: Thermal Environmental Conditions for
Human Occupancy, Atlanta, 2013.
UNITED STATES GREEN BUILDING COUNCIL. LEED ® Reference Guide for Green
Building Design and Construction, Washington, 2009.
ABNT NRB 16401 – ASSOCIAÇÃO BRASILEIRA DE NORMAS TÉCNICAS. Instalações de
ar condicionado – Sistemas centrais e unitários – Parte 1, Parte 2 e Parte 3, 2008.
Silva P.C., Leal V., Andersen M. Occupants Interaction with electric lighting and
shading system in real single-occupied offices: Results from a monitoring campaign.
Building and Environments 64, 152-168, 2013.
Silva P.C., Leal V., Andersen M. Influence of shading controls patterns on the
energy assessment of office spaces. Building and Environments 50, 35-48, 2012.
Mahdavi A., Pröglhöf C. Toward empirically-based model of people’s
presence and action in building. Eleventh International IBPSA Conference,
Glasgow-Scotland, 2009.

Energy Efficiency, Thermal and Visual Comfort Study Page 55
Shen E., Hu J., Patel M. Energy and visual comfort analysis of lighting and
daylight control strategies. Building and Environments 78, 155-170, 2014.
Andersen P.D., Iversen A., Madsen H., Rode C. Dynamic modeling of presence
of occupants using inhomogeneous Markov chains. Energy and Buildings 69,
213-223, 2014.