comfort -- the biggest driver of residential energy
TRANSCRIPT

2_Title Slide2_Title Slide
Better Buildings Residential Network
Peer Exchange Call Series:
Comfort – The Biggest Driver of Residential Energy
Efficiency?
February 13, 2020
Agenda and Ground Rules
▪ Agenda Review and Ground Rules
▪ Opening Poll
▪ Residential Network Overview and Upcoming Call Schedule
▪ Featured Speakers:
▪ Tom Turner, Austin Energy
▪ Vance Payne, National Institute of Standards and Technology (NIST)
▪ Kevin DeMaster, Mitsubishi Electric Trane HVAC US
▪ Open Discussion
▪ Closing Poll and Announcements
Ground Rules:
1. Sales of services and commercial messages are not appropriate during Peer
Exchange Calls.
2. Calls are a safe place for discussion; please do not attribute information to
individuals on the call.

Member Benefits:
▪ Recognition in media and publications
▪ Speaking opportunities
▪ Updates on latest trends
▪ Voluntary member initiatives
▪ One-on-One brainstorming conversations
Join the Network
Better Buildings Residential Network
For more information or to join, for no cost, email
[email protected], or go to energy.gov/eere/bbrn & click Join
Upcoming Calls (2nd & 4th Thursdays):
• Feb 27: Heat Pump Water Heaters – What You Need to Know Right Now
• Mar 12: The State of Gas Energy Efficiency Programs
• Mar 26: How Bad Installation Can Negate Good Equipment
Commitment:
▪ Members only need to
provide one number: their
organization’s number of
residential energy
upgrades per year, or
equivalent.
Peer Exchange Call summaries are posted on the Better Buildings website a few weeks after the call

Tom Turner
Austin Energy

Tom Turner
Austin Energy
Tom Turner
Austin Energy

Tom Turner
Austin Energy

Tom Turner
Austin Energy

Tom Turner
Austin Energy

Tom Turner
Austin Energy

Tom Turner
Austin Energy

Tom Turner
Austin Energy

Tom Turner
Austin Energy

Tom Turner
Austin Energy

Tom Turner
Austin Energy

Discussion
Open and close
your control
panel
Raise your
hand to enter
the discussion Please use the
questions box to
submit questions,
comments, or
alert us of
technical
difficulties
If you have called in on a phone today, double check that you’ve selected telephone
as your audio option.

Vance Payne
National Institute of Standards and Technology
(NIST)

HOW TO CHARACTERIZE RESIDENTIAL AIR
DISTRIBUTION SYSTEM PERFORMANCE FOR
THERMAL COMFORT?
Hyojin Kim1, Lisa Ng2, Vance Payne2, and Brian Dougherty2
1 New Jersey Institute of Technology, Newark, NJ2 National Institute of Standards and Technology, Gaithersburg, MD
DOE Webinar: “Comfort --- The Biggest Driver of Energy Efficiency”

19
NIST MSE RESEARCH GRANT
FINAL REPORT► Kim, H., K. Nguyen, A.
McGuinness, and T.V. Dai.
2019. Characterization of
Residential Air Distribution
System Performance for
Thermal Comfort. NIST GCR
19-021. 287 pages (December).
► Project PI: Hyojin Kim, Ph.D.,
currently at NJIT.
Full report is available at:
https://nvlpubs.nist.gov/nistpubs/gcr/2019/NIST.GCR.19
-021.pdf
20
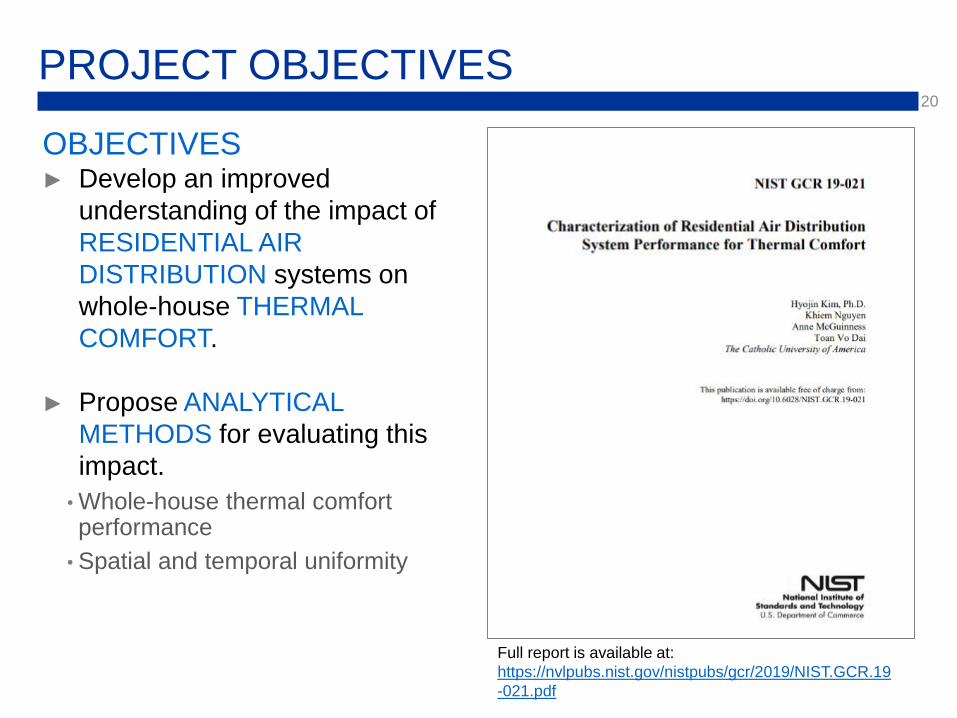
PROJECT OBJECTIVES
OBJECTIVES ► Develop an improved
understanding of the impact of
RESIDENTIAL AIR
DISTRIBUTION systems on
whole-house THERMAL
COMFORT.
► Propose ANALYTICAL
METHODS for evaluating this
impact.
• Whole-house thermal comfort performance
• Spatial and temporal uniformity
Full report is available at:
https://nvlpubs.nist.gov/nistpubs/gcr/2019/NIST.GCR.19
-021.pdf

NIST NZERTF21
NIST Net-Zero Energy Residential Test Facility (NZERTF)

NIST NZERTF22
► Laboratory with simulated occupancy/lighting/equipment

NIST NZERTF23
► Laboratory for full-scale testing of low-energy technology
CDHP “Big Duct” SDHV “Small Duct”
24
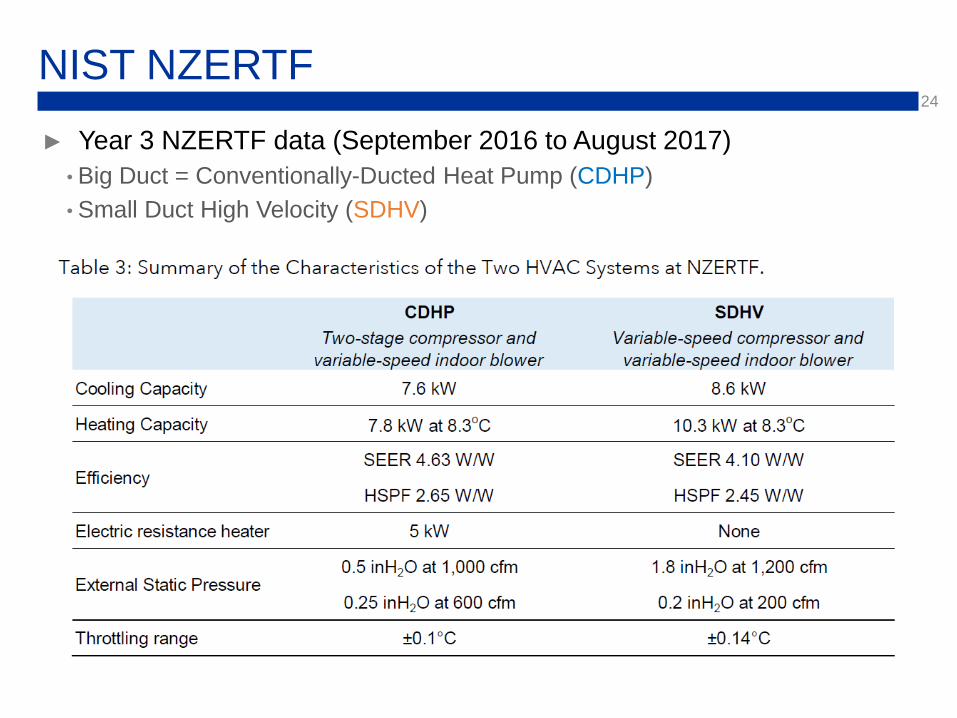
NIST NZERTF
► Year 3 NZERTF data (September 2016 to August 2017)
• Big Duct = Conventionally-Ducted Heat Pump (CDHP)
• Small Duct High Velocity (SDHV)

25
DATA COLLECTION
THERMAL COMFORT DATA COLLECTION► 1-min air temperature, humidity, and globe temperature data by room
► 10-sec thermal comfort data from a 3 x 3 x 3 grid system in BR3
One-Height (1.4 m)
Monitoring near Room Center3 x 3 x 3 Grid of Measurement System with
3 Heights (0.6 m 1.1m, 1.7m) at 9 Locations
26
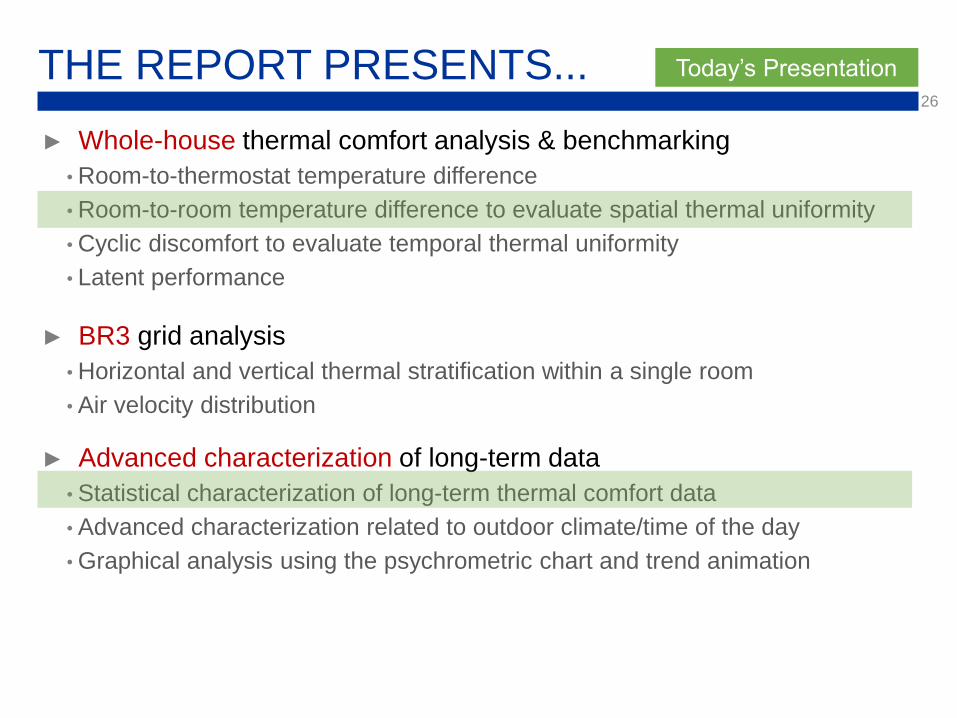
THE REPORT PRESENTS...
► Whole-house thermal comfort analysis & benchmarking
• Room-to-thermostat temperature difference
• Room-to-room temperature difference to evaluate spatial thermal uniformity
• Cyclic discomfort to evaluate temporal thermal uniformity
• Latent performance
► BR3 grid analysis
• Horizontal and vertical thermal stratification within a single room
• Air velocity distribution
► Advanced characterization of long-term data
• Statistical characterization of long-term thermal comfort data
• Advanced characterization related to outdoor climate/time of the day
• Graphical analysis using the psychrometric chart and trend animation
Today’s Presentation

27
APPROACH► Graphical indices for long-term
thermal comfort data to characterize
extreme variations based on ±1.5%,
±2.5%, ±5%, and ±10% deviation.
TEMPERATURE VARIATIONS
Annex G of DIN EN 15251
±1.5%
(3% total)
±2.5%
(5% total)

28
KEY FINDINGS: COOLING SEASON
TEMPERATURE VARIATIONS
1F
• Consistently low LR/KIT temperatures.
• On average, no noticeable difference in
temperatures between the systems.
• However, the CDHP maintained better temporal
variations with noticeably smaller IQR compared
to the SDHV.

29
KEY FINDINGS: COOLING SEASON
TEMPERATURE VARIATIONS
1F
2F
• A noticeable difference in temperatures
between the systems.
• SDHV maintained lower temperatures, which
was affected by favorable attic temperature
due to the SDHV ductwork within the attic.
30
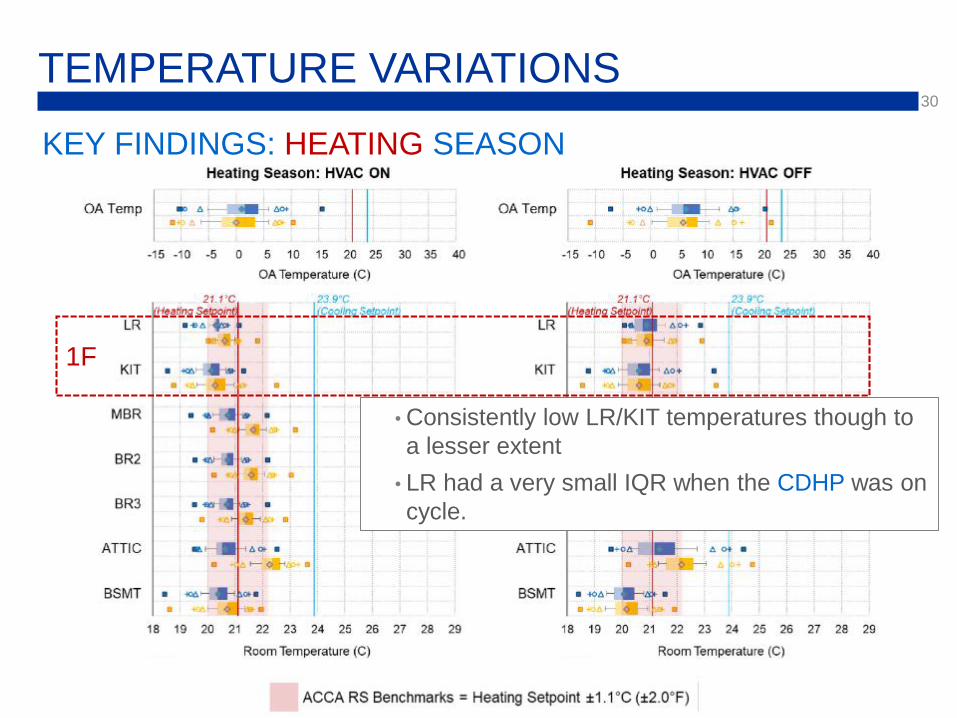
KEY FINDINGS: HEATING SEASON
TEMPERATURE VARIATIONS
1F
• Consistently low LR/KIT temperatures though to
a lesser extent
• LR had a very small IQR when the CDHP was on
cycle.
31
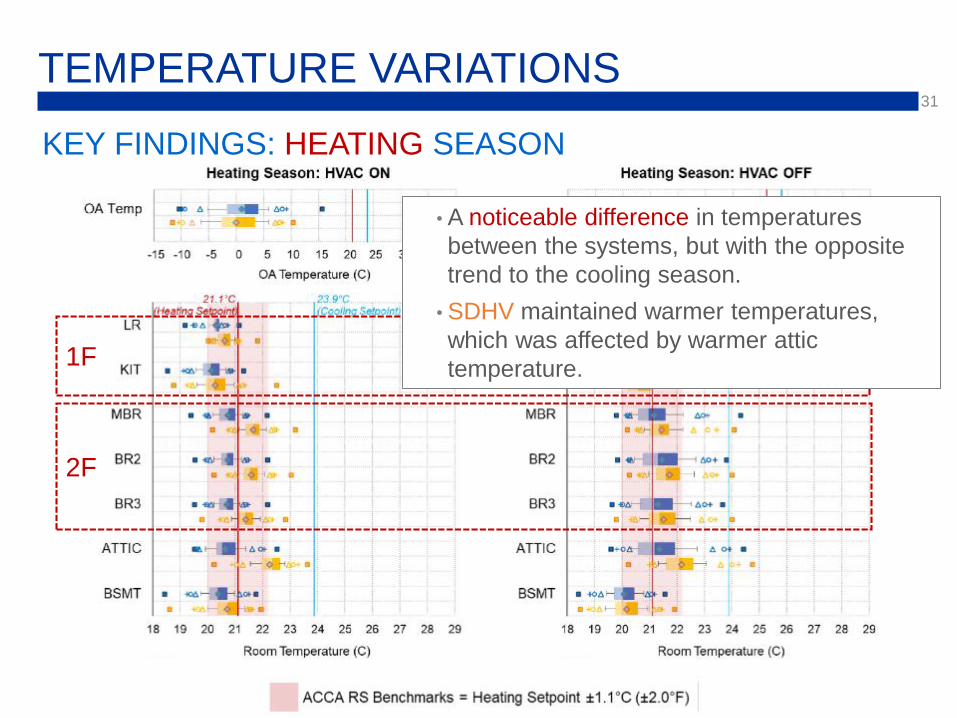
KEY FINDINGS: HEATING SEASON
TEMPERATURE VARIATIONS
1F
2F
• A noticeable difference in temperatures
between the systems, but with the opposite
trend to the cooling season.
• SDHV maintained warmer temperatures,
which was affected by warmer attic
temperature.
32
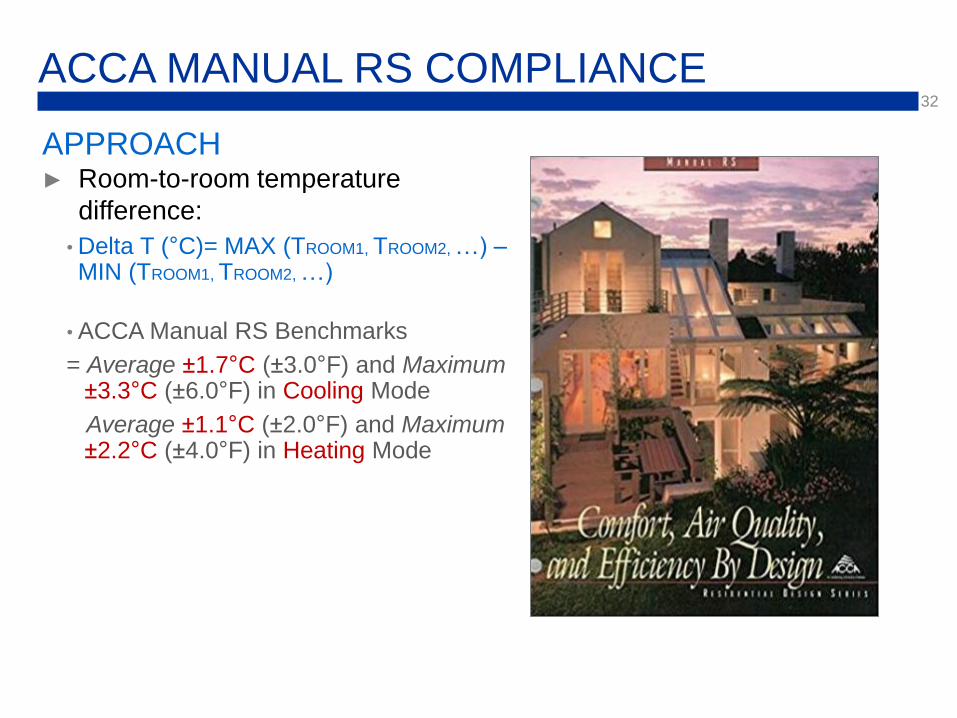
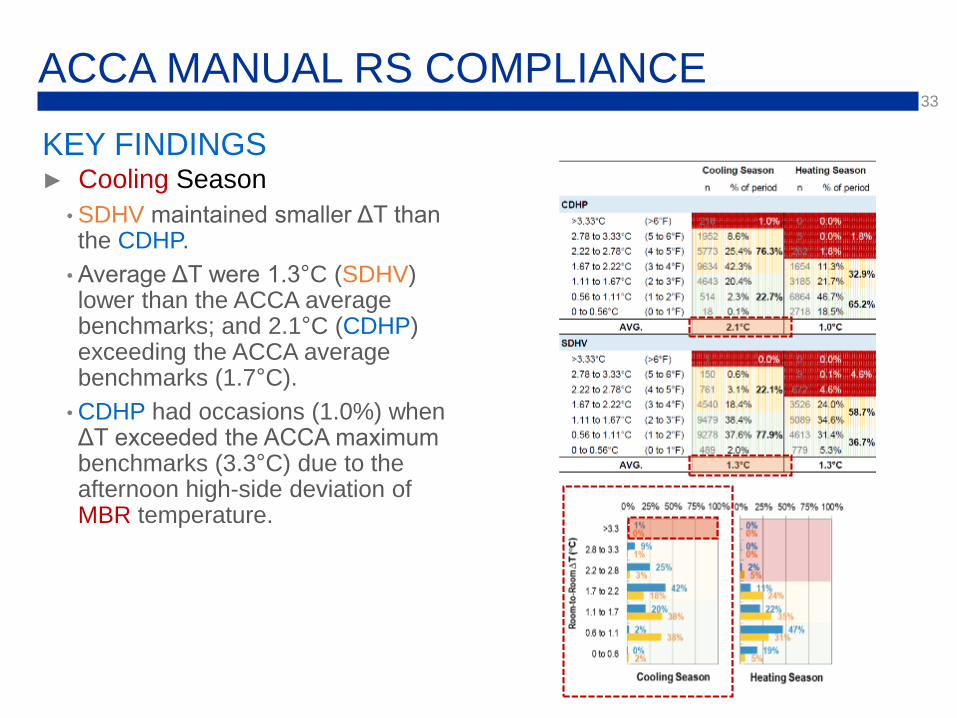
APPROACH► Room-to-room temperature
difference:
• Delta T (°C)= MAX (TROOM1, TROOM2, …) –MIN (TROOM1, TROOM2, …)
• ACCA Manual RS Benchmarks
= Average ±1.7°C (±3.0°F) and Maximum±3.3°C (±6.0°F) in Cooling Mode
Average ±1.1°C (±2.0°F) and Maximum±2.2°C (±4.0°F) in Heating Mode
ACCA MANUAL RS COMPLIANCE
33
KEY FINDINGS ► Cooling Season
• SDHV maintained smaller ΔT than the CDHP.
• Average ΔT were 1.3°C (SDHV) lower than the ACCA average benchmarks; and 2.1°C (CDHP) exceeding the ACCA average benchmarks (1.7°C).
• CDHP had occasions (1.0%) when ΔT exceeded the ACCA maximum benchmarks (3.3°C) due to the afternoon high-side deviation of MBR temperature.
ACCA MANUAL RS COMPLIANCE

34
KEY FINDINGS► Heating Season
• CDHP maintained smaller ΔT than the SDHV.
• Average ΔT were 1.0°C (CDHP) lower than the ACCA average benchmarks; and 1.3°C (SDHV) exceeding the ACCA average benchmarks (1.1°C).
• SDHV had more occasions when ΔT exceeded the ACCA maximum benchmarks (2.2°C) due to the nighttime low-side deviation of KITtemperature.
ACCA MANUAL RS COMPLIANCE

35
KEY FINDINGS► Comparison of the NZERTF cooling season results against the two
field studies
• Baskin and Vineyard (2003)
• Poerschke et al. (2016)
BENCHMARKING
Average ∆T
• NZERTF results were lower or similar to those of
other test houses for the respective systems.
• In all three studies, the SDHV provided lower room-
to-room ∆T.

36
KEY FINDINGS► Graphical comparison of the NZERTF cooling season results with
room-to-room ∆T reported by Poerschke and Beach (2016)
• 36 high-performance occupied houses in hot and humid climate
BENCHMARKING
• SDHV had better room-to-
room temperature uniformity
than the benchmarks based on
the cumulative data above the
40th percentile.
• However, the CDHP had larger
room-to-room temperature
uniformity except for the upper
10% of data along.

37
RECOMMENDATIONS
► Room air temperature is recommended as primary index for a residential
thermal uniformity analysis in terms of the house/HVAC system’s
fundamental ability to provide and deliver uniform space temperatures
across the house as installed.
• ACCA Manual RS benchmarks developed in 1997 may not be applicable for today’s low-load houses.
➔ Need to reexamine the ACCA Manual RS benchmarks based on low-
load house data.
► To fully understand the long-term thermal comfort data, it is
recommended to perform a statistical characterization of data for both
the primary rooms and the rooms that are thermally important due to
possible heat transfer from/to the primary rooms (e.g., attic).
► Proper data decomposition is necessary and essential to extract
meaningful information from large datasets.

MORE IN THE REPORT…
• Cyclic discomfort
• Latent performance
• Horizontal and vertical thermal stratification within a single room
• Air velocity distribution
• Advanced characterization related to outdoor climate/time of the day
• Graphical analysis using the psychrometric chart and trend
animation

Discussion
Open and close
your control
panel
Raise your
hand to enter
the discussion Please use the
questions box to
submit questions,
comments, or
alert us of
technical
difficulties
If you have called in on a phone today, double check that you’ve selected telephone
as your audio option.

Kevin DeMaster
Mitsubishi Electric Trane HVAC

Inverter Compressor Heat Pumps –

Challenge YOUR Thinking! - COMFORT

Challenge YOUR Thinking! – The NORM
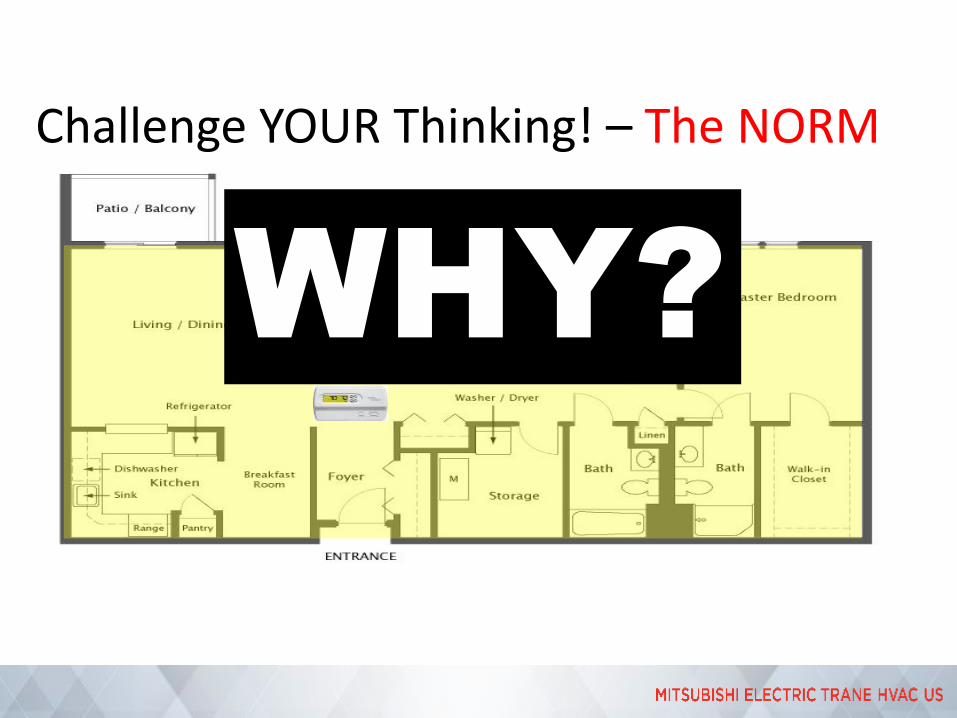
WHY?
Challenge YOUR Thinking! – The NORM

What do Consumers Want?
• More livable space
• Comfort
• Energy efficiency
• Healthier homes
• Peace of mind
• Quiet
• Environmentally Friendly

We All Have Heat Pump(s)

60Hz
0Hz
150Hz
30Hz
O
N
INVERTER compressor
Conventional compressor
INVERTER Technology

Technology Advancements - Zoned Comfort Solutions™

Mini Split Systems
Multi-Zone 2 – 8 ZonesSingle Zone
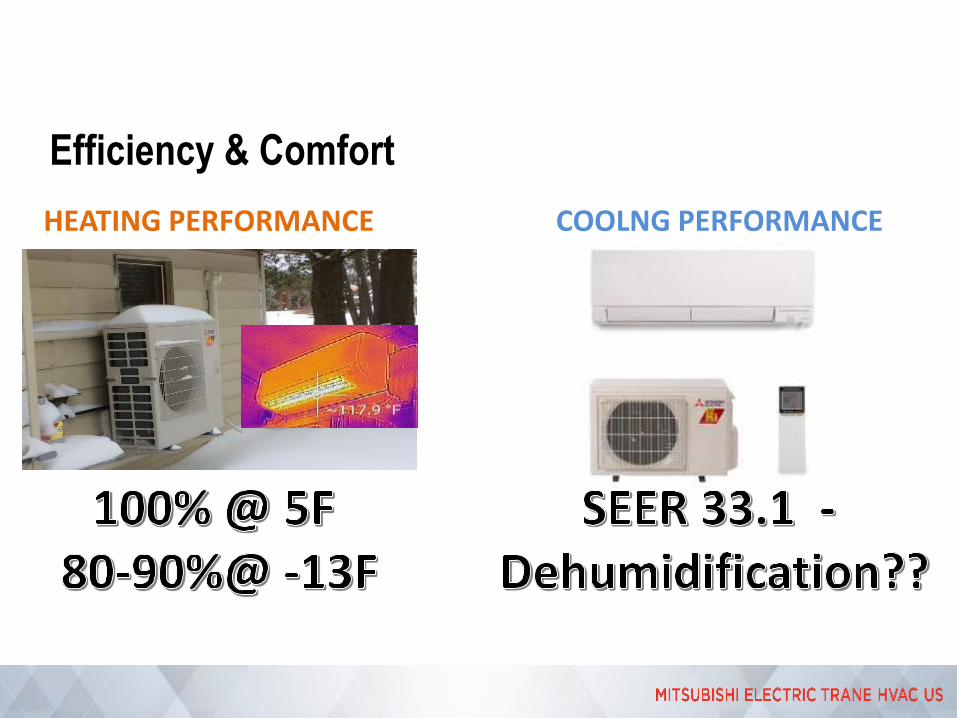
Efficiency & Comfort
HEATING PERFORMANCE COOLNG PERFORMANCE

Cold Climate Heat Pump Research
Minnesota
– Statewide Assessment
– Fossil fuel displacement
>55% Less Site EnergyAve 95% Compressor
Conclusion ccASHP work
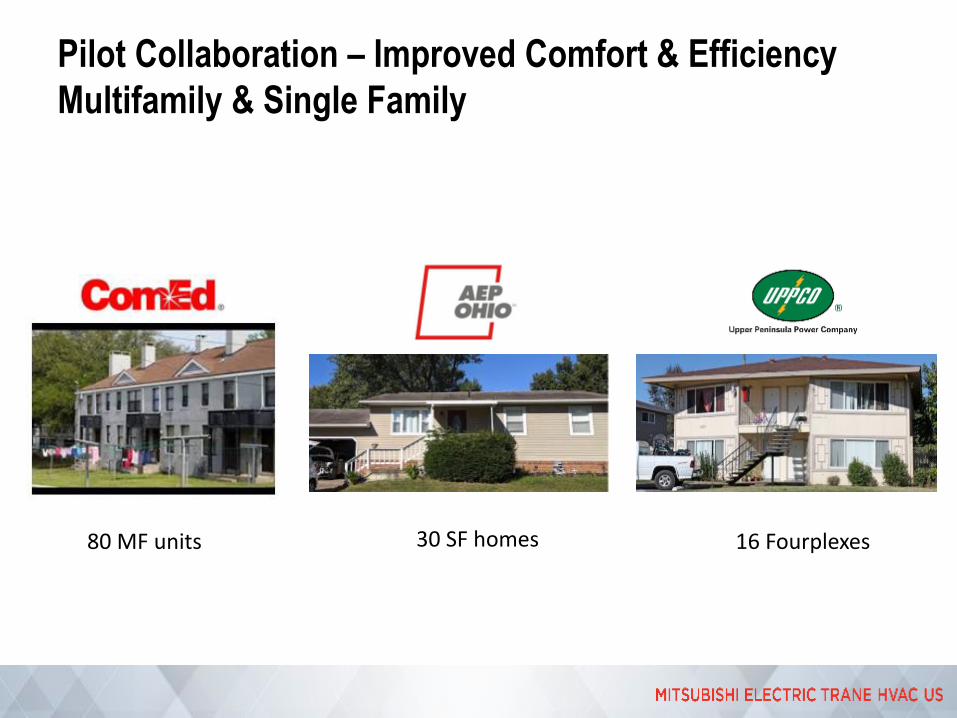
Pilot Collaboration – Improved Comfort & Efficiency
Multifamily & Single Family
80 MF units 30 SF homes 16 Fourplexes

Energy Efficiency – Heat Pumps Not Created Equal
Variable Speed Heat Pumps AHRI 6,185– 15 SEER/8.5 HSPF – (93%)
– 18 SEER/10 HSPF - 3,017 - (49%) – MITSUBISHI 60%
Heat Pumps AHRI 360,046 Listed.– 15 SEER/8.5 HSPF – 192,431 – (53%)
– 18 SEER/10 HSPF - 4,792 - (1%)
CASE EXAMPLE - MN Power Efficiency Requirements
– ASHP/MiniSplit (15 SEER/8.5 HSPF) - $300/$500
– Cold Climate (18 SEER/10 HSPF) - $1000
VS.
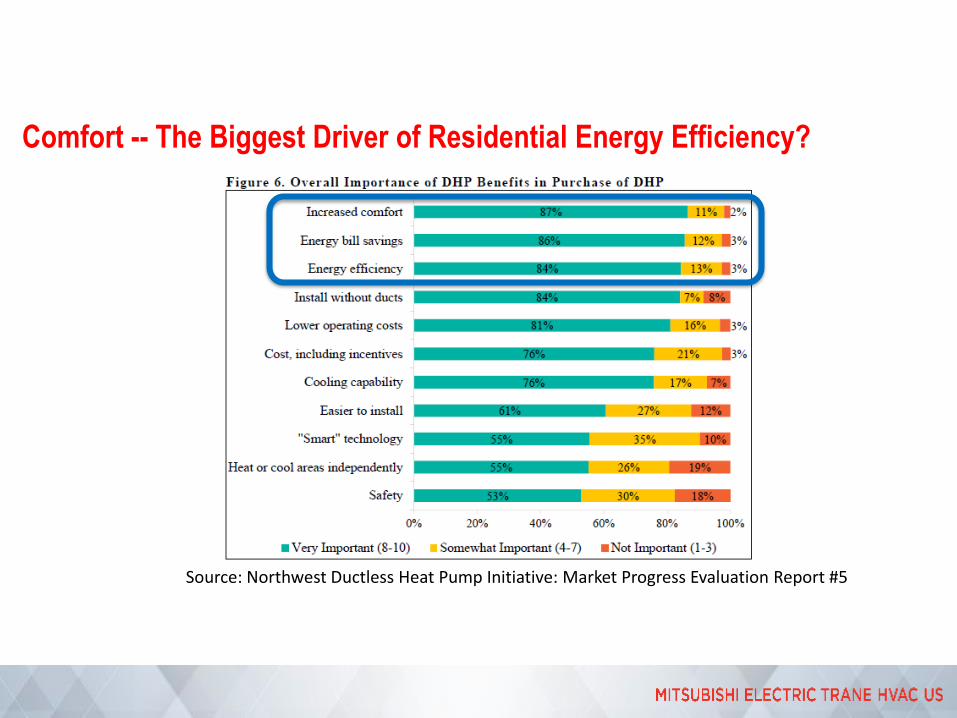
Comfort -- The Biggest Driver of Residential Energy Efficiency?
Source: Northwest Ductless Heat Pump Initiative: Market Progress Evaluation Report #5

Trend 80% by 2050 Carbon Neutrality
438 Cities25 States

Contact Info
Kevin DeMasterManager, Utility & Efficiency Programs

57U.S. DEPARTMENT OF ENERGY OFFICE OF ENERGY EFFICIENCY & RENEWABLE ENERGY
SLOPE Platform
A DOE-led collaboration between NREL and
8 EERE technology offices to create a
dynamic, comprehensive energy planning platform
of integrated, localized data for
state and local decision makers
• Phase I: Beta version launched (Jan. 2020)
• Phase II: Adding transportation and
generation mix data; enabling user-saved
settings (under development in 2020)
Access the Platform:
https://gds.nrel.gov/slope
Comments or Questions?

▪ Handbooks - explain why and how to
implement specific stages of a program.
▪ Quick Answers - provide answers and
resources for common questions.
▪ Proven Practices posts - include lessons
learned, examples, and helpful tips from
successful programs.
▪ Technology Solutions NEW! - present
resources on advanced technologies,
HVAC & Heat Pump Water Heaters,
including installation guidance, marketing
strategies, & potential savings.
Explore the Residential Program Solution Center
https://rpsc.energy.gov
Resources to help improve your program and reach energy efficiency targets:
DOE Health and Home Performance Initiative
Thank You!
Follow us to plug into the latest Better Buildings news and updates!
Better Buildings Twitter with #BBResNet
Better Buildings LinkedIn
Office of Energy Efficiency and Renewable Energy
Please send any follow-up questions
or future call topic ideas to: