effects of hillslope gully stabilization on erosion and
TRANSCRIPT
U.S. Department of the InteriorU.S. Geological Survey
San Isid
ro W
ash
Arroyo
Pied
ra Lumbre
Vicente Arroyo
Papers Wash
Penistaja
Arr
oyo
Arroyo
Jarido
La Saladita
Encino Wash
Horn Arroyo
Lopez ArroyoTole
do A
rroy
o
Arroyo Empedrado
To
rreon Wash
Torreon Wash
Torreon Wash watershedTinian
Torreon
PenistajaOjo Encino
TorreonNavajo Mission
Scientific Investigations Report 2018–5026
Prepared in cooperation with the Rio Puerco Alliance
Effects of Hillslope Gully Stabilization on Erosion and Sediment Production in the Torreon Wash Watershed, New Mexico, 2009–12

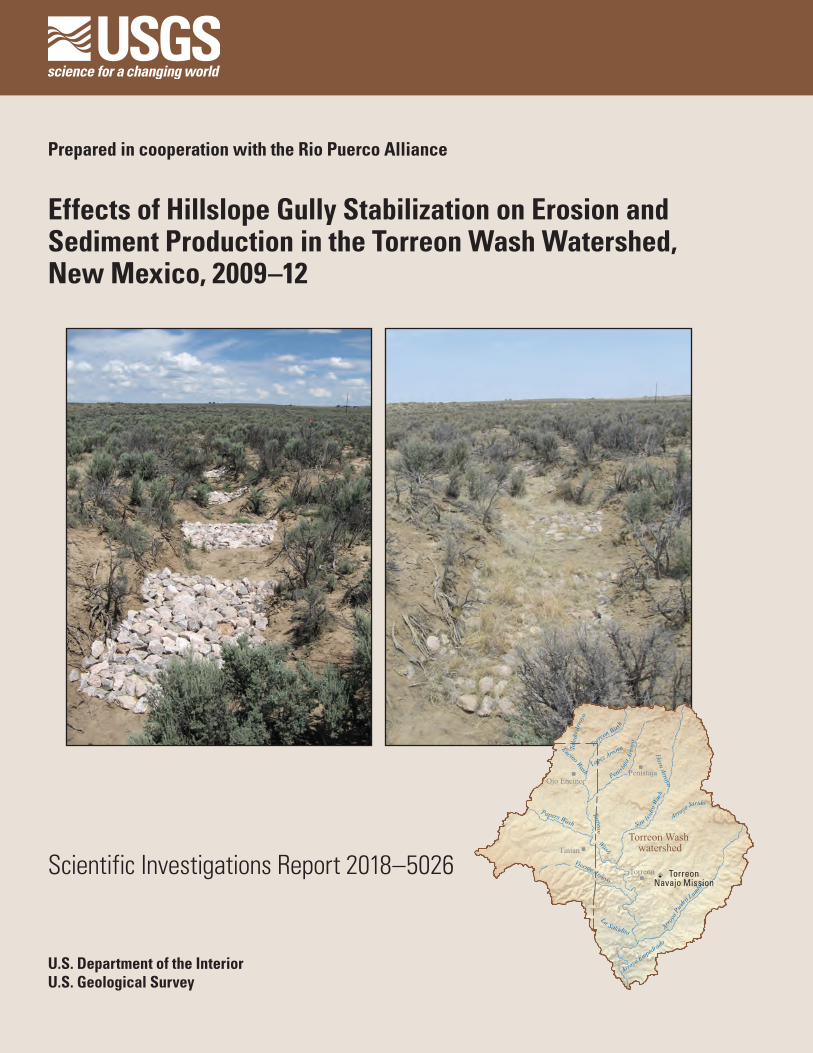
Front cover:Left. Erosion-control structures in the Penistaja Arroyo drainage, July 24, 2009, near the start of the study period.Right. Erosion-control structures in the Penistaja Arroyo drainage, July 2, 2013, after completion of the study.
Back cover:Top. Erosion-control structures on Papers Wash, July 24, 2009, near the start of the study period. Bottom. Erosion-control structures on Papers Wash, July 1, 2013, after completion of the study.
Effects of Hillslope Gully Stabilization on Erosion and Sediment Production in the Torreon Wash Watershed, New Mexico, 2009–12
By Anne Marie Matherne, Anne C. Tillery, and Kyle R. Douglas-Mankin
Prepared in cooperation with the Rio Puerco Alliance
Scientific Investigations Report 2018–5026
U.S. Department of the InteriorU.S. Geological Survey
U.S. Department of the InteriorRYAN K. ZINKE, Secretary
U.S. Geological SurveyWilliam H. Werkheiser, Deputy Director exercising the authority of the Director
U.S. Geological Survey, Reston, Virginia: 2018
For more information on the USGS—the Federal source for science about the Earth, its natural and living resources, natural hazards, and the environment—visit http://www.usgs.gov or call 1–888–ASK–USGS.
For an overview of USGS information products, including maps, imagery, and publications, visit https://store.usgs.gov.
Any use of trade, firm, or product names is for descriptive purposes only and does not imply endorsement by the U.S. Government.
Although this information product, for the most part, is in the public domain, it also may contain copyrighted materials as noted in the text. Permission to reproduce copyrighted items must be secured from the copyright owner.
Suggested citation:Matherne, A.M., Tillery, A.C., and Douglas-Mankin, K.R., 2018, Effects of hillslope gully stabilization on erosion and sediment production in the Torreon Wash watershed, New Mexico, 2009–12: U.S. Geological Survey Scientific Investigations Report 2018–5026, 35 p., https://doi.org/10.3133/sir20185026.
ISSN 2328-031X (print)ISSN 2328-0328 (online)
iii
Acknowledgments
This study was conducted with the help of the Ojo Encino Chapter of the Navajo Nation, working with support from the Rio Puerco Alliance. In particular, we would like to thank Watson Castillo and Tammy Herrerra for their support; Tiffany Herrerra, Ryan Yazzie, and Leslynn Vandever for data collection; and members of the Navajo Youth Summer Program for construction of the mitigation structures. We thank Craig Conley, of New Mexico Highlands University, for useful discussions in the field and for assistance in locating the field sites. Ellen Soles conducted the field surveys of the study sites.

v
Contents
Acknowledgments .......................................................................................................................................iiiAbstract ..........................................................................................................................................................1Introduction ....................................................................................................................................................1
Purpose and Scope .............................................................................................................................3Physical Setting ....................................................................................................................................4Previous Investigations .......................................................................................................................4
Erosion in Rio Puerco Watershed ............................................................................................4Gully Erosion-Control Measures ..............................................................................................6
Approach ........................................................................................................................................................6Gully Erosion Control in the Torreon Wash Watershed ..........................................................................6Methods of Investigation .............................................................................................................................7
Upland Paired Drainages ...................................................................................................................7Main-Stem Channel Characterization ............................................................................................13Topographic Survey Methods ..........................................................................................................13Geomorphic Surface Analysis .........................................................................................................13
Effects of Gully Erosion Control on Sediment Stabilization and Erosion ...........................................14Precipitation Characteristics ...........................................................................................................14Runoff and Sediment Transport in Response to Precipitation ...................................................16Comparison of Net Aggradation in the Upland Paired Drainages .............................................21Channel Adjustment in Penistaja Arroyo and Torreon Wash .....................................................23Effects of Upland Mitigation on Sediment Production in the Torreon Wash Watershed ......23
Summary .......................................................................................................................................................31References Cited .........................................................................................................................................32
Figures
1. Map showing location of the Torreon Wash watershed and the Rio Puerco watershed in northwestern New Mexico ................................................................................2
2. Photographs showing typical main-stem channel morphology in the Torreon Wash watershed including incised and shallow channels ..................................................5
3. Maps showing study-related aspects of the Penistaja Arroyo tributary paired drainages ......................................................................................................................................8
4. Maps showing study-related aspects of the Papers Wash paired drainages ..................9 5. Photographs showing channel configuration at the beginning of the study
period, untreated sites ..............................................................................................................11 6. Map showing location of study sites within the Torreon Wash watershed ....................12 7. Graph showing monthly precipitation at Torreon Navajo Mission for the 30-year
normal period 1981–2010, and for 2009, 2010, 2011, and 2012 .............................................15 8. Scatterplot showing storm intensity compared to storm duration at the Penistaja
Arroyo and Papers Wash sites ................................................................................................16 9. Photographs showing sediment movement in Papers Wash treated channel
following June 9, 2009, 2-year-recurrence-interval precipitation .....................................17 10. Photographs showing erosion-control structures on Papers Wash ................................18
vi
11. Photographs showing erosion-control structures in the Penistaja Arroyo drainage ......................................................................................................................................19
12. Graphs showing comparison of aggradation amounts between untreated and treated drainages ......................................................................................................................22
13. Main-stem channel cross sections in Penistaja Arroyo and Torreon Wash, 2009 and 2011 .......................................................................................................................................24
Tables
1. Paired drainage characteristics and surveyed surface comparisons from 2009 to 2012 ..........................................................................................................................................21
2. Change in cross-sectional area of cross-section clusters, Penistaja Arroyo and Torreon Wash, 2009–12 .............................................................................................................30
vii
Conversion Factors
U.S. customary units to International System of Units
Multiply By To obtain
Length
inch (in.) 25.4 millimeter (mm)foot (ft) 0.3048 meter (m)mile (mi) 1.609 kilometer (km)
Area
square foot (ft2) 929.0 square centimeter (cm2)square foot (ft2) 0.09290 square meter (m2)square mile (mi2) 259.0 hectare (ha)square mile (mi2) 2.590 square kilometer (km2)
Volume
cubic foot (ft3) 0.02832 cubic meter (m3) Rainfall rate
inch per hour (in/h) 25.4 millimeter per hour (mm/h)inch per year (in/yr) 25.4 millimeter per year (mm/yr)
Erosion rate
foot per year (ft/yr) 304.8 millimeter per year (mm/yr)
Temperature in degrees Celsius (°C) may be converted to degrees Fahrenheit (°F) as follows:
°F = (1.8 × °C) + 32.
Temperature in degrees Fahrenheit (°F) may be converted to degrees Celsius (°C) as follows:
°C = (°F – 32) / 1.8.
Datum
Vertical coordinate information is referenced to the North American Vertical Datum of 1988 (NAVD 88).
Horizontal coordinate information is referenced to the North American Datum of 1983 (NAD 83).
Elevation, as used in this report, refers to distance above the vertical datum.
Supplemental Information
Concentrations of chemical constituents in water are given in milligrams per liter (mg/L).
viii
Abbreviations
CSG crest-stage gage
DEM digital elevation model
GIS geographic information system
GPS Global Positioning System
NMED New Mexico Environment Department
RPA Rio Puerco Alliance
USGS U.S. Geological Survey
Effects of Hillslope Gully Stabilization on Erosion and Sediment Production in the Torreon Wash Watershed, New Mexico, 2009–12
By Anne Marie Matherne, Anne C. Tillery, and Kyle R. Douglas-Mankin
AbstractSediment erosion and deposition in two sets of paired
(treated and untreated) upland drainages in the Torreon Wash watershed, upper Rio Puerco Basin, New Mexico, were examined over a 3 1/2-year period from spring 2009 through fall 2012. The objective was to evaluate the effectiveness of shallow, loose-stone check dams, or “one-rock dams,” as a hillslope gully erosion stabilization and mitigation method, and its potential for retaining upland eroded soils and decreasing delivery of sediment to lower ephemeral stream channels. Two high-resolution topographic surveys, completed at the beginning and end of the study period, were used to assess the effects of the mitigation measures at paired-drainage sites in both Penistaja Arroyo and Papers Wash watersheds, and at six main-stem-channel cross-section clusters along Penistaja Arroyo and Torreon Wash in the Torreon Wash watershed.
For both drainage pairs, the treated drainage had greater sediment aggradation near the channel than the untreated drainage. Erosion was the dominant geomorphic process in the untreated Penistaja Arroyo drainage, whereas aggradation was the dominant process in the other three drainages. For the Penistaja Arroyo paired drainages, the treated site showed a 51-percent increase in area aggraded and 67-percent increase in volume aggraded per area analyzed over the untreated site. Both Papers Wash drainages showed net aggradation, but with similar treatment effect, with the treated site showing a 29-percent increase in area aggraded and 60-percent increase in volume aggraded per area analyzed over the untreated site. In the untreated Penistaja Arroyo drainage, the calculated minimum erosion rate was 0.0055 inches per year (in/yr; 0.14 millimeters per year [mm/yr]), whereas the calculated aggradation rates for the three drainages for which aggradation was the dominant geomorphic process were 0.0063 in/yr (0.16 mm/yr) for the Penistaja Arroyo treated drainage, 0.012 in/yr (0.31 mm/yr) for the Papers Wash untreated drainage, and 0.988 in/yr (2.51 mm/yr) for the Papers Wash treated drainage.
Changes in the channel cross section along the main-stem Penistaja Arroyo and Torreon Wash were also examined.
Channel-bank slumping and erosion of previously deposited bed material were apparent sources for sediment suspended in ephemeral streamflow. Cross-sectional channel surveys indicated examples of both erosion and deposition along each channel over the study period. Because the drainage area of the treated drainages is small compared to that of the Torreon Wash watershed, the upland mitigation measures would not be expected to measurably affect short-term concentrations of suspended sediment in main-stem channels.
One-rock-dam mitigation structures in the upland drainages appear to have resulted in a decrease in sediment delivery to the main-stem channel. One-rock-dam mitigation structures may affect streamflow through their influence on runoff volume (via infiltration) and runoff rate (via detention), both of which may vary with time after structure installation.
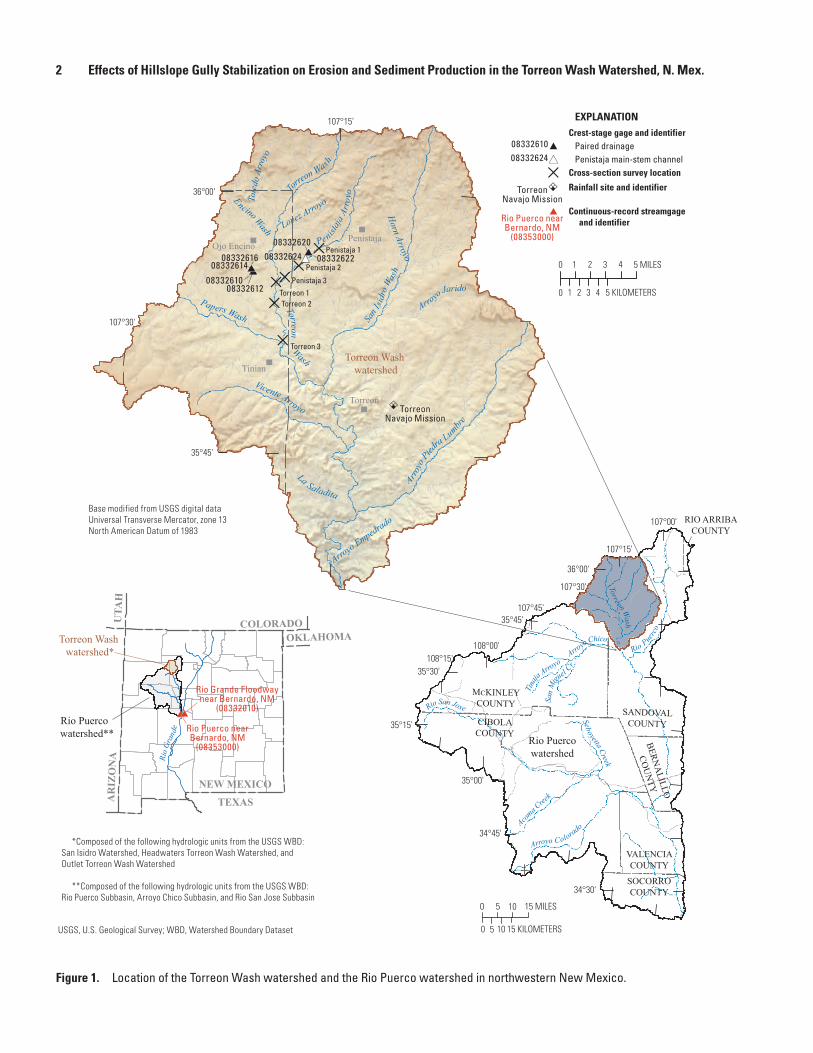
IntroductionThe Rio Puerco, in west central New Mexico (fig. 1),
is the largest tributary to the middle Rio Grande. The Rio Puerco watershed, as referred to in this report, is composed of the Rio Puerco Subbasin, the Arroyo Chico Subbasin, and the Rio San Jose Subbasin (Natural Resources Conservation Service, 2017). The Rio Puerco watershed encompasses approximately 7,350 square miles (mi2) that contribute flow to the Rio Grande near Bernardo, New Mexico. The watershed is underlain by poorly consolidated sedimentary strata consisting of Cretaceous and lower Tertiary age sandstones and shales, overlain by Tertiary to Quaternary age sediments along the valley margins and floor (Love, 1986). The stream system is characterized by deeply incised channels, called arroyos, and ephemeral or intermittent streams that transport high suspended-sediment loads. The present incised landscape in the Rio Puerco watershed originated during an episode of rapid downcutting and arroyo formation from about 1880 to 1920, attributed to a complex of factors including climate change (Leopold and Snyder, 1951; Leopold and others, 1966; Cooke and Reeves, 1976; Graf, 1986; Balling and Wells, 1990; Elliott and others, 1999), land use (Thornwaite and others, 1942; Cooke and Reeves, 1976), land management
2 Effects of Hillslope Gully Stabilization on Erosion and Sediment Production in the Torreon Wash Watershed, N. Mex.
AR
IZO
NA
COLORADOUTA
H
OKLAHOMA
TEXAS
NEW MEXICO
Rio
Gran
de
Rio Puerco watershed**
Torreon Wash watershed*
Rio Grande Floodwaynear Bernardo, NM
(08332010)
Rio Puerco nearBernardo, NM
(08353000)
*Composed of the following hydrologic units from the USGS WBD: San Isidro Watershed, Headwaters Torreon Wash Watershed, and Outlet Torreon Wash Watershed
**Composed of the following hydrologic units from the USGS WBD: Rio Puerco Subbasin, Arroyo Chico Subbasin, and Rio San Jose Subbasin
USGS, U.S. Geological Survey; WBD, Watershed Boundary Dataset
Base modified from USGS digital data Universal Transverse Mercator, zone 13North American Datum of 1983
0 5 10 15 KILOMETERS
0 5 10 15 MILES
Rio Puerc
o
Chaco R
Rio San Jose
Acoma C
reek
R io Salado
Arroyo Colorado
Torreon Wash
Alamocita Cr
Puerco R
Arroyo Chico
Tina
ja Arroyo
Seboyetta Creek
San
Migu
el Cr
MCKINLEYCOUNTY
CIBOLACOUNTY
SOCORROCOUNTY
VALENCIACOUNTY
BERNA
LILLO
COU
NTY
SANDOVALCOUNTY
RIO ARRIBACOUNTY
36°00'
35°45'
35°30'
35°15'
35°00'
34°45'
34°30'
107°45'
107°15'
107°00'
107°30'
108°15'108°00'
Rio Puercowatershed
San I
sidro
Was
h
Chico,
Chaco
Arroy
o Pied
ra Lumbre
Puerco,
Vicente Arroyo
Papers Wash
Penistaja
Arr
oyo
Chijuilla, Arro
yo Jarido
Corrales,
La Saladita
Encino Wash
Horn Arroyo
North Fork Arroyo
Lopez ArroyoTole
do A
rroy
o
Kina
ird
Arroyo Empedrado
Torreo
n Wash
0833261208332610
0833261608332614
0833262408332620
08332622
Torreon Wash Torreon Wash watershedTinian
Torreon
PenistajaOjo Encino
36°00'
35°45'
107°15'
107°30'
Penistaja 1
Penistaja 2
Penistaja 3
Torreon 3
Torreon 2Torreon 1 0 1 2 3 4 5 KILOMETERS
0 1 2 3 4 5 MILES
Crest-stage gage and identifier Paired drainage Penistaja main-stem channelCross-section survey location
Rainfall site and identifier
Continuous-record streamgage and identifier
EXPLANATION
0833262408332610
TorreonNavajo Mission
Rio Puerco nearBernardo, NM
(08353000)
TorreonNavajo Mission
Figure 1. Location of the Torreon Wash watershed and the Rio Puerco watershed in northwestern New Mexico.
Introduction 3
(Schumm and Hadley, 1957; Leopold and others, 1966), and long-term arroyo cut-and-fill cycles occurring on a geologic time scale (Schumm and Hadley, 1957; Love, 1986; Elliott and others, 1999).
The Rio Puerco is the primary source of sediment to the Rio Grande. In the 2012 water year (October 1, 2011–September 30, 2012), the Rio Puerco contributed about 70 percent of the annual suspended-sediment load to the Rio Grande Floodway near Bernardo, New Mexico (fig. 1; U.S. Geological Survey [USGS] station identification number 08332010; data available at http://waterdata.usgs.gov/nm/nwis/qw/). A water-quality assessment of the upper Rio Puerco by the New Mexico Environment Department (NMED) listed selected reaches of the river as impaired because of excessive sedimentation or siltation (Surface Water Quality Bureau, 2006). Sediment derived from a variety of erosion sources in the upper watershed is presumed to contribute to these high downstream sediment loads and consequent siltation.
The Federal Water Pollution Control Act, also known as the Clean Water Act, was established to “restore and maintain the chemical, physical, and biological integrity of the Nation’s waters” (U.S. Congress, 2002). Ephemeral or intermittent streams, such as the Rio Puerco and its tributaries, are included under the Clean Water Act and were part of the assessment by the NMED Surface Water Quality Bureau (Surface Water Quality Bureau, 2001). Ephemeral or intermittent streams are considered important in a watershed context in “maintaining water quality, overall watershed health, and provisioning of the essential human and biological requirements of clean water” (Levick and others, 2008). Levick and others (2008) estimate that more than 88 percent of New Mexico streams are ephemeral or intermittent; therefore, assessing these streams is essential to accurately evaluate water quality and watershed health in New Mexico.
The characteristics of the contributing watershed influence hydrologic processes, hydrologic function, and watershed health (Levick and others, 2006). Hydrologic function involves, in part, the transport of water, sediment, and other constituents within and through the watershed. Soil, topographic, and vegetation characteristics, along with storm characteristics, influence the degree to which precipitation infiltrates the soil, where it contributes to the soil moisture available to support vegetative growth and evapotranspiration. Rainfall that does not infiltrate flows downhill along the land surface (as runoff) in a dendritic network of increasing flows. When concentrated-flow rills accumulate flows with sufficient energy, available sediment is eroded and transported downgradient. As the eroded concentrated-flow paths, or gullies, grow, they provide steeper and more direct flow paths and act to transfer water and sediment more efficiently downstream. Land use, vegetation, and storm characteristics that lead to infiltration are associated with sediment retention in the landscape, whereas characteristics that lead to runoff generation and convergence in the landscape increase sediment export because of increased contributions of
overland and channelized erosion processes (Levick and others, 2006). Because of this, the condition of the upland watershed area is integral to hydrologic function and watershed health.
This study focused on Torreon Wash, a tributary to Arroyo Chico, which flows into the Rio Puerco (fig. 1). The Torreon Wash watershed, as referred to in this report, is composed of the Headwaters Torreon Wash watershed, the San Isidro Wash watershed, and the Outlet Torreon Wash watershed (Natural Resources Conservation Service, 2017). The Torreon Wash watershed is bounded to the north and northeast by the Continental Divide and has an area of about 470 mi2, composing 8 percent of the entire Rio Puerco watershed. The Torreon Wash watershed encompasses multiple landowners and includes portions of the eastern Navajo Nation. In 2000, the eastern Navajo Chapters began a program of watershed improvement under the auspices of the non-profit Rio Puerco Alliance (RPA). The mitigation program was initiated in upland portions of the Torreon Wash watershed to install shallow, loose-stone check dams, generically termed “one-rock dams,” to stabilize channel erosion at established gully locations or to prevent channel erosion at potential gully locations (Zeedyk and Jansens, 2009). In a related effort, dirt roads and two-tracks in the same area were also remediated (Zeedyk, 2006; Schultz, 2008, 2011). Some 2,000 structures were constructed by Navajo youth groups over a 12-year period as part of an ongoing summer training program. Although the use of sustainable catchment structures has increased in New Mexico during the last decade, for reasons of affordability and emphasis on local materials and labor, the effectiveness of this methodology has not been formally evaluated. In 2009, the USGS, in cooperation with the RPA, initiated a study to examine the effectiveness of these upland erosion mitigation methods and their potential utility in improving watershed health and decreasing sediment export to the lower ephemeral stream channels.
Purpose and Scope
This report documents a study designed to evaluate the changes to erosion and sediment transport by erosion mitigation projects in the Torreon Wash watershed, Rio Puerco Basin, northwestern New Mexico. The effectiveness of upland mitigation treatments in managing gully development and retaining sediment on hillslopes was examined using two methods: (1) sediment erosion and deposition were measured and compared in two sets of paired (treated and untreated) upland drainages (subwatersheds) over a 3 1/2-year period from spring 2009 through fall 2012; and (2) downstream changes in channel erosion were evaluated through repeated channel cross-section measurements in the main-stem Penistaja Arroyo and Torreon Wash over the same time period. Data that support the analyses in this report are available in Matherne and others (2018).
4 Effects of Hillslope Gully Stabilization on Erosion and Sediment Production in the Torreon Wash Watershed, N. Mex.
Physical Setting
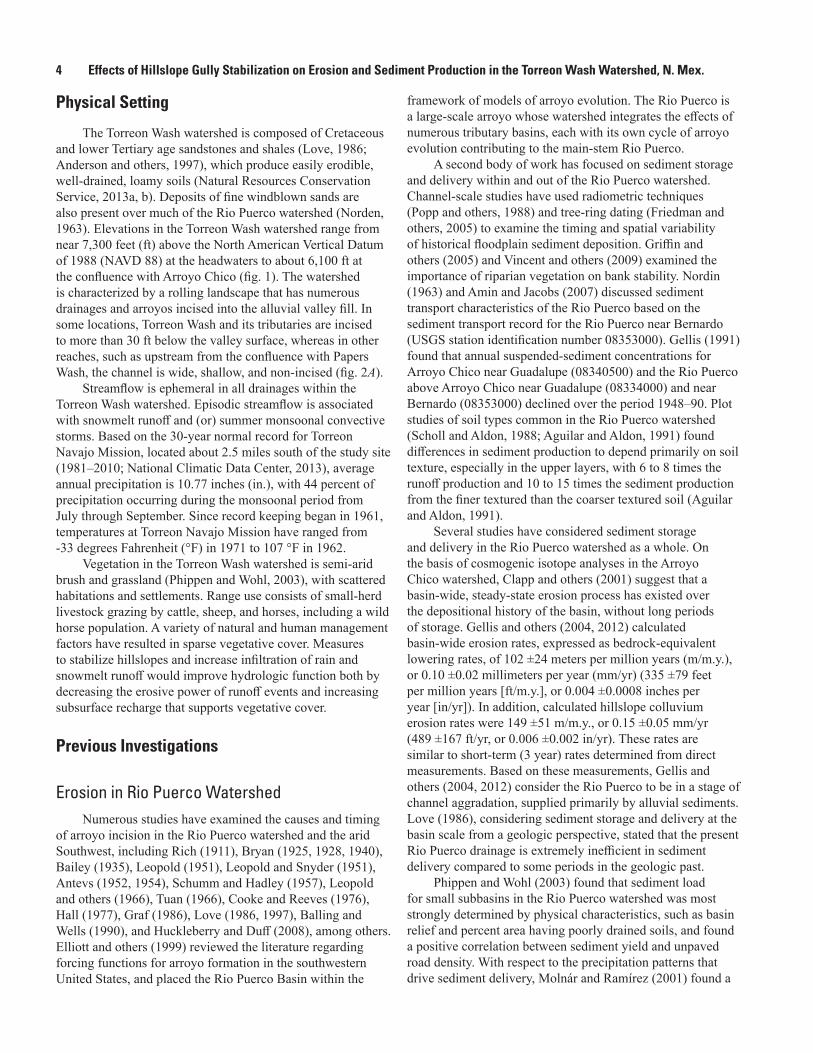
The Torreon Wash watershed is composed of Cretaceous and lower Tertiary age sandstones and shales (Love, 1986; Anderson and others, 1997), which produce easily erodible, well-drained, loamy soils (Natural Resources Conservation Service, 2013a, b). Deposits of fine windblown sands are also present over much of the Rio Puerco watershed (Norden, 1963). Elevations in the Torreon Wash watershed range from near 7,300 feet (ft) above the North American Vertical Datum of 1988 (NAVD 88) at the headwaters to about 6,100 ft at the confluence with Arroyo Chico (fig. 1). The watershed is characterized by a rolling landscape that has numerous drainages and arroyos incised into the alluvial valley fill. In some locations, Torreon Wash and its tributaries are incised to more than 30 ft below the valley surface, whereas in other reaches, such as upstream from the confluence with Papers Wash, the channel is wide, shallow, and non-incised (fig. 2A).
Streamflow is ephemeral in all drainages within the Torreon Wash watershed. Episodic streamflow is associated with snowmelt runoff and (or) summer monsoonal convective storms. Based on the 30-year normal record for Torreon Navajo Mission, located about 2.5 miles south of the study site (1981–2010; National Climatic Data Center, 2013), average annual precipitation is 10.77 inches (in.), with 44 percent of precipitation occurring during the monsoonal period from July through September. Since record keeping began in 1961, temperatures at Torreon Navajo Mission have ranged from -33 degrees Fahrenheit (°F) in 1971 to 107 °F in 1962.
Vegetation in the Torreon Wash watershed is semi-arid brush and grassland (Phippen and Wohl, 2003), with scattered habitations and settlements. Range use consists of small-herd livestock grazing by cattle, sheep, and horses, including a wild horse population. A variety of natural and human management factors have resulted in sparse vegetative cover. Measures to stabilize hillslopes and increase infiltration of rain and snowmelt runoff would improve hydrologic function both by decreasing the erosive power of runoff events and increasing subsurface recharge that supports vegetative cover.
Previous Investigations
Erosion in Rio Puerco WatershedNumerous studies have examined the causes and timing
of arroyo incision in the Rio Puerco watershed and the arid Southwest, including Rich (1911), Bryan (1925, 1928, 1940), Bailey (1935), Leopold (1951), Leopold and Snyder (1951), Antevs (1952, 1954), Schumm and Hadley (1957), Leopold and others (1966), Tuan (1966), Cooke and Reeves (1976), Hall (1977), Graf (1986), Love (1986, 1997), Balling and Wells (1990), and Huckleberry and Duff (2008), among others. Elliott and others (1999) reviewed the literature regarding forcing functions for arroyo formation in the southwestern United States, and placed the Rio Puerco Basin within the
framework of models of arroyo evolution. The Rio Puerco is a large-scale arroyo whose watershed integrates the effects of numerous tributary basins, each with its own cycle of arroyo evolution contributing to the main-stem Rio Puerco.
A second body of work has focused on sediment storage and delivery within and out of the Rio Puerco watershed. Channel-scale studies have used radiometric techniques (Popp and others, 1988) and tree-ring dating (Friedman and others, 2005) to examine the timing and spatial variability of historical floodplain sediment deposition. Griffin and others (2005) and Vincent and others (2009) examined the importance of riparian vegetation on bank stability. Nordin (1963) and Amin and Jacobs (2007) discussed sediment transport characteristics of the Rio Puerco based on the sediment transport record for the Rio Puerco near Bernardo (USGS station identification number 08353000). Gellis (1991) found that annual suspended-sediment concentrations for Arroyo Chico near Guadalupe (08340500) and the Rio Puerco above Arroyo Chico near Guadalupe (08334000) and near Bernardo (08353000) declined over the period 1948–90. Plot studies of soil types common in the Rio Puerco watershed (Scholl and Aldon, 1988; Aguilar and Aldon, 1991) found differences in sediment production to depend primarily on soil texture, especially in the upper layers, with 6 to 8 times the runoff production and 10 to 15 times the sediment production from the finer textured than the coarser textured soil (Aguilar and Aldon, 1991).
Several studies have considered sediment storage and delivery in the Rio Puerco watershed as a whole. On the basis of cosmogenic isotope analyses in the Arroyo Chico watershed, Clapp and others (2001) suggest that a basin-wide, steady-state erosion process has existed over the depositional history of the basin, without long periods of storage. Gellis and others (2004, 2012) calculated basin-wide erosion rates, expressed as bedrock-equivalent lowering rates, of 102 ±24 meters per million years (m/m.y.), or 0.10 ±0.02 millimeters per year (mm/yr) (335 ±79 feet per million years [ft/m.y.], or 0.004 ±0.0008 inches per year [in/yr]). In addition, calculated hillslope colluvium erosion rates were 149 ±51 m/m.y., or 0.15 ±0.05 mm/yr (489 ±167 ft/yr, or 0.006 ±0.002 in/yr). These rates are similar to short-term (3 year) rates determined from direct measurements. Based on these measurements, Gellis and others (2004, 2012) consider the Rio Puerco to be in a stage of channel aggradation, supplied primarily by alluvial sediments. Love (1986), considering sediment storage and delivery at the basin scale from a geologic perspective, stated that the present Rio Puerco drainage is extremely inefficient in sediment delivery compared to some periods in the geologic past.
Phippen and Wohl (2003) found that sediment load for small subbasins in the Rio Puerco watershed was most strongly determined by physical characteristics, such as basin relief and percent area having poorly drained soils, and found a positive correlation between sediment yield and unpaved road density. With respect to the precipitation patterns that drive sediment delivery, Molnár and Ramírez (2001) found a
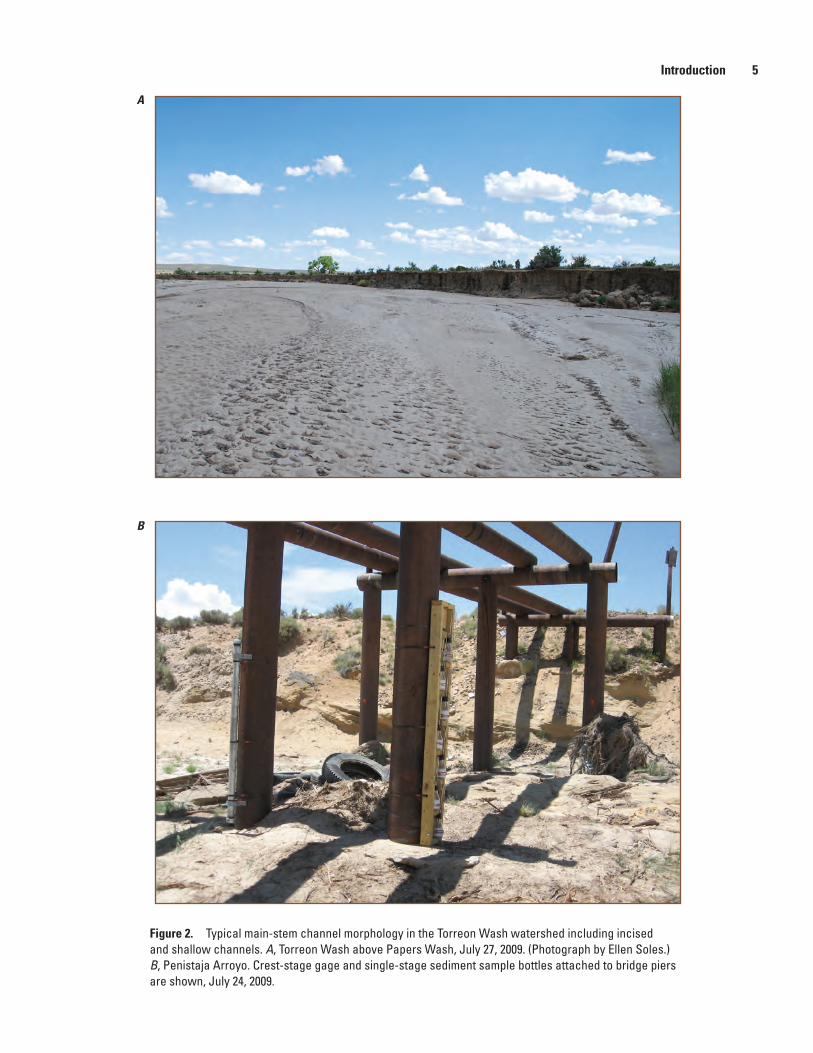
Introduction 5
Figure 2. Typical main-stem channel morphology in the Torreon Wash watershed including incised and shallow channels. A, Torreon Wash above Papers Wash, July 27, 2009. (Photograph by Ellen Soles.) B, Penistaja Arroyo. Crest-stage gage and single-stage sediment sample bottles attached to bridge piers are shown, July 24, 2009.
A
B
6 Effects of Hillslope Gully Stabilization on Erosion and Sediment Production in the Torreon Wash Watershed, N. Mex.
long-term (1948–97) increasing trend in precipitation in the Rio Puerco Basin, with a general increase in precipitation in the non-summer months, but did not find a corresponding increase in runoff, expressed as downstream discharge, reflecting high in-channel transmission losses in the Rio Puerco and its tributaries.
Gully Erosion-Control MeasuresA number of studies have documented land degradation
by soil erosion throughout the world and the substantial contribution by shallow upland gullies, which act as a sediment source (Poesen and others, 2003; Douglas-Mankin and others, 2011; Daggupati and others, 2013, 2014). Factors that affect gully formation and development include storm depth and intensity, soil type, surface roughness, land-cover characteristics, slope, drainage area, and soil moisture. Land use plays an important role in gully formation and sediment contribution, and studies have documented that shifts in land use can trigger gullying or increase gully erosion rates, as summarized in Poesen and others (2003). Changes in land use or management can also decrease gully erosion (Douglas-Mankin and others, 2011).
Numerous methods can be used to control or reduce gully formation and expansion, as indicated by Kraebel and Pillsbury (1934), Geyik (1986), Poesen (1993), and Zeedyk and Jansens (2009). Studies by Kraebel and Pillsbury (1934) and Geyik (1986) found that effective management methods generally have (1) managed the upland drainage area properly to maintain vegetation and reduce (or divert) runoff and erosion, (2) stabilized and caused filling of the gully using structural measures, (3) maintained and improved the longevity of control with revegetation, and (4) provided for necessary maintenance. The study described in this report builds on prior studies of gully erosion-control measures by assessing a structural measure to stabilize gullies and initiate gully filling and revegetation within the context of a larger watershed restoration plan (Surface Water Quality Bureau, 2001) that includes remediation of dirt roads and two-tracks (Zeedyk, 2006; Schultz, 2008, 2011), and livestock grazing management and public education (Arvidson and Coleman, 2003).
ApproachWatershed assessment studies typically follow either a
“pre/post-treatment” or “paired watershed” design. In pre/post-treatment watershed studies, the study watershed is measured for a period of time both before and after a treatment is applied, so that the change in response caused by the treatment can be isolated (Clausen, 1993; Downes and others, 2002). In paired watershed studies, two similar watersheds are selected, a treatment is applied to one watershed, and watershed response is measured and compared between the sites. Because of the limited duration of this study and the
possibility of measuring relatively few runoff events in a semi-arid environment over the short timespan of the study, the pre/post-treatment study design was not possible; thus, the paired watershed design was selected. Because of the relatively small drainage areas of the paired upland sites as compared to that of the Torreon Wash watershed, and the fact that the channels at one of the upland sites do not directly connect to a larger channel, the upland sites will be referred to as drainages in the context of this report. The initial treatments and first topographical survey were completed at the beginning of the study period (spring and summer 2009) in both paired drainages. It was assumed that conditions in the untreated drainage in each pair were similar to conditions in the treated drainage without mitigation structures, and that geomorphic and runoff responses reflected the effects of the mitigation-structure treatments.
This study examined sediment sources and supply at two scales: that of upland hillslopes, where one-rock dams were focused, and that of two downstream incised main-stem channels. The monitoring was designed to focus on key characteristics for which changes could be detected over the timespan of the study, and to be potentially extendable beyond the study period as part of a long-term monitoring plan. The study was designed so that data collection and monitoring would be performed by several groups and agencies, with the USGS responsible for data analysis and interpretation. The data analysis and interpretation were designed to be based on two high-resolution topographic surveys, completed at the beginning and end of the study period (spring 2009 through fall 2012), and supplemented with selected onsite data collection (crest-stage gages [CSGs], sediment samplers, and precipitation gages). Because of a combination of factors, including the remoteness of the sites and unusually dry conditions, limited information was obtained from onsite instrumentation. Nonetheless, this information added to the general characterization of the instrumented sites during the study period and was useful in exploring monitoring techniques and protocols under difficult conditions with limited resources.
Gully Erosion Control in the Torreon Wash Watershed
This study assessed a type of small-gully erosion-control structure, generically termed a “one-rock dam” (Zeedyk and Jansens, 2009), as being indicative of the general scale and methodology of the technique (that is, a single layer of rock arranged within a concentrated flow path and designed as a flowthrough impoundment). The goals of this upland-gully erosion-control measure are to limit channel erosion and sediment transport and to enhance water retention and infiltration, which increase soil moisture and enhance the establishment of stabilizing vegetative cover in and around the one-rock dam.
Methods of Investigation 7
One-rock dams are generally small-scale structures a few to several tens of feet wide that are built at gully headcuts or incipient gully headcuts, or in shallow gullies. The structures are referred to as “one-rock dams,” because they are generally one rock in depth and of varying spatial configuration, depending on the landscape feature being treated (figs. 3 and 4). The structures are built using local materials and can often be constructed using manual labor. The long-term effectiveness of the technique depends on repeated applications of rock layers as sediment is retained behind the structures, to build up a stable, vegetated, unchannelized land surface. The establishment of stabilizing vegetation is often aided by applying grass seed beneath the rock cover. The rock cover acts as a mulch to retain soil moisture, promote seed germination, and prevent the grazing of the plants, so that germinated vegetation can become established.
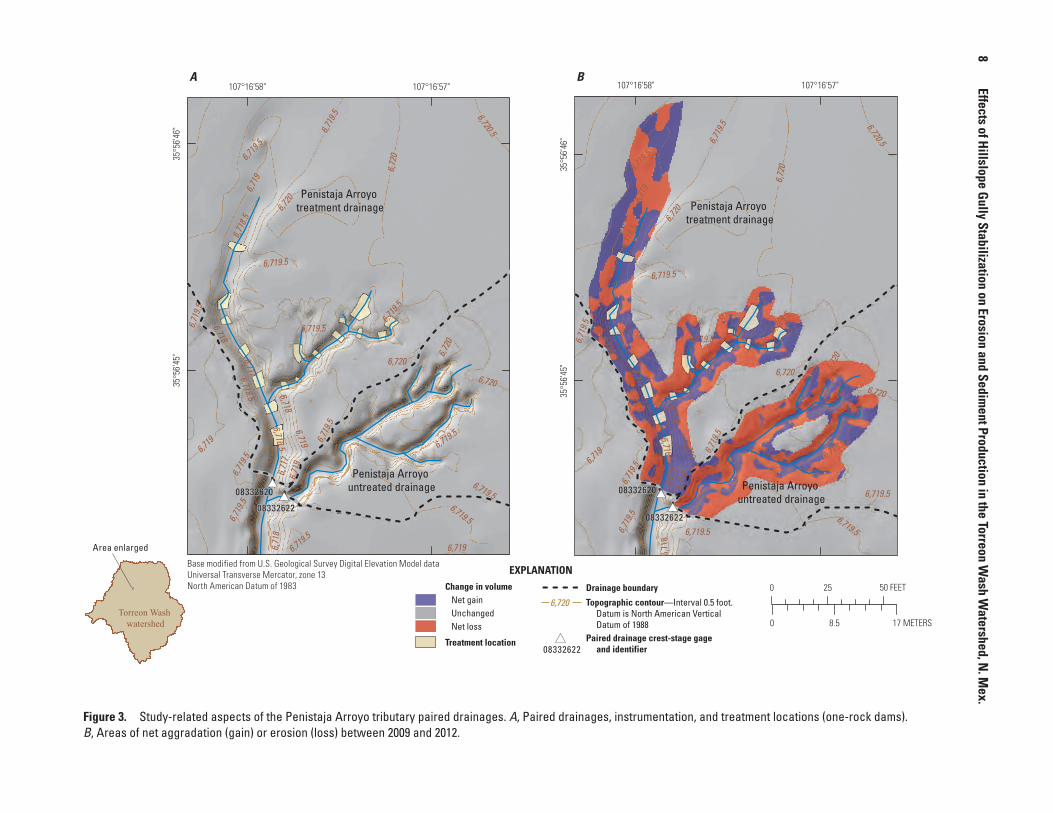
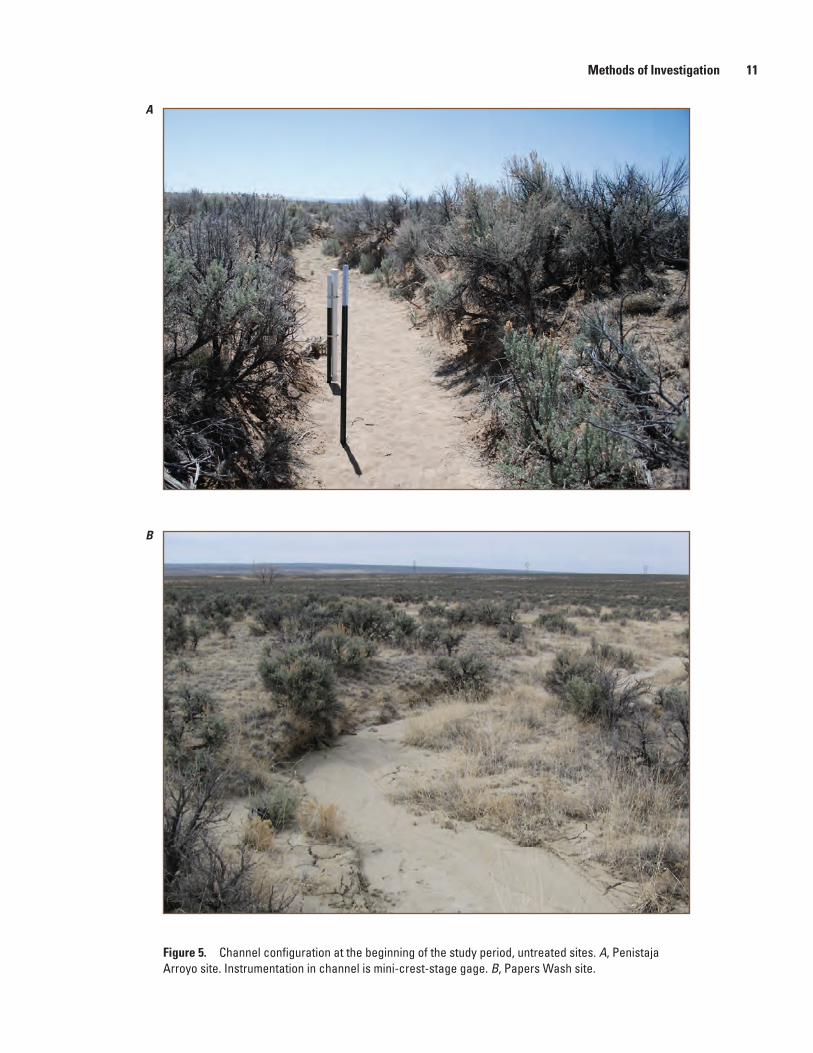
Multiple one-rock dams were installed in the spring and summer of 2009 at two hillslope study sites in the Torreon Wash watershed, Penistaja Arroyo, and Papers Wash. Installation locations ranged from incipient hillslope channels (or gullies) to existing incised channels, so as to span the range of conditions for which the one-rock techniques were thought to be effective. A total of 17 one-rock dams were installed in the Penistaja Arroyo treated site (fig. 3), and 16 one-rock dams were installed in the Papers Wash treated site (two dams were installed below the surveyed study site after the initial survey) (fig. 4A–E). Soils at both sites were primarily fine, loamy sands developed on flat to gentle slopes (Natural Resources Conservation Service, 2013a, b). The Penistaja Arroyo sites (fig. 5A) exhibited characteristics associated with greater geomorphic stability compared to the Papers Wash sites. The channel banks were well-defined, and average channel depth was about 2 ft. The channel bed was unvegetated at the start of the study period, and the hillslope areas were covered with mature sage and native grasses. The Papers Wash sites included geomorphically active channels that responded to events through erosion or aggradation and had no stable form. The Papers Wash site channels had poorly developed, unstable banks and a shallow channel depth (fig. 5B). Knickpoints (points of abrupt change in channel slope) along the channels indicated possible points of active downcutting. Poorly consolidated sandstone outcrops and upslope colluvium supplied sediment to both Papers Wash site drainages. The Papers Wash treated-site headcut terminated within the hillslope; the Papers Wash untreated-site headcut had progressed further upslope into the sandstone and colluvial sediments, and the channel was poorly defined in the lowest portions of the drainage.
Methods of InvestigationThe study methods described herein involved selecting
paired upland drainages and downstream main-stem channels deemed appropriate for analysis. Changes in channel morphology and general terrain in the drainages were investigated using intensive topographic surveys, followed by geographic-information-system (GIS) based analyses. Changes in the main-stem channels were characterized by means of monumented cross-section surveys, followed by comparisons of cross-section data. An attempt was made to characterize surface runoff and sediment transport using instrumentation designed to measure precipitation, peak stage, and suspended-sediment concentration.
Upland Paired Drainages
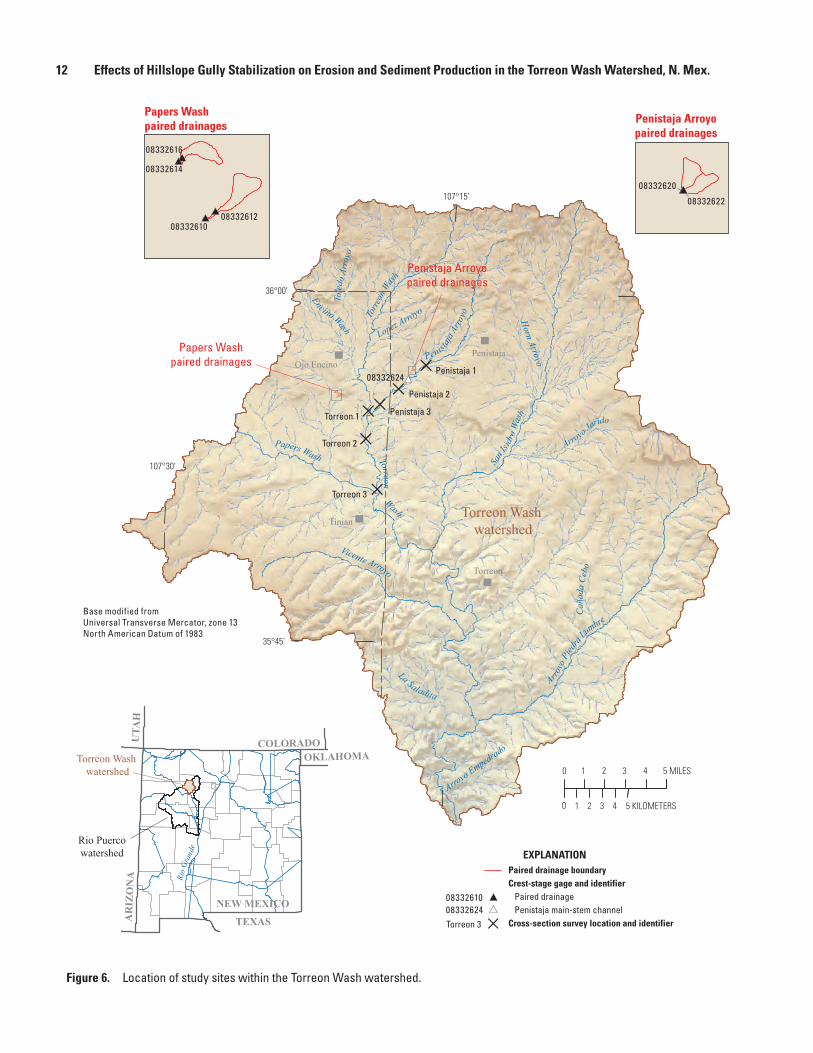
Two pairs of upland drainages were chosen for the study, designated the Penistaja Arroyo sites and the Papers Wash sites. The Penistaja Arroyo sites were located in drainages that have channels joining a tributary to Penistaja Arroyo, which is a tributary to Torreon Wash. The Papers Wash sites were located in the uplands of the Papers Wash watershed, but do not have channels directly joining Papers Wash. Papers Wash is tributary to Torreon Wash (fig. 1). The site locations chosen were deemed appropriate for studying one-rock dam gully-erosion-control techniques. Drainage pairs were chosen through field reconnaissance on the basis of similarity in contributing area, slope, degree of channel development, land cover and land use, and precipitation. Because of the localized nature of summer monsoonal convective storms, paired drainages were located close to each other. The Penistaja Arroyo sites were located adjacent to each other, and the Papers Wash sites were about 1,200 ft apart (figs. 3, 4, and 6).
The period of study was spring 2009 through fall 2012, with treatment structures installed in the spring and summer of 2009. Most precipitation in this region occurs during the summer monsoonal season. Because of the short-duration, high-intensity rain typical of monsoonal precipitation, most erosion and sediment transport occurs during the summer monsoonal season of July through September. The study period included four monsoon seasons, during which the greatest active erosion was expected.
Intensive channel topographic surveys (described in Topographic Survey Methods) were performed at the beginning and end of the study period (2009 and 2012) to assess the effectiveness of mitigation treatments in controlling and minimizing erosion and channel evolution. Transverse transects were surveyed along each drainage at a resolution sufficient to capture channel and drainage topography. One or more physical monuments were established at each drainage as a basis for a repeat survey. Transverse transects and general terrain were surveyed at the beginning and end of the 3 1/2-year data collection period. Survey data are available at Matherne and others (2018).
8
Effects of Hillslope Gully Stabilization on Erosion and Sediment Production in the Torreon W
ash Watershed, N
. Mex.
Base modified from U.S. Geological Survey Digital Elevation Model dataUniversal Transverse Mercator, zone 13North American Datum of 1983 0 25 50 FEET
0 8.5 17 METERS
107°16'57"107°16'58"
35°5
6'46
"35
°56'
45"
107°16'57"107°16'58"
35°5
6'46
"35
°56'
45"
A B
EXPLANATIONChange in volume Net gain Unchanged Net loss
Treatment location
Drainage boundary
Topographic contour—Interval 0.5 foot. Datum is North American Vertical Datum of 1988Paired drainage crest-stage gage and identifier
6,720
08332622
Penistaja Arroyo treatment drainage
Penistaja Arroyo untreated drainage
Penistaja Arroyo treatment drainage
Penistaja Arroyo untreated drainage
6,719.5
6,72
0
6,718
6,717
6,718
.56,7
19
6,716.5
6,720.5
6,719
.56,7
19.5
6,719
.5
6,719
.5
6,719.5
6,720
6,71
9.5
6,71
9
6,71
7
6,720
6,719
6,719
.5
6,719.5
6,720
6,718.5
6,71
8
6,718
6,719
6,719
.5
6,719
6,719.5
6,720
6,719.5
6,719.5
6,719.5
6,72
0
6,718
6,717
6,718
.56,7
19
6,716.5
6,720.5
6,719
.56,7
19.5
6,719
.5
6,719
.5
6,720
6,71
9.5
6,71
9
6,71
7
6,720
6,719
.5
6,720
6,718.5
6,71
8
6,718
6,719
6,719
.5
6,719
6,719.5
6,720
6,719.5
6,719.5
6,719.5
6,719.5
Torreon Wash watershed
Area enlarged
08332620
08332622
08332620
08332622
08332620
08332622
08332620
08332622
Figure 3. Study-related aspects of the Penistaja Arroyo tributary paired drainages. A, Paired drainages, instrumentation, and treatment locations (one-rock dams). B, Areas of net aggradation (gain) or erosion (loss) between 2009 and 2012.
Methods of Investigation 9
107°20'48"107°20'49"107°20'50"107°20'51"
35°5
5'33
"35
°55'
34"
35°5
5'35
"
107°20'56"107°20'57"107°20'58"107°20'59"
35°5
5'46
"35
°55'
45"
35°5
5'44
"107°20'40"107°20'45"107°20'50"107°20'55"107°21'
35°5
5'45
"35
°55'
40"
35°5
5'35
"
0 75 150 FEET
0 20 40 METERS
0 70 140 FEET
0 15 30 METERS
100 METERS
290 FEET0 145
0 50
EXPLANATION
Treatment location
Boundary of drainage area
Crest-stage gage and identifier
Sole juniper tree at site
0833261008332610
Papers Washtreatment channel
Papers Washtreatment channel
Papers Wash untreated channel
Papers Wash untreated channel
Papers Wash treated drainage
Papers Wash treated drainage
Papers Wash untreated drainage
Papers Wash untreated drainage
Torreon Wash watershed
Papers Washpaired drainages
Area enlarged
Area enlarged
08332612
08332610
08332616
08332614
08332612
08332610
08332616
08332614
Base modified from U.S. Geological Survey Digital Orthophoto Quarter-QuadrangleOjo Encino Mesa, New Mexico Statewide Orthophotography ProjectUniversal Transverse Mercator projection, zone 13 North American Datum of 1983
Base modified from U.S. Geological Survey Digital Elevation Model dataUniversal Transverse Mercator, zone 13North American Datum of 1983
A
B C
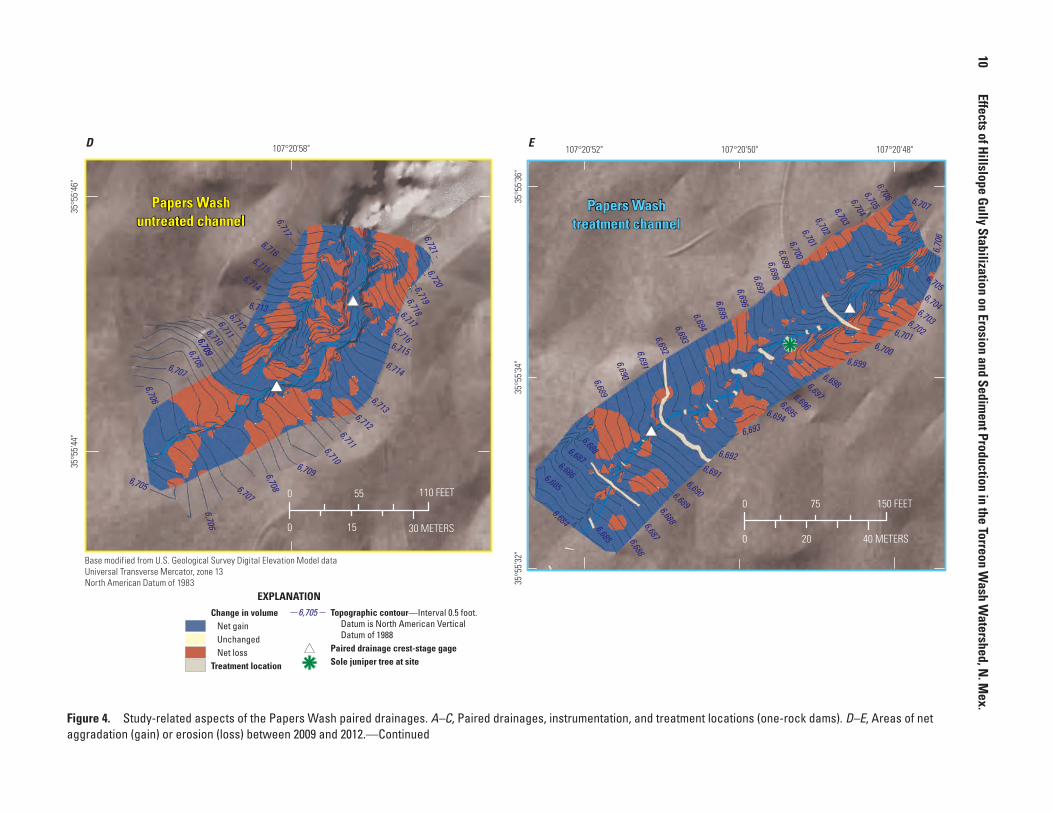
Figure 4. Study-related aspects of the Papers Wash paired drainages. A–C, Paired drainages, instrumentation, and treatment locations (one-rock dams). D–E, Areas of net aggradation (gain) or erosion (loss) between 2009 and 2012.
10
Effects of Hillslope Gully Stabilization on Erosion and Sediment Production in the Torreon W
ash Watershed, N
. Mex.
Base modified from U.S. Geological Survey Digital Elevation Model dataUniversal Transverse Mercator, zone 13North American Datum of 1983
EXPLANATIONChange in volume Net gain Unchanged Net lossTreatment location
Topographic contour—Interval 0.5 foot. Datum is North American Vertical Datum of 1988Paired drainage crest-stage gageSole juniper tree at site
6,705
6,7106,711
6,708
6,712
6,707
6,713
6,706
6,714
6,715
6,719
6,716
6,705
6,7206,721
6,717
6,718
6,709
6,7096,710
6,7116,712
6,7086,707
6,706
6,713
6,714
6,715
6,716
6,717
6,688
6,6866,687
6,689
6,690
6,6916,688
6,689
6,690
6,692
6,701
6,702
6,692
6,7006,699
6,693
6,698
6,694
6,6966,695
6,697
6,703
6,704
6,685
6,7046,705
6,684
6,705
6,707
6,6876,686
6,691
6,685
6,70
6
6,709
6,6936,694
6,695
6,6966,697
6,6986,699
6,7036,7026,7016,700
6,706
Papers Washuntreated channel
Papers Washtreatment channel
Papers Washuntreated channel
Papers Washtreatment channel
35°5
5'36
"35
°55'
34"
35°5
5'32
"
107°20'48"107°20'50"107°20'52"107°20'58"
35°5
5'46
"35
°55'
44"
0 55 110 FEET
0 15 30 METERS
0 75 150 FEET
0 20 40 METERS
D E
Figure 4. Study-related aspects of the Papers Wash paired drainages. A–C, Paired drainages, instrumentation, and treatment locations (one-rock dams). D–E, Areas of net aggradation (gain) or erosion (loss) between 2009 and 2012.—Continued
Methods of Investigation 11
Figure 5. Channel configuration at the beginning of the study period, untreated sites. A, Penistaja Arroyo site. Instrumentation in channel is mini-crest-stage gage. B, Papers Wash site.
A
B
12 Effects of Hillslope Gully Stabilization on Erosion and Sediment Production in the Torreon Wash Watershed, N. Mex.
Papers Washpaired drainages
Penistaja Arroyopaired drainages
Papers Washpaired drainages
Penistaja Arroyopaired drainages
Torreon Wash
San I
sidro
Was
h
Chico, Arroyo
Chaco Wash
Arroyo
Pied
ra Lu
mbre
Puerco
, R
io
Vicente Arroyo
Papers Wash
Penistaj
a Arro
yo
Chijuilla, Arroyo
Arroyo Ja
rido
Corrales, C
añada
La Saladita
Encino Wash
Horn Arroyo
North Fork Arroyo Chico
Lopez Arroyo
Tole
do A
rroy
o
Kin
aird
Arr
oyo
Arroyo Empedrado
Cañ
ada
Cebo
08332624To
rreon
Wash
Tinian
Torreon
PenistajaOjo Encino
Paired drainage boundaryCrest-stage gage and identifier Paired drainage Penistaja main-stem channelCross-section survey location and identifierTorreon 3
0833261008332624
EXPLANATION
Penistaja 1
Penistaja 2
Penistaja 3
Torreon 3
Torreon 2
Torreon 1
0 1 2 3 4 5 KILOMETERS
0 1 2 3 4 5 MILES
36°00'
35°45'
107°15'
107°30'
Base modified fromUniversal Transverse Mercator, zone 13North American Datum of 1983
Torreon Wash watershed
AR
IZO
NA
COLORADOUTA
H
OKLAHOMA
TEXAS
NEW MEXICO
Rio
Gran
de
Rio Puercowatershed
Torreon Wash watershed
08332620
08332622
0833261208332610
08332616
08332614
Figure 6. Location of study sites within the Torreon Wash watershed.
Methods of Investigation 13
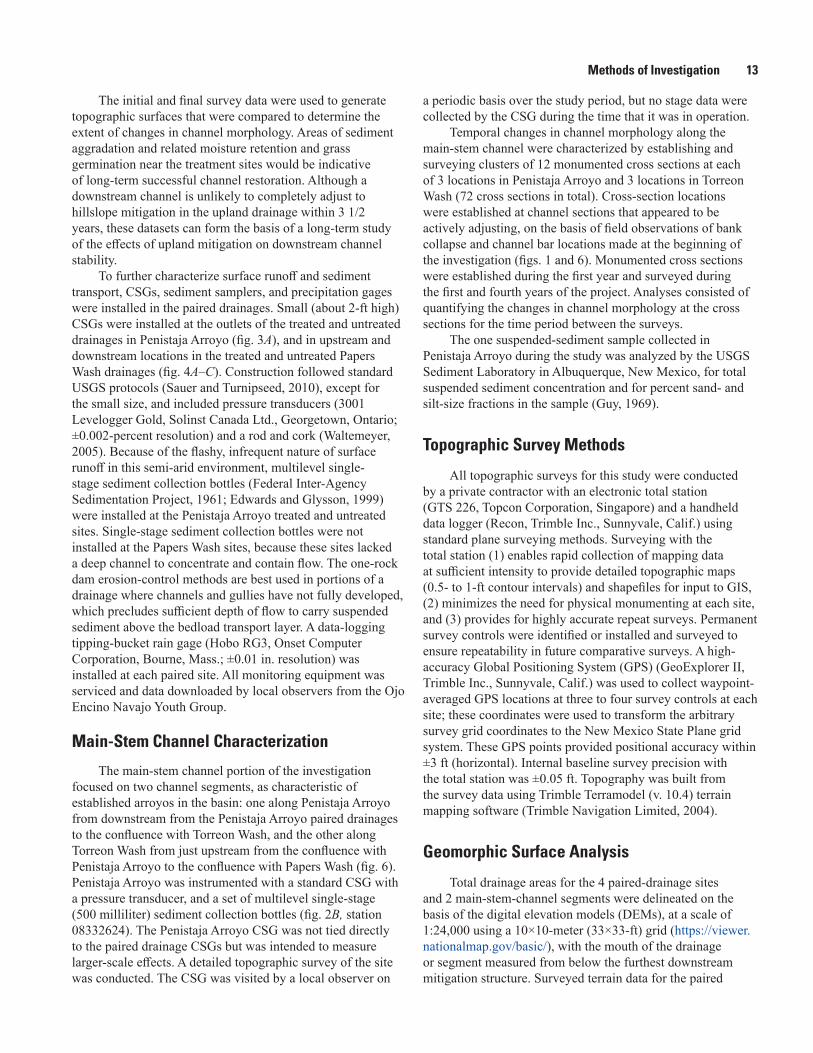
The initial and final survey data were used to generate topographic surfaces that were compared to determine the extent of changes in channel morphology. Areas of sediment aggradation and related moisture retention and grass germination near the treatment sites would be indicative of long-term successful channel restoration. Although a downstream channel is unlikely to completely adjust to hillslope mitigation in the upland drainage within 3 1/2 years, these datasets can form the basis of a long-term study of the effects of upland mitigation on downstream channel stability.
To further characterize surface runoff and sediment transport, CSGs, sediment samplers, and precipitation gages were installed in the paired drainages. Small (about 2-ft high) CSGs were installed at the outlets of the treated and untreated drainages in Penistaja Arroyo (fig. 3A), and in upstream and downstream locations in the treated and untreated Papers Wash drainages (fig. 4A–C). Construction followed standard USGS protocols (Sauer and Turnipseed, 2010), except for the small size, and included pressure transducers (3001 Levelogger Gold, Solinst Canada Ltd., Georgetown, Ontario; ±0.002-percent resolution) and a rod and cork (Waltemeyer, 2005). Because of the flashy, infrequent nature of surface runoff in this semi-arid environment, multilevel single-stage sediment collection bottles (Federal Inter-Agency Sedimentation Project, 1961; Edwards and Glysson, 1999) were installed at the Penistaja Arroyo treated and untreated sites. Single-stage sediment collection bottles were not installed at the Papers Wash sites, because these sites lacked a deep channel to concentrate and contain flow. The one-rock dam erosion-control methods are best used in portions of a drainage where channels and gullies have not fully developed, which precludes sufficient depth of flow to carry suspended sediment above the bedload transport layer. A data-logging tipping-bucket rain gage (Hobo RG3, Onset Computer Corporation, Bourne, Mass.; ±0.01 in. resolution) was installed at each paired site. All monitoring equipment was serviced and data downloaded by local observers from the Ojo Encino Navajo Youth Group.
Main-Stem Channel Characterization
The main-stem channel portion of the investigation focused on two channel segments, as characteristic of established arroyos in the basin: one along Penistaja Arroyo from downstream from the Penistaja Arroyo paired drainages to the confluence with Torreon Wash, and the other along Torreon Wash from just upstream from the confluence with Penistaja Arroyo to the confluence with Papers Wash (fig. 6). Penistaja Arroyo was instrumented with a standard CSG with a pressure transducer, and a set of multilevel single-stage (500 milliliter) sediment collection bottles (fig. 2B, station 08332624). The Penistaja Arroyo CSG was not tied directly to the paired drainage CSGs but was intended to measure larger-scale effects. A detailed topographic survey of the site was conducted. The CSG was visited by a local observer on
a periodic basis over the study period, but no stage data were collected by the CSG during the time that it was in operation.
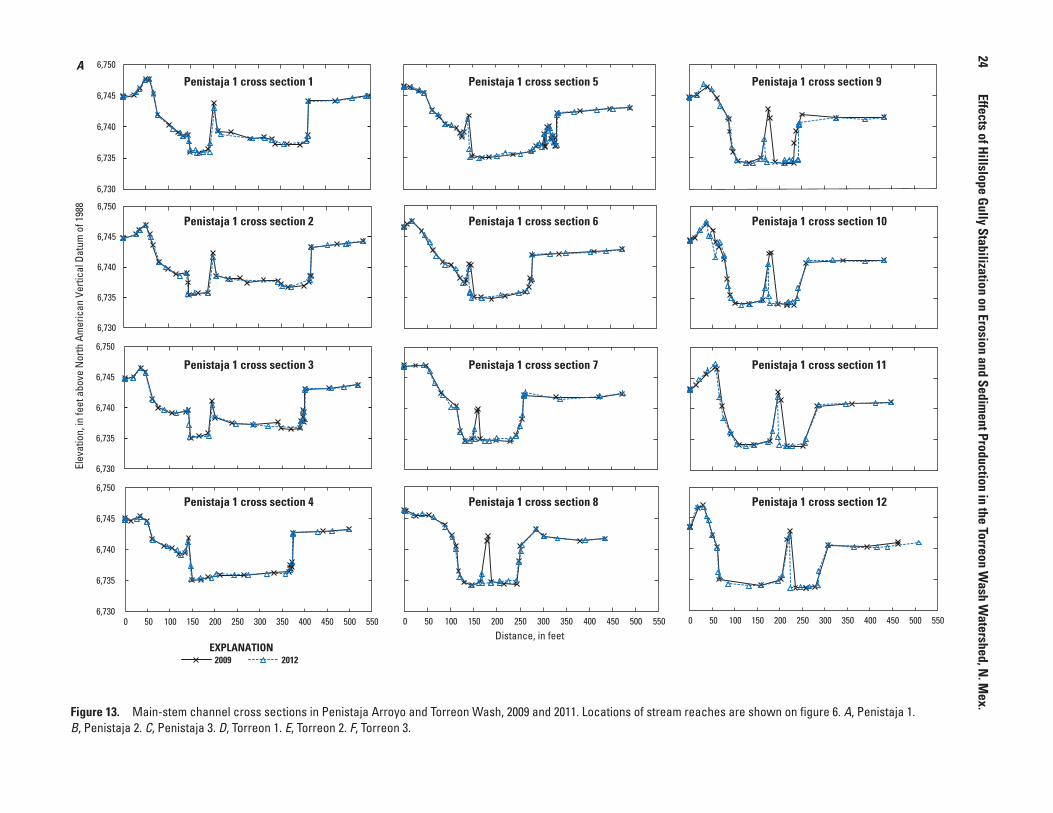
Temporal changes in channel morphology along the main-stem channel were characterized by establishing and surveying clusters of 12 monumented cross sections at each of 3 locations in Penistaja Arroyo and 3 locations in Torreon Wash (72 cross sections in total). Cross-section locations were established at channel sections that appeared to be actively adjusting, on the basis of field observations of bank collapse and channel bar locations made at the beginning of the investigation (figs. 1 and 6). Monumented cross sections were established during the first year and surveyed during the first and fourth years of the project. Analyses consisted of quantifying the changes in channel morphology at the cross sections for the time period between the surveys.
The one suspended-sediment sample collected in Penistaja Arroyo during the study was analyzed by the USGS Sediment Laboratory in Albuquerque, New Mexico, for total suspended sediment concentration and for percent sand- and silt-size fractions in the sample (Guy, 1969).
Topographic Survey Methods
All topographic surveys for this study were conducted by a private contractor with an electronic total station (GTS 226, Topcon Corporation, Singapore) and a handheld data logger (Recon, Trimble Inc., Sunnyvale, Calif.) using standard plane surveying methods. Surveying with the total station (1) enables rapid collection of mapping data at sufficient intensity to provide detailed topographic maps (0.5- to 1-ft contour intervals) and shapefiles for input to GIS, (2) minimizes the need for physical monumenting at each site, and (3) provides for highly accurate repeat surveys. Permanent survey controls were identified or installed and surveyed to ensure repeatability in future comparative surveys. A high-accuracy Global Positioning System (GPS) (GeoExplorer II, Trimble Inc., Sunnyvale, Calif.) was used to collect waypoint-averaged GPS locations at three to four survey controls at each site; these coordinates were used to transform the arbitrary survey grid coordinates to the New Mexico State Plane grid system. These GPS points provided positional accuracy within ±3 ft (horizontal). Internal baseline survey precision with the total station was ±0.05 ft. Topography was built from the survey data using Trimble Terramodel (v. 10.4) terrain mapping software (Trimble Navigation Limited, 2004).
Geomorphic Surface Analysis
Total drainage areas for the 4 paired-drainage sites and 2 main-stem-channel segments were delineated on the basis of the digital elevation models (DEMs), at a scale of 1:24,000 using a 10×10-meter (33×33-ft) grid (https://viewer.nationalmap.gov/basic/), with the mouth of the drainage or segment measured from below the furthest downstream mitigation structure. Surveyed terrain data for the paired
14 Effects of Hillslope Gully Stabilization on Erosion and Sediment Production in the Torreon Wash Watershed, N. Mex.
drainages were analyzed using GIS techniques. The survey data were converted into raster surfaces representing the 2009 and 2012 topographic conditions. A raster is a grid of cells, called pixels, each of which contains information, in this case, elevation data. Because of the density and precision of the survey points, it was possible to create rasters using a 0.5-ft pixel size. For each drainage, the 2009 and 2012 raster surfaces were compared using the cut and fill tool in ArcMap (http://desktop.arcgis.com/en/arcmap/). This tool calculates the difference in surface elevation between the raster surfaces for each raster pixel and displays the results as a net gain (representing aggradation) or a net loss (representing erosion) in surface elevation. Using the difference in surface elevation, the cut and fill tool also calculates the changes in volume between the two surfaces. These differences in volume are grouped together to show areas where volume changes are positive (aggradation) and areas where volume changes are negative (erosion). The cut and fill tool was applied to an area around the channels where the most active aggradation or erosion would be expected. Specifically, the area analyzed was established by applying a buffer around each streamline extending generally to the width of the channel banks or surveyed cross sections, and including the full extent of any encompassed channel treatments. The net erosion rate was computed as follows:
*365*304.8VER tA
∆ = ÷
, (1)
where ER is the erosion rate, in millimeters per year; ∆V is the negative change in volume from the cut
and fill analysis, in cubic feet; A is the basin area, in square feet; t is the time passed between the survey
measurements, in days; 365 is a time conversion factor, from days to
years; and 304.8 is a distance conversion factor, from feet to
millimeters.
Similarly, aggradation rates were calculated when the change in volume was positive.
Survey data for the monumented cross sections along the main-stem channels were analyzed by computing the change in cross-sectional area from 2009 to 2012 for each of the 12 monumented cross sections. For each of the six cross-section clusters, the mean, standard deviation, maximum, and minimum change in area for the 12 cross sections were computed.
Effects of Gully Erosion Control on Sediment Stabilization and Erosion
Precipitation in the study area, although not fully characterized, was drier than average during the study period and followed a typical monsoonal pattern, with storm intensity negatively related to storm duration. Suspended sediment transport during rain events was substantial during the study period, as indicated by channel infilling and by suspended-sediment concentration measured during a single rain event. The one-rock dams were effective in preventing gully formation, as indicated by comparisons of channel infilling and net aggradation at the treated sites relative to the untreated sites. Longitudinal variation observed in cross sections of main-stem channel segments downstream are consistent with an inferred pattern of dynamic channel adjustment.
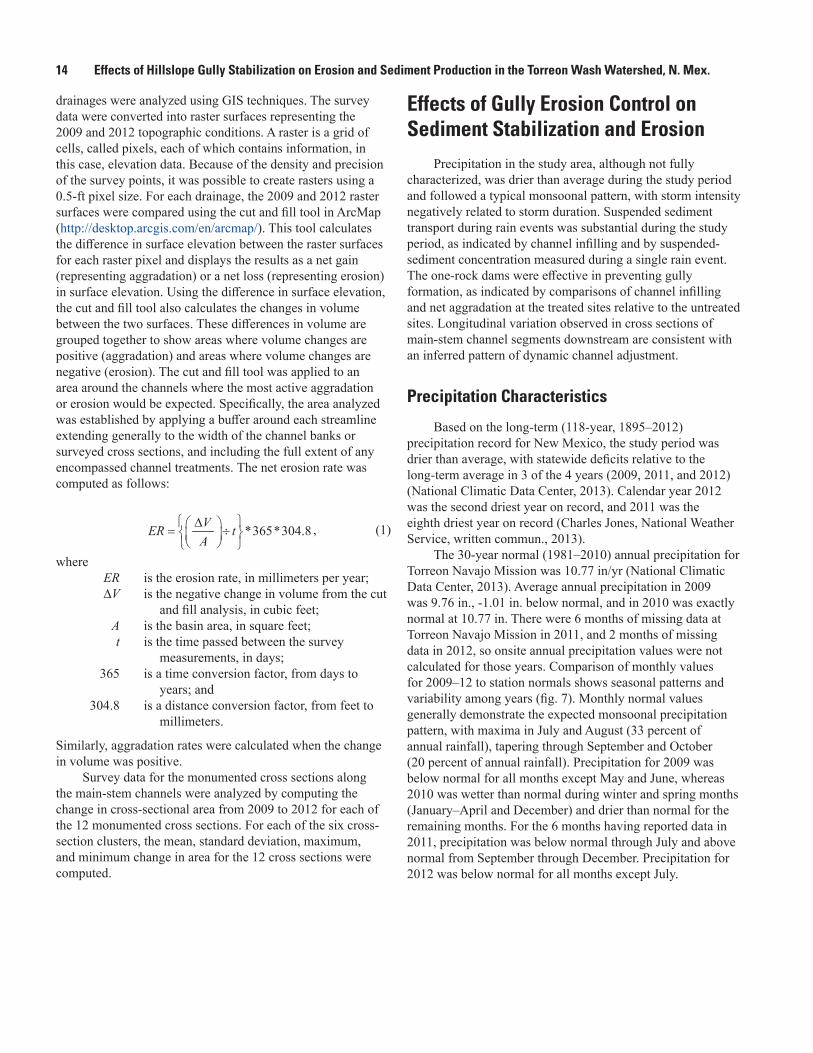
Precipitation Characteristics
Based on the long-term (118-year, 1895–2012) precipitation record for New Mexico, the study period was drier than average, with statewide deficits relative to the long-term average in 3 of the 4 years (2009, 2011, and 2012) (National Climatic Data Center, 2013). Calendar year 2012 was the second driest year on record, and 2011 was the eighth driest year on record (Charles Jones, National Weather Service, written commun., 2013).
The 30-year normal (1981–2010) annual precipitation for Torreon Navajo Mission was 10.77 in/yr (National Climatic Data Center, 2013). Average annual precipitation in 2009 was 9.76 in., -1.01 in. below normal, and in 2010 was exactly normal at 10.77 in. There were 6 months of missing data at Torreon Navajo Mission in 2011, and 2 months of missing data in 2012, so onsite annual precipitation values were not calculated for those years. Comparison of monthly values for 2009–12 to station normals shows seasonal patterns and variability among years (fig. 7). Monthly normal values generally demonstrate the expected monsoonal precipitation pattern, with maxima in July and August (33 percent of annual rainfall), tapering through September and October (20 percent of annual rainfall). Precipitation for 2009 was below normal for all months except May and June, whereas 2010 was wetter than normal during winter and spring months (January–April and December) and drier than normal for the remaining months. For the 6 months having reported data in 2011, precipitation was below normal through July and above normal from September through December. Precipitation for 2012 was below normal for all months except July.
Effects of Gully Erosion Control on Sediment Stabilization and Erosion 15
M M M M M M M M
Torreon Navajo Mission
Zero value
1981–2010 normal2009201020112012
EXPLANATION
M Missing value
Jan Feb Mar Apr May Jun
Month
Jul Aug Sep Oct Nov Dec0
0.5
1.0
1.5
2.0
2.5Pr
ecip
itatio
n, in
inch
es
Figure 7. Monthly precipitation at Torreon Navajo Mission for the 30-year normal period 1981–2010, and for 2009, 2010, 2011, and 2012.
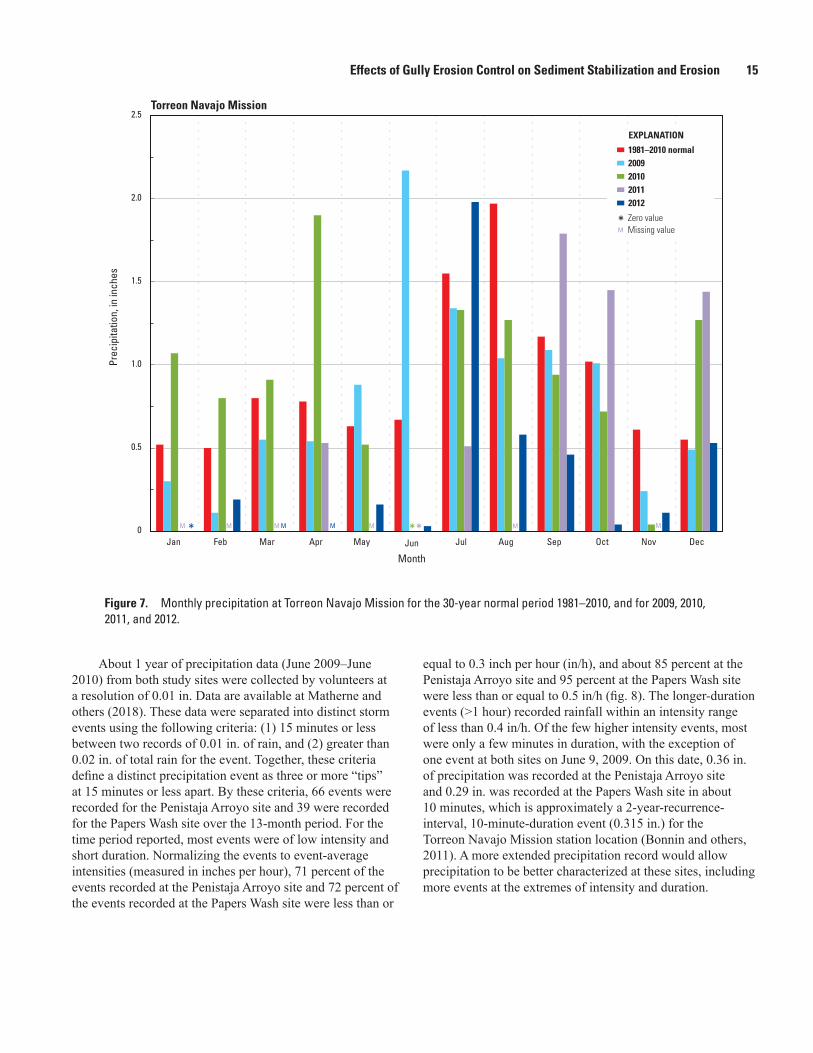
About 1 year of precipitation data (June 2009–June 2010) from both study sites were collected by volunteers at a resolution of 0.01 in. Data are available at Matherne and others (2018). These data were separated into distinct storm events using the following criteria: (1) 15 minutes or less between two records of 0.01 in. of rain, and (2) greater than 0.02 in. of total rain for the event. Together, these criteria define a distinct precipitation event as three or more “tips” at 15 minutes or less apart. By these criteria, 66 events were recorded for the Penistaja Arroyo site and 39 were recorded for the Papers Wash site over the 13-month period. For the time period reported, most events were of low intensity and short duration. Normalizing the events to event-average intensities (measured in inches per hour), 71 percent of the events recorded at the Penistaja Arroyo site and 72 percent of the events recorded at the Papers Wash site were less than or
equal to 0.3 inch per hour (in/h), and about 85 percent at the Penistaja Arroyo site and 95 percent at the Papers Wash site were less than or equal to 0.5 in/h (fig. 8). The longer-duration events (>1 hour) recorded rainfall within an intensity range of less than 0.4 in/h. Of the few higher intensity events, most were only a few minutes in duration, with the exception of one event at both sites on June 9, 2009. On this date, 0.36 in. of precipitation was recorded at the Penistaja Arroyo site and 0.29 in. was recorded at the Papers Wash site in about 10 minutes, which is approximately a 2-year-recurrence-interval, 10-minute-duration event (0.315 in.) for the Torreon Navajo Mission station location (Bonnin and others, 2011). A more extended precipitation record would allow precipitation to be better characterized at these sites, including more events at the extremes of intensity and duration.
16 Effects of Hillslope Gully Stabilization on Erosion and Sediment Production in the Torreon Wash Watershed, N. Mex.
0.1 1 100.01
Storm duration, in hours
0.01
0.1
1
10
Stor
m in
tens
ity, i
n in
ches
per
hou
r
Penistaja Arroyo tributaryPapers Wash
EXPLANATION
Figure 8. Storm intensity compared to storm duration at the Penistaja Arroyo and Papers Wash sites.
Runoff and Sediment Transport in Response to Precipitation
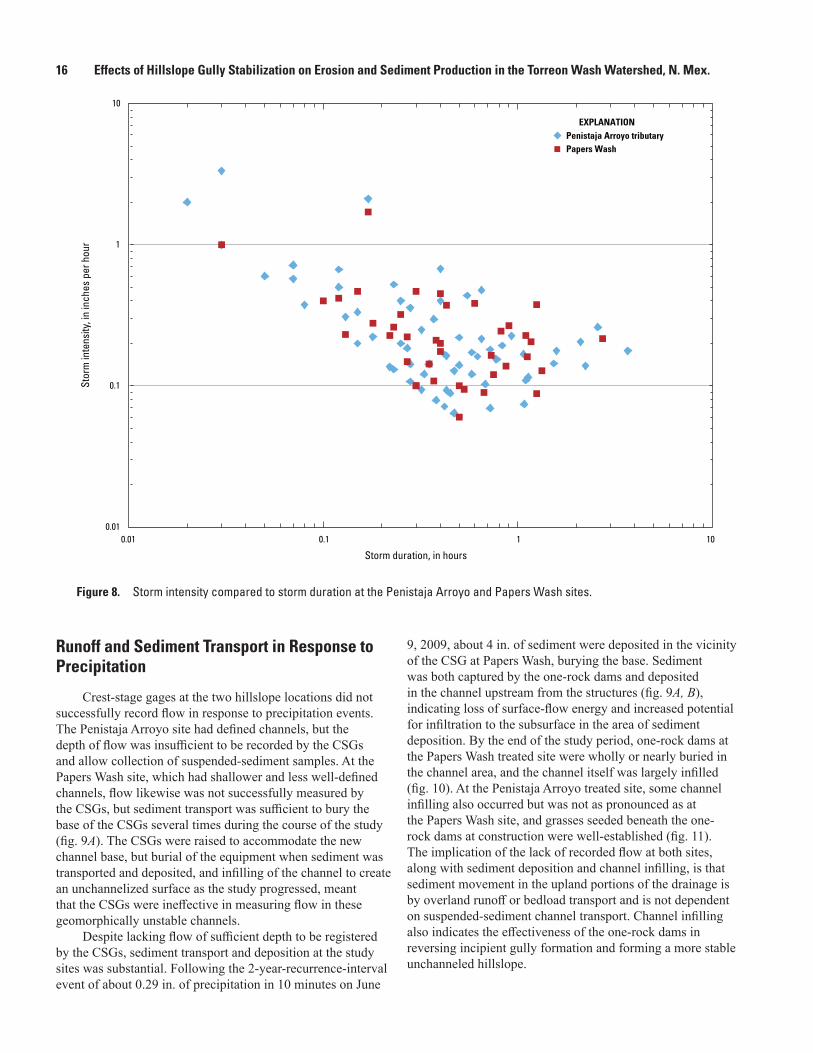
Crest-stage gages at the two hillslope locations did not successfully record flow in response to precipitation events. The Penistaja Arroyo site had defined channels, but the depth of flow was insufficient to be recorded by the CSGs and allow collection of suspended-sediment samples. At the Papers Wash site, which had shallower and less well-defined channels, flow likewise was not successfully measured by the CSGs, but sediment transport was sufficient to bury the base of the CSGs several times during the course of the study (fig. 9A). The CSGs were raised to accommodate the new channel base, but burial of the equipment when sediment was transported and deposited, and infilling of the channel to create an unchannelized surface as the study progressed, meant that the CSGs were ineffective in measuring flow in these geomorphically unstable channels.
Despite lacking flow of sufficient depth to be registered by the CSGs, sediment transport and deposition at the study sites was substantial. Following the 2-year-recurrence-interval event of about 0.29 in. of precipitation in 10 minutes on June
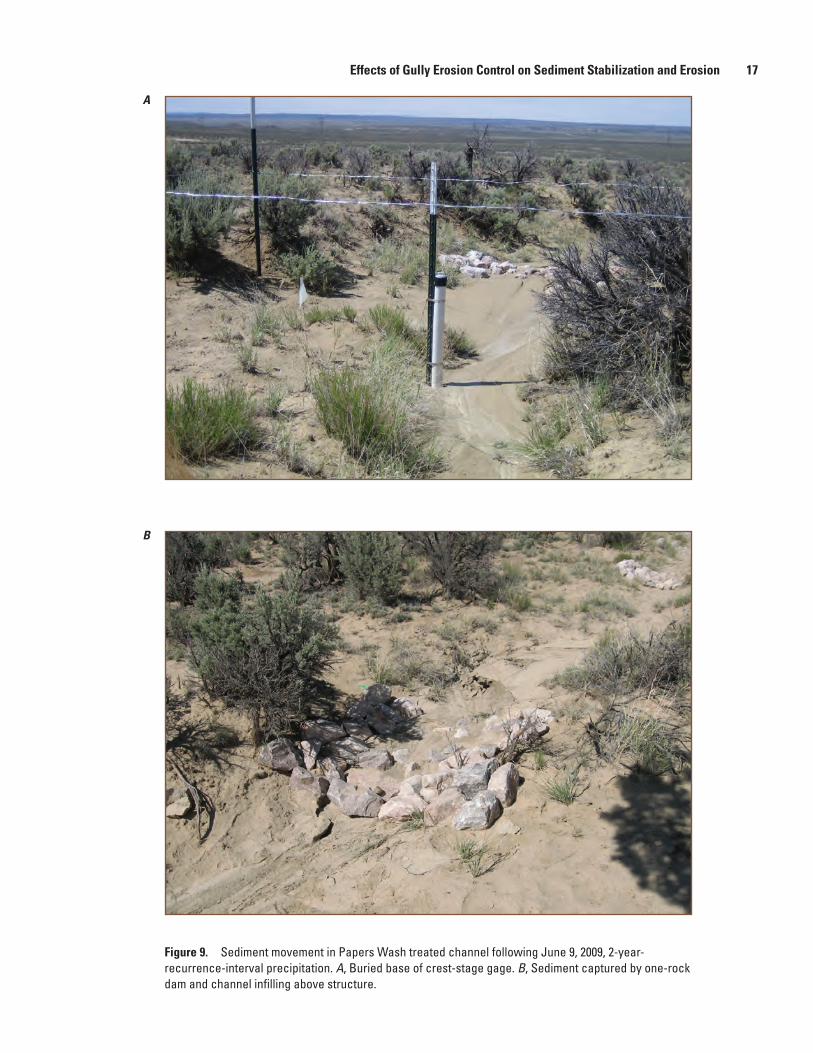
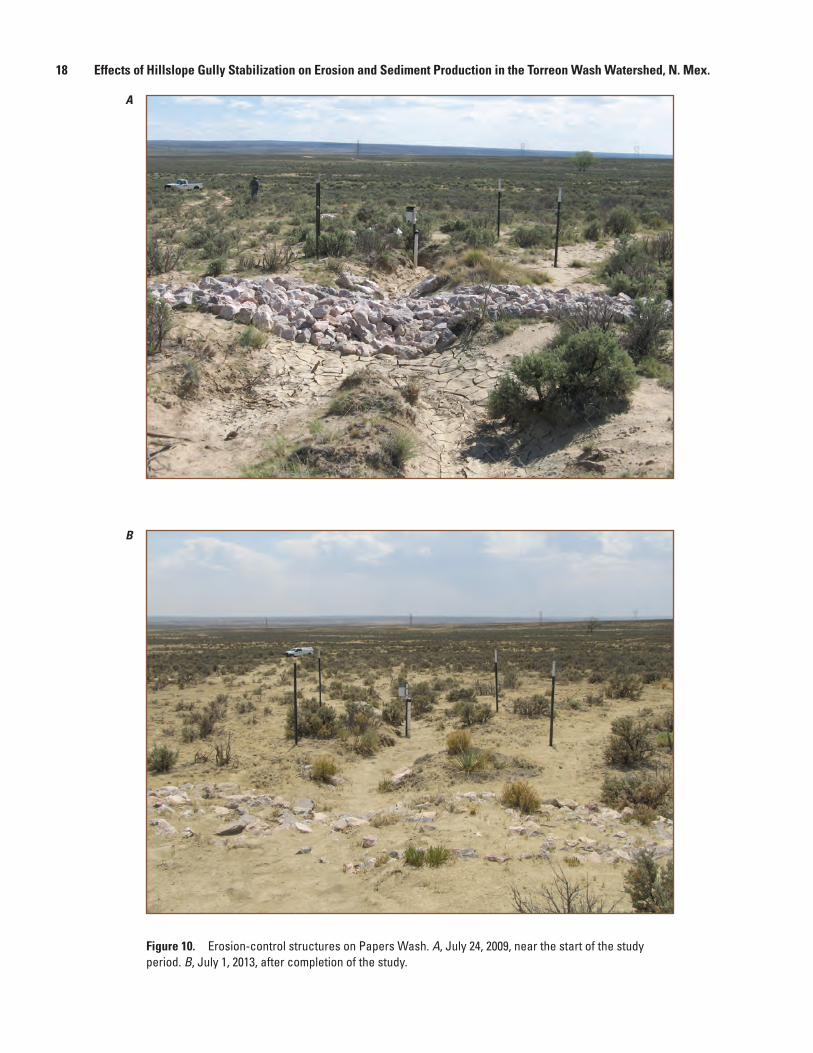
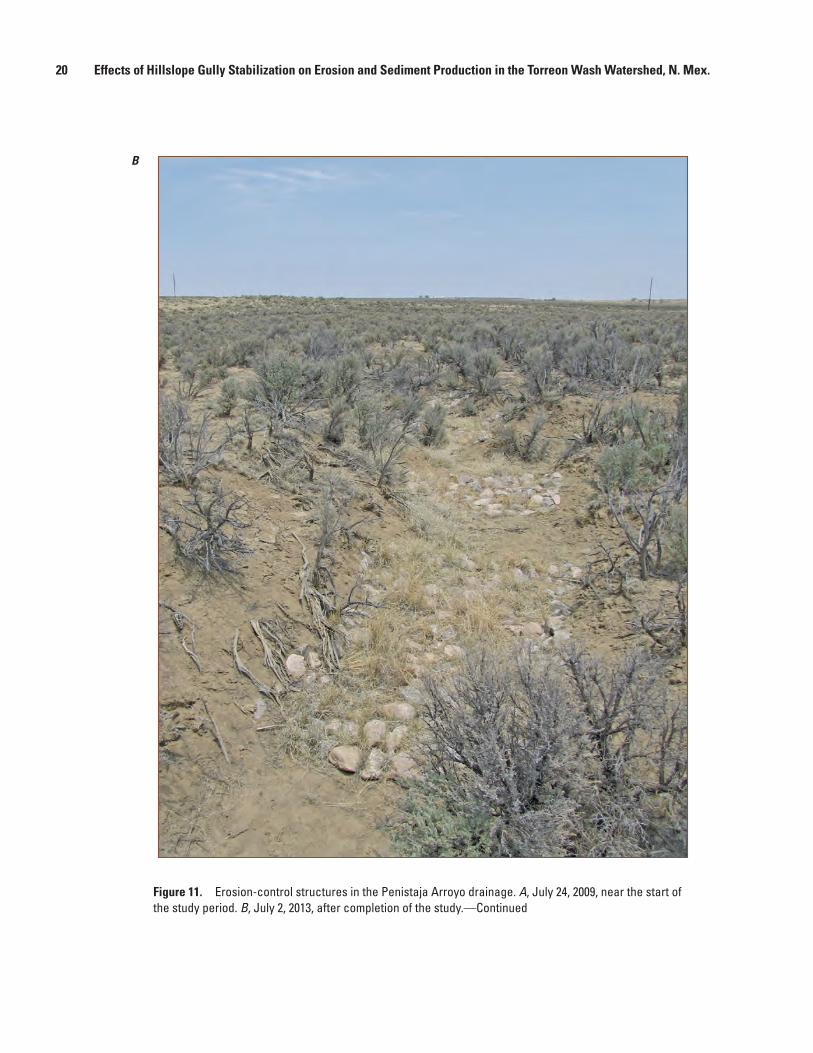
9, 2009, about 4 in. of sediment were deposited in the vicinity of the CSG at Papers Wash, burying the base. Sediment was both captured by the one-rock dams and deposited in the channel upstream from the structures (fig. 9A, B), indicating loss of surface-flow energy and increased potential for infiltration to the subsurface in the area of sediment deposition. By the end of the study period, one-rock dams at the Papers Wash treated site were wholly or nearly buried in the channel area, and the channel itself was largely infilled (fig. 10). At the Penistaja Arroyo treated site, some channel infilling also occurred but was not as pronounced as at the Papers Wash site, and grasses seeded beneath the one-rock dams at construction were well-established (fig. 11). The implication of the lack of recorded flow at both sites, along with sediment deposition and channel infilling, is that sediment movement in the upland portions of the drainage is by overland runoff or bedload transport and is not dependent on suspended-sediment channel transport. Channel infilling also indicates the effectiveness of the one-rock dams in reversing incipient gully formation and forming a more stable unchanneled hillslope.
Effects of Gully Erosion Control on Sediment Stabilization and Erosion 17
A
B
Figure 9. Sediment movement in Papers Wash treated channel following June 9, 2009, 2-year-recurrence-interval precipitation. A, Buried base of crest-stage gage. B, Sediment captured by one-rock dam and channel infilling above structure.
18 Effects of Hillslope Gully Stabilization on Erosion and Sediment Production in the Torreon Wash Watershed, N. Mex.
A
B
Figure 10. Erosion-control structures on Papers Wash. A, July 24, 2009, near the start of the study period. B, July 1, 2013, after completion of the study.

Effects of Gully Erosion Control on Sediment Stabilization and Erosion 19
Figure 11. Erosion-control structures in the Penistaja Arroyo drainage. A, July 24, 2009, near the start of the study period. B, July 2, 2013, after completion of the study.
A
20 Effects of Hillslope Gully Stabilization on Erosion and Sediment Production in the Torreon Wash Watershed, N. Mex.
Figure 11. Erosion-control structures in the Penistaja Arroyo drainage. A, July 24, 2009, near the start of the study period. B, July 2, 2013, after completion of the study.—Continued
B
Effects of Gully Erosion Control on Sediment Stabilization and Erosion 21
A single suspended-sediment sample was collected in Penistaja Arroyo on June 23, 2011, having a concentration of 196,000 milligrams per liter (mg/L). This value is within the range of concentrations reported for the Arroyo Chico near Guadalupe (08340500; drainage area 1,390 mi2; maximum recorded concentration 293,000 mg/L on July 2, 1980) and the Rio Puerco above Arroyo Chico near Guadalupe (08334000; drainage area 420 mi2; maximum recorded concentration 495,000 mg/L on July 31, 1982) (http://waterdata.usgs.gov/nm/nwis/qw/). Earlier studies in the Rio Puerco established that Rio Puerco flow is well-mixed and that the distribution of total suspended-sediment concentration is nearly uniform throughout the vertical water column, so that a single sample is considered representative of the average suspended-sediment concentration transported by that flow event (Nordin, 1963). The high suspended-sediment concentration of flow in Penistaja Arroyo is typical of flows in the Rio Puerco and reflects abundant, easily mobilized sediment sources on the hillslope and in the channel.
Comparison of Net Aggradation in the Upland Paired Drainages
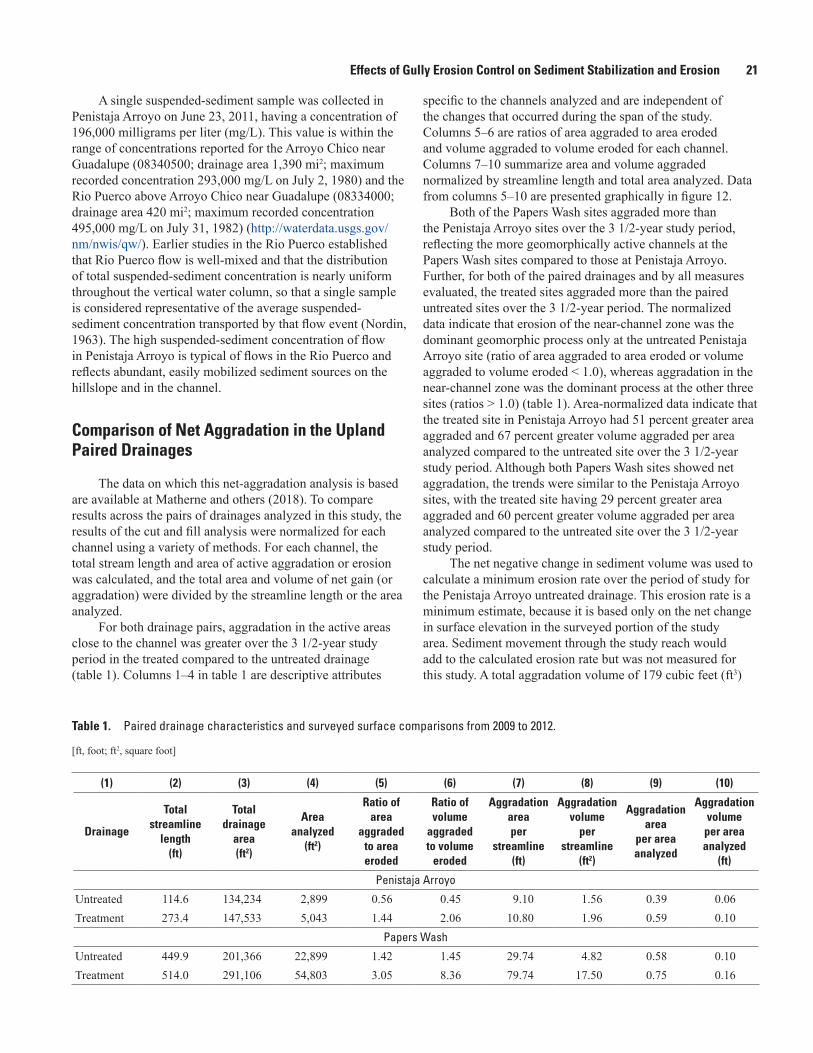
The data on which this net-aggradation analysis is based are available at Matherne and others (2018). To compare results across the pairs of drainages analyzed in this study, the results of the cut and fill analysis were normalized for each channel using a variety of methods. For each channel, the total stream length and area of active aggradation or erosion was calculated, and the total area and volume of net gain (or aggradation) were divided by the streamline length or the area analyzed.
For both drainage pairs, aggradation in the active areas close to the channel was greater over the 3 1/2-year study period in the treated compared to the untreated drainage (table 1). Columns 1–4 in table 1 are descriptive attributes
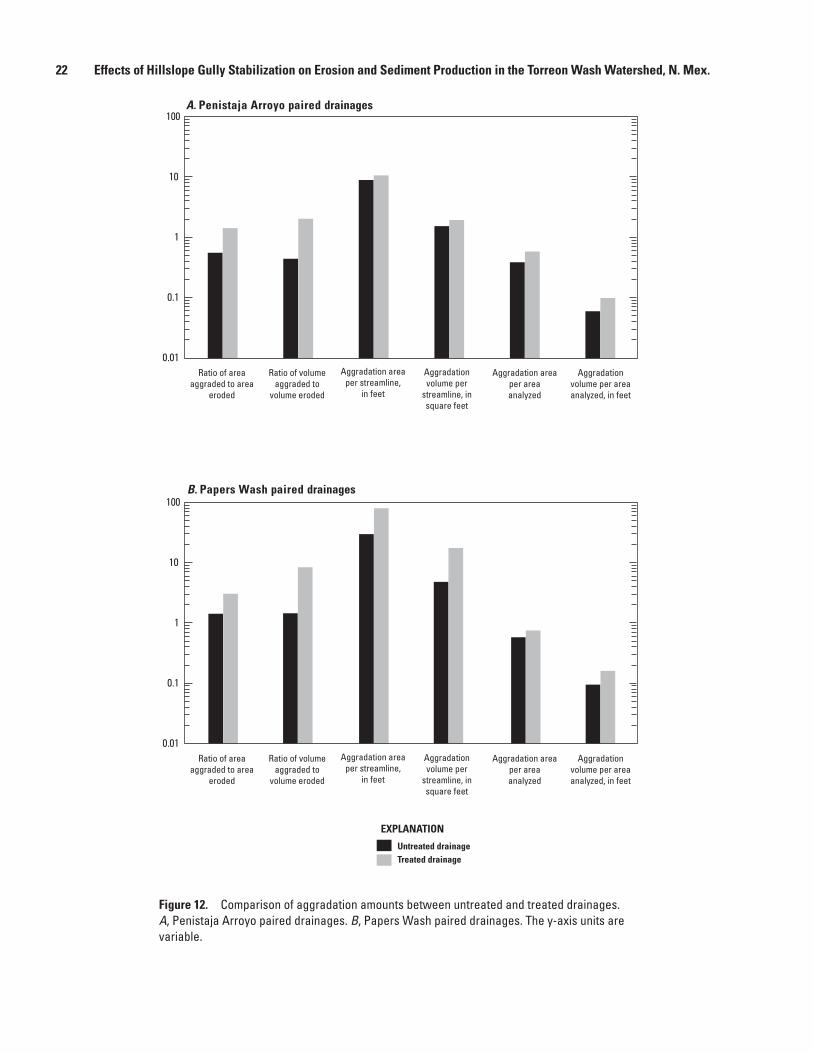
specific to the channels analyzed and are independent of the changes that occurred during the span of the study. Columns 5–6 are ratios of area aggraded to area eroded and volume aggraded to volume eroded for each channel. Columns 7–10 summarize area and volume aggraded normalized by streamline length and total area analyzed. Data from columns 5–10 are presented graphically in figure 12.
Both of the Papers Wash sites aggraded more than the Penistaja Arroyo sites over the 3 1/2-year study period, reflecting the more geomorphically active channels at the Papers Wash sites compared to those at Penistaja Arroyo. Further, for both of the paired drainages and by all measures evaluated, the treated sites aggraded more than the paired untreated sites over the 3 1/2-year period. The normalized data indicate that erosion of the near-channel zone was the dominant geomorphic process only at the untreated Penistaja Arroyo site (ratio of area aggraded to area eroded or volume aggraded to volume eroded < 1.0), whereas aggradation in the near-channel zone was the dominant process at the other three sites (ratios > 1.0) (table 1). Area-normalized data indicate that the treated site in Penistaja Arroyo had 51 percent greater area aggraded and 67 percent greater volume aggraded per area analyzed compared to the untreated site over the 3 1/2-year study period. Although both Papers Wash sites showed net aggradation, the trends were similar to the Penistaja Arroyo sites, with the treated site having 29 percent greater area aggraded and 60 percent greater volume aggraded per area analyzed compared to the untreated site over the 3 1/2-year study period.
The net negative change in sediment volume was used to calculate a minimum erosion rate over the period of study for the Penistaja Arroyo untreated drainage. This erosion rate is a minimum estimate, because it is based only on the net change in surface elevation in the surveyed portion of the study area. Sediment movement through the study reach would add to the calculated erosion rate but was not measured for this study. A total aggradation volume of 179 cubic feet (ft3)
Table 1. Paired drainage characteristics and surveyed surface comparisons from 2009 to 2012.
[ft, foot; ft2, square foot]
(1) (2) (3) (4) (5) (6) (7) (8) (9) (10)
Drainage
Total streamline
length (ft)
Total drainage
area (ft2)
Area analyzed
(ft2)
Ratio of area
aggraded to area eroded
Ratio of volume
aggraded to volume
eroded
Aggradation area per
streamline (ft)
Aggradation volume
per streamline
(ft2)
Aggradation area
per area analyzed
Aggradation volume per area analyzed
(ft)
Penistaja Arroyo
Untreated 114.6 134,234 2,899 0.56 0.45 9.10 1.56 0.39 0.06Treatment 273.4 147,533 5,043 1.44 2.06 10.80 1.96 0.59 0.10
Papers Wash
Untreated 449.9 201,366 22,899 1.42 1.45 29.74 4.82 0.58 0.10Treatment 514.0 291,106 54,803 3.05 8.36 79.74 17.50 0.75 0.16
22 Effects of Hillslope Gully Stabilization on Erosion and Sediment Production in the Torreon Wash Watershed, N. Mex.
0.01
0.1
1
10
100
0.01
0.1
1
10
100
Ratio of areaaggraded to area
eroded
Ratio of volumeaggraded to
volume eroded
Aggradation areaper streamline,
in feet
Aggradationvolume per
streamline, insquare feet
Aggradation areaper areaanalyzed
Aggradationvolume per areaanalyzed, in feet
Ratio of areaaggraded to area
eroded
Ratio of volumeaggraded to
volume eroded
Aggradation areaper streamline,
in feet
Aggradationvolume per
streamline, insquare feet
Aggradation areaper areaanalyzed
Aggradationvolume per areaanalyzed, in feet
Untreated drainageTreated drainage
EXPLANATION
B. Papers Wash paired drainages
A. Penistaja Arroyo paired drainages
Figure 12. Comparison of aggradation amounts between untreated and treated drainages. A, Penistaja Arroyo paired drainages. B, Papers Wash paired drainages. The y-axis units are variable.
Effects of Gully Erosion Control on Sediment Stabilization and Erosion 23
and a total eroded volume of 401 ft3 was calculated, yielding a net change in volume of -222 ft3. The original survey was conducted on April 29, 2009, and the final survey was conducted on November 15, 2012. Over the 1,296 days of the study, the calculated minimum erosion rate was 0.00046 ft/yr (0.14 mm/yr) for the 134,234-square-foot drainage area at the untreated Penistaja Arroyo site, which is similar to historical regional hillslope erosion rates (0.15 mm/yr; Clapp and others, 2001; Gellis and others, 2004; Gellis and others, 2012).
The aggradation rate represents the rate at which sediment accumulated in the study channel during the study period, and it was calculated in a manner similar to that for the erosion rate. Calculated aggradation rates for the three sites where aggradation was the dominant geomorphic process were 0.0063 in/yr (0.16 mm/yr) for the Penistaja Arroyo treated drainage, 0.012 in/yr (0.31 mm/yr) for the Papers Wash untreated drainage, and 0.988 in/yr (2.51 mm/yr) for the Papers Wash treated drainage.
Channel Adjustment in Penistaja Arroyo and Torreon Wash
The data on which this channel-adjustment analysis is based are available at Matherne and others (2018). The three survey sites on each main-stem channel segment, Penistaja Arroyo [P] and Torreon Wash [T], included cross-section [XS] clusters that showed erosion by both bank failure (P2 XS 7-12; P3 XS 4, 12; and T1 XS 7-8) and partial or complete removal of channel bars (P1 XS 7-10; and T3 XS 6) (figs. 6 and 13). Other cross sections showed deposition, including channel-bank deposition (T2 XS 5; and T3 XS 8) and channel-bar deposition (T1 XS 2-12; T2 XS 1-2, 7-8, 11-12; and T3 XS 7).
Analysis of the clustered cross sections on the main-stem reaches of Penistaja Arroyo and Torreon Wash do not support a broad picture of arroyo downcutting or aggradation but rather suggest dynamically adjusting channel cross sections. For each cross section in a cluster, the 2012 cross-sectional area was subtracted from the 2009 cross-sectional area, and a mean change in area for the cluster was calculated. A positive difference indicates erosion or a net increase in cross-sectional area, and a negative difference indicates
aggradation or a net decrease in cross-sectional area. Based on the mean change in cross-sectional area for each cluster of 12 cross sections (table 2), 3 of the clusters (P2, P3, and T1) show net aggradation for the period and 3 (P1, T2, and T3) show net erosion. The longitudinal change along the Penistaja Arroyo and Torreon Wash channels indicates variation along the channel. A general downstream pattern of net erosion, followed by net aggradation, followed by net erosion, may indicate a pulse of sediment moving downstream, with the most recent (2012) survey indicating the pulse resides in the three middle cross sections (P2, P3, and T1). A longer time series of data would be needed to confirm this hypothesis.
Effects of Upland Mitigation on Sediment Production in the Torreon Wash Watershed
Over the 3 1/2-year data-collection period, suspended-sediment data were difficult to acquire and could not be used to establish baseline discharge and suspended-sediment concentrations. Documentation of changes in channel morphology proved to be more effective than suspended-sediment measurements in quantifying the effects of mitigation activities to the drainages.
The results of the paired drainage study indicate that the drainage treated with one-rock dams showed a 60- to 67-percent increase in sediment volume aggraded per unit area compared to the untreated drainage at both the channelized (Penistaja Arroyo) and geomorphically active (Papers Wash) sites (table 1). Evidence of gully stabilization and infilling was observed at both locations, along with the establishment of vegetation at some treated locations, indicating retention of soil moisture beneath the one-rock dams. The study was conducted during a dry period; therefore, calculated aggradation and erosion rates probably represent below-average rates of runoff-mediated sediment transport and aggradation for the upland areas. The upland mitigation measures appeared to store surface runoff, with increased infiltration and soil moisture, based on observed vegetation growth in and around the one-rock dams. The decrease in surface runoff appeared to decrease channel incision and gully formation or maintenance.
24
Effects of Hillslope Gully Stabilization on Erosion and Sediment Production in the Torreon W
ash Watershed, N
. Mex.
0 50 100 150 200 250 300 350 400 450 500 550 0 50 100 150 200 250 300 350 400 450 500 550 0 50 100 150 200 250 300 350 400 450 500 550
Distance, in feet
6,730
6,735
6,740
6,745
6,750
6,730
6,735
6,740
6,745
6,750
6,730
6,735
6,740
6,745
6,750
6,730
6,735
6,740
6,745
6,750
Elev
atio
n, in
feet
abo
ve N
orth
Am
eric
an V
ertic
al D
atum
of 1
988
Penistaja 1 cross section 1 Penistaja 1 cross section 5 Penistaja 1 cross section 9
Penistaja 1 cross section 2 Penistaja 1 cross section 6 Penistaja 1 cross section 10
Penistaja 1 cross section 3 Penistaja 1 cross section 7 Penistaja 1 cross section 11
Penistaja 1 cross section 4 Penistaja 1 cross section 8 Penistaja 1 cross section 12
2009 2012EXPLANATION
A
Figure 13. Main-stem channel cross sections in Penistaja Arroyo and Torreon Wash, 2009 and 2011. Locations of stream reaches are shown on figure 6. A, Penistaja 1. B, Penistaja 2. C, Penistaja 3. D, Torreon 1. E, Torreon 2. F, Torreon 3.
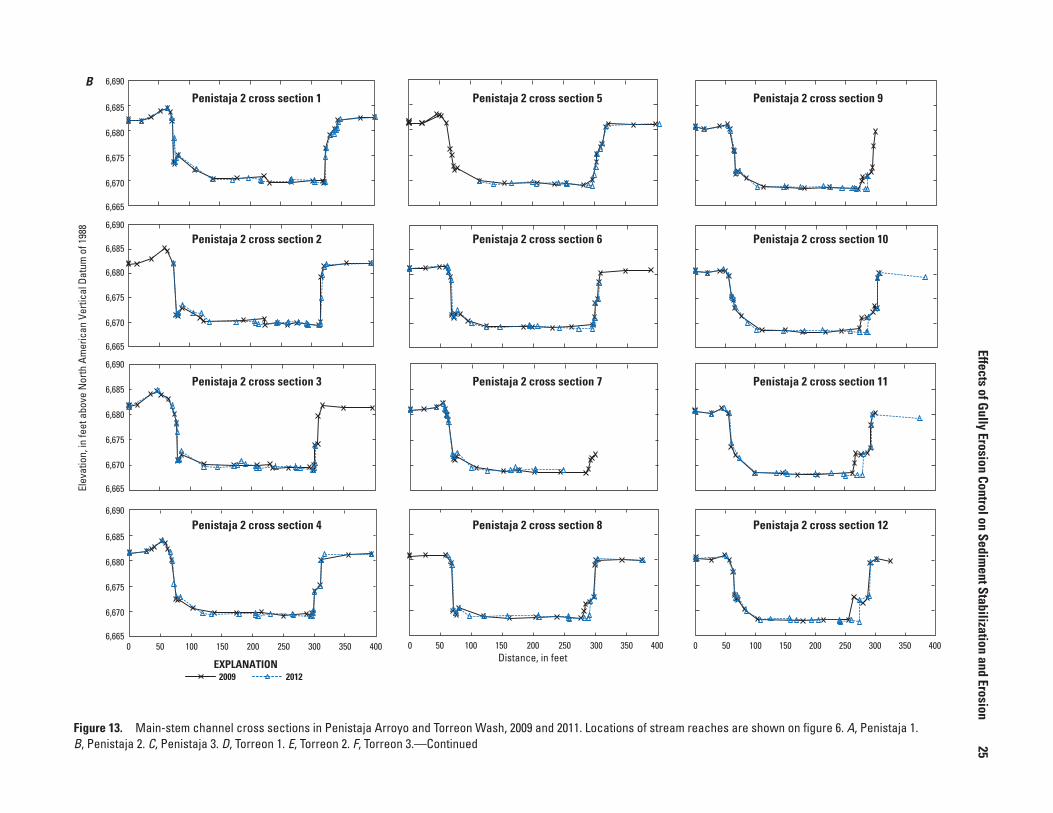
Effects of Gully Erosion Control on Sediment Stabilization and Erosion
25
0 50 100 150 200 250 300 350 400 0 50 100 150 200 250 300 350 400 0 50 100 150 200 250 300 350 400Distance, in feet
6,665
6,670
6,675
6,685
6,680
6,690
6,665
6,670
6,675
6,685
6,680
6,690
6,665
6,670
6,675
6,685
6,680
6,690
6,665
6,670
6,675
6,685
6,680
6,690El
evat
ion,
in fe
et a
bove
Nor
th A
mer
ican
Ver
tical
Dat
um o
f 198
8Penistaja 2 cross section 1 Penistaja 2 cross section 5 Penistaja 2 cross section 9
Penistaja 2 cross section 2 Penistaja 2 cross section 6 Penistaja 2 cross section 10
Penistaja 2 cross section 3 Penistaja 2 cross section 7 Penistaja 2 cross section 11
Penistaja 2 cross section 4 Penistaja 2 cross section 8 Penistaja 2 cross section 12
B
2009 2012EXPLANATION
Figure 13. Main-stem channel cross sections in Penistaja Arroyo and Torreon Wash, 2009 and 2011. Locations of stream reaches are shown on figure 6. A, Penistaja 1. B, Penistaja 2. C, Penistaja 3. D, Torreon 1. E, Torreon 2. F, Torreon 3.—Continued
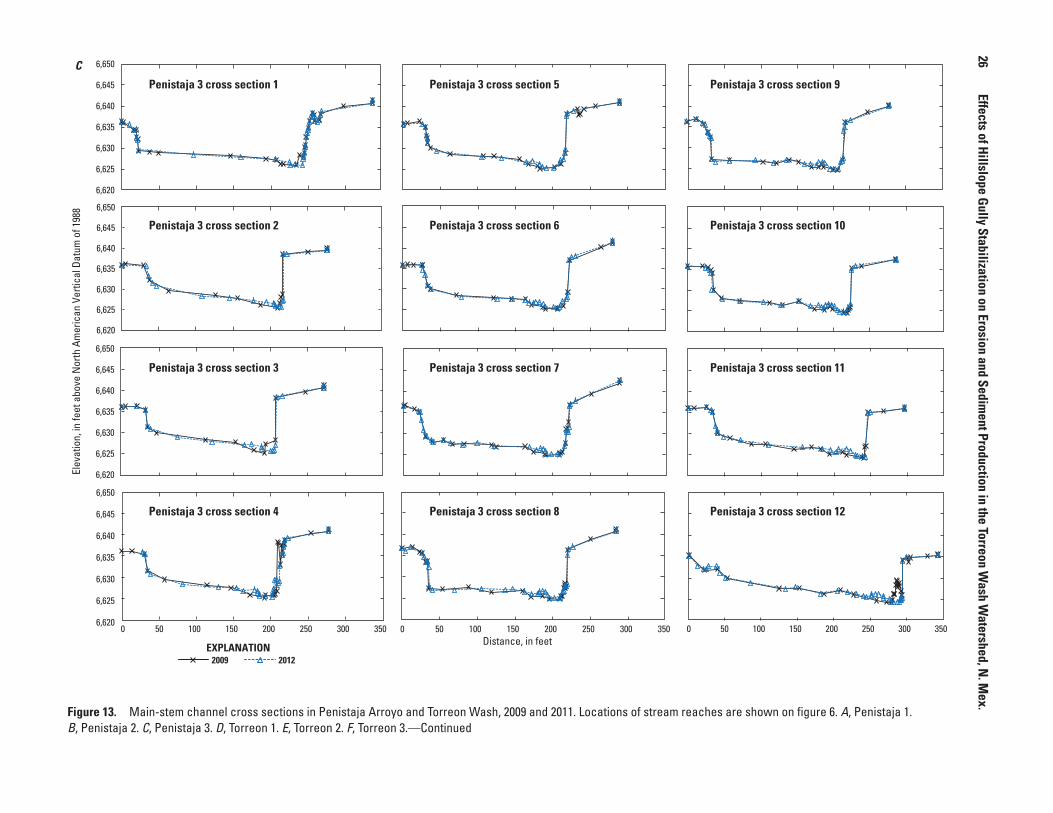
26
Effects of Hillslope Gully Stabilization on Erosion and Sediment Production in the Torreon W
ash Watershed, N
. Mex.
Distance, in feet0 50 100 150 200 250 300 350 0 50 100 150 200 250 300 350 0 50 100 150 200 250 300 350
Elev
atio
n, in
feet
abo
ve N
orth
Am
eric
an V
ertic
al D
atum
of 1
988
6,620
6,625
6,630
6,635
6,640
6,645
6,650
6,620
6,625
6,630
6,635
6,640
6,645
6,650
6,620
6,625
6,630
6,635
6,640
6,645
6,650
6,620
6,625
6,630
6,635
6,640
6,645
6,650
Penistaja 3 cross section 1 Penistaja 3 cross section 5 Penistaja 3 cross section 9
Penistaja 3 cross section 2 Penistaja 3 cross section 6 Penistaja 3 cross section 10
Penistaja 3 cross section 3 Penistaja 3 cross section 7 Penistaja 3 cross section 11
Penistaja 3 cross section 4 Penistaja 3 cross section 8 Penistaja 3 cross section 12
2009 2012EXPLANATION
C
Figure 13. Main-stem channel cross sections in Penistaja Arroyo and Torreon Wash, 2009 and 2011. Locations of stream reaches are shown on figure 6. A, Penistaja 1. B, Penistaja 2. C, Penistaja 3. D, Torreon 1. E, Torreon 2. F, Torreon 3.—Continued
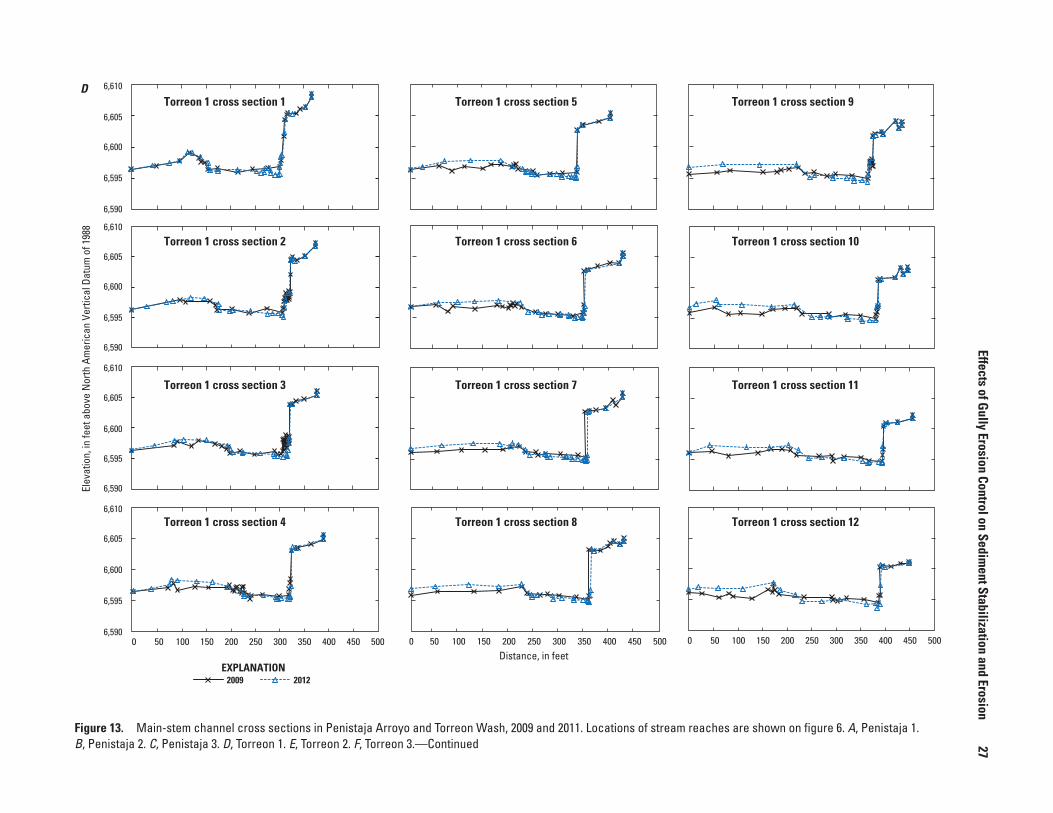
Effects of Gully Erosion Control on Sediment Stabilization and Erosion
27
0 50 100 150 200 250 300 350 400 450 500 0 50 100 150 200 250 300 350 400 450 500 0 50 100 150 200 250 300 350 400 450 500
Distance, in feet
6,590
6,595
6,600
6,605
6,610
6,590
6,595
6,600
6,605
6,610
6,590
6,595
6,600
6,605
6,610
6,590
6,595
6,600
6,605
6,610
Elev
atio
n, in
feet
abo
ve N
orth
Am
eric
an V
ertic
al D
atum
of 1
988
Torreon 1 cross section 1 Torreon 1 cross section 5 Torreon 1 cross section 9
Torreon 1 cross section 2 Torreon 1 cross section 6 Torreon 1 cross section 10
Torreon 1 cross section 3 Torreon 1 cross section 7 Torreon 1 cross section 11
Torreon 1 cross section 4 Torreon 1 cross section 8 Torreon 1 cross section 12
2009 2012EXPLANATION
D
Figure 13. Main-stem channel cross sections in Penistaja Arroyo and Torreon Wash, 2009 and 2011. Locations of stream reaches are shown on figure 6. A, Penistaja 1. B, Penistaja 2. C, Penistaja 3. D, Torreon 1. E, Torreon 2. F, Torreon 3.—Continued
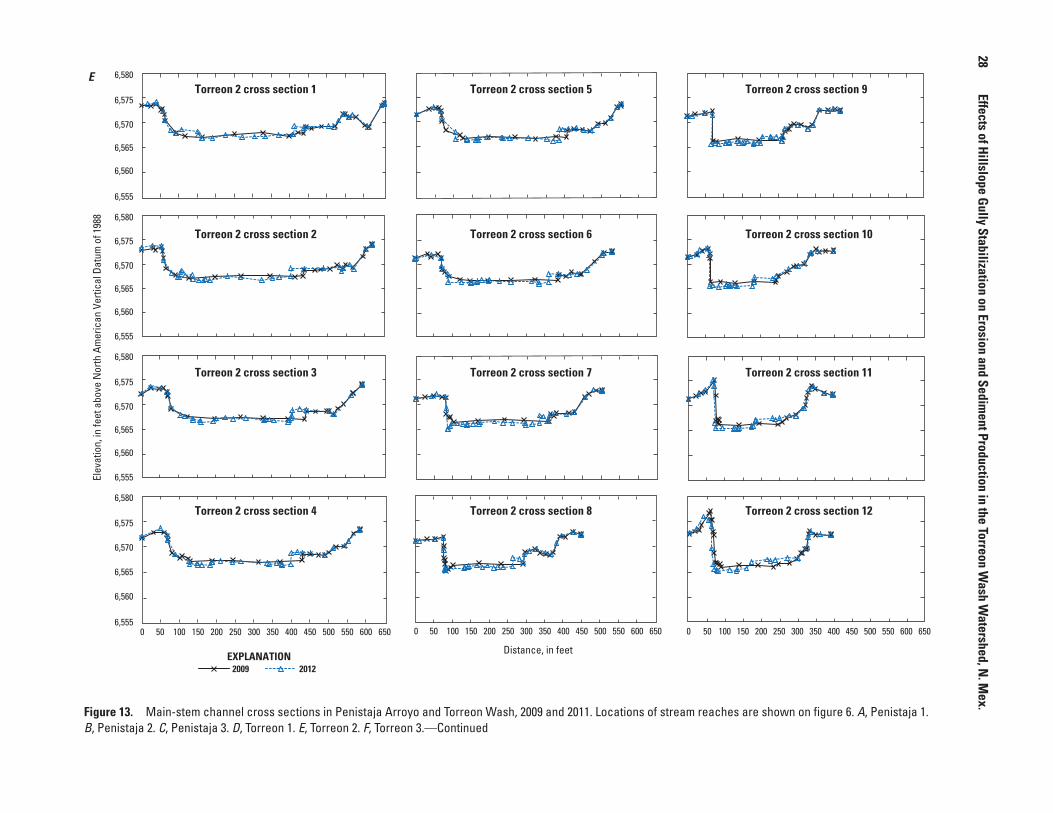
28
Effects of Hillslope Gully Stabilization on Erosion and Sediment Production in the Torreon W
ash Watershed, N
. Mex.
Distance, in feet
0 50 100 150 200 250 300 350 400 450 500 550 600 650 0 50 100 150 200 250 300 350 400 450 500 550 600 650 0 50 100 150 200 250 300 350 400 450 500 550 600 650
6,555
6,560
6,565
6,570
6,575
6,580
6,555
6,560
6,565
6,570
6,575
6,580
6,555
6,560
6,565
6,570
6,575
6,580
6,555
6,560
6,565
6,570
6,575
6,580
Elev
atio
n, in
feet
abo
ve N
orth
Am
eric
an V
ertic
al D
atum
of 1
988
Torreon 2 cross section 1 Torreon 2 cross section 5 Torreon 2 cross section 9
Torreon 2 cross section 2 Torreon 2 cross section 6 Torreon 2 cross section 10
Torreon 2 cross section 3 Torreon 2 cross section 7 Torreon 2 cross section 11
Torreon 2 cross section 4 Torreon 2 cross section 8 Torreon 2 cross section 12
2009 2012EXPLANATION
E
Figure 13. Main-stem channel cross sections in Penistaja Arroyo and Torreon Wash, 2009 and 2011. Locations of stream reaches are shown on figure 6. A, Penistaja 1. B, Penistaja 2. C, Penistaja 3. D, Torreon 1. E, Torreon 2. F, Torreon 3.—Continued
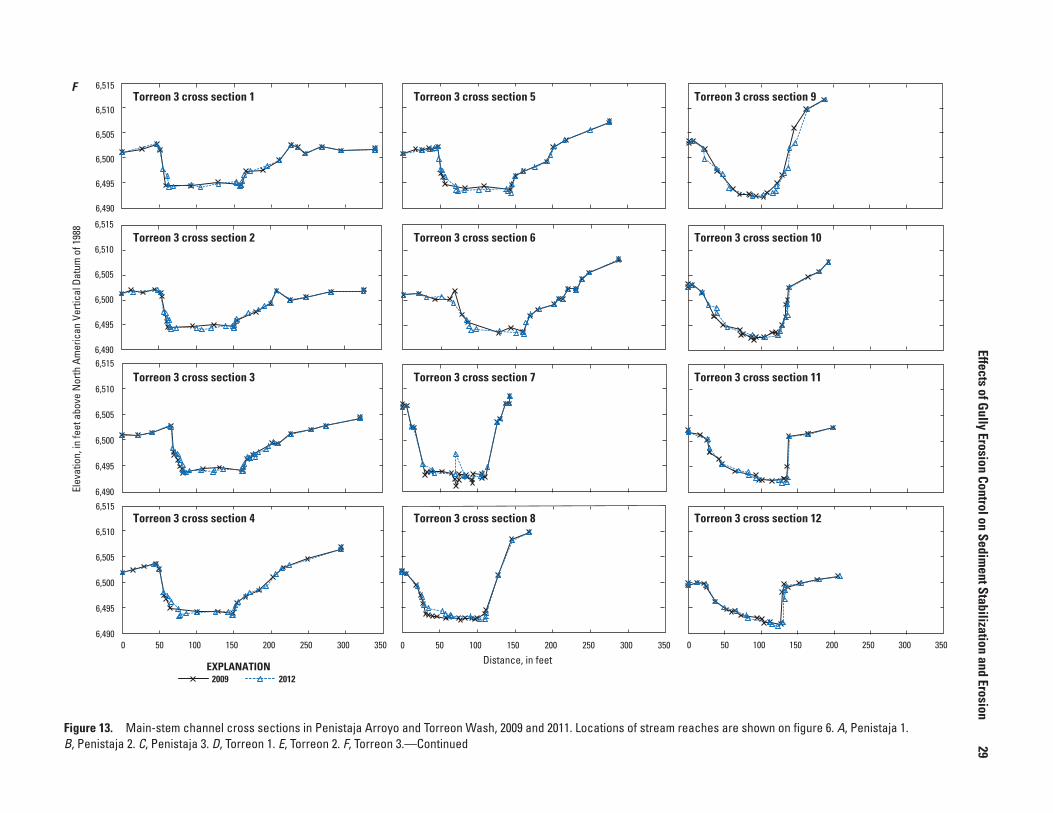
Effects of Gully Erosion Control on Sediment Stabilization and Erosion
29
Distance, in feet0 50 100 150 200 250 300 350 0 50 100 150 200 250 300 350 0 50 100 150 200 250 300 350
Elev
atio
n, in
feet
abo
ve N
orth
Am
eric
an V
ertic
al D
atum
of 1
988
6,490
6,495
6,500
6,505
6,510
6,515
6,490
6,495
6,500
6,505
6,510
6,515
6,490
6,495
6,500
6,505
6,510
6,515
6,490
6,495
6,500
6,505
6,510
6,515
Torreon 3 cross section 1 Torreon 3 cross section 5 Torreon 3 cross section 9
Torreon 3 cross section 2 Torreon 3 cross section 6 Torreon 3 cross section 10
Torreon 3 cross section 3 Torreon 3 cross section 7 Torreon 3 cross section 11
Torreon 3 cross section 4 Torreon 3 cross section 8 Torreon 3 cross section 12
2009 2012EXPLANATION
F
Figure 13. Main-stem channel cross sections in Penistaja Arroyo and Torreon Wash, 2009 and 2011. Locations of stream reaches are shown on figure 6. A, Penistaja 1. B, Penistaja 2. C, Penistaja 3. D, Torreon 1. E, Torreon 2. F, Torreon 3.—Continued
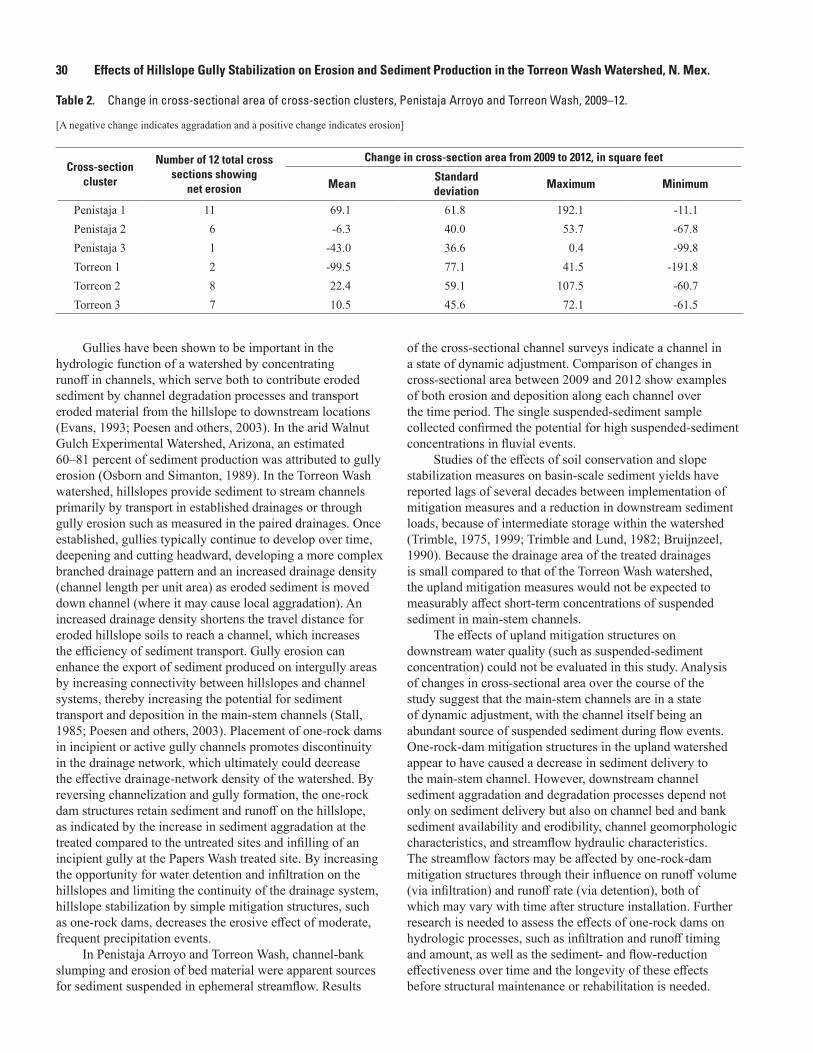
30 Effects of Hillslope Gully Stabilization on Erosion and Sediment Production in the Torreon Wash Watershed, N. Mex.
Table 2. Change in cross-sectional area of cross-section clusters, Penistaja Arroyo and Torreon Wash, 2009–12.
[A negative change indicates aggradation and a positive change indicates erosion]
Cross-section cluster
Number of 12 total cross sections showing
net erosion
Change in cross-section area from 2009 to 2012, in square feet
MeanStandard deviation
Maximum Minimum
Penistaja 1 11 69.1 61.8 192.1 -11.1Penistaja 2 6 -6.3 40.0 53.7 -67.8Penistaja 3 1 -43.0 36.6 0.4 -99.8Torreon 1 2 -99.5 77.1 41.5 -191.8Torreon 2 8 22.4 59.1 107.5 -60.7Torreon 3 7 10.5 45.6 72.1 -61.5
Gullies have been shown to be important in the hydrologic function of a watershed by concentrating runoff in channels, which serve both to contribute eroded sediment by channel degradation processes and transport eroded material from the hillslope to downstream locations (Evans, 1993; Poesen and others, 2003). In the arid Walnut Gulch Experimental Watershed, Arizona, an estimated 60–81 percent of sediment production was attributed to gully erosion (Osborn and Simanton, 1989). In the Torreon Wash watershed, hillslopes provide sediment to stream channels primarily by transport in established drainages or through gully erosion such as measured in the paired drainages. Once established, gullies typically continue to develop over time, deepening and cutting headward, developing a more complex branched drainage pattern and an increased drainage density (channel length per unit area) as eroded sediment is moved down channel (where it may cause local aggradation). An increased drainage density shortens the travel distance for eroded hillslope soils to reach a channel, which increases the efficiency of sediment transport. Gully erosion can enhance the export of sediment produced on intergully areas by increasing connectivity between hillslopes and channel systems, thereby increasing the potential for sediment transport and deposition in the main-stem channels (Stall, 1985; Poesen and others, 2003). Placement of one-rock dams in incipient or active gully channels promotes discontinuity in the drainage network, which ultimately could decrease the effective drainage-network density of the watershed. By reversing channelization and gully formation, the one-rock dam structures retain sediment and runoff on the hillslope, as indicated by the increase in sediment aggradation at the treated compared to the untreated sites and infilling of an incipient gully at the Papers Wash treated site. By increasing the opportunity for water detention and infiltration on the hillslopes and limiting the continuity of the drainage system, hillslope stabilization by simple mitigation structures, such as one-rock dams, decreases the erosive effect of moderate, frequent precipitation events.
In Penistaja Arroyo and Torreon Wash, channel-bank slumping and erosion of bed material were apparent sources for sediment suspended in ephemeral streamflow. Results
of the cross-sectional channel surveys indicate a channel in a state of dynamic adjustment. Comparison of changes in cross-sectional area between 2009 and 2012 show examples of both erosion and deposition along each channel over the time period. The single suspended-sediment sample collected confirmed the potential for high suspended-sediment concentrations in fluvial events.
Studies of the effects of soil conservation and slope stabilization measures on basin-scale sediment yields have reported lags of several decades between implementation of mitigation measures and a reduction in downstream sediment loads, because of intermediate storage within the watershed (Trimble, 1975, 1999; Trimble and Lund, 1982; Bruijnzeel, 1990). Because the drainage area of the treated drainages is small compared to that of the Torreon Wash watershed, the upland mitigation measures would not be expected to measurably affect short-term concentrations of suspended sediment in main-stem channels.
The effects of upland mitigation structures on downstream water quality (such as suspended-sediment concentration) could not be evaluated in this study. Analysis of changes in cross-sectional area over the course of the study suggest that the main-stem channels are in a state of dynamic adjustment, with the channel itself being an abundant source of suspended sediment during flow events. One-rock-dam mitigation structures in the upland watershed appear to have caused a decrease in sediment delivery to the main-stem channel. However, downstream channel sediment aggradation and degradation processes depend not only on sediment delivery but also on channel bed and bank sediment availability and erodibility, channel geomorphologic characteristics, and streamflow hydraulic characteristics. The streamflow factors may be affected by one-rock-dam mitigation structures through their influence on runoff volume (via infiltration) and runoff rate (via detention), both of which may vary with time after structure installation. Further research is needed to assess the effects of one-rock dams on hydrologic processes, such as infiltration and runoff timing and amount, as well as the sediment- and flow-reduction effectiveness over time and the longevity of these effects before structural maintenance or rehabilitation is needed.
Summary 31
SummaryThe Rio Puerco is the primary source of sediment to
the Rio Grande in New Mexico. A water-quality assessment of the upper Rio Puerco listed selected reaches of the river as impaired because of excessive sedimentation or siltation. More than 88 percent of New Mexico streams are ephemeral or intermittent, making the assessment of ephemeral and intermittent streams an essential component of the evaluation of water quality and watershed health in New Mexico. The condition of the upland watershed area is integral to hydrologic function and watershed health.
In 2000, the eastern Navajo Nation Chapters began a program of watershed improvement in upland portions of the Torreon Wash watershed, in the upper Rio Puerco watershed of New Mexico. The mitigation program installed shallow, loose-stone check dams, generically termed “one-rock dams,” to stabilize channel erosion at established gully locations or to prevent channel erosion at potential gully locations. In 2009, the U.S. Geological Survey, in cooperation with the Rio Puerco Alliance, initiated a study to evaluate the effectiveness of these upland mitigation methods and their potential utility in improving watershed health and decreasing sediment export to the lower ephemeral stream channels. Sediment erosion and deposition in two sets of paired (treated and untreated) upland drainages were examined over a 3 1/2-year period from spring 2009 through fall 2012. Downstream changes in the channel cross section in the main-stem Penistaja Arroyo and Torreon Wash were also examined.
By the end of the study period, one-rock dams at the Papers Wash drainage treated site were wholly or nearly buried in the channel area, and the channel itself was largely infilled. At the Penistaja Arroyo drainage treated site, some channel infilling also occurred but was not as pronounced as at the Papers Wash treated site, and grasses seeded beneath the one-rock dams at construction were well-established. The lack of recorded flow at both sites, along with sediment deposition and channel infilling, implies that sediment movement in the upland portions of the drainage is by overland runoff or bedload transport and is not dependent on suspended-sediment channel transport. Channel infilling also indicates the effectiveness of the one-rock dams in reversing incipient gully formation and forming a more stable unchanneled hillslope. A single suspended-sediment sample was collected in Penistaja Arroyo on June 23, 2011, having a concentration of 196,000 milligrams per liter. The high suspended-sediment concentration of flow in Penistaja Arroyo is typical of flows in the Rio Puerco and reflects abundant, easily mobilized sediment sources on the hillslope and in the channel.
For each drainage pair, aggradation in the active areas close to the channel was greater over the 3 1/2-year study period in the treated compared to the untreated drainage. For both of the paired drainages, the treated sites as a whole
aggraded more over the 3 1/2-year period than the paired untreated sites. Erosion of the near-channel zone was the dominant geomorphic process only at the untreated Penistaja Arroyo site (ratio of aggraded to eroded area or volume < 1.0), whereas aggradation in the near-channel zone was the dominant process at the other three sites (ratios > 1.0). Area-normalized data indicate that the treated site in Penistaja Arroyo had 51 percent greater area aggraded and 67 percent greater volume aggraded per area analyzed compared to the untreated site over the 3 1/2-year study period. Although both Papers Wash sites showed net aggradation, the trends were similar to the Penistaja Arroyo sites, with the treated site having 29 percent greater area aggraded and 60 percent greater volume aggraded per area analyzed compared to the untreated site over the 3 1/2-year study period. In the untreated Penistaja Arroyo drainage site, the calculated minimum erosion rate was 0.0055 inches per year (in/yr; 0.14 millimeters per year [mm/yr]), which is similar to historical regional hillslope erosion rates. Aggradation rates for the three sites where aggradation was the dominant geomorphic process were calculated at 0.0063 in/yr (0.16 mm/yr) for the Penistaja Arroyo treated drainage, 0.012 in/yr (0.31 mm/yr) for the Papers Wash untreated drainage, and 0.988 in/yr (2.51 mm/yr) for the Papers Wash treated drainage.
Analysis of the clustered cross sections on the main-stem reaches of Penistaja Arroyo and Torreon Wash do not support a broad picture of arroyo downcutting or aggradation but rather suggest dynamically adjusting channel cross sections. Longitudinal channel change along the Penistaja Arroyo and Torreon Wash channels indicates a general downstream pattern of a reach of net erosion, followed by a reach of net aggradation, followed by a reach of net erosion. This pattern of sediment erosion and deposition may indicate a pulse of sediment moving through the three middle cross sections (Penistaja 2, Penistaja 3, and Torreon 1).
In Penistaja Arroyo and Torreon Wash, channel-bank slumping and erosion of bed material were apparent sources for sediment suspended in ephemeral streamflow. Studies of the effects of soil conservation and slope stabilization measures on basin-scale sediment yields in previous studies have reported lags of several decades between implementation of mitigation measures and a reduction in downstream sediment loads, because of intermediate storage within the watershed. Because the drainage area of the treated drainages is small compared to that of the Torreon Wash watershed, the upland mitigation measures would not be expected to measurably affect short-term concentrations of suspended sediment in main-stem channels.
One-rock-dam mitigation structures in the upland watershed appear to have resulted in a decrease in sediment delivery to the main-stem channel. One-rock-dam mitigation structures may affect streamflow through their influence on runoff volume (via infiltration) and runoff rate (via detention), both of which may vary with time after structure installation.
32 Effects of Hillslope Gully Stabilization on Erosion and Sediment Production in the Torreon Wash Watershed, N. Mex.
References Cited
Aguilar, R., and Aldon, E.F., 1991, Runoff and sediment rates on San Mateo and Querencia soils, Rio Puerco Watershed Management Area, NM: U.S. Department of Agriculture Forest Service Rocky Mountain Forest and Range Experiment Station Research Note RM–506, 7 p.
Amin, I.E., and Jacobs, A.M., 2007, Accounting for sediment sources and sinks in the linear regression analysis of the suspended sediment load of streams—The Rio Puerco, New Mexico, as an example: Environmental Sciences, v. 14, no. 1, p. 1–4.
Anderson, O.J., Jones, G.E., and Green, G.N., 1997, Geologic map of New Mexico: U.S. Geological Survey Open-File Report OF–97–52.
Antevs, E., 1952, Arroyo cutting and filling: Journal of Geology, v. 60, p. 375–385.
Antevs, E., 1954, Climate of New Mexico during the last glacio-pluvial: Journal of Geology, v. 62, p. 182–191.
Arvidson, J., and Coleman, M., 2003, EPA awards $700,000 to work in the Rio Puerco watershed, in Clearing the waters: Santa Fe, N. Mex., New Mexico Environment Department, v. 8, no. 2, p. 1–2, accessed December 28, 2016, at https://www.env.nm.gov/swqb/documents/swqbdocs/WPS/CTW/ClearingTheWaters-Summer2003.pdf.
Bailey, R.W., 1935, Epicycles of erosion in the valleys of the Colorado Plateau province: Journal of Geology, v. 43, p. 337–355.
Balling, R.C., and Wells, S.G., 1990, Historical rainfall patterns and arroyo activity within the Zuni River drainage basin, New Mexico: Annals of the Association of American Geographers, v. 80, p. 603–617. [Also available online at http://dx.doi.org/10.1111/j.1467-8306.1990.tb00320.x.]
Bonnin, G.M., Martin, D., Lin, B., Parzybok, T., Yekta, M., and Riley, D., 2011, Precipitation-frequency atlas of the United States: Silver Spring, Md., National Oceanic and Atmospheric Administration, National Weather Service, NOAA Atlas 14, v. 1, version 5.0, accessed December 28, 2016, at http://hdsc.nws.noaa.gov/hdsc/pfds/.
Bruijnzeel, L.A., 1990, Hydrology of moist tropical forests and effects of conversion—A state of knowledge review: UNESCO International Hydrological Programme, 224 p. [Also available at http://unesdoc.unesco.org/images/0009/000974/097405eo.pdf.]
Bryan, K., 1925, Date of channel trenching (arroyo cutting) in the arid Southwest: Science, v. 62, p. 338–344.
Bryan, K., 1928, Historic evidence on changes in the channel of Rio Puerco, a tributary of the Rio Grande in New Mexico: Journal of Geology, v. 36, p. 265–282.
Bryan, K., 1940, Erosion in the valleys of the Southwest: New Mexico Quarterly, v. 10, p. 227–232.
Clapp, E.M., Bierman, P.R., Pavich, M., Nichols, K.K., and Caffee, M.L., 2001, Rates of sediment supply to arroyos from upland erosion determined using in-situ-produced cosmogenic 10Be and 26Al: Quaternary Research, v. 55, p. 235–245. [Also available at http://dx.doi.org/10.1006/qres.2000.2211.]
Clausen, J.C., 1993, Paired watershed study design: Washington, D.C., U.S. Environmental Protection Agency Office of Water, EPA 841–F–93–009, accessed August 22, 2013, at http://www.in.gov/idem/nps/files/iwpg_paired_watersheds.pdf.
Cooke, R.U., and Reeves, R.W., 1976, Arroyos and environmental change in the American Southwest: Oxford, Clarendon Press, Oxford Research Studies in Geography.
Daggupati, P., Douglas-Mankin, K.R., and Sheshukov, A.Y., 2013, Predicting ephemeral gully location and length using topographic index models. Transactions of the American Society of Agricultural and Biological Engineers (ASABE), v. 56, no. 4, p. 1427–1440.
Daggupati, P., Sheshukov, A.Y., and Douglas-Mankin, K.R., 2014, Evaluating ephemeral gullies with a process-based topographic index model: Catena, v. 113, p. 177–186.
Douglas-Mankin, K., Daggupati, P., Sheshukov, A., Barnes, P., Devlin, D., and Nelson, N., 2011, Cheney Lake watershed—Erosion from ephemeral gullies: Manhattan, Kans., Kansas State Research and Extension Publication no. MF-3030.
Downes, B.J., Barmuta, L.A., Fairweather, P.G., Faith, D.P., Keough, M.J., Lake, P.S., Mapstone, B.D., and Quinn, G.P., 2002, Monitoring ecological impacts—Concepts and practice in flowing water: New York, Cambridge University Press.
Edwards, T.K., and Glysson, G.D., 1999, Field methods for measurement of fluvial sediment: U.S. Geological Survey Techniques of Water-Resources Investigations 03–C2, 89 p. [Also available at http://pubs.usgs.gov/twri/twri3-c2/pdf/TWRI_3-C2.pdf.]
Elliott, J.G., Gellis, A.C., and Aby, S.B., 1999, Evolution of arroyos—Incised channels of the southwestern United States, in Darby, S.E., and Simon, Andrew, eds., Incised river channels: processes, forms, engineering, and management: Chichester, J. Wiley and Sons, Ltd., p. 153–185.
References Cited 33
Evans, R., 1993, On assessing accelerated erosion of arable land by water: Soils and Fertilizers, v. 56, no. 11, p. 1285–1293.
Federal Inter-Agency Sedimentation Project, 1961, The single stage sampler for suspended sediment: Federal Inter-Agency Sedimentation Project, Subcommittee on Sedimentation Report 13, 105 p.
Friedman, J.M., Vincent, K.R., and Shafroth, P.B., 2005, Dating floodplain sediments using tree-ring response to burial: Earth Surface Processes and Landforms, v. 30, p. 1077–1091.
Gellis, Allen, 1991, Decreasing trends of suspended sediment concentrations at selected streamflow stations in New Mexico, in Proceedings of the 36th Annual New Mexico Water Conference: Las Cruces, N. Mex., New Mexico Water Resources Research Institute Report no. 265, p. 77–93.
Gellis, A.C., Pavich, M.J., Bierman, P., Ellwein, A., Aby, S., and Clapp, E., 2004, Modern sediment yield compared to geologic rates of sediment generation in a semiarid basin, New Mexico—Assessing the human impact: Earth Surface Processes and Landforms, v. 29, p. 1359–1372. [Also available at http://dx.doi.org/10.1002/esp.1098.]
Gellis, A.C., Pavich, M.J., Ellwein, A.L., Aby, S., Clark, I., Wieczorek, M.E., and Viger, R., 2012, Erosion, storage, and transport of sediment in two subbasins of the Rio Puerco, New Mexico: Geological Society of America Bulletin, v. 124, no. 5/6, p. 817–841.
Geyik, M.P., 1986, FAO watershed management field manual—Gully control: Rome, FAO Conservation Guide 13/2, Food and Agriculture Organization of the United Nations.
Graf, W.L., 1986, Fluvial erosion and Federal public policy in the Navajo Nation: Physical Geography 7, p. 97–115.
Griffin, E.R., Kean, J.W., Vincent, K.R., Smith, J.D., and Friedman, J.M., 2005, Modeling effects of bank friction and woody bank vegetation on channel flow and boundary shear stress in the Rio Puerco, New Mexico: Journal of Geophysical Research, v. 110, F04023. [Also available at http://dx.doi.org/10.1029/2005JF000322.]
Guy, H.P., 1969, Laboratory theory and methods for sediment analysis: U.S. Geological Survey Techniques of Water-Resources Investigations, book 5, chap. C, 58 p.
Huckleberry, G., and Duff, A., 2008, Alluvial cycles, climate, and Puebloan settlement shifts near Zuni Salt Lake, New Mexico, USA: Geoarchaeology, v. 23, no. 1, p. 107–130. [Also available at http://dx.doi.org/10.1002/gea.20204.]
Hall, S.A., 1977, Late quaternary sedimentation and paleoecologic history of Chaco Canyon, New Mexico: Geological Society of America Bulletin, v. 88, p. 1593–1618.
Kraebel, C.J., and Pillsbury, A.F., 1934, Handbook of erosion control in mountain meadows: Berkeley, Calif., U.S. Department of Agriculture, Forest Service, 69 p., accessed December 28, 2016, at https://www.nrcs.usda.gov/Internet/FSE_DOCUMENTS/nrcs144p2_053967.pdf.
Leopold, L.B., 1951, Rainfall intensity—An aspect of climatic variation: AGU Transactions, v. 32, p. 347–357.
Leopold, L.B., Emmett, W.W., and Myrick, R.M., 1966, Channel and hillslope processes in a semiarid area, New Mexico: U.S. Geological Survey Professional Paper 352–G, 243 p. [Also available at http://pubs.er.usgs.gov/publication/pp352G.]
Leopold, L.B., and Snyder, C.T., 1951, Alluvial fills near Gallup, New Mexico: U.S. Geological Survey Water-Supply Paper 1110–A, 19 p. [Also available at http://pubs.usgs.gov/wsp/1110a/report.pdf.]
Levick, L.R., Goodrich, D.C., Hernandez, Mariano, Fonseca, Julia, Semmens, D.J., Stromberg, Juliet, Tluczek, Melanie, Leidy, R.A., Scianni, Melissa, Guretin, D.P., and Kepner, W.G., 2008, The ecological and hydrological significance of ephemeral and intermittent streams in the arid and semi-arid American Southwest: U.S. Environmental Protection Agency and USDA/ARS Southwest Watershed Research Center, EPA/600/R–08/134, ARS/233046, 116 p. [Also available at https://nepis.epa.gov/Exe/ZyPDF.cgi/P100E5HB.PDF?Dockey=P100E5HB.PDF.]
Levick, L.R., Reed, M., vanderLeeuw, E., Guertin, D.P., and Uhlman, K., 2006, NEMO watershed based plan Agua Fria Watershed: Tucson, Ariz., University of Arizona, variously paged. [Also available at http://www.azdeq.gov/environ/water/watershed/download/nemo-agua_fria-wp.pdf.]
Love, D.W., 1986, A geological perspective of sediment storage and delivery along the Rio Puerco, central New Mexico in Hadley, R.F., ed., Drainage basin sediment delivery: IAHS Publication no. 159, p. 305–322.
Love, D.W., 1997, Historic incision of the middle Rio Puerco of the East—Implications for models of arroyo entrenchment and distribution of archaeological sites, in Duran, M.S., and Kirkpatrick, D.T., eds., Layers of time, papers in honor of Robert H. Weber: Archaeological Society of New Mexico, v. 23, p. 69–84.
Matherne, A.M., Tillery A.C., Douglas-Mankin, K.R., and Soles, Ellen, 2018, Effects of hillslope gully stabilization on erosion and sediment production in the Torreon Wash watershed, New Mexico, 2009–12 – associated data: U.S. Geological Survey data release, https://doi.org/10.5066/F7Q52NK3.
34 Effects of Hillslope Gully Stabilization on Erosion and Sediment Production in the Torreon Wash Watershed, N. Mex.
Molnár, Peter, and Ramírez, A.R., 2001, Recent trends in precipitation and streamflow in the Rio Puerco Basin: American Meteorological Society, v. 14, p. 2317–2328.
National Climatic Data Center, 2013, Climate data online: National Oceanic and Atmospheric Administration National Climatic Data Center, accessed July 24, 2013, at http://www.ncdc.noaa.gov/cdo-web/.
Natural Resources Conservation Service, 2013a, Soil data mart, Cabezon area, New Mexico: U.S. Department of Agriculture, accessed August 22, 2013, at http://soildatamart.nrcs.usda.gov/Survey.aspx?State=NM.
Natural Resources Conservation Service, 2013b, Soil data mart, McKinley County area, New Mexico, McKinley County and parts of Cibola and San Juan Counties: U.S. Department of Agriculture, accessed August 22, 2013, at http://soildatamart.nrcs.usda.gov/Survey.aspx?State=NM.
Natural Resources Conservation Service, 2017, Geospatial data gateway: U.S. Department of Agriculture Natural Resources Conservation Service website, accessed July 31, 2017, at https://datagateway.nrcs.usda.gov/.
Nordin, C.F., 1963, A preliminary study of sediment transport parameters Rio Puerco near Bernardo, New Mexico: Sediment transport in alluvial channels: U.S. Geological Survey Professional Paper 462–C, 21 p. [Also available at http://pubs.usgs.gov/pp/0462c/report.pdf.]
Osborn, H.B., and Simanton, J.R., 1989, Gullies and sediment yield: Rangelands, v. 11, no. 2, p. 51–56.
Phippen, S.J., and Wohl, E., 2003, An assessment of land use and other factors affecting sediment loads in the Rio Puerco watershed, Rio Puerco: Geomorphology, v. 52, p. 269–287.
Poesen, J., 1993, Gully typology and gully control measures in the European loess belt, in Wicherek, S., ed., Farm land erosion in temperate plains environment and hills: Amsterdam, Elsevier, p. 221– 239.
Poesen, J., Nachtergaele, J., Verstraeten, G., and Valentin, C., 2003, Gully erosion and environmental change—Importance and research needs: Catena, v. 50, p. 91–133.
Popp, C.J., Hawley, J.W., Love, D.W., and Dehn, Michael, 1988, Use of radiometric (Cs-137, Pb-210), geomorphic, and stratigraphic techniques to date recent oxbow sediments in the Rio Puerco drainage Grants uranium region, New Mexico: Environmental Geology and Water Sciences, v. 11, no. 3, p. 253–269.
Rich, J.L., 1911, Recent stream trenching in the semi-arid portion of southwestern New Mexico, a result of removal of vegetation cover: American Journal of Science, v. 32, p. 237–245.
Sauer, V.B., and Turnipseed, D.P., 2010, Stage measurement at gaging stations: U.S. Geological Survey Techniques and Methods, book 3, chap. A7, 45 p. [Also available at http://pubs.usgs.gov/tm/tm3-a7/.]
Scholl, D.G., and Aldon, E.F., 1988, Runoff and sediment yield from two semiarid sites in New Mexico’s Rio Puerco Watershed: U.S. Department of Agriculture Forest Service Rocky Mountain Forest and Range Experiment Station Research Note RM–488, 4 p.
Schultz, K.M., 2008, Modeling road erosion in the upper Torreon Wash, New Mexico: Albuquerque, N. Mex., The University of New Mexico, Water Resources Program, Water Resources Professional Project Report, 43 p.
Schultz, K.M., 2011, Modeling road erosion in the upper Torreon Wash, New Mexico: Washington, D.C., Transportation Research Board of the National Academies, Transportation Research Record—Journal of the Transportation Research Board, no. 2203, p. 27–35. [Also available at http://dx.doi.org/10.3141/2203-04.]
Schumm, S.A., and Hadley, R.F., 1957, Arroyos and the semiarid cycle of erosion: American Journal of Science, v. 25, p. 161–174.
Stall, J.B., 1985, Upland erosion and downstream sediment delivery, in El-Swaify, S.A., Moldenhauer, W.C., and Lo, A., eds., Soil erosion and conservation: Ankeny, Iowa, Soil Conservation Society of America, p. 200–205.
Surface Water Quality Bureau, 2001, Watershed Restoration Action Strategy (WRAS) for the Rio Puerco watershed of New Mexico: Santa Fe, N. Mex., New Mexico Environment Department, 20 p., accessed December 28, 2016, at https://www.env.nm.gov/swqb/documents/swqbdocs/WPS/WRAS/RioPuercoWRAS-May2001.pdf.
Surface Water Quality Bureau, 2006, WQCC approved total maximum daily load (TMDL) for the Rio Puerco watershed—Part 1: Santa Fe, N. Mex., New Mexico Environment Department, 76 p., accessed August 28, 2012, at http://www.epa.gov/waters/tmdldocs/32770_RioPuercoTMDL.pdf.
Thornwaite, C.W., Sharpe, C.F.S., and Dosch, E.F., 1942, Climate and accelerated erosion in the arid and semiarid southwest, with special reference to the Polacca Wash drainage basin, Arizona: U.S. Department of Agriculture Technical Bulletin 808, 134 p.
Trimble, S.W., 1975, Denudation studies: Can we assume stream steady state?: Science, v. 188, p. 1207–1208.
Trimble, S.W., 1999, Decreased rates of alluvial sediment storage in the Coon Creek Basin, Wisconsin, 1975–1993: Science, v. 285, p. 1244–1246.
References Cited 35
Trimble, S.W., and Lund, S.W., 1982, Soil conservation and the reduction of erosion and sedimentation in the Coon Creek Basin, Wisconsin: U.S. Geological Survey Professional Paper 1234, 35 p. [Also available at http://pubs.er.usgs.gov/publication/pp1234.]
Trimble Navigation Limited, 2004, Terramodel release notes—Version 10.4: Dayton, Ohio, Trimble Navigation Limited, 10 p., accessed at http://trl.trimble.com/docushare/dsweb/Get/Document-319067/Terramodel%2010.40%20Release%20Notes.pdf.
Tuan, Y., 1966, New Mexican gullies—A critical review and some recent observations: Annals of the Association of American Geographers, v. 56, p. 573–597.
Vincent, K.R., Friedman, J.M., and Griffin, E.R., 2009, Erosional consequence of salt cedar control: Environmental Management, v. 44, p. 218–227. [Also available at http://dx.doi.org/10.1007/s00267-009-9314-8.]
U.S. Congress, 2002, Federal Water Pollution Control Act—As amended through Public Law 107-303: U.S. Congress, 234 p., accessed August 2013 at https://www.epw.senate.gov/water.pdf.
Waltemeyer, S.D., 2005, Automated crest-stage gage application in ephemeral streams in New Mexico: U.S. Geological Survey Fact Sheet 2005–3136, 4 p. [Also available at http://pubs.usgs.gov/fs/2005/3136/pdf/fs2005-3136.pdf.]
Western Regional Climate Center, [2013], Cooperative climatological data summaries: Western Regional Climate Center website, accessed May 30, 2013, at https://wrcc.dri.edu/Climate/west_coop_summaries.php.
Zeedyk, Bill, 2006, A good road lies easy on the land—Water harvesting from low-standard rural roads: The Quivira Coalition; Zeedyk Ecological Consulting, LLC; The Rio Puerco Management Committee–Watershed Initiative; and the New Mexico Environment Department–Surface Water Quality Bureau, 46 p. [Also available at http://quiviracoalition.org/images/pdfs/1888-A_Good_Road_Lies_Easy_on_the_Land.pdf.]
Zeedyk, Bill, and Jansens, Jan-Willem, 2009, An introduction to erosion control (3d ed.): Joint Publication from Earth Works Institute, The Quivira Coalition and Zeedyk Ecological Consulting, 28 p.


For more information about this publication, contactDirector, New Mexico Water Science Center6700 Edith Blvd. NE Albuquerque, NM 87113
For additional information visit https://nm.water.usgs.gov/
Publishing support provided byLafayette Publishing Service Center
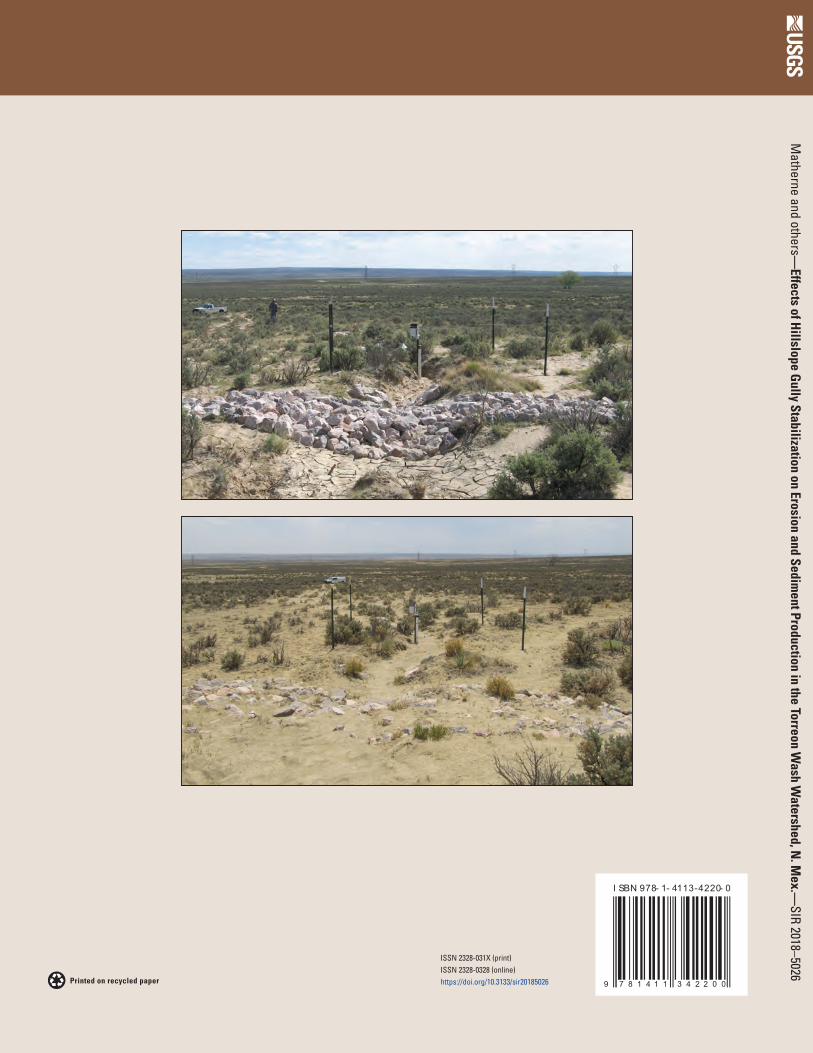
Matherne and others—
Effects of Hillslope G
ully Stabilization on Erosion and Sediment Production in the Torreon W
ash Watershed, N
. Mex.—
SIR 2018–5026
ISSN 2328-031X (print)ISSN 2328-0328 (online)https://doi.org/10.3133/sir20185026
I SBN 978- 1- 4113-4220- 0
9 7 8 1 4 1 1 3 4 2 2 0 0