economic and environmental impacts of energy efficiency
TRANSCRIPT

Economic and Environmental Impacts of Energy
Efficiency Measures in
Public Buildings in Kazakhstan
By
Assel Baishulakova
Submitted to
Central European University
Department of Environmental Science and Policy
In partial fulfillment of the requirements for the degree of Master of Environmental Science
and Policy
Supervisor: Prof. Dr. Aleh Cherp
External supervisors: Dr. Aleksandra Novikova, Marina Olshanskaya
Budapest, Hungary
2020
CE
UeT
DC
olle
ctio
n

i
Copyright notice
Notes on copyright and the ownership of intellectual property rights:
Copyright in the text of this thesis rests with the Author. Copies (by any process) either in full
or of extracts may be made only in accordance with instructions given by the Author and lodged
in the Central European University Library. Details may be obtained from the Librarian. This
page must form part of any such copies made. Further copies (by any process) of copies made
in accordance with such instructions may not be made without the permission (in writing) of
the Author.
The ownership of any intellectual property rights which may be described in this thesis is vested
in the Central European University, subject to any prior agreement to the contrary, and may
not be made available for use by third parties without the written permission of the University,
which will prescribe the terms and conditions of any such agreement.
For bibliographic and reference purposes, this thesis should be referred to as:
Baishulakova. A. 2020. Economic and Environmental Impacts of Energy Efficiency Measures
in Public Buildings in Kazakhstan. Master thesis, Department of Environmental Sciences and
Policy, Central European University, Budapest.
Further information on the conditions under which disclosures and exploitation may take place
is available from the Head of the Department of Environmental Sciences and Policy, Central
European University.
Photo credits to the Author if not otherwise stated.
CE
UeT
DC
olle
ctio
n

ii
Author’s declaration
No portion of the work referred to in this thesis has been submitted in support of an application
for another degree or qualification of this or any other university or other institutes of learning.
Assel Baishulakova
CE
UeT
DC
olle
ctio
n

iii
Abstract
ABSTRACT OF THE DISSERTATION submitted by Assel Baishulakova
For the degree of Master of Environmental Science and Policy and entitled: Economic and
Environmental Impacts of Energy Efficiency Measures in Public Buildings in Kazakhstan
Month and year of submission: 31st of July 2020
Improving energy efficiency is one of the most effective measures to reduce the environmental
impacts of energy use while at the same time growing economic performance. Energy
efficiency is especially relevant for Kazakhstan, a country with a high carbon footprint and one
of the highest uses of energy per unit of GDP in the world. The World Bank supports energy
efficiency measures in public buildings in Kazakhstan. However, the impact of these measures
on the energy use of public sector savings has not been systematically analyzed. This thesis
shows that the impact of energy efficiency measures highly varies from almost negligible to
very significant. The impact of energy efficiency measures on energy savings is often low
because prior to applying these measures, the buildings were under-heated, but after the retrofit,
the users increase heating to comfortable levels. The impacts of energy efficiency measures
depend primarily on the climate zone and how frequently the building is used (intermittent
heating). The impacts on simple payback of the energy efficiency measures depend on the final
energy savings, initial investment capital and tariffs for energy sources. Buildings in colder
climates, more frequently used, and using coal and diesel for heating provide the highest
economic payoffs to energy efficiency measures. Based on these findings, the thesis provides
recommendations for which buildings to prioritize for energy efficiency measures as well as
other policy and research actions.
Keywords: energy efficiency measures, climate zone, public buildings
CE
UeT
DC
olle
ctio
n

iv
Acknowledgments
I would like to thank my Master’s degree supervisor, Prof. Dr. Aleh Cherp, for guiding my
research, opening for me the exciting field to explore, helping me to frame my thesis writing,
and giving me an opportunity by presenting to the exciting and highly professional people.
I am endlessly thankful to Dr. Aleksandra Novikova and Marina Olshanskaya for inspiring,
sharing the interesting project, and guiding me professionally, being my mentors, and providing
me with the feedbacks throughout the journey of completing my thesis. Special gratitude to
Dr. Aleksandra Novikova for teaching me how to write and present my thoughts and giving
me support anytime I needed it. I am also thankful to Marina Olshanskaya for inviting me to
be part of this exciting project like “KEEP” and allowing me to take the project as a base of
my research data.
I am expressing my gratitude to the Department of Environmental Science and Policy for
giving me such an honor to study at CEU and the opportunity to discover the field I am
passionate about. I am thankful to Prof. Dr. Alan Watt, for contributing to our thesis structuring
and writing. Also, I would like to thank Krisztina Szabados and Tunde Veronika Szabolcs for
being always there for us, MESP students, and replying to our emails promptly.
Furthermore, I am very thankful to my parents Zhanat and Gulzhakhan, and my dear friends
from CEU, especially Rupal, Ananya, Tolganaya, Laura and Olzhas for giving me support
anytime I needed. I also thank all my MESP classmates for being the best classmates I could
ask for.
I would like to dedicate my work to my former supervisor from Nazarbayev University
Prof. Dr. Natalia Barteneva, who always supported me, provided me with an opportunity to
find my passion and encouraged to pursue Master of Science degree at CEU.
CE
UeT
DC
olle
ctio
n

v
Table of Content
Author’s declaration................................................................................................................... ii
Abstract .................................................................................................................................... iii
Acknowledgements ................................................................................................................... iv
Table of Content ........................................................................................................................ v
List of Figures .......................................................................................................................... vii
List of Tables ......................................................................................................................... viii
List of Abbreviations ................................................................................................................ ix
1 Introduction ........................................................................................................................ 1
1.1 Background ................................................................................................................. 1
1.2 Aims and Objectives ................................................................................................... 4
1.3 Kazakhstan Energy Efficiency Project ........................................................................ 5
1.4 Structure of the Thesis................................................................................................. 6
2 Literature Review............................................................................................................... 7
2.1 Energy Efficiency Drivers: the Paris Agreement, Energy scarcity, and Others ......... 7
2.2 Kazakhstan – an Energy-intensive Country .............................................................. 11
2.3 Energy Efficiency – the Key to Reducing Energy Intensity ..................................... 16
2.4 Energy Use in Buildings Worldwide ........................................................................ 20
2.5 Kazakhstan: Energy Use and Energy Efficiency in Buildings .................................. 23
2.6 Summary ................................................................................................................... 25
3 Analytical Framework, Methodology and Limitations .................................................... 26
CE
UeT
DC
olle
ctio
n

vi
3.1 Data Gathering and Data Analysis ............................................................................ 26
3.2 Formulation of the Hypotheses ................................................................................. 28
3.3 Interpretation and Use of the Results ........................................................................ 29
3.4 Limitations of the Study ............................................................................................ 30
4 Results .............................................................................................................................. 31
4.1 Factors Impacting Final Energy Savings .................................................................. 32
4.2 Factors Impacting Simple payback ........................................................................... 36
5 Discussion ........................................................................................................................ 42
5.1 Analysis of the Compared Variables ......................................................................... 42
5.2 Recommendations ..................................................................................................... 46
5.3 Recommendations on Future Steps ........................................................................... 48
6 Conclusion ....................................................................................................................... 51
7 Reference List .................................................................................................................. 53
8 Appendices ....................................................................................................................... 58
CE
UeT
DC
olle
ctio
n

vii
List of Figures
Figure 1. The general depletion of oil and gas demonstrated by the Campbell and Laherrerre 9
Figure 2. Energy use by sector: share of total final consumption ............................................ 11
Figure 4 Heat generation by source in Kazakhstan ................................................................. 15
Figure 5. Summary of a positive link between health, local economic development and learning
outcome in energy efficiency measures integrated schools ..................................................... 20
Figure 6. Direct and indirect CO2 emissions in the Sustainable Development Scenario, 2000-
2030.......................................................................................................................................... 21
Figure 7. Final energy consumption by buildings, 2000-2018 ................................................ 22
Figure 8. Dependence of simple payback on three examining energy-audit groups ............... 31
Figure 9. Dependence of final energy savings on weekend and night heating *no means
building was not using energy on weekends and night times .................................................. 33
Figure 10. Dependence of final energy savings on heating degree days ................................. 34
Figure 11. Dependence of final energy savings on building compactness .............................. 35
Figure 12. Dependence of final energy savings on energy carriers ......................................... 36
Figure 13. Dependence of simple payback on compactness .................................................... 37
Figure 14. Dependence of simple payback on weekend and night heating ............................. 38
Figure 15. Dependence of simple payback on heating degree days ........................................ 38
Figure 16. Dependence of simple payback on energy sources used for space heating ........... 39
Figure 17. SPB dependence on the level of capital investment ............................................... 40
Figure 18. Overall SPB outcome ............................................................................................ 41
Figure 19. Tariffs for heating services in Kazakhstan ............................................................. 44
CE
UeT
DC
olle
ctio
n

viii
List of Tables
Table 1. Carbon footprint of Kazakhstan compared to that of the European Union, 2014 ....... 3
Table 2. Consumption of electrical energy in various fields for 2011 in Kazakhstan ............. 13
Table 3. Review of the studies which assessed the potentials for the energy efficiency and GHG
mitigation in public buildings .................................................................................................. 17
Table 4. Thermal packages applied on building during retrofit............................................... 27
CE
UeT
DC
olle
ctio
n

ix
List of Abbreviations
ASPO – Association for the study of the Peak Oil and Gas
CHP – Combined Heat and Power plants (cogeneration)
CO2 – Carbon Dioxide
GHG – Greenhouse Gas
GDP – Gross Domestic Product
GWh – Giga Watt Hours = Million Kilo Watt Hours
HBVs – Hydraulic balancing valves
HDD – Heating degree days
FES – Final energy savings
GHG – Greenhouse gas
IPCC - Intergovernmental Panel on Climate Change
KEEP – Kazakhstan Energy Efficiency Project
KZT – Tenge, National currency of Kazakhstan
MAC – Marginal abatement curve
NDC - Nationally Determined Contributions
OECD - Organization for Economic Cooperation and Development
CE
UeT
DC
olle
ctio
n

x
SPB – Simple payback
SDG – Sustainable Developing Goals
TFC – Total Final Consumption
TRVs – Thermostatic radiator valves
UNFCCC – United Nations Framework Convention on Climate Change
CE
UeT
DC
olle
ctio
n

1
1 Introduction
According to the Brundtland Commission, sustainability defines as the term describing present
generation development without compensating the future generation's ability to meet their own
needs (United Nations 1987). In the context of energy, sustainability means sustainable
utilization of energy resources. Each sovereign country has the rights over its natural
properties; hence they have the duty not to deplete them and consume sustainably.
Sustainable Development Goals (SDGs) were adopted in 2015 by the United Nations to bring
peace and prosperity as well as end poverty across the world and protect the planet by the year
2030. Seventeen goals were created to ensure social, economic, and environmental balance.
Climate actions, affordable clean energy, good health and well-being, sustainable cities and
communities, responsible consumption as well as decent work and economic growth can be
united via action towards energy efficiency.
1.1 Background
Kazakhstan is a notable producer and exporter of coal (4% of the world's coal reserves), oil
(1.8% of the world’s oil reserves), and petroleum and natural gas. Electricity generation from
coal accounts for 75% of the total power generation, whereas the mining and petroleum
industry is responsible for 33% of the total Gross Domestic Product (GDP) (Karatayev and
Clarke 2014). Renewable energy also has a small and stable share in electricity generation.
Currently, coal is gradually replaced by natural gas.
Kazakhstan is one of the highest energy intensity countries in the world (0.37 tons of oil
equivalent (toe)/thousand 2010USD), which is 71% higher than that in the countries of the
Organization for Economic Cooperation and Development (OECD), and 41% higher than that
CE
UeT
DC
olle
ctio
n

2
of the world as a whole. Kazakhstan also has 50% higher greenhouse gas (GHG) emission per
capita than the countries of the European Union on average (Table 1).
The first law on energy savings was approved in Kazakhstan back in 1997, which was remained
on the level of declarative. For the past decades, energy efficiency became a policy priority for
the government, which was a preventative attempt to improve industrial competitiveness,
mitigate excess energy use, and the recent increase of domestic energy prices in certain regions.
A new law on energy savings and energy efficiency was adopted in 2012 and amended in 2015.
This was adopted in the country program named “Energy efficiency strategy 2020”.
Despite such differences, Kazakhstan has shown a full commitment to a green way of
development towards improving energy efficiency. In 2015, Kazakhstan ratified the Kyoto
Protocol to reduce GHG emissions by 15% by 2020 as compared to 1990. It later signed the
legally binding agreement during the Paris Conference in December 2015, agreeing that the
global temperature rises and aiming to ensure that it does not exceed 2°C above the pre-
industrial level (Ministry of Energy of the Republic of Kazakhstan 2015).
Kazakhstan agreed to reduce GHG emissions to 15-25% by 2030 as compared to the base year,
1990. According to the latest National Determined Contributions (NDC) submitted by
Kazakhstan, GHG reduction accounts for about 7% of what was in 1990. Under favorable
conditions, stable oil prices, and a constant increase in GDP, around 30% of GHG reduction
by 2030 is forecasted. In addition, Kazakhstan set a long-term goal for a transition to a green
economy by the year 2050, aiming to increase the GDP to 3% per year, reduce GHG emission
by 40%, increase the use of renewable energy stations, ensure gas-based power plants growth
by 30%, as well as diversify energy-intensive economy (Strategy2050.Kz Information Agency
2020; Akorda.Kz 2020)
CE
UeT
DC
olle
ctio
n

3
Kazakhstan submitted the first NDC before the COVID-19, and the oil prices dropped since
then. Hence ambitious forecasting regarding GHG reduction and green economy transition
shall be revised (ibid).
Table 1. The carbon footprint of Kazakhstan compared to that of the European Union, 2014
CO2 emissions of
Kazakhstan, million
tons
CO2 emissions per
capita of
Kazakhstan, tons
CO2 emissions of
per capita of the
European Union,
tons
Total 248.31 14.35 7.31
Of which diesel +
gasoline
32.34 1.87 3.02
Of which natural
gas
71.28 4.27 1.77
Of which coal 140.72 8.14 2.33
Other sources 3.98 0.23 0.19
Source: Ministry of Energy of the Republic of Kazakhstan with the support of the UNDP/GEF project
(2015).
Kazakhstan will gain from energy efficiency measures. There will be economic value by
decreasing electricity and heating bills, reducing GHG emissions, and contributing climate
change targets. Subsequently, there will be an opportunity for co-benefits to elevate the job
market in green services and technologies, contributing to health impact and social impact by
shaping human perspectives towards conservation of energy and planet.
To promote low carbon and ‘green’ economy, Kazakhstan adopted the laws on “Energy saving
and energy efficiency” and “Supporting the Use of Renewable Energy Sources.”. Kazakhstan
also has programs on waste management, housing, and communal services modernization,
sustainable transport development, enhancement of the ecosystem conservation, and
sustainable forest coverage—green economy act adoption dedicated to lead the energy-
CE
UeT
DC
olle
ctio
n

4
efficient technology production to reduce GHG emissions (Agency of the Republic of
Kazakhstan for Construction of Housing and Communal Services 2011).
In the long term, the biggest challenge of the country is to shift from a natural resources-based
economy towards a more diversified and competitive economy. The country has accepted the
ambitious goals to diversify its economy by specifying the sectors of transport,
pharmaceuticals, telecommunications, and petrochemicals. However, such plans have been
challenging to achieve, taking the account high oil prices until 2014. Since then, significant
steps have been taken to make the market more business-driven and transparent, but the
situation is still facing issues with the ruling governance, laws, institutions, and existing
infrastructure as well as fewer incentives for new technologies. The government set a 2050
target for the green economy transition, emphasizing the GDP increase, GHG emission
decrease, and diversified energy-intensive economy.
1.2 Aims and Objectives
The current thesis advances the understanding of the status and impact of energy efficiency
measures in Kazakhstan, and it was dedicated to contributing towards energy efficiency in
buildings, specifically governmental and service buildings, such as hospitals, kindergartens,
orphanages, and schools. They consume different energy carriers, including secondary sources,
such as centrally supplied district heat and electricity and primary sources such as natural gas,
oil, and coal.
The research aims to advance the understanding of factors that impact energy savings on the
public sector in Kazakhstan and provide recommendations to the government of Kazakhstan
on priority measures in the field of energy efficiency.
The research objectives of this thesis are:
CE
UeT
DC
olle
ctio
n
5
1. Identify the factors which affect the social, economic, and environmental impacts of
energy efficiency measures in public buildings in Kazakhstan.
2. Estimate the influence of these factors on financial profitability and energy savings in
selected public buildings in Kazakhstan.
3. Develop recommendations for the selection of priority objects by the national energy
efficiency program of Kazakhstan.
1.3 Kazakhstan Energy Efficiency Project
The Kazakhstan Energy Efficiency Project (KEEP) challenges new low carbon innovations
implications and endurance in Kazakhstan realms. The results of the project could be used for
further scaling possibilities of the given procedures in energy efficiency.
Data of the current thesis is based on the “KEEP” established by the World Bank, which has
delivered energy efficiency measures to public buildings across the country from 2016 to 2019.
The Ministry of Investment and Development of the Republic of Kazakhstan, together with the
World Bank, officially launched the project "KEEP”. It aimed to increase the energy efficiency
of the state as well as to improve social facilities for energy efficiency and conditions for
creating a financing mechanism for projects in the field of energy-saving and energy efficiency.
The project aims to reduce energy use in government and social buildings such as schools,
kindergartens, hospitals, and street lighting, to demonstrate energy savings and associated
social benefits.
The goal of the project was to implement and demonstrate energy efficiency measures across
the state and socially significant facilities. The project delivered energy efficiency into
culturally significant properties, such as schools, kindergarten, and hospitals. It produced
CE
UeT
DC
olle
ctio
n

6
valuable contributions for the formation and maintenance of the State Energy Register (World
Bank 2020).
The collected data source can be applied for the future regulatory framework in energy
efficiency, for the approval of the regional and sectoral energy conservation plans, and for the
technical regulations on energy efficiency. Training of specialists and promotion of high-
quality energy conservation and energy audit is a significant plus of the project. It also added
its value in the development of international cooperation and favorable condition to establish
commercial possibilities in the energy conservation field.
The World Bank Project has a long-term goal to scale the project and increase the number of
buildings undergoing energy efficiency measures and support SDG. Raw data for the analysis
part of the thesis was provided by the representatives of the World Bank project.
1.4 Structure of the Thesis
The next chapter contains a literature review that covers the drivers of energy efficiency, energy
issues in Kazakhstan, the use of energy in buildings in Kazakhstan and worldwide. Chapter 3
contains the analytical framework and describes the sources and methods of data gathering and
analysis. Chapter 4 covers the results of the thesis. The last two chapters are dedicated to
Discussion and Conclusions, which include policy recommendations.
CE
UeT
DC
olle
ctio
n

7
2 Literature Review
The first section ff the literature review cover energy efficiency drivers, which includes the
adoption of the Paris Agreement and the energy scarcity theory. The second chapter explains
the reason for Kazakhstan being high energy intensity country. The next section covers energy
use in buildings worldwide, in the EU and in Kazakhstan. The fourth and fifth sections
elaborate on energy efficiency measures in the building as well as on the current energy
efficiency situation in Kazakhstan.
2.1 Energy Efficiency Drivers: the Paris Agreement, Energy
Scarcity, and Others
Climate change obligation
The current concern of the energy scarcity meets the consequences of direct and indirect energy
consumption, GHG emissions, and following climate change realms. The Intergovernmental
Panel on Climate Change (IPCC) argues that to achieve the goals of the Paris Agreement, most
of the GHG emissions should be eliminated by mid-century. To avoid the worst climate
impacts, the UN Secretary General recently asked national leaders to come to the UN Climate
Action Summit in September 2019 with the announcements of targets for net-zero emissions
by 2050.
Net-zero emissions by 2050 are a very ambitious goal that requires decarbonizing energy,
transport, and the industry as well as reducing emissions from land use and aforestation.
Specifically, decarbonization can be reached via three main strategies/pillars: electrification,
electricity decarbonization, as well as energy efficiency and conservation (Virta Global 2018).
CE
UeT
DC
olle
ctio
n

8
Energy efficiency is thereof one of the strategies to meet the Paris Agreement, strengthening
the country's capability to deal with climate impact and pursuing efforts to limit the temperature
to 1.5°C. According to the marginal abatement curve (MAC) by Timilsina et al. (2016), energy
efficiency is the cheapest strategy to deliver climate change mitigation and a decline in GHG
emissions. The MAC published by Boston Consulting Group (2020) demonstrates that the
energy efficiency measures do not just optimize energy consumption, but also increases
resilience to CO2 emissions and actualizes significant savings of the energy resources
(Burchardt et al. 2020). According to the International Energy Agency (2019), energy
efficiency will be able to decline world’s energy needs by one third in 2050 by implementing
the energy efficiency measures in buildings, industrial sector as well as transportations.
Energy scarcity
There would be far less new crude oil resources discovered compared to the level of current
energy consumption, according to the Association for the study of the Peak Oil and Gas (ASPO)
founded by Cambell in 2001 (Figure 1). Although the time for “the peaks” predicted by
Campbel and Laherrerre (1998) were incorrect, the proposed dogma by Hubert (1956) cannot
be ignored.
Essential point (prediction) described by the ASPO (2001) is that discoveries of the new
location of oil production do ne meet the level of surged consumption and rapid development
for the past decades. To note, this can be applied only for the conventional oil locations, as
data for the non-conventional and shale oil location are available. Considering the last two
decades gap between new discoveries and human energy consumption has become
significantly wider, this prediction is argued to be correct (Bardi 2019). Another forecasting
model constructed by DNV GL energy transition outlook declared the global oil production
decline between now and 2050 (later year might be delayed due to other circumstances such as
CE
UeT
DC
olle
ctio
n

9
COVID-19); by the year of 2050, conventional oil will account for about 50% of the energy
source, whereas unconventional oil supply will deliver 30% of the oil worldwide.
Figure 1. The general depletion of oil and gas demonstrated by the Campbell and Laherrerre
Source: Campbell and Laherrerre (2001)
Energy scarcity, in general, may cause difficulties in exporting oil for oil-producing countries,
including Kazakhstan, accordingly, because the world is heavily dependent on affordable
petroleum. The world’s population is projected to become 9.7 billion people by 2050 (UN
DESA 2020). To meet the increasing demand for energy consumption, oil-producing countries
might decline the volume of oil dedicated to export. So, to export the same amount of oil, the
afore-mentioned countries might choose a strategy on energy-saving measures. Before the
peak of conventional oil production during the period of 2000-2010, increase prices for
petroleum became markedly less available for the people. It has to be mentioned that, however,
even with the help of technology and more types of oil coming to the market, the latter still
cannot be supplied at such affordable prices as their predecessors. Hence, it is hard to agree
CE
UeT
DC
olle
ctio
n
10
that a persistent increase in oil prices can be upheld without a negative effect on the economy
and social aspects (Hallock et al. 2014).
Apart from the conventional oil depletion, remaining unconventional oil is extremely difficult
to extract, and expensive to produce. It takes tremendous investment and time to start mining
the new places of unconventional oil. According to Tverberg (2010), the mining process could
be late if the conditional oil capacity will be far from its peak.
Kazakhstan is a significant fossil fuel producer: it is the 9th largest coal producer, the 17th in
crude oil, and the 24th in natural gas production worldwide. As a producer of a significant share
of fossil fuel, considering the energy scarcity and future forecasting of the energy system
perspective, Kazakhstan is directly responsible for consuming and producing energy
sustainably.
Others
From the written above, energy efficiency is driven by climate change obligation as well as the
scarcity of conventional energy resources. Also, energy efficiency is stimulated by other
modern circumstances:
First, it is growing quality of life, with demands for higher living standards, including a clean
environment and accessible services as well as end-use technologies. Second, it is urbanization,
which continues to grow, especially in mid-sized cities in developing countries. Next, there is
a growing demand for innovative energy services because end-consumers are demanding more
clean, convenient, and high-quality energy services. Another driver is the diversified energy
end-user, meaning end-consumers play various roles in the energy system from consumer to
producer. And finally, it is the constant improvement of the cost and performance of the
CE
UeT
DC
olle
ctio
n

11
information and communication of the technologies, which support the widespread application
of the drivers.
2.2 Kazakhstan – an Energy-intensive Country
Kazakhstan is one of the highest energy-intensive countries in terms of energy use per unit of
GDP, and there are several major reasons for this statement. First, the existing structure of the
economy predominates energy-intensive industries, including extractive industries, mining and
metallurgy, oil and gas sector, and coal energy. According to the International Energy Agency
(IEA), industry, residential buildings and commercial and services shares are the most energy-
consuming of total final consumption share (IEA 2019; Figure 2)
Figure 2. Energy use by sector: share of total final consumption
Source: IEA (2017).
CE
UeT
DC
olle
ctio
n

12
The industry accounts for approximately55 % of the total final energy consumption. The
residential sector and public and commercial services consume about 18% and 5% of the total
final energy consumption, respectively.
Electricity consumption in Kazakhstan
Electricity generation is a load to existing thermal power plants. As a result, there is an existing
problem with significant depreciation of the leading equipment and the use of inefficient
technologies in energy production (Ministry of Industry and New Technologies of the
Republic of Kazakhstan 2020). The general technological backwardness, such as deterioration
of networks and equipment in the housing and communal services, is associated with this
significant loss of energy, primary energy sources, and energy consumption. For instance, more
than 70-80% of the electricity is generated via power plants near coal mines (Northern
Kazakhstan) but due to the deteriorated network and inefficient distribution, energy loss
accounts for about 15% or more. In 2012, energy loss estimated 7 TWh, which is equal to the
total electricity use in Latvia (EBRD 2019).
Housing and utilities are second-ranked in terms of electricity consumption (13%) (Table 2).
Services and construction account for about 10% of the total electro-energy use. Thus, it is
around 23% of the electro-energy consumptions by buildings, which is a substantial amount to
consider improving energy efficiency and applying energy conservation measures in the
building sector. CE
UeT
DC
olle
ctio
n

13
Table 2. Consumption of electrical energy in various fields for 2011 in Kazakhstan
Name of the field % of electro-energy
consumption
1 Industry 69,7%
2 Housing and Utilities 12,5%
3 Services 8,3%
4 Transport 5,5%
5 Agriculture 2,5%
6 Construction 1,5%
Source: (Tulegenov 2016)
The significant volume of electric power generation in Kazakhstan is in the Northern and
Central parts of the country, and they meet the demand for electricity across these regions. The
southern part lacks the full capacity to cover electricity demand. Hence, they import the energy
sources, such as coal, gas, and oil from other parts of Kazakhstan as well as abroad. Western
Kazakhstan has the vast reservoirs of oil and gas; hence this part of the country does not have
the difficulties with energy sources shortage. However, they do not have enough power plants
to supply the growing electricity demand. Thus, they import a certain amount of heat from
Russia. In addition, Kazakhstan has an issue in frequency with electricity generation supply –
meaning during the high peak loads for demand, the electricity sector is unable to manage
regular supply. Thus, the country needs to compensate energy supply gaps as well as maintain
the frequency of the electricity.
Coal and pollution
Coal is applied in coal-fired boilers, heating the mine facilities and air ventilation, and heavily
used in industry and in thermal plants to generate heat and electricity power. Coal contributes
a very high share of electricity production of Kazakhstan (around 72%) and to heat generation
(about 98%) (IEA 2017). In addition to coal being the most environmentally harmful energy
CE
UeT
DC
olle
ctio
n

14
source, around 40% of the power generating stations use ash-coal type, highly abrasive for
combustion facilities. Coal in Kazakhstan is predominately polluting because the generous
amount of ash produced lead to high emission of sulfur and nitrogen oxide, and there are no
flue gas scrubbers are installed to capture the pollutants at the power plants. A pilot project was
developed in Karaganda, Central Kazakhstan, to capture coal-bed methane and coal-mine
methane, which generates 1.4 MW electricity from coal-mine methane. This demonstrates,
there is a potential for future improvement.
The relatively low cost of energy does not stimulate many consumers to lean towards
sustainable consumption. After the Soviet Union collapsed, Kazakhstan struggle difficulties in
recovering the economy, which led to slow adaptation. However, after foreign investments,
rapid development accelerated coal production and energy consumption, which has increased
the possibility for the government to subsidize the energy system. To note, Kazakhstan has one
of the lowest electricity prices (for example, the electricity tariff in Kazakhstan is on average -
15 KZT per 1 KWh, whereas in Russia - 15, USA - 40, China - 40, and Europe – 90; IEA,
2018).
Climatic condition and heating in Kazakhstan
Climatic conditions are diversified because of the massive territory of the country. The
northern parts and including most of central Kazakhstan have nearly nine months of the
heating season, while the heat supply sector in the country is quite an energy-consuming (20%
of total final energy consumption). To note, more than 90% of the heat is generated from coal,
which makes them non-sustainable and highly carbon-intensive (Figure 3; IEA 2017).
CE
UeT
DC
olle
ctio
n
15
Figure 3 Heat generation by source in Kazakhstan
Source: IEA 2017
Also, there is an issue regarding the under-heating of the buildings during the heating season.
For instance, every year, there are cases when consumers do not have the energy supply on an
adequate level to heat their houses o comfortable level. One of the reasons is that houses are in
emergency conditions, and it can consume a high amount of energy, which is costly for the
consumer. This leads to an under-heating, which causes health issues for the residents of the
buildings.
It shall be noticed, monitoring progress regarding the data on energy consumption is causing
uncertainty because gathered information is not harmonized with international
standardizations. Hence, there is a significant difference in what is reported to the United
Nations Framework on GHG emissions. The same note goes to energy balance data as well as
information on energy consumption by sectors.
From the overview above, Kazakhstan has four noticeable energy-intensive fields: industry
sector, residential sector, transport sector, and services and commercial sectors. Around 80%
of the electricity is generated from coal power plants, and housing services and utilities
CE
UeT
DC
olle
ctio
n

16
consume approximately 20%. Heating plays an important place in Kazakhstan, as the climate
is known to be extremely continental and very dry, which average winter temperature -20 C
(some parts of the country have nine months of winter). Around 90-95% of heat is generated
from coal.
2.3 Energy Efficiency – the Key to Reducing Energy
Intensity
Energy efficiency is “the first fuel of sustainable global energy”; in other words, it is the key
concept towards clean energy transition (IEA 2020). According to Grubler et al. (2018),
energy end-use is the most inefficient field in the energy system and has enormous potential to
be improved.
Energy savings covers various fields form street lighting to reducing transmission loss.
However, it plays a significant role in buildings. Energy efficiency measures in buildings bring
multiple benefits, such as reducing energy bills, improving the comfort lives, or addressing the
climate change emergency. On a global level, the energy efficiency policy area covers 35%.
Hence there is a space for further scale-up (IEA, 2020).
Energy efficiency is a multi-benefit strategy, and three benefits of the advantages are explained
further: economic effect, environmental effect, and health impact.
Economic effects: All energy-saving measures pay off in a certain period due to saved energy
consumption costs. In addition, an additional job market is created, which brings new
specialists in the energy management field, generate labor income, and subsequent GDP
increase with sustainable development. Further, it is increasing the competitiveness of the
economy: the industrial sector is being modernized, growing encouragement for the sustainable
energy sources application.
CE
UeT
DC
olle
ctio
n

17
Environmental effects and resilience to future emissions: energy efficiency or energy-saving
measures have a direct impact on CO2 emission decrease (Table 3), positive air quality impact,
and subsequent health impact of the population. Such measures set the right position for the
government to chase sustainability developmental goals.
Table 3. Review of the studies which assessed the potentials for the energy efficiency and GHG mitigation in
public buildings
Country,
Reference
What type of buildings included (hospital, etc.)
What measures
[Political, econ or technical measures, energy tax?]
What sort of energy efficiency?
(window insulation, wall replacement?)
What is the potential of final energy consumption (FEC), GHG decrease
Potential Compared to what, BAU, what is the baseline
Baseline calculated to 2040, 2050, 2010
Other incentives, discount rate, etc.
EU (5 countries)
E. Mata, et al, 2018
Residential (complex and not homogeneous)
Energy conservation method EU
Techno-economical potential*
(CO2 taxes)
Thermal, thermal+
Will be elaborated below
Scenario 2020 Paris Convention
Target 2020, 2050
France Residential, non-residential
Energy conservation method EU
Techno-economical potential*
(CO2 taxes)
Thermal, thermal+ envelope, deep*(?)
FEC:
R: 7% due to value cellar
NR: 15% due to heating ventilation retrofit
55% CO2 emission decrease (solar hot water, NR)
Baseline 2009, 2010
4% Discount rate (DR) for 15-30 ys
Germany Residential, non-residential
Energy conservation method EU
Techno-economical potential*
(CO2 taxes)
Thermal insulation, heating (?)
FEC:
R: 23% due to on value wall
30%-75% CO2 emission decrease (wall and
Baseline 2009, 2012
until 2050 CE
UeT
DC
olle
ctio
n

18
biomass boilers, R)
Spain Residential, non-residential
Energy conservation method EU
Techno-economical potential*
(CO2 taxes; package 5
Envelope renovation, efficient heating, and lightning, efficiency in existing data centers, efficient appliances, efficient district heating, cooling networks
FEC:
R: 20% due to roof and wall retrofit
NR: 15-5% cellar, wall. Lightning, and heat ventilation retrofit
Up to 70% of CO2 emission decrease (Reduced energy use, NR, R)
Baseline 2011 R: 8,2%-5%
NR: not given
Until 2030,
Significant job creation
Sweden R+NR Energy conservation method EU
Techno-economical potential*
(CO2 taxes; package 5
Insulation, window
replacement, ventilation
recovery or heat pump,
circulation pump
replacement, water
conservation measures, hot
water recovery from waste
water, controls and
regulators
FEC:
R: 12%-5% cellar, wall, roof, heat ventilation, lighting, solar panels
NR: 25% of heat ventilation
Up to 81% of CO2 emission decrease (ventilation, NR)
2011 Until 2050
UK NR+R Energy conservation method EU
Techno-economical potential*
CO2 taxes
Insulation, draught-proofing
reduced infiltration, boiler
upgrade, heating controls,
FEC:
R: 20% - 3% wall, cellar, roof, windows
NR:12%-4% cellar, windows, roof, heat ventilation,
R: 2012,
ISO standard 13790
NR: analysis of administrative data
3,5%,
Life-time ECM
CE
UeT
DC
olle
ctio
n

19
efficient hot water production,
efficient lighting, smart
meters**
lightning, solar panels
10-35% decrease in C02 emission
Armenia
(G.Timilsina, et al. 2016)
Policy Policy Thermal insulation, replacement of energy inefficient TV set, refrigerator, air conditioning, lightbulbs
7.5%
Georgia (G. Timilsina, et al. 2016)
Policy Thermal insulation, replacement of energy inefficient TV set, refrigerator, air conditioning, lightbulbs
7.5%
Russia Residential
(high rise apartment, individual housing
Project: hypothetical
Technical potential
Techno-economical (exporting the conserved energy sources)
The policy is an additional scenario
Thermal insulation
Baseline 2003, “Thermal Protection of Buildings”
2020, 2050
*technical potential is determined as the reductions in energy usage in this particular resource; techno-economical potential is defined as the portion of the technical potential that is cost-effective in relation to market costs using societal discount rates and given that all CO2 taxes are included in the energy prices. ** Reduced energy use in FEC (technical + techno-economical potential): France: 35% for public buildings; Germany: 80% for Residential, Spain: 57% for Public building (non-residential), Sweden 56% public building, UK: 42% for public building
CE
UeT
DC
olle
ctio
n

20
Apart from the direct effect on economic development and the environmental issues
improvement, energy efficiency brings positive health impact and comfort to the local
population after the retrofit of the buildings. Below, it is illustrated the sustainable energy
efficiency measures integration into school in Izrael (2015), which shows a direct link among
health economic aspects and positive learning outcomes of the students due to ensured comfort
environment (Figure 4).
Figure 4. Summary of a positive link between health, local economic development and learning outcome in
energy efficiency measures integrated schools
Source: ASU Walton Water Sustainability initiatives (2015).
2.4 Energy Use in Buildings Worldwide
Final energy consumption by buildings has grown significantly from 2820 mln tons of oil
consumed (Mtoe) in 2010 to nearly 3060 Mtoe in 2018, in the respect that the fossil fuel share
in it from 2010 to 2018 barely declined from 38% to 36 %, respectively. Emissions coming
CE
UeT
DC
olle
ctio
n

21
from the sources that are controlled by the reporting entity is called direct emissions. In
contrast, emissions coming from the activities of the reporting entity but controlled by another
entity is named indirect emissions. Direct emissions come from a combustion activity, whereas
electricity, heat, and steam emit indirect emissions (Fernandez and Watterson 2012). Direct
emissions of CO2 did not increase significantly. However, indirect emission for buildings is
responsible for around 28% of global energy-related CO2 emission in 2018 (Figure 5).
Reducing carbon-intensive power generations is not enough to cover the growing demand for
energy services. Improved energy services such as cooling/heating systems and appliances,
like plug loads with the current electrification measures, can significantly contribute to
reducing the emissions related to buildings (Figure 6).
Figure 5. Direct and indirect CO2 emissions in the Sustainable Development Scenario, 2000-2030
Source: IEA (2019)
Also, a surplus of energy demand in the building sector meets the climate change factors,
starting from 2018. Extreme heat brought a notable increase in electricity consumption for the
CE
UeT
DC
olle
ctio
n

22
cooling system in buildings (Dulac et al. 2019). Heatwave drove the highest demand for air
conditioning; Spain and Portugal had almost the hottest August in history keeping the
temperature of 48C; whereas Tokyo has 41C in late July, which is also the highest recorded
temperature for that region. To note, in South Korea, twenty-nine people died during such hot
summer days from heatstroke.
Figure 6. Final energy consumption by buildings, 2000-2018
Source: IEA (2019).
The building sector in the EU accounts for about 40% of the total CO2 emissions; nearly 50%
of the EU's final energy consumption goes to heating and cooling. High levels of emission and
energy consumption of buildings are linked to the fact that buildings are energy inefficient, and
the third of them are over 50 years old. Renovated buildings may lead to a reduction of 30% of
the primary energy consumption and CO2 emission by 2030. Historical buildings and
buildings, in general, are highly valued in Europe and considered as part of the past heritage,
which makes the government take actions towards retrofit to save the buildings as they are. It
is common practice for buildings in Europe to undergo exploitation for various purposes,
including for municipal purposes. Hence, actions toward energy efficiency are well accepted.
CE
UeT
DC
olle
ctio
n

23
Revision of the Energy Performance of Buildings Directive (EPBD) 2010/31/EU and the
Energy Efficiency Directive (EED) 2012/27/EU for better performance of the European Union
operate the clean energy transition for buildings within the EU. One of the successful projects
administered under the EPBD is EU Building Stock Observatory is a useful tool to keep the
data on building performance and characteristics within the EU territory. Such data centers
help make a model and policy specific to that region (Pohoryles et al. 2020).
2.5 Kazakhstan: Energy Use and Energy Efficiency in
Buildings
Energy use increased in Kazakhstan mainly due to a non-diversified economy based on oil and
gas, low energy prices, subsequent lack of initiatives, and interests in energy efficiency. Energy
consumption in the residential sector has grown promptly between 2000-2014, with an annual
growth rate of 6.3%. Such growth has been induced by increased income, expansion of
household paces, and diffusion of household appliances (Kerimray et al. 2016a). Energy
efficiency was encouraged via policies adopted and incorporated energy efficiency devices,
such as heat measuring meters.
Coal is the most extensively used energy source (used to generate 64 % of heat) due to its least
expensive price. The gas network was expanded remarkably mainly due to the reason for gas
supply and network pipeline expansion in the region located near the South and West
Kazakhstan. The supply of district heat remained the same because it did not expand notably.
It is generated at combined heat and power plants (CHP) (55%) and heat plants (45%)
(Kerimray et al. 2016a).
Population growth might not be a significant factor, as it has grown only by 17% from 2000
through 2014; however, the average growth in large cities such as Nur-Sultan, Almaty,
Karaganda, and Shymkent is up to 3% annually. Hence, energy efficiency plays a meaningful
CE
UeT
DC
olle
ctio
n
24
role in large cities, as population growth will increase the demand for municipal services and
energy supply. For instance, it is forecasted that primary energy supply might increase for
nearly 55% (to 34,250 GWh) in Nur-Sultan in 2050, but implementing energy efficiency
measures and subsequent energy savings can slow down such considerable trend to 33%
(Worldometer 2020).
In Kazakhstan, despite support from the government and some laws directed to sustainable
development goals, there is a lack of dedicated and consistent strategies towards energy
efficiency in buildings. Hence not a substantial amount of investment is in this sector. There
have been pilot studies administered (ex: KEEP). However, their scale is not enough to initiate
financing to a large extent but rather provide exemplary data that would bring innovative
business models and references necessary to accelerate the process of clean energy transition
and energy efficiency actions in the country. According to the latest changes in the law on
energy conservation and energy efficiency, the following directions are stated:
1) The implementation of technical regulation in the field of energy conservation and
energy efficiency.
2) The implementation of balanced tariff policy and pricing in the field of production
and consumption of energy resources.
3) Stimulation of energy conservation and energy efficiency, including the use of
energy-saving equipment and materials,
4) The implementation of state control over the efficient use of energy resources,
5) The promotion of economic, environmental, and social benefits of the efficient use
of energy resources, improving the public educational level in this area,
CE
UeT
DC
olle
ctio
n

25
6) Ensuring compliance with the legislation of the Republic of Kazakhstan on energy
conservation and energy efficiency.
The buildings sector contributes around one-third of the total energy use, and it has enormous
potential to reduce the negative impact on the environment. Hence this sector is a significant
component in reaching environmental sustainability. According to the research (Kim and Sun
2017), regional difference plays a major role in the context of the green building due to the
diverse climate of the country (in a given text, green building means energy efficiency,
sustainable energy like solar panel penetration, and efficiency water consumption).
Kazakhstan has a constantly growing economy and population, specifically in big
cities. Hence, it requires reliable energy supply as well as the provision of utilities. To note,
high energy intensity and energy loss in cities are due to outdated infrastructures, such as
district heating networks, water pipelines, and residential and public buildings (Karatayev and
Clarke 2014). Despite recent initiatives to improve public transport and programs' capacity and
efficiency to retool district heating and water systems, there remains a considerable need to
upgrade infrastructure and meet future demand for energy and utilities.
2.6 Summary
This literature review showed the importance of reducing energy use, specifically in buildings.
Energy-saving measures cover economic, environmental, and social benefits to society. In the
context of Kazakhstan, reducing the energy consumption brings energy security, reduction of
GHG emission, comfort living, and elevate social issues related to underheating. Also, energy
efficiency measures play a significant role in an energy-intensive country like Kazakhstan to
reach the goal of net-zero emissions as advised by recent reports of the IPCC and stipulated in
the Paris Agreement.
CE
UeT
DC
olle
ctio
n

26
3 Analytical Framework, Methodology, and Limitations
This section first explains data gathering, data analysis processes, and further data
interpretations. Subsequently, it formulates the hypothesis as well as elaborates on the
definitions used in the analysis. The last section interprets the limitations of the study.
3.1 Data Gathering and Data Analysis
Objects selected for the analysis in the given study include governmental buildings,
kindergartens, schools, orphanages, hospitals, and street lighting infrastructure. Overall, there
were five groups throughout the KEEP, which have gone through the retrofit processes:
Group I - 19 Buildings in 5 regions - Pavlodar, Kyzylorda, Karaganda, East Kazakhstan
region (11 kindergartens and 8 schools)
Group II - 25 objects in 8 regions - East Kazakhstan region, Kostanay, North
Kazakhstan region, Pavlodar, East Kazakhstan region, Almaty, Akmola, South
Kazakhstan region (13 schools, 4 Kindergartens, 5 medical institutions, 3 objects of
street lighting)
Group III - 31 objects in 7 regions - East Kazakhstan region, Kostanay, Akmola,
Pavlodar, East Kazakhstan, Almaty, South Kazakhstan. (19 schools, 4 kindergartens, 5
medical institutions / hospitals / clinics, 3 street lighting objects)
Group IV - 10 objects in 4 regions: East Kazakhstan region, Kostanay, Akmola, South
Kazakhstan region (4 schools, 2 kindergartens, 2 medical institutions/hospitals/clinics,
2 street lighting objects).
The present thesis assumed five characteristics to each object (except for the street lighting),
which may impact on energy savings: energy source, year of construction, number of stores,
building type, heating degree days, and working hours of the buildings. The number of stores
CE
UeT
DC
olle
ctio
n

27
was not distinct significantly from one to another, varying from one floor to four-floor
buildings. The year of construction varied, but these were mostly 70 to 50 years old buildings,
with the average year of construction 1970. Hence, the number of stores and year of
construction were excluded from the analysis. Overall, 84 buildings were chosen, and four
types of retrofit were carried out (Table 4, World Bank 2020).
Table 4. Thermal packages applied to the building during a retrofit
Thermal
packages
Package
codes
Packages
description
Mandatory 1.1 Automated heat sub-station with or without thermostatic
radiator valves (TRVs) and hydraulic balancing valves
(HBVs)
Low
efficiency
1.2 Exchange of windows, installation of automated heat sub-
station, installation of TRVs and HBVs
Medium
efficiency
1.3 Exchange of windows, installation of automated heat sub-
station, installation of TRVs and HBVs, partial insulation
High
efficiency
1.4 Exchange of windows, installation of automated heat sub-
station, installation of TRVs and HBVs, full insulation
*No devices replacement (water heater, washer, drier, dishwasher, oven, etc.) were
involved in current energy-efficient measures.
The data was provided by KEEP. It was collected during the past three years by the different
audit companies, during 2016 and 2019. Notable factors mentioned above were separated from
the raw data for the further quantitative dependence analysis on energy efficiency and simple
payback. For the analysis, Microsoft Excel was used. Energy efficiency percentage (final
energy savings) was estimated by the difference in energy expenditure before retrofit and after
retrofit by the following formula:
Final Energy Savings (FES) =𝐸𝑛𝑒𝑟𝑔𝑦 𝑐𝑜𝑛𝑠𝑢𝑚𝑝𝑡𝑖𝑜𝑛 𝑎𝑓𝑡𝑒𝑟 𝑟𝑒𝑡𝑟𝑜𝑓𝑖𝑡
𝐸𝑛𝑒𝑟𝑔𝑦 𝑐𝑜𝑛𝑠𝑢𝑚𝑝𝑡𝑖𝑜𝑛 𝑏𝑒𝑓𝑜𝑟𝑒 𝑟𝑒𝑡𝑟𝑜𝑓𝑖𝑡 *100% - 100%
CE
UeT
DC
olle
ctio
n
28
The negative sign showed there is an energy efficiency after the retrofit, whereas positive sign
demonstrated that final energy consumption increased after the retrofit.
3.2 Formulation of the Hypotheses
After energy efficiency measures, notable variables are taken for the analysis of given work,
such as simple payback and factors affecting energy savings measures to identify the
dependence from following components: compactness, heating degree days, intermittent
heating, and energy sources. The purpose is to identify significant factors positively affecting
the final energy savings after the retrofit.
o Compactness is assessing the building volume and morphology. According to the
compactness valuer: over-compact or over-exposed, the building may waste or save
energy. In addition, efficient space-formation may lead to the effective indoor
environmental performance as well as las energy saving (Almuma 2016).
o Heating degree days (HDD) is the scale of measurement on how cold the days for a
given period or given day, mean temperature of 40°F in a day has 25 HDD. The colder
the outside temperature, the higher the measurement for degree days. As a result, a high
number of HDD results in high energy use for heating or cooling the space. HDD is
used to evaluate the energy consumption required to heat buildings (EIA 2020).
o Intermittent heating is the term used where the heating is applied for weekdays only
and switched off on weekends.
o Energy sources used by buildings and analyzed in this study are coal, gas, oil, and
district heating.
o Final energy saving is the measurement of Gcal used by building per year.
o Simple payback (SPB) represents the periodicity of time to receive net cash revenue or
cost savings of a given project (retrofit on buildings) to payback the initial investment.
CE
UeT
DC
olle
ctio
n

29
Simple payback =Implementation cost
Annual cost savings =
Implementation cost
Watts saved(Final energy savings)∗cost (current Tariffs)
Hence, from the formula above, simple payback is directly depending on Investment cost, Final
Energy Savings, and Tariffs. Factors are affecting simple payback positively:
• Increasing tariffs for energy carriers
• Small capital investment (implementation cost of the energy efficiency measures)
• High energy-saving potential
Analysis conducted on the dependence of final energy savings (FES) and simple payback
(SPB) on factors explained above:
o Dependence of FES on (1) Compactness, (2) Intermittent heating, and (3) HDD.
o Dependence of simple payback (SPB) on (4) Energy sources, (5) Intermittent heating
and (6) HDD
Therefore, the hypotheses are:
1) There is a significant dependence of FES on Compactness
2) There is a significant dependence of FES on Intermittent heating
3) There is a significant dependence of FES on HDD
4) There is a significant dependence of SPB on Energy carriers
5) There is a significant dependence of SPB on Intermittent heating
6) There is a significant dependence of SPB on HDD
3.3 Interpretation and Use of the Results
Results will contribute to the realization of the energy efficiency measures in buildings in
Kazakhstan. The outcome of the analysis will be taken into account by the Ministry of Energy
CE
UeT
DC
olle
ctio
n

30
and the World Bank for further scaling the project in public buildings. Thus, the given project
would provide valuable information on formulating the strategy on local energy efficiency
projects as well as using the data for later implementation.
3.4 Limitations of the Study
As mentioned above, auditing was administered by different companies. Hence audit quality
and methodology varied. Also, data for some factors were missing, which decreased the
number of variables in the analysis. Kazakhstan has neither unified standardization of the
protocol nor the official responsible body examining reports for the buildings' energy audit,
which lead to distinct types of reports submitted. Also, there is no official organization that
could provide official certifications and training on unified software for the companies carrying
the audit procedure.
There were issues on terms used in the energy audit report. Some words (or terms) are
confusing and can be interpreted in multiple ways, representing different values. Also, there
are few building codes in the country, which brings confusion for energy monitoring.
CE
UeT
DC
olle
ctio
n
31
4 Results
The thesis explored public buildings, including schools, kindergartens, hospitals, and
orphanages. All selected buildings were built between the late 1940s and the late 1990s, except
for one hospital built in 2008. The buildings were chosen from different parts of the country.
The number of floors of the buildings varied from one to five. Different energy carriers served
the buildings. The building had different operating hours and locations with diverse climatic
conditions. On top of that, objects possessed different levels of insulation.
The project KEEP implemented four types of retrofit activities, which varied from types of
insulation applied to buildings according to their initial energy performance. The objects fall
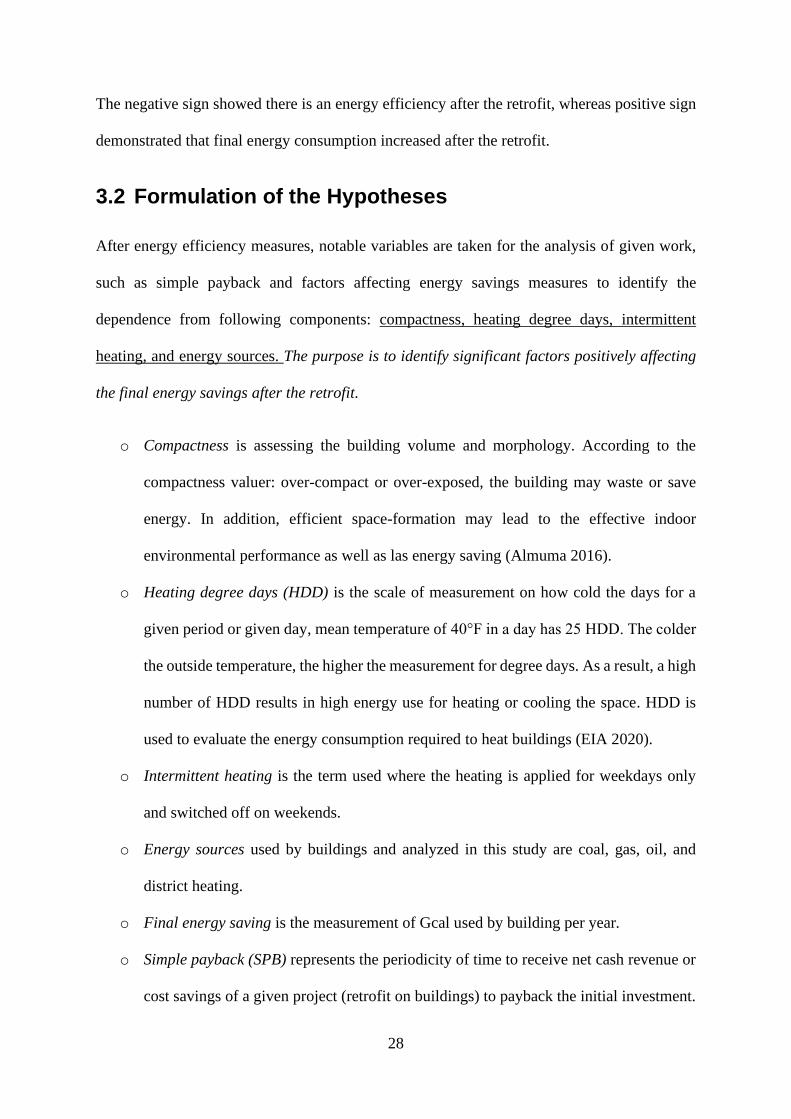
into three groups, which had three different energy audit procedures. As research results
illustrate, there was no difference among three examining audit-groups on simple payback
outcome (Figure 7).
Figure 7. Dependence of simple payback (in years) on three examining energy-audit groups
CE
UeT
DC
olle
ctio
n

32
The “Simple Payback (SPB)” of a building retrofit is a crucial financial indicator based on
which one decides whether the renovation will be implemented. Hence the thesis evaluates
factors, which may impact SPB. These include final energy savings, energy carrier prices
(tariffs), and capital investments required. The first section will be covering the factors, which
presumably affects final energy savings: intermitted heating (working periodicity of the
building), heating degree days, and compactness. The second section introduces the SPB
dependence on the three mentioned factors, type of energy sources used for heating, and initial
capital investment.
4.1 Factors Impacting Final Energy Savings
4.1.1 Intermitted Heating
There was a positive result between FES and buildings operating at nights and weekends ((FES
for such buildings were in the range from 70% to 78%), compared to those buildings which do
not run after working hours or during the weekends (FES were in the range from 7% to 72%)
(Figure 8). Buildings using energy at night and on weekends had significantly better final
energy savings because it allows the building to undergo full exploitation. Hence, energy
efficiency measures show a significantly positive result of full-time working buildings
compared to the buildings with intermittent heating with reduced final energy use.
Because district heating systems do not have an intermittent heating regime anyway, district
heating was excluded from the analysis (Figure 8) to show the capacity of an intermittent
heating factor on FES. Since buildings having other sources of energy often had both
characteristics, intermittent heating or full time working with no periodicity, it was decided to
test all the objects except for those using district heating. As a rule, buildings operating with
CE
UeT
DC
olle
ctio
n

33
district hearting either do not have an energy management system to switch on and off the heat
manually or by having the system do not exploit the system properly. The system can be
controlled by the responsible people (owner of the building or staff). However, the system
requires additional learning or training.
Figure 8. Dependence of final energy savings on weekend and night heating *no means building was not using
energy on weekends and night times
4.1.2 Climate Zone
There is a significant dependence of FES on HDD. Colder regions, with HDD within the range
from 4000 to 7000, benefit from higher FES after the retrofit as compared to regions with lower
HDD (Figure 9). Colder regions mostly include North, Central, and some of the Eastern parts of
Kazakhstan. They are known to have the longest period of winter (from 6 to 9 months of heating
season) and, the longest heating seasons, subsequently. For instance, Astana starts its heating
seasons end of October and ends in early May.
CE
UeT
DC
olle
ctio
n

34
Figure 9. Dependence of final energy savings on heating degree days
4.1.3 Building Compactness
There is a mild correlation between compactness of the building and the FES after the energy
efficiency measures applied (Figure 10); buildings, which have compactness measure from 0,45
to 0,60, benefit from better FES. By looking at general features of the buildings' shape, mostly
rectangular or square, and the floor level, from one to four, it can be said that buildings are
standard in shape and not large in volume. However, further studies are needed to confirm the
significance of the compactness factor. CE
UeT
DC
olle
ctio
n

35
Figure 10. Dependence of final energy savings on building compactness
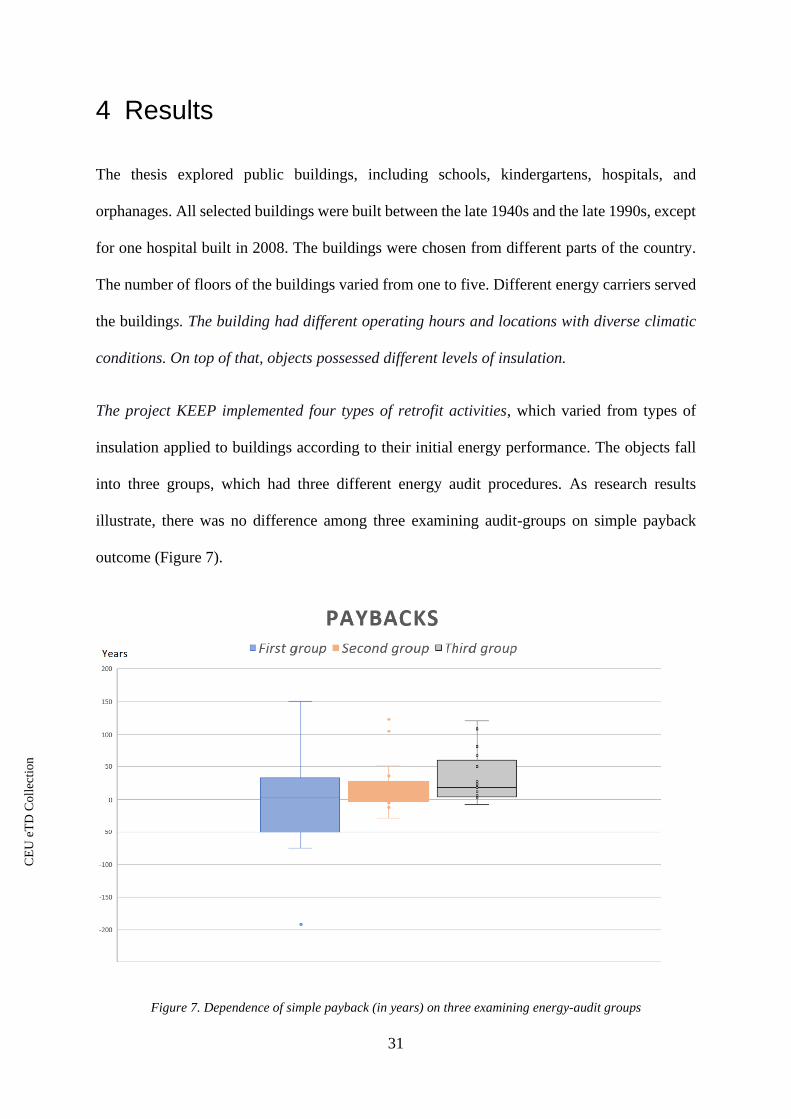
4.1.4 Type of Energy Carriers
The research concluded that the level of final energy savings achieved during retrofits did not
depend on the type of energy carrier used for space heating (Figure 11Ошибка! Источник
ссылки не найден.). Both significant and not significant energy savings were observed in
buildings heated with all energy carriers (district heat, coal, natural gas, and diesel). The
exception was buildings heated with natural gas, which showed comparatively good energy
savings. However, there were not sufficient data to confirm the outcome for natural gas.
CE
UeT
DC
olle
ctio
n
36
Figure 11. Dependence of final energy savings on energy carriers
4.2 Factors Impacting Simple payback
4.2.1 Compactness, Intermittent heating, and HDD
There was no dependence of SPB on the compactness of the building (Figure 12) as it was seen
for FES. It was a mild dependence for FES (Figure 10); thus, this factor might need further
research to verify the outcome.
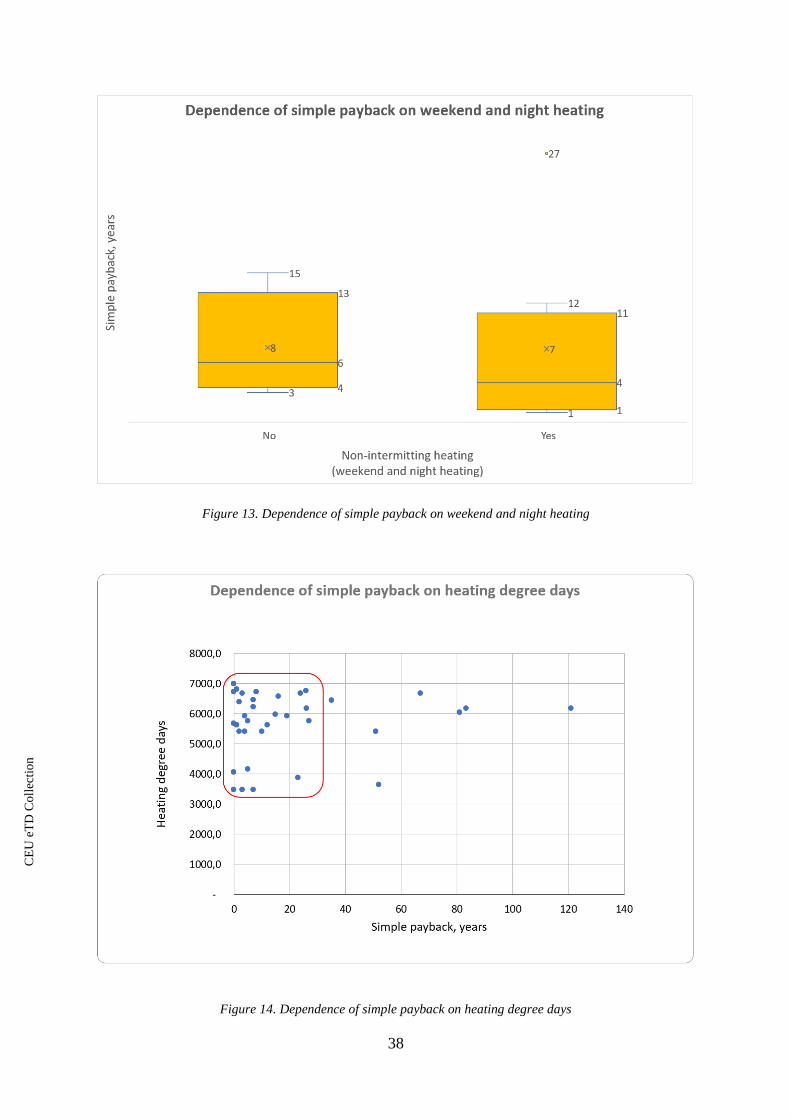
There was no dependence of SPB on buildings periodicity of the heating at night and on
weekends (Figure 13), which showed the opposite outcome for positive FES dependence on
intermittent heating (Figure 8).
CE
UeT
DC
olle
ctio
n

37
There was a positive outcome toward of SPB dependence on intermittent heating of buildings
(Figure 14). SPB benefits from buildings located in the regions with HDD from 4000 to 7000,
which coincides with the results obtained from the analysis for FES dependence on HDD
(Figure 9).
Figure 12. Dependence of simple payback on compactness
CE
UeT
DC
olle
ctio
n
38
Figure 13. Dependence of simple payback on weekend and night heating
Figure 14. Dependence of simple payback on heating degree days
CE
UeT
DC
olle
ctio
n

39
4.2.2 Types of Energy Carriers
Furthermore, the analysis of SPB dependence on the energy sources showed that SPB is the
highest in buildings using coal and diesel compared to those connected to district heating and
natural gas (Figure 15). A significant part of buildings using coal is located in the central and
northern regions, where the heating season is twice longer compared to the southern part. Since
district heating showed a wide range of SPB, for the demonstration, it was excluded from
Ошибка! Источник ссылки не найден., where coal and diesel showed the most favorable
SPB values. To note, variables for district heating and natural gas are scattered, and further
analysis is needed to confirm the outcome.
Figure 15. Dependence of simple payback on energy sources used for space heating
CE
UeT
DC
olle
ctio
n

40
4.2.3 Level of Capital Expenditure
There is a direct correlation between SPB and the level of capital investment (Figure 16).
Objects having investment requirement from 0 to 30,000 KZT per m2 demonstrate favorable
payback from 0 to 25 years (highlighted red box in Figure 16).
Figure 16. SPB dependence on the level of capital investment
CE
UeT
DC
olle
ctio
n

41
To conclude the analyses above, the number of hypotheses is confirmed. There is a significant
dependence of FES on intermittent heating and HDD, and mild correlation with the
compactness of the building. Furthermore, there is a strong dependence of the SPB on HDD
(similar outcomes as for FES), the type of energy sources that construction uses, and the initial
investment capital. In contrast, there is no dependence of SPB on intermittent heating as well
as on compactness. Overall, variables of SPB (years) is scattered due to various factors
affecting the values (Figure 17).
Figure 17. Overall SPB outcome CE
UeT
DC
olle
ctio
n

42
5 Discussion
5.1 Analysis of the Compared Variables
Energy efficiency measures require significant investment. There are several indicators of
financial analysis using which one can conclude on its effectiveness; these include simple
payback, discounted payback, a discounted rate of return, profitability index, internal rate of
return, and others. In the given study, the simple payback of the investment allocated to the
energy efficiency project in Kazakhstan is assessed (Gorshkov et al. 2018). The main reason
for simple payback to be chosen is that it is the simplest way to evaluate and compare objects
to provide feedback as recommendations.
Simple payback is dependent on FES, tariffs, initial investment cost, and energy source. To
note, tariffs were not assessed directly in the dependence analysis. Instead, energy sources are
taken as a significant factor affecting the tariffs. It is because the tariffs directly depend on the
type of energy source used. Overall, the given study assessed factors impacting FES and SPB.
Dependence of FES on Intermittent Heating, Heating Degree Days and Compactness
There is a significant dependence of FES on the intermittent heating of the buildings (Figure
8Ошибка! Источник ссылки не найден.). For the positive outcome of the energy-saving
measures, a building should be under full exploitation. Hence, it is the reason for building
operating full time showing positive final energy savings.
Kazakhstan has the phenomena of high demand for the heating season due to its dry and
continental climate. The wintertime in the regions of central and northern parts are notably
characterized by temperature-dependent energy demand. From the analysis above (Figure 9),
final energy savings from heating degree days in the condition of 5000 to 7000 showed the
CE
UeT
DC
olle
ctio
n

43
highest final energy savings after the retrofit. This shows a relation that the colder regions have
higher final energy savings.
There was mild dependence of FES on the compactness of the building. Different geometric
properties affect the energy performance of the buildings, such as size, compactness, and shape.
The compactness of the building is one of the main features explaining the energy demand of
the building. Compactness explains the efficient use of building envelope enclosing a
particularly heated area (Parasonis, Keizikas, and Kalibatiene 2012). Buildings with smaller
external areas experience deceased energy loss. According to Hegger et al. (2008), buildings
with rectangular and square shapes perform the highest final energy conservation. Most of the
buildings in the project were not large (from one floor to four-floor buildings), square, or
rectangular shapes. Hence, compactness, specifically the buildings with a square or rectangular
shape and with a one to the four-floor area, most probably plays an influential role in final
energy saving after the retrofit.
Dependence of SPB on Intermittent Heating, Heating Degree Days and Compactness
Simple payback showed favorable values in the condition of heating degree days from 4000 to
7000, which is the same outcome as for FES dependence on HDD. However, there was only
mild dependence on the periodicity of the building operation, buildings operating full time have
slightly better outcomes than the structures working only on weekdays; this outcome coincides
with the results obtained for FES. Compactness did not show any correlation.
From this analysis, it can be observed that the factors which significantly impact FES, also
impact or slightly impact SPB value too, namely HDD in the range from 4000 to 7000, and
periodicity of the building operation (full time exploited buildings).
CE
UeT
DC
olle
ctio
n

44
Dependence analysis of SPB on Tariffs and Investment
Buildings in Kazakhstan uses various energy sources, and they have different prices,
accordingly. District heating showed a heterogeneous outcome because variables were
scattered, whereas coal and diesel showed the most favorable outcome for SPB (Figure 15).
There is no unified tariff system in the country (Figure 18), and different prices for energy and
heat generation are standard in Kazakhstan due to the various primary energy sources used with
distinct prices for each of them.
Figure 18. Tariffs for heating services in Kazakhstan
Source: Bogayeva 2018
Additionally, the district heating system requires major remodeling as it has the issue of high
energy loss. Even with the presence of energy management systems1 in the buildings using
1 Energy management system is the manual control of the heat supply
CE
UeT
DC
olle
ctio
n

45
district heating, responsible people do not apply the system correctly, and buildings are not
switched off when a building is not exploited, for instance, during weekends. This is one of the
reasons for district heating, showing scattered variables in Figure 15. The current level makes
it significantly hard to convey energy efficiency on existing buildings with the existing district
heating systems.
Furthermore, there is a factor of underheating in buildings. Some buildings could exploit a
building on a comfortable level without underheating, only after the energy efficiency
measures. Such cases substantially decrease the chances to observe the final energy savings
after the retrofit.
Dependence of SPB on initial capital investment showed (Figure 16) that the highest
concentration of lowest simple payback in years correlates with the low value of investment
from 0 to 30.000 KZT per m2.
Conclusion
In conclusion, simple payback is positively affected by high final energy savings, low
investments, and high tariffs. The analysis showed, there are positive energy savings after the
retrofit. Critically impacting factors on FES are HDD in the range from 4000 to 7000 and full
exploitation of buildings. SPB shows a positive dependence on HDD, with the highest values
achieved in regions with HDD from 4000 to 7000. Compactness showed a mild correlation
with FES, which means building with rectangular and square shapes and floor number from
one to four would benefit FES. There is a good SPB (ranging from 0 to 20 years) with the
investments in a range of 0 to 30.000 KZT per m2. However, overall, SPB did not show good
outcomes due to low tariffs for energy (low prices for energy sources). It is because each region
has different access to energy sources, and there are no unified energy prices for the heating
CE
UeT
DC
olle
ctio
n
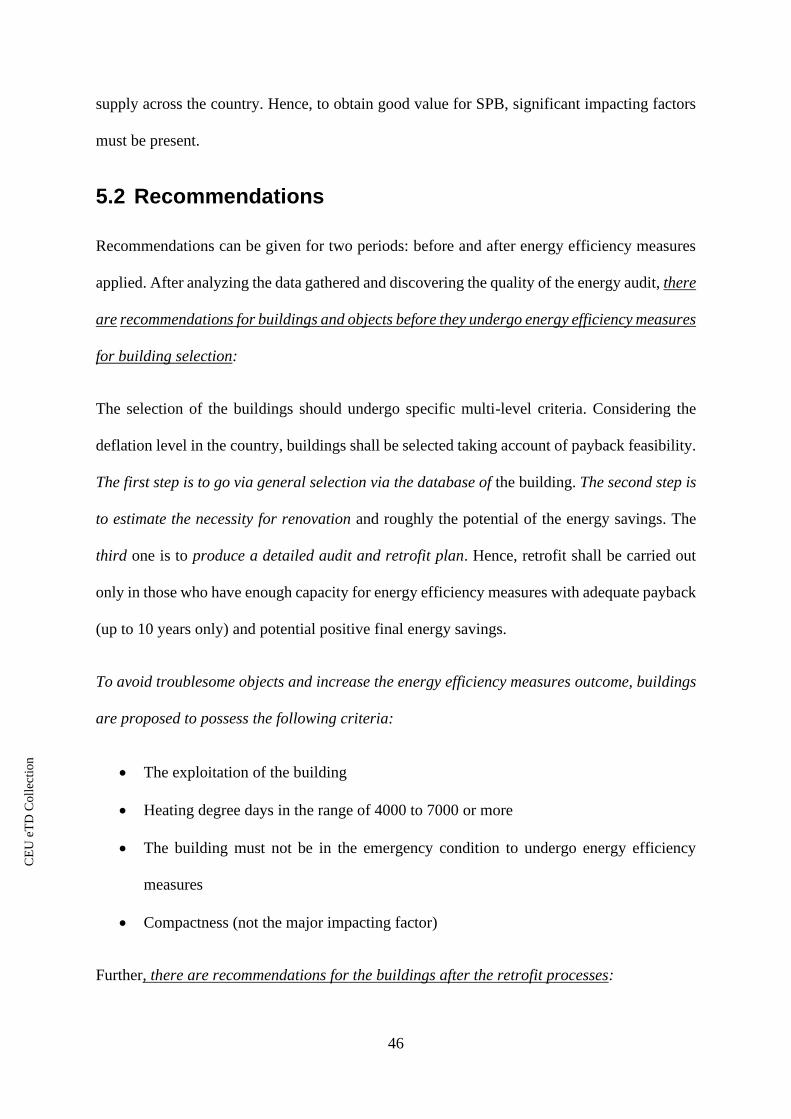
46
supply across the country. Hence, to obtain good value for SPB, significant impacting factors
must be present.
5.2 Recommendations
Recommendations can be given for two periods: before and after energy efficiency measures
applied. After analyzing the data gathered and discovering the quality of the energy audit, there
are recommendations for buildings and objects before they undergo energy efficiency measures
for building selection:
The selection of the buildings should undergo specific multi-level criteria. Considering the
deflation level in the country, buildings shall be selected taking account of payback feasibility.
The first step is to go via general selection via the database of the building. The second step is
to estimate the necessity for renovation and roughly the potential of the energy savings. The
third one is to produce a detailed audit and retrofit plan. Hence, retrofit shall be carried out
only in those who have enough capacity for energy efficiency measures with adequate payback
(up to 10 years only) and potential positive final energy savings.
To avoid troublesome objects and increase the energy efficiency measures outcome, buildings
are proposed to possess the following criteria:
• The exploitation of the building
• Heating degree days in the range of 4000 to 7000 or more
• The building must not be in the emergency condition to undergo energy efficiency
measures
• Compactness (not the major impacting factor)
Further, there are recommendations for the buildings after the retrofit processes:
CE
UeT
DC
olle
ctio
n

47
It shall be ensured that the buildings undergo a full regime of exploitation. Responsible bodies
of the building or sub-contractors shall show involvement and ensure to run the good-quality
energy-management, energy-monitoring system and submit adequate-quality energy reports.
Personnel needs to have a training session on how to use automated energy monitoring systems
correctly because it regulates the heating energy expenditure. Also, it should be obligatory for
buildings to have an energy passport after renovation.
After a comprehensive reading of the gathered data, there are other issues identified, and
recommendations are proposed:
Development of a General National Building Data Base or a National Energy Register would
help to provide the information on buildings across the country. This is to select the focus group
of buildings, by looking at the general criteria such as final energy consumption and availability
of minimum thermal protection.
There is no unified system of energy audit procedures. Hence, it is difficult to analyze data
from the audit reports. Reports have different terms for one concept, and vice versa, there could
be mixed meanings for one word used in several energy audit documents conducted by various
organizations. Hence, there should be a unified form for audit reports with methodology,
terminology, and results. Audit companies should have a centralized system of energy savings
calculation. It is recommended to have regular official certifications of energy audit
organizations to sustain the quality of the work of the employee and the organization.
In addition, building energy efficiency codes (standards) in Kazakhstan are not synchronized,
and such a set of codes leads to confusion. Hence it is advised to have one unified system of
building codes for the country.
CE
UeT
DC
olle
ctio
n

48
Kazakhstan has legislation in energy efficiency and energy conservation. However, it does not
sufficiently stimulate the companies involving in energy and heat production to invest or to be
part of the energy-efficient and energy-saving projects, as they are responsible for a large share
of energy loss. Because Kazakhstan is rich with fossil fuels, energy prices cannot be high.
Subsequently, tariffs for energy carriers and subsequent secondary sources such as heat and
electricity are low. Payback of the energy efficiency measures is directly affected by high prices
for tariffs. It is recommended to imply the restructuring of the tariffs system and increase the
prices to stimulate energy efficiency. It would stimulate a healthy payback environment for
energy efficiency measures and drive energy generating companies to invest in energy-saving
projects. It would involve elimination or restructuring the subsidiary system for energy and
heat distribution (Hafner and Tagliapietra, 2016). Besides, high prices for energy and heat is
the main tool to influence consumer’s behavior to lean on efficient energy usage.
5.3 Recommendations on Future Steps
Energy efficiency in households
The government has a challenging task to incentivize energy efficiency improvement, and the
project KEEP analyzed in this thesis adheres to this mission by analyzing the energy efficiency
in public buildings. Hence, the next step to implement such measures in the residential sector,
which is responsible for 30% of the energy consumption (Table 2). Inefficient use of resources
leads to economic losses estimated at USD4-8bln per year and may grow to USD14bln by
2030.
Hence, it is essential to consider gradual energy efficiency application in existing residential
buildings and to implement immediate energy efficiency measures on buildings which are
planning to be built and on buildings facing harsh winters (North and Central Kazakhstan).
The Ministry of Investment and Development of the Republic of Kazakhstan declared to annul
CE
UeT
DC
olle
ctio
n

49
over 180 building codes developed during the Soviet Union at the end of 2017. Buildings in
Kazakhstan was panned to be built following European standards and comply with recent
energy efficiency measure from 2020, which will increase the cost of new housing properties.
However, due to the COVID-19 and national economic constraints, such plans might be
delayed.
Furthermore, any retrofit process involving household/owner of the properties have additional
constraints to overcome. During the realization of the energy efficiency measures, people’s
behavior factor, and possible financial constraints of the owner, who is responsible for covering
or partially covering the energy efficiency measures, shall be considered.
Heat delivery points and plants facilities
There is enormous potential for energy efficiency by investing the heat-generating points. For
instance, investing in district heat-generating points, which is mostly generated from coal, has
the potential to reduce GHG emission and subsequent pollution. As known, pipes and
transmission networks are outdated, which lead to heat loss during transmissions as well as the
waste of primary energy source. In addition to the inefficient transmission pipes, there are
outdated power and heat plant facilities, which do not meet current emissions standards in the
country. To note, standards are less strict compared to the OECD countries and China. For
example, coal-fired power plants in Kazakhstan emit solid particles, which level is substantial
times above the EU limits. Thus, it is crucial to adopt more stringent standards for emissions
of sulfur dioxide (SO2) and nitrogen oxide (NOx), and particular matter from the power plants
considering the fact that energy demand is actively increasing. Coal, as a primary source for
heating in households (around 30%), is dynamically increasing up to 70% in rural areas.
Hence, it is recommended to consider the gradual replacement of heat transmission pipes to
reduce loss and stimulate a decrease in primary energy consumption. Second, it is
CE
UeT
DC
olle
ctio
n

50
recommended to introduce modern facilities on the plant stations for a long-term benefit to
reduce GHG emissions as well as reduce energy loss. Also, it is highly advised to consider the
standards regarding emissions from plant stations.
Domestic low carbon technologies
A lack of technologies hampers energy efficiency. Low carbon technologies diffusion into
society is necessary to achieve the energy demand for the future on an adequate scale with
sustained balance for present and future generations. Examples are the supply chain for energy
technologies such as insulation, thermostat, efficient windows, and lightning. The northern part
of Kazakhstan has the most extended heating season, around nine months of winter, which is
the focus for energy efficiency to improve the heating system and transmission loss.
Presumably, North Kazakhstan could be the place for pilot projects to produce and test low
carbon technologies.
Low carbon innovations on a large-scale follow the existing socio-technical systems. At the
same time, low-carbon innovations diffusion happens on existing barriers and active
resistance; for example, the absence of incentives in cities with cheap energy supply or
outdated facilities, where innovation diffusion is difficult. Low carbon innovations and low
carbon actions are expensive, and significant policies are driven by public concerns, such as
sustainability and climate change, rather than economic development. Hence, multi-
dimensional support is needed, such as policy support, the creation of incentives, calling
investors, and social pressure (Geels, Schwanen, Sorrell, Jenkins & Sovacool, 2018).
It is recommended to start low carbon innovations in places where it is highly deeded, for
example northern and central Kazakhstan. This would include including new technologies as
well as social behavior and organizational arrangements.
CE
UeT
DC
olle
ctio
n

51
6 Conclusion
Kazakhstan is an energy resource-rich country, and the economy is highly dependent on fossil
fuels and mineral resources. The country is recognized to be energy-intensive due to low prices
of energy resources as well as outdated technologies and facilities in the energy sector.
Kazakhstan set long-term goals to reduce GHG emission by 40% by 2050 as compared to 1990.
The current thesis provides an advanced understanding of the status of energy efficiency in the
buildings sector of Kazakhstan. The data for the analysis of the thesis is taken from the project
KEEP, which was initiated by the Government of Kazakhstan and the World Bank. The
analysis is dedicated to contributing to the improvement of energy efficiency in buildings,
specifically socially important buildings such as hospitals, kindergartens, orphanages, and
schools. They have different energy supply sources, including centralized district heating,
natural gas, coal, and diesel. Also, objects were selected from different parts of the country to
diversify the climatic conditions.
The analysis presented in this thesis identified some factors which should be taken into account
when one plans energy efficiency measures in Kazakh buildings:
1. Energy savings are significant, if the buildings are located in a cold climate (5000-7000
HDD), undergo full exploitation after the retrofit (i.e. do not have intermittent heating)
and have adequate compactness (including the shape and the outside envelope of the
building).
2. Simple payback of the retrofit is very much affected by tariffs of energy, as well as by
initial capital investment. One of the biggest challenges to implement energy efficiency
and energy conservation measures is that the incentives for such activities are not
enough, and one of the stimuli could be to increase energy tariffs.
CE
UeT
DC
olle
ctio
n

52
Following the analysis implemented the thesis provides recommendations to stimulate energy
efficiency measures in the country. First, high-quality audit services and unified reporting
system (online platform) of energy audits would increase the chances to implement high-
quality energy-saving measures. Second, the availability of the energy passport for buildings
as well as multi-level audits of the buildings would help understand which buildings should be
retrofitted first. And last, buildings must be under full control of the contractor and frequently
convey energy management system, which would help increase awareness of energy efficiency
and increase/support final energy savings.
Hence, the impacts of energy efficiency measures are affected by climate zone and how
frequently the building is used (exploitation). Based on the findings of this research, the thesis
contributes to energy efficiency measures implemented in Kazakhstan by giving
recommendations and pointed at the areas for further improvement. It provides
recommendations on energy audit procedures, prioritizes buildings to undergo energy
efficiency measures as well as on other policy actions.
CE
UeT
DC
olle
ctio
n

53
7 Reference List
Akorda.Kz. 2020. "The Strategy for Development of The Republic of Kazakhstan — Official
Site of The President of The Republic of Kazakhstan". 2020.
URL: http://www.akorda.kz/en/official_documents/strategies_and_programs.
Bardi, U. 2019. Peak oil, 20 years later: Failed prediction or useful insight? Energy Research
& Social Science, 48: 257-261. doi: 10.1016/j.erss.2018.09.022
Bashmakov, I. 2016. Improving the Energy Efficiency of Russian Buildings. Problems of
Economic Transition, 58(11-12): 1096-1128. doi: 10.1080/10611991.2016.1316099
Bogayeva, A. 2018. "Utilities Tariffs Will Be Reduced In Kazakhstan - Ministry Of National
Economy". Bulletin Of The Owner And Entrepreneur Of Housing And Communal Services.
https://gkhsp.kz/s-1-yanvarya-2019-goda-vo-vseh-regionah-kazahstana-budut-snizheny-
tarify-na-kommunalnye-uslugi-minnatsekonomiki/.
Burchardt, J., Pieper, C., Hilderbrandt, J., Hegnsholdt, E., Herhold, P., Frédeau, M., and Chau,
V. 2020. Climate Should Not Be the Virus’s Next Victim | BCG.
URL: https://www.bcg.com/publications/2020/coronavirus-climate-impact-green-
recovery.aspx?linkId=91270329&redir=true
Designing Buildings. 2019. Simple payback for energy savings URL:
https://www.designingbuildings.co.uk/wiki/Simple_payback_for_energy_savings
Dulac, J., Delmastro, C., and Abergel, T. 2019. Tracking buildings 2019. URL:
https://www.iea.org/reports/tracking-buildings-2019
CE
UeT
DC
olle
ctio
n

54
EBRD. 2019. "Renewable Energy In Kazakhstan". London: European Bank of Reconstruction
and Development. http://www.ebrd.com/documents/climate-finance/renewable-energy-in-
kazakhstan-.PDF?blobnocache=true.
Energy European Commission. 2016. EU Building Stock Observatory.
URL: https://ec.europa.eu/energy/topics/energy-efficiency/energy-efficient-buildings/eu-
bso_en#:~:text=The%20EU%20Building%20Stock%20Observatory,reliable%2C%20consist
ent%20and%20comparable%20data
European Bank for Reconstruction and Development. 2009. Electricity emission factors
review. Milano. URL: https://www.ebrd.com/downloads/about/sustainability/cef.pdf
Geels, F., Schwanen, T., Sorrell, S., Jenkins, K., and Sovacool, B. (2018). Reducing energy
demand through low carbon innovation: A socio-technical transitions perspective and thirteen
research debates. Energy Research & Social Science, 40: 23-35. doi:
10.1016/j.erss.2017.11.003
Gorshkov, A, N Vatin, P Rymkevich, and O Kydrevich,. 2018. "Payback Period Of
Investments In Energy Saving". Magazine of Civil Engineering, 2. doi: 10.18720/MCE.78.5.
Hallock, J., Wu, W., Hall, C., and Jefferson, M. 2014. Forecasting the limits to the availability
and diversity of global conventional oil supply. Validation. Energy, 64: 130-153. doi:
10.1016/j.energy.2013.10.075
Mafred, H., and Tagliapietra, S., 2016. Toward A New Euro-Mediterranean Energy Roadmap:
Setting The Key Milestones Simone Tagliapietra Regulation And Investment I Energy Markets:
Solutions For The Mediterranean, 101-116. doi:10.1016/B978-0-12-804436-0.00006-0.
CE
UeT
DC
olle
ctio
n

55
Hegger, M. Matthias, F., Martin, Z., and Stark. 2012. Energy Manual: Sustainable
Architecture. 1st ed. Basel: Birkhauser.
IEA. 2020. Energy Efficiency Indicators, Paris. URL: https://www.iea.org/reports/energy-
efficiency-indicators-2020
Janoska, P. 2019. "Energy Transitions Indicators – Analysis - IEA". IEA. URL:
https://www.iea.org/reports/energy-transitions-indicators.
Kerimray, A., Azbanbayev E., Kenessov B., Plotitsyn P., Alimbayeva D., and Karaca, F., 2020.
"Spatiotemporal Variations and Contributing Factors of Air Pollutants in Almaty, Kazakhstan".
Aerosol and Air Quality Research, 20 (6): 1340-1352. doi:10.4209/aaqr.2019.09.0464.
Kim, Y., and Sun, C. 2017. The Energy-Efficient Adaptation Scheme for Residential Buildings
in Kazakhstan. Energy Procedia, 118: 28-34. doi: 10.1016/j.egypro.2017.07.005
McCollum, D., Zhou, W., Bertram, C., de Boer, H., Bosetti, V., and Busch, S. 2018. Energy
investment needs for fulfilling the Paris Agreement and achieving the Sustainable
Development Goals. Nature Energy, 3(7): 589-599. doi: 10.1038/s41560-018-0179-z
Ministry of Energy of the Republic of Kazakhstan with the support of UNDP/GEF project.
2015. Development of Kazakhstan’s 7th National Communication and Biennial Report. Astana.
URL:
https://unfccc.int/files/national_reports/biennial_reports_and_iar/submitted_biennial_reports/
application/pdf/br-text_eng_kz.pdf
Ministry of Industry and New Technologies of the Republic of Kazakhstan. 2020. On approval
of the "Energy Saving - 2020" Program: Ob utverzhdenii programmi “Energospebergenii –
2020”. URL:
CE
UeT
DC
olle
ctio
n

56
https://tengrinews.kz/zakon/pravitelstvo_respubliki_kazahstan_premer_ministr_rk/promyishl
ennost/id-P1300000904/
Ministry of Justice: Agency of the Republic of Kazakhstan for Construction of Housing and
Communal Services. 2011. "On Approval of The Program for The Modernization of Housing
and Communal Services of The Republic of Kazakhstan for 2011-2020". URL:
https://tengrinews.kz/zakon/pravitelstvo_respubliki_kazahstan_premer_ministr_rk/jilischno_
kommunalnoe_hozyaystvo/id-P1100000473
Josifas, P., Keizikas, A., and Kalibatiene, D., 2012. "The Relationship Between the Shape Of
A Building And Its Energy Performance". Architectural Engineering and Design
Management 8 (4): 246-256. doi:10.1080/17452007.2012.675139.
Pohoryles, D.A., C. Maduta, D.A. Bournas, and L.A. Kouris. 2020. "Energy Performance Of
Existing Residential Buildings In Europe: A Novel Approach Combining Energy With Seismic
Retrofitting". Energy And Buildings 223: 110024. doi:10.1016/j.enbuild.2020.110024.
Saeed Almuma, M. 2016. Understanding Building Compactness Entity, Definition and
Concept of Assessment. International Transaction. Journal of Engineering, Management, &
Applied Sciences & Technologies 7(3): 165-175. URL: http://TUENGR.COM/V07/165 .pdf
Strategy2050.Kz Information Agency 2020. ADDRESS BY THE PRESIDENT OF THE
REPUBLIC OF KAZAKHSTAN, LEADER OF THE NATION, N.A. NAZARBAYEV
STRATEGY KAZAKHSTAN 2050 NEW POLITICAL COURSE OF THE ESTABLISHED
STATE. URL: https://strategy2050.kz/en/.
Tulegenov M. 2016. Kazakhstan-2016. International Atomic Energy Agency. URL:
https://www-
CE
UeT
DC
olle
ctio
n

57
pub.iaea.org/MTCD/Publications/PDF/cnpp2018/countryprofiles/Kazakhstan/Kazakhstan.ht
m
Tverberg, G. 2020. The Oil Drum | What happens when energy resources deplete? URL:
http://theoildrum.com/node/6574
UNFCC. 2015. URL: https://unfccc.int/process-and-meetings/the-paris-agreement/nationally-
determined-contributions-ndcs
United Nations Department of Economic and Social Affairs. 2019. Growing at a slower pace,
world population is expected to reach 9.7 billion in 2050 and could peak at nearly 11 billion
around 2100. URL: https://www.un.org/development/desa/en/news/population/world-
population-prospects-2019.html
United Nations: Report of the World Commission on Environment and Development. 1987.
Brundtland Commission: Our common future. URL:
https://sustainabledevelopment.un.org/content/documents/5987our-common-future.pdf
U.S. Energy Information Administration. 2020. Units and calculators explained degree days.
URL: https://www.eia.gov/energyexplained/units-and-calculators/degree-days.php
Virta.Global.com. 2018. "What Is Decarbonization And Why Do We Need It?" Blog. Electric
Cars & Charging, EV Market & Trends. URL: https://www.virta.global/blog/decarbonization.
CE
UeT
DC
olle
ctio
n

58
8 Appendices
CE
UeT
DC
olle
ctio
n