environmental impacts assess- ment and economic efficiency
TRANSCRIPT

Environmental Impacts Assess-ment and Economic Efficiency of Phong Phu 2 Solar Power Plant in Vietnam
Linh Nguyen BACHELOR’S THESIS May 2019 Degree Programme in Energy and Environmental Engineering

ABSTRACT
Tampereen ammattikorkeakoulu Tampere University of Applied Sciences Degree Programme in Energy and Environmental Engineering LINH NGUYEN: Environmental Impacts Assessment and Economic Efficiency of Phong Phu 2 Solar Power Plant in Vietnam Bachelor's thesis 30 pages May 2019
Renewable energy is a new trend in energy industry, especially in a developing country as Vietnam. In order to meet the country’s high energy demand, the gov-ernment of Vietnam has approved the project of Phong Phu 2 solar power plant in Binh Thuan Province, Vietnam. In this thesis, two sustainability aspects are determined: environmental impacts and economic efficiency. In order to assess the environmental impacts, a group of specialists has come to the project location and monitored environmental con-dition as well as construction activities of the power plant. The capital asset pric-ing model was applied to calculated economic factors (net present value and benefit – cost ratio) and analyzed to see if the project is profitable or not. In conclusion, Phong Phu 2 solar power plant does not show any disadvantages to the environment. Possibility of soil erosion and water pollution can be pre-vented by regular monitoring and maintenance. The project is sustainable through three aspects: environment, society and economy.
Key words: renewable energy, solar power, energy in Vietnam

CONTENTS
1 INTRODUCTION .................................................................................. 5
1.1 Project overview: Phong Phu 2 solar power plant .......................... 6
1.2 PV technologies ............................................................................. 9
1.3 Environmental impact assessment (EIA) ..................................... 11
1.4 Economic efficiency ..................................................................... 12
2 AIMS ................................................................................................... 14
3 MATERIALS AND METHODS ............................................................ 15
3.1 Environmental Impacts Assessment ............................................ 15
3.2 Economic Efficiency ..................................................................... 15
3.2.1 Materials’ advantages and energy output of Phong Phu 2 solar power plant assessment ............................................ 15
3.2.2 Economic analysis .............................................................. 16
4 RESULTS AND DISCUSSION ........................................................... 18
4.1 Environmental Impacts ................................................................. 18
4.1.1 Air pollution ......................................................................... 18
4.1.2 Noise pollution .................................................................... 19
4.1.3 Soil erosion and contamination .......................................... 20
4.1.4 Water usage and pollution .................................................. 20
4.1.5 Loss of biodiversity ............................................................. 21
4.1.6 Human health and well-being ............................................. 22
4.1.7 Waste ................................................................................. 22
4.2 Economic Efficiency ..................................................................... 23
4.2.1 PV modules comparison ..................................................... 23
4.2.2 PV performance estimation ................................................ 26
4.2.3 Economic analysis .............................................................. 27
4.2.4 Other advantages ............................................................... 28
5 CONCLUSION .................................................................................... 29
REFERENCES ........................................................................................ 30

GLOSSARY
B/C Benefit – cost ratio
dB Decibel
CAPM Capital asset pricing model
CERs Certified Emissions Reductions
DC Direct current
EPA Environmental Protection Agency
ha Hectare
kWh/m2/yr Kilowatt hours per square metre per year
kV Kilovolt
kWp Kilowattpeak
IC Invested capital
MVA Mega-volt-ampere
MW Megawatt
MWh Megawatt hours
µg Microgram
NPV Net present value
O3 Ozone
PV Photovoltaic
PM Particulate matter
ppb Parts per billion
ppm Parts per million
STC Standard test conditions
TWh Terawatt hours
USD United States Dollar
VND Vietnamese Dong
W Watt
WACC Weighted average cost of capital
W/m2K Watts per square metre per degree Kelvin

1 INTRODUCTION
Nowadays, since traditional energy sources such as coal and fuel are running
out, human is changing direction to use renewable energy instead, especially
solar energy. Every year, the sun provides a huge amount of energy to our planet.
Theoretically, solar radiation that hits the earth in an hour can meet the global
energy demand in a year (Marsh 2019). Solar energy would generate zero-pollu-
tion, including greenhouse emission and air pollution (EIA 2018).
Vietnam is a South – East Asian country with a rapid economy growth as well as
fast rate of industrialization, therefore this country’s energy demand is increasing
from 86 TWh (Terawatt hours) in 2010 to approximately 632 TWh in 2030. Ac-
cording to Vietnam Briefing (2019), total installed capacity of Vietnam in 2018
was nearly 48 MW, which means the country needs 6000 – 7000 MW installed
capacity more per year to meet the demand.
Currently, the main energy sources of Vietnam are coal-fired and hydropower,
which accounted for 71.9% in total power source. They are followed in order by
gas fired power (17.8%), diesel with renewables (5.8%) and oil fired power
(3.3%). Therefore, the government planned to develop renewable energy in order
to increase the amount of power output and decrease harmful environmental im-
pacts generated by other non-renewable sources, such as coal and fuel (Vietnam
Briefing 2019). Figure 1 below shows the potential capacity with actual installed
capacity of renewable sources in Vietnam in 2018.
The actual installed amount of solar energy is smaller comparing to other
sources, although Vietnam has a potential of developing solar energy as most
parts of it belong to tropical climatic zone. Especially, the south part of Vietnam
has an abundance of solar radiation, which varies from 1607 to 2045 kWh/m2 on
horizontal surface and from 1241 to 1534 kWh/m2 direct normal irradiation per
year (The World Bank n.d.). Hence, Phong Phu 2 solar power plant was built to
contribute to high energy demand of the country and decrease environmental
pollution.

FIGURE 1. Potential capacity with actual installed capacity of renewable sources
in Vietnam in 2018 (Vietnam Investment Review 2018)
1.1 Project overview: Phong Phu 2 solar power plant
Phong Phu 2 solar power plant, which belongs to SOLARCOM Company, has an
installed capacity of 42 MWp. The plant is located in Phong Phu Commune, Tuy
Phong District, Binh Thuan Province, Vietnam. This project costs approximately
51.664 million USD (about 1164.666 billion VND) and will start to operate in June
2019 (IEE 2017).
Binh Thuan Province located between three big economical areas of Vietnam,
with potential of natural resources as dynamics of oil and gas industry, titan min-
ing and energy industry. The government has approved a project of making Binh
Thuan become an energy centre of the country in 2015 (IEE 2017).
The project located in a 60 ha area land in the south of Phong Phu commune.
Flat terrain with gentle slope is suitable for building a solar plant. It can be seen
through the common height of measuring points in figure 2. There were only a
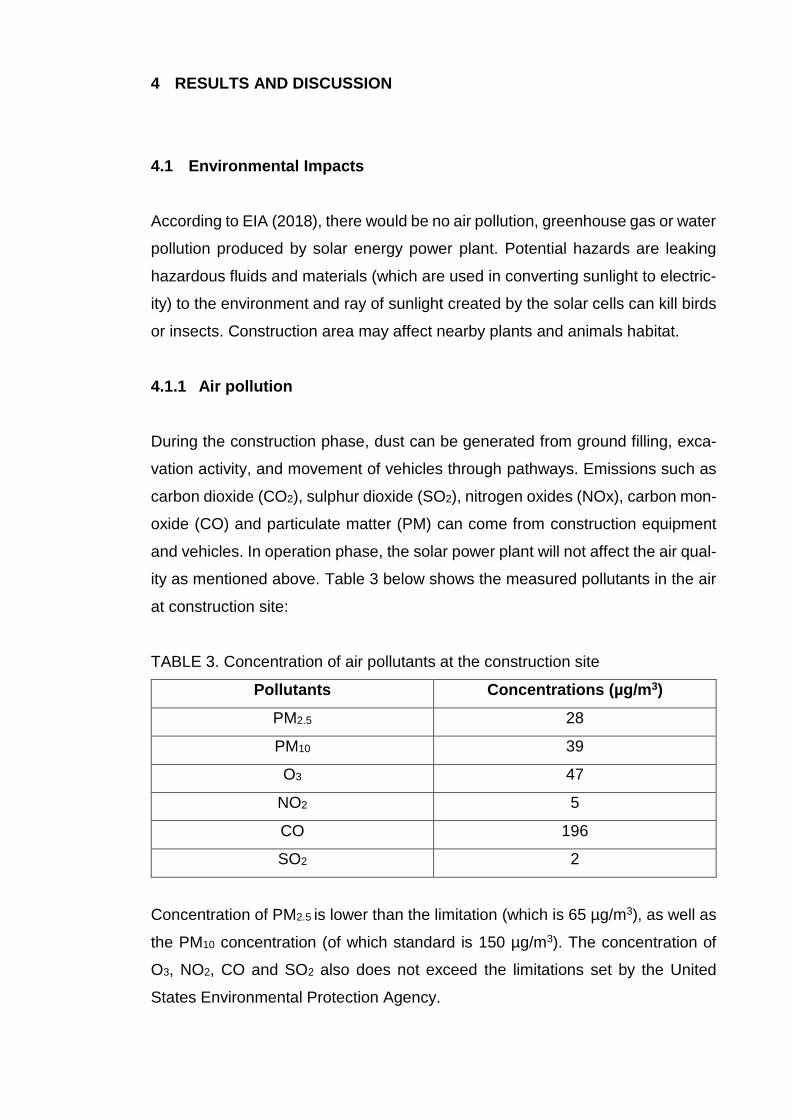
small amount of industrial crops (Acacia and Cashew), as well as grass and
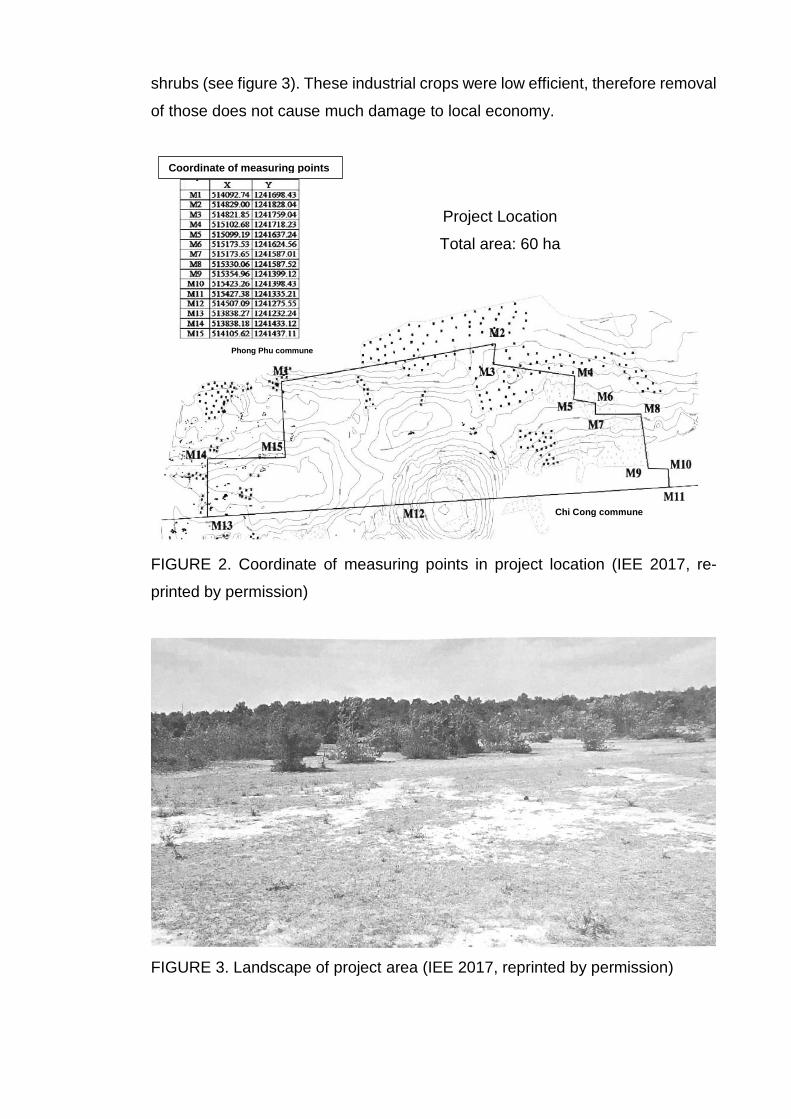
shrubs (see figure 3). These industrial crops were low efficient, therefore removal
of those does not cause much damage to local economy.
FIGURE 2. Coordinate of measuring points in project location (IEE 2017, re-
printed by permission)
FIGURE 3. Landscape of project area (IEE 2017, reprinted by permission)
Project Location
Total area: 60 ha
Coordinate of measuring points
Phong Phu commune
Chi Cong commune

Based on the data taken from NASA Prediction of Worldwide Energy Resource,
the difference between the highest temperature (27.5 0C) and the lowest temper-
ature (23.5 0C) in a year at the project location is quite small (figure 4). The solar
irradiation is quite high, which varies from 8.5 to over 10 kWh/m2 in recent years
(figure 5). The climate condition at project location is suitable for the operation of
solar energy.
FIGURE 4. Average temperature at project location from 2007 to 2017 (These
data were obtained from the NASA Langley Research Center (LaRC) POWER
Project funded through the NASA Earth Science/Applied Science Program)
FIGURE 5. Thermal infrared (longwave) radiative flux at project location from
2007 to 2017 (These data were obtained from the NASA Langley Research Cen-
ter (LaRC) POWER Project funded through the NASA Earth Science/Applied Sci-
ence Program)

By using Meteonorm software, the sun’s orbit at the project location is shown in
figure 6 below.
FIGURE 6. Solar paths at Phong Phu 2 solar project location (IEE 2017, reprinted
by permission)
Absorption surface of solar panels faces to the South, with an angle of 120 in
order to get the highest solar radiation. There were no objects in project area that
can block solar panels from sunlight.
1.2 PV technologies
There are many types of photovoltaic modules on the market, however, this work
focused on three widely-used modules: monocrystalline silicon (c-Si), polycrys-
talline silicon (poly-Si) and thin-film.
Monocrystalline silicon solar cell is one of the first solar modules was made in
renewable energy industry. It is made from pure silicon crystal, which does not
absorb the sunlight so well, therefore c-Si modules need to be thick and hard in

order to capture the light. However, monocrystalline silicon modules have an ef-
ficiency range from 15% to 25%, which is higher than many other solar module
(Dirjish 2012).
Polycrystalline silicon cells were made by melting raw silicon and formed it into
square-shape (Energy Informative n.d.). This type of modules has an efficiency
varies from 13% to 16%. The reason is each poly-Si cell has many crystals inside,
which prevents electrons from moving fast. However, a study has shown 100
micron-thicked poly-Si can absorb sunlight as well as a monocrystalline silicon
that is three times thicker. Poly-Si is quite durable as its lifespan is more than 25
years (Neville 1995; PennState n.d.).
Thin-film solar cells can be made from different materials: amorphous silicon,
cadmium telluride, copper indium gallium selenide or organic photovoltaic cells.
Thin-film cells include micron-thickness crystalline layers, which makes them
lighter than other solar cells. However, the efficiency of thin-film solar cells is quite
low, which varies from 7% to 13%. That means, in order to get a certain amount
of power, thin-film modules require more installed space as well as more equip-
ment (Tonkin 2018; Energy Informative n.d.).
Solar modules which is used in Phong Phu 2 solar power plant will be chosen in
these three types of solar cell. Table 1 below shows the advantages and disad-
vantages of monocrystalline silicon, polycrystalline silicon and thin-film.

TABLE 1. Solar modules comparison
Solar panel types Advantages Disadvantages
Monocrystalline silicon
(c-Si)
• Highest efficiency
rates, which varies
from 15% to 25%
• Requires less area
than others
• Longest lifespan
• Most expensive type
• Easily broken: if a part
of a c-Si module is
covered by dust or
shadow, it can be bro-
ken
• Most of it cannot be
recycled
• Cannot perform well in
cold temperature
Polycrystalline silicon
(poly-Si)
• Simple manufacturing
process
• The amount of waste
is less than c-Si
(many parts can be
recycled)
• Performs worse in
high temperature
than c-Si
• Low efficiency: 13% -
16%
• Requires large space
to install
Thin-film
• Light and easy to in-
stall
• More flexible
• Does not strongly af-
fected by high tem-
perature and shadow
or dust
• Lowest efficiency
• Short lifespan
• Requires so much
space to install, due
to its low efficiency
• High cost of PV
equipment
1.3 Environmental impact assessment (EIA)
Environmental impact assessment (EIA) is a process used to predict influences
of a project on the environment during planning and decision making process, as
well as identify suitable methods to reduce harmful impacts on the environment
(Raj 2018). Based on the EIA results, competent authorities can give construction

permit for the project. In Vietnam, environmental impact assessment requirement
has been set in the Law of Environmental Protection in 2005.
In an EIA process, there are four basic steps: screening, scoping, reviewing and
completion. Based on different projects, more activities can be added to EIA pro-
cess, however, they are all used to achieve the same goals: determining environ-
mental impacts and alternatives for a project (Komínková 2008). Figure 7 below
illustrates the structure of an EIA process:
FIGURE 7. General structure of an EIA process
In this thesis, a short environmental impact assessment of Phong Phu 2 solar
power plant was given, including environmental consequences and project alter-
natives, which will be considered by the authorities of Vietnam in decision making
stage.
1.4 Economic efficiency
Economic efficiency presents a state of economic aspect of a project or a com-
pany, in which the input value is minimised, while the profit of the project is max-
Development project
Preliminary operation
Description of the project
Ecological survey of the project site
Determination, measurement &
prediction of impacts
Mitigating measures
Contingency measures (risks & emergency plans)
Environmental impact assessment
Submission to the authority

imised. Economic efficiency can be analysed by different factors, such as em-
ployment rates, financial internal rate of return (FIRR) or interest rates (Investopia
2018).
In this thesis, net present value (NPV) and benefit – cost ratio (B/C) are used to
study the economic efficiency of Phong Phu 2 solar power plant. Net present
value can be get by subtracting the cash outflow from the cash inflow in a period
of time. If NPV is positive, the project is profitable and if NPV is lower than 0, the
project may get a net loss (Investopia 2019a). In order to see the relationship
between the benefits and cost of a project, a benefit – cost ratio is calculated. If
B/C of a project is greater than 1, which means the benefit is bigger than the cost,
the project is expected to get positive net present value. On the other hand, when
B/C is smaller than 1, the relative cost is more than the benefit, which means the
project will not bring back any profit (Investopia 2019b).
Besides, a weighted average cost of capital (WACC) is also used to estimate the
economic efficiency of Phong Phu 2 solar power plant, particularly the cost of
capital. This factor presents the interest a company earns for each dollar it
spends. Therefore, WACC can be seen as an indicator to see if the project is
worth invested or not (Investopia 2019c). WACC is calculated by using capital
asset pricing model (CAPM). CAPM is the most-widely used model in finance to
link the systematic risk to the expected return of investment (Investopia 2019d).

2 AIMS
In order to make Phong Phu 2 solar power plant project become sustainable,
three following aspects need to be considered: environment, society and econ-
omy. This thesis focuses on environmental impacts and economic efficiency of
the power plant.
Through this work, the Government of Vietnam can see the potential of this solar
project in minimizing environmental pollution and enhancing the country’s econ-
omy.

3 MATERIALS AND METHODS
3.1 Environmental Impacts Assessment
The environmental impacts of Phong Phu 2 solar power plant are assessed dur-
ing construction and operation phases. Available mitigation measures are also
suggested in this part.
Monitoring has been made by a group of environmental specialists, which lasted
for 5 days. Air, water, and soil quality, as well as other environmental aspects
were spectated during this field trip. Furthermore, construction activities of the
power plant was monitored and compared to national standards.
Meteonorm software was used to design and calculate the total amount of solar
radiation on horizontal surface. Data was collected from NASA Prediction of
Worldwide Energy Resource, Photovoltaic Geographical Information System
(PVGIS) and local centres for hydro – meteorological forecasting.
3.2 Economic Efficiency
3.2.1 Materials’ advantages and energy output of Phong Phu 2 solar
power plant assessment
In order to assess the economic efficiency of this power plant, the advantages of
chosen materials were determined by using Photovoltaic Geographical Infor-
mation System. Through this, different factors that might affect the power output
of Phong Phu 2 solar power plant were evaluated.
The average energy in output of PV is calculated by using the following formula:
𝐸 = 𝐴 ∙ 𝑟 ∙ 𝐻 ∙ 𝑃𝑅 (1)
In which:
E - energy in output (kWh)
A - total absorption area of PV modules (m2)

r - PV module’s efficiency (%)
H - total solar radiation on horizontal surface (kWh/m2)
PR - performance ratio, coefficient for losses = 0,84229
(Photovoltaic software n.d.)
The number of PV modules needed was calculated by dividing the expected total
energy system output by the PV module’s power:
𝑁𝑢𝑚𝑏𝑒𝑟 𝑜𝑓 𝑃𝑉 𝑚𝑜𝑑𝑢𝑙𝑒𝑠 = 𝑇𝑜𝑡𝑎𝑙 𝑒𝑛𝑒𝑟𝑔𝑦 𝑜𝑢𝑡𝑝𝑢𝑡 (𝑊)
𝑃𝑉 𝑚𝑜𝑑𝑢𝑙𝑒′𝑠 𝑝𝑜𝑤𝑒𝑟 (𝑊) (2)
3.2.2 Economic analysis
In order to analyse the economic efficiency of this solar power plant project, two
following factors were assessed: net present value (NPV) and benefit – cost ratio
(B/C). Besides, in order to estimate the cost of capital in this project, a weighted
average cost of capital (WACC) was calculated by using formula (3):
𝑊𝐴𝐶𝐶 = 𝑔 ∙ 𝑟𝑑 + (1 − 𝑔) ∙ 𝑟𝑒 (3)
In which:
rd - the cost of debt
re - the cost of equity
g - the proportion of finance that equals to debt/(debt + equity)
By applying CAPM model, the cost of equity (re) is calculated by using formula
(4):
𝑟𝑒 = 𝑟𝑓 + 𝛽 ∙ (𝑟𝑚 − 𝑟𝑓) (4)
In which:
rf - the risk-free rate
β - the measure of relative risk of the company
rm - the expected return on the market
(Frontier Economics 2005)
Table 2 below shows related information of Phong Phu 2 solar power plant which
was used to analyse the economic efficiency of the project.

TABLE 2. Input data for economic efficiency analysing
Input data Value
Construction time 1 year
Lifespan 25 years
IC 1164,666 billion VND (51,994 million USD)
Proportion of debt/(debt + equity) 70%
Debt interest Foreign loan: 4%/year
Domestic loan: 9%/year
Installed capacity 42 MWp
Energy output 1st year: 69,233 MWh, lost coefficient:
0,5% per year
Operation and maintenance fee 2% of equipment fee
Certified Emissions Reductions
(CERs)
0,5 USD/tCO2
Enterprise income tax First 4-year: 0%
Next 9-year: 5%
Next 2-year: 10%
Others: 20%
NPV of this project is expected to be positive; if not, it means the project does not
bring any profit and should be stopped. NPV can be calculated by formula (5)
below:
𝑁𝑃𝑉 =𝐹𝑢𝑡𝑢𝑟𝑒 𝑣𝑎𝑙𝑢𝑒 − 𝑜𝑢𝑡𝑓𝑙𝑜𝑤
(1 + 𝑊𝐴𝐶𝐶)𝑡 (5)
In which,
Future value - net cash in a particular period
t - number of time period
(Investopia 2019e)
To find out the suitable price of electricity output, a factor called break-even point
is determined. At this point, total cost equals to total revenue. Or it can be seen
through the following formula (6):
𝐵𝑟𝑒𝑎𝑘 − 𝑒𝑣𝑒𝑛 𝑞𝑢𝑎𝑛𝑡𝑖𝑡𝑦 =𝐹𝑖𝑥𝑒𝑑 𝑐𝑜𝑠𝑡𝑠
𝑆𝑎𝑙𝑒𝑠 𝑝𝑟𝑖𝑐𝑒 𝑝𝑒𝑟 𝑢𝑛𝑖𝑡 − 𝑉𝑎𝑟𝑖𝑎𝑏𝑙𝑒 𝑐𝑜𝑠𝑡 𝑝𝑒𝑟 𝑢𝑛𝑖𝑡 (6)
(CFI n.d.)
4 RESULTS AND DISCUSSION
4.1 Environmental Impacts
According to EIA (2018), there would be no air pollution, greenhouse gas or water
pollution produced by solar energy power plant. Potential hazards are leaking
hazardous fluids and materials (which are used in converting sunlight to electric-
ity) to the environment and ray of sunlight created by the solar cells can kill birds
or insects. Construction area may affect nearby plants and animals habitat.
4.1.1 Air pollution
During the construction phase, dust can be generated from ground filling, exca-
vation activity, and movement of vehicles through pathways. Emissions such as
carbon dioxide (CO2), sulphur dioxide (SO2), nitrogen oxides (NOx), carbon mon-
oxide (CO) and particulate matter (PM) can come from construction equipment
and vehicles. In operation phase, the solar power plant will not affect the air qual-
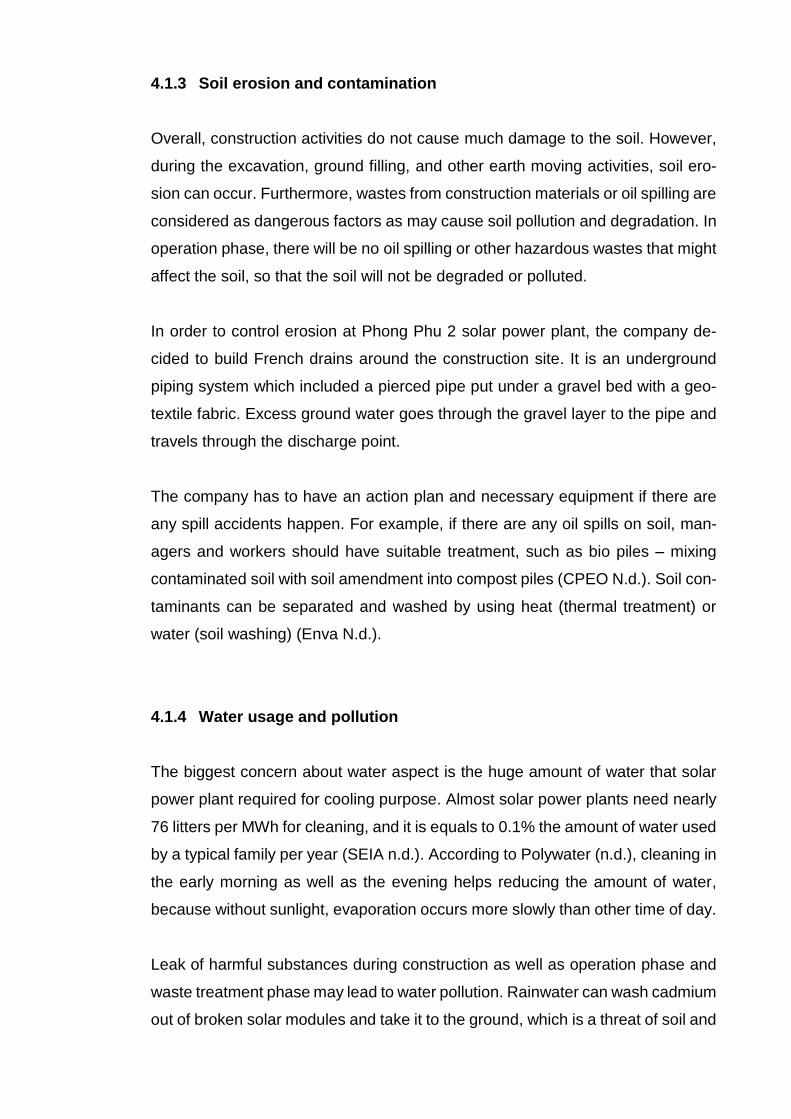
ity as mentioned above. Table 3 below shows the measured pollutants in the air
at construction site:
TABLE 3. Concentration of air pollutants at the construction site
Pollutants Concentrations (µg/m3)
PM2.5 28
PM10 39
O3 47
NO2 5
CO 196
SO2 2
Concentration of PM2.5 is lower than the limitation (which is 65 µg/m3), as well as
the PM10 concentration (of which standard is 150 µg/m3). The concentration of
O3, NO2, CO and SO2 also does not exceed the limitations set by the United
States Environmental Protection Agency.

In order to minimize the dust, vehicles should run under a speed limitation and
be used as less as possible. Trucks which are used to transport soft yielding
materials (e.g. sand and soil) should be covered in order to prevent dust blowing.
Sprinkling can be applied to reduce the dust.
4.1.2 Noise pollution
During the construction phase, there would be noise generated from ground fill-
ing, excavation activity, concrete foundation installation and transportation. The
construction site is far away from the residential area, therefore only workers are
affected by the noise.
The major noise sources on construction site include background noise, material
handling, earth moving and other construction equipment such as compressed
air blower, power saw and electric drill. According to LHSFNA (2014), earth mov-
ing equipment such as front end loader, back hoe or truck has an operation sound
level range from 79 dB to 103dB, which contributes the greatest number of noise
hazards on construction worksites. Besides, pile driver, pneumatic breaker and
hydraulic breaker create bigger noise, which varies between 82 dB and 111 dB.
In operation phase, noise which comes from inverters, transformers, substation
and transmission lines is under the standards, which is 90 dB at workers ear and
65 dB at property line (LHSFNA 2014). Furthermore, noise generated by trans-
formers can be heard only in a range between 1 and 2 meters. Besides, the power
plant does not cause any noise at night.
All equipment and machines should be maintained frequently and minimized their
uses in order to prevent noise pollution. Workers must be equipped with hearing
protection devices. According to eLCOSH (N.d.), highest noise-reductions equip-
ment in the world is earmuffs, and the second one is foam earplugs. Workers
should not work more than 8 hours in the construction site with the noise of con-
struction equipment.
4.1.3 Soil erosion and contamination
Overall, construction activities do not cause much damage to the soil. However,
during the excavation, ground filling, and other earth moving activities, soil ero-
sion can occur. Furthermore, wastes from construction materials or oil spilling are
considered as dangerous factors as may cause soil pollution and degradation. In
operation phase, there will be no oil spilling or other hazardous wastes that might
affect the soil, so that the soil will not be degraded or polluted.
In order to control erosion at Phong Phu 2 solar power plant, the company de-
cided to build French drains around the construction site. It is an underground
piping system which included a pierced pipe put under a gravel bed with a geo-
textile fabric. Excess ground water goes through the gravel layer to the pipe and
travels through the discharge point.
The company has to have an action plan and necessary equipment if there are
any spill accidents happen. For example, if there are any oil spills on soil, man-
agers and workers should have suitable treatment, such as bio piles – mixing
contaminated soil with soil amendment into compost piles (CPEO N.d.). Soil con-
taminants can be separated and washed by using heat (thermal treatment) or
water (soil washing) (Enva N.d.).
4.1.4 Water usage and pollution
The biggest concern about water aspect is the huge amount of water that solar
power plant required for cooling purpose. Almost solar power plants need nearly
76 litters per MWh for cleaning, and it is equals to 0.1% the amount of water used
by a typical family per year (SEIA n.d.). According to Polywater (n.d.), cleaning in
the early morning as well as the evening helps reducing the amount of water,
because without sunlight, evaporation occurs more slowly than other time of day.
Leak of harmful substances during construction as well as operation phase and
waste treatment phase may lead to water pollution. Rainwater can wash cadmium
out of broken solar modules and take it to the ground, which is a threat of soil and

water pollution, especially after natural disasters as tornadoes, storms or earth-
quakes (Forbes 2018). If wastewater of the plant is not treated well, it would bring
hazardous chemicals to surrounded water bodies (e.g. nearby lake and stream)
and cause harmful effects to plants, animals and human. There is a case in
China: a solar plant of Jinko Solar Holding Co. diffused hydrofluoric acid into the
nearby river and killed many animals living there. Pigs which were raised in the
local farms also died because farmers had used contaminated water taken from
that river to clean their livestock (Mulvaney 2014). In order to prevent risks, the
power plant should have proper wastewater treatment plan.
4.1.5 Loss of biodiversity
In the area of Phong Phu 2 solar power plant, there were only few trees were
affected. This area was an empty land, only some shrubs and few weeds used to
live there. Hence, this project does not cause much damage to vegetation. After
construction phase, in order to diversify the grassland, it is recommended to use
sheep grazing at low stocking density instead of chemical to prevent soil and
water pollution (Montag, Parker & Clarkson 2016).
Some bird species living around the construction area such as White-rumped
Shama (Copsychus malabaricus), Swift (Apodidae) and Sparrow (Passeridae)
might be affected by construction and operation activities. Birds might see solar
panels as large water bodies and results in a faint or death after hitting those
panels. Furthermore, birds can die because of overheating when they fly to
standby focal points or central receiver. Glare disturbance caused by reflection
of panels’ surface. Insects are easily attracted by the light coming from the power
plant, as well as the birds which hunt those insects (Smit n.d.). According to a
study researched by McCrary et al. (1984), about 6 birds die yearly and hundreds
of insects die hourly because of solar power plant.
According to Turney and Fthenakis (2011), in comparison to coal mining, solar
power plant requires less soil removal, which is easier to recover the soil and
ecosystem. Fortunately, the power plant does not locate in any birds’ migration
routes, which helps minimizing bird death potential. In order to reduce the birds’

death, solar modules are equipped with antireflection coats (ARC), which not only
help increasing the efficiency of the cells, but also minimize the visual effects
(Swatowska et al. 2011).
4.1.6 Human health and well-being
Due to a reduction in pollutants comparing to traditional thermal power plants in
Vietnam, Phong Phu 2 solar power plant brings good impacts to human health.
People are less exposed to mercury, cadmium, particulates and other hazardous
chemicals than traditional power generation sources in Vietnam.
According to Turney and Fthenakis (2011), concentration of mercury (Hg) re-
leased by solar power is about 0,1g Hg GWh-1, which is much more less than
coal (15g Hg GWh-1). Air pollutants such as NOx and SO2 are also minimized,
which helps decreasing diseases like asthma, pneumonitis and bronchial symp-
toms (WHO 2018).
Phong Phu 2 solar powerplant is expected to not create any bad visual effects for
locals, because it is located quite far from residential areas.
4.1.7 Waste
In order to transfer sunlight to electricity, some hazardous chemicals such as
cadmium telluride (CT) and copper indium selenide (CIS) are used. These sub-
stances can harm the environment, as well as human health if they are not con-
trolled properly during the manufacturing and disposal process (Thoubboron
2018). However, cadmium is usually used in thin-film PV, not the polycrystalline
silicon used in Phong Phu 2 solar power plant, therefore its impacts are mini-
mized.
In manufacturing process, silicon tetrachloride is produced as a by-product, which
can cause skin damages (burns), lung disease related to air pollution and hydro-
chloric acid (HCl) release (Thoubboron 2018). In order to prevent silica dust, air

quality in the power plant area should be monitored frequently and workers
should be equipped with personal protective equipment such as gas mask and
gloves. By-products can be reused, recycled or led through pollution control
methods (Prakash et al. 2015).
According to Professor Dustin Mulvaney (2015), approximately 90% of PV mod-
ules are made from a type of glass, which includes cadmium, antimony, lead and
plastics. Therefore, it is impossible to recycle this glass as usual. In a crystalline
PV module, there might be up to hundred grams of lead. These materials usually
end up in landfills, in which lead (as well as cadmium) can contaminate the
groundwater. A domestic recycling network should be developed in order to en-
sure safe recycling of PV modules.
Wastewater comes from cooling and cleaning activities for solar panels or from
workers’ daily activities is stored in septic tank and transported to nearby treat-
ment plants.
4.2 Economic Efficiency
In this part, two main aspects were considered: efficiency of PV modules and
benefit of the power plant. Efficiency of PV modules was determined through
comparison with other types of module, as well as lifespan calculation. On the
other hand, benefit of the project, which is shown by net present value and benefit
– cost ratio, was analysed to see if it is possible when applying the price that is
set by the Government of Vietnam.
4.2.1 PV modules comparison
In this work, crystalline silicon (c-Si), polycrystalline silicon (poly-Si) and thin-film
were compared to pick the most suitable module which should be used in Phong
Phu 2 solar power plant.
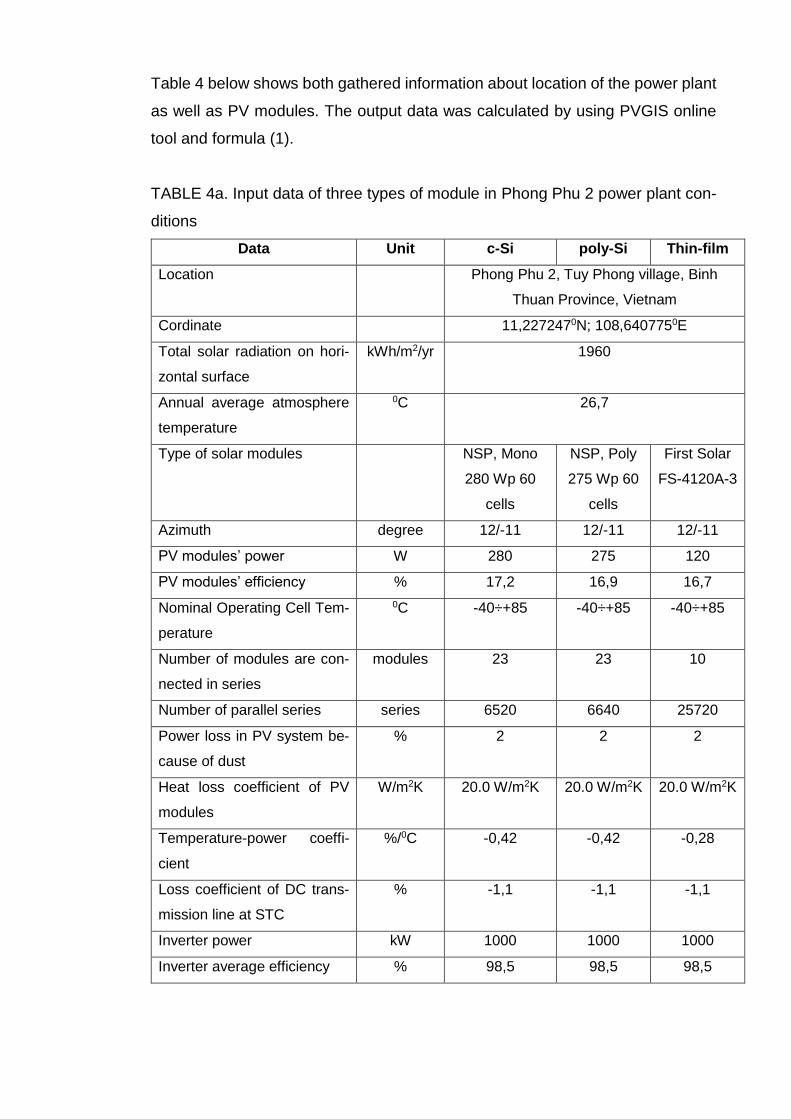
Table 4 below shows both gathered information about location of the power plant
as well as PV modules. The output data was calculated by using PVGIS online
tool and formula (1).
TABLE 4a. Input data of three types of module in Phong Phu 2 power plant con-
ditions
Data Unit c-Si poly-Si Thin-film
Location Phong Phu 2, Tuy Phong village, Binh
Thuan Province, Vietnam
Cordinate 11,2272470N; 108,6407750E
Total solar radiation on hori-
zontal surface
kWh/m2/yr 1960
Annual average atmosphere
temperature
0C 26,7
Type of solar modules NSP, Mono
280 Wp 60
cells
NSP, Poly
275 Wp 60
cells
First Solar
FS-4120A-3
Azimuth degree 12/-11 12/-11 12/-11
PV modules’ power W 280 275 120
PV modules’ efficiency % 17,2 16,9 16,7
Nominal Operating Cell Tem-
perature
0C -40÷+85 -40÷+85 -40÷+85
Number of modules are con-
nected in series
modules 23 23 10
Number of parallel series series 6520 6640 25720
Power loss in PV system be-
cause of dust
% 2 2 2
Heat loss coefficient of PV
modules
W/m2K 20.0 W/m2K 20.0 W/m2K 20.0 W/m2K
Temperature-power coeffi-
cient
%/0C -0,42 -0,42 -0,28
Loss coefficient of DC trans-
mission line at STC
% -1,1 -1,1 -1,1
Inverter power kW 1000 1000 1000
Inverter average efficiency % 98,5 98,5 98,5

TABLE 4b. Calculated data of three types of module in Phong Phu 2 power plant
conditions
Data Unit c-Si poly-Si Thin-film
Total amount of modules modules 149960 152720 357200
Radiation absorption area
of PV modules
m2 243967 248257 257184
Required land area m2 50000 50000 55000
Total PV power kWp 41989 41998 41971
Total output power kW 37621 37647 38957
Amount of inverter inverters 40 40 40
Amount of transformer
0,4/22 kV 2,5 MVA
transformers 20 20 20
Amount of transformer
22/110 kV 25 MVA
transformers 2 2 2
Average energy in output of
PV
MWh/yr 69,275 69,233 72,408
Net power production MWh/yr 66,839 66,795 69,859
Energy yield kWh/kWp.yr 1650 1648 1725
Power efficiency/ Perfor-
mance
% 83,05 82,98 86,85
As can be seen in the table above, crystalline silicon (c-Si) would bring a better
performance than polycrystalline silicon modules. However, it costs 0,03 $/Wp
more when using c-Si than using poly-Si. While thin-film brings best performance
(greater output energy, energy yield and power efficiency), it costs more money
than other types due to increasing number of modules and required area. In ad-
dition, total area of designed power plant is 60 ha, so thin-film modules would
take too much land area. Therefore, in this case, poly-Si must be the most suita-
ble modules for Phong Phu 2 solar power plant.

4.2.2 PV performance estimation
According to Jordan and Kurtz (2012), most of PV modules lose approximately
0.5% efficiency of power output after each operating year. The histogram below
shows the degradation rate of poly-Si technology.
The efficiency decreases 0,5% per year, that means after 20 years of operation,
the performance of PV modules is approximately 90% of the original one. Be-
sides, other effects such as partial shadowing, dust and dirt also affects the en-
ergy output (European Commission 2017).
According to calculation results in Table 1, average energy in output of poly-Si is
69,233 MWh. In the favourable climate condition of Phong Phu 2, loss coefficient
is supposed to be 0,5%. Figure 8 below shows estimated energy output in the
next 25 years.
FIGURE 8. Estimated energy output of Phong Phu 2 solar power plant in next 25
years
As can be seen in the figure above, in 2044, the energy output of Phong Phu 2
solar power plant might be only 61,3 MWh. In order to extend the life of PV mod-
ules, physical damage such as scratches caused by trees and bushes has to be
minimized. Besides, solar panels also need to be cleaned and maintained regu-
larly to avoid dust or dirt.

4.2.3 Economic analysis
By using formula (3) and (4), WACC was calculated for both cases: foreign loan
and domestic loan.
TABLE 5. WACC of Phong Phu 2 solar power plant project
Foreign loan Domestic loan
WACC 5,35% 8,24%
Break-even analysis was considered to get the fall-back price, which makes the
company does not get profit nor loss. The price was calculated when CERs is
applied or not.
TABLE 6. Fall-back price of electricity (US Cent/kWh)
Foreign loan Domestic loan
With CERs 6,770 8,960
Without CERs 6,795 8,986
To reach break-even point, sell price of electricity is 6,77 – 8,96 cent/kWh when
CERs is applied, and 6,795 – 9,986 cent/kWh without CERs. That means when
the electricity which generated by Phong Phu 2 solar power plant is sold with the
calculated fall-back price, there would be no profit for the project.
The Government of Vietnam has set the tariff for solar projects, which is 9,35 US
cents/kWh (Vietnam Briefing 2019). In both cases, with CERs and without CERs,
net present value and benefit-cost ratio of this project were calculated by using
formula (5):
TABLE 7. Financial factors in case 1: CERs applied
Foreign loan Domestic loan
NPV (million USD) 19,28 1,59
B/C 1,471 1,043

TABLE 8. Financial factors in case 2: no CERs
Foreign loan Domestic loan
NPV (million USD) 19,58 1,44
B/C 1,466 1,039
In both cases, B/C ratio is greater than 1, which means the project has the pos-
sibility to gain profit. For example, in case 1, when CERs is applied and loans
come from foreign bank, B/C ratio is 1,471. The company can gain $1,5 benefits
for each $1 spent. When the project gets foreign loan and applies CERs, it would
get maximum benefit.
4.2.4 Other advantages
Phong Phu 2 solar power plant can provide energy for local area, which helps
reducing money for electricity transmission. Furthermore, it helps decreasing en-
vironmental pollution, people do not have to pay for healthcare (with diseases
caused by air pollution) and the government can save money from cleaning the
environment.
Phong Phu 2 solar power plant would create jobs for local people. Similarly, social
evils such as drug addiction and gambling are reduced. In addition, Phong Phu 2
solar power plant was built to meet the high demand of energy in Vietnam, espe-
cially in Binh Thuan Province. It plays an important role in development of econ-
omy and society.

5 CONCLUSION
Overall, as many other solar projects, Phong Phu 2 solar power plant does not
generate any pollution during its operation phase. Construction phase of the plant
may cause dust, noise and soil erosion because of excavation activity or trans-
portation. Sprinkling and French drain might be applied to decrease the amount
of dust and prevent soil erosion. Antireflection coats (ARC) was equipped on solar
cells, which can minimize the birds and insects death due to solar modules.
Dangerous by-product (silicon tetrachloride) and other chemicals can cause pol-
lution and disease when they are spread in the air, water bodies or soil. The
company should monitor the air quality as well as other environmental index to
ensure environmental quality meet the standards.
Polycrystalline silicon modules was chosen to be installed into Phong Phu 2 solar
power plant because it brings back high energy output while requiring a reason-
able area, as well as its low cost. According to estimation, the performance of
Phong Phu 2 solar power plant is approximately 90% of the original one after 20
years of operation. Regular maintenance and proper cleaning methods can help
extending the life of PV modules.
With the tariff of solar projects set by the government of Vietnam, which is 9,35
US cents/kWh, the project is profitable. Moreover, Phong Phu 2 solar power plant
not only helps reducing environmental pollution, but also decreasing healthcare
fee that people have to pay as a result. Therefore, this project is sustainable when
considering on three aspects: environment, society and economy.

REFERENCES
CFI. N.d. What is Break Even Analysis? Read on 19.05.2019. https://corporate-financeinstitute.com/resources/knowledge/modeling/break-even-analysis/ Clean Green Energy. N.d. Crystalline Silicon Solar Cell Technology. Read on 22.05.2019. https://cleangreenenergyzone.com/crystalline-silicon-solar-cell-technology/ CPEO. N.d. Bio-Piles. Read on 29.04.2019. http://www.cpeo.org/techtree/ttdescript/biopil.htm
Dirjish, M. Electronic Design. 2012. What’s The Difference Between Thin-Film And Crystalline-Silicon Solar Panels? Published 16.05.2012. Read on 22.05.2019. https://www.electronicdesign.com/power-sources/what-s-differ-ence-between-thin-film-and-crystalline-silicon-solar-panels#2 EIA. 2018. Solar Energy and the Environment. Published 31.08.2018. Read on 23.04.2019. https://www.eia.gov/energyexplained/?page=solar_environment ELCOSH. N.d. Controls to reduce noise in construction: Noise perimeter zones. Read on 29.04.2019. http://elcosh.org/document/1403/d000470/controls-to-re-duce-noise-in-construction%3A-noise-perimeter-zones.html Energy Informative. N.d. Which Solar Panel Type is Best? Mono- vs. Polycrystal-line vs. Thin Film. Read on 23.05.2019. https://energyinformative.org/best-solar-panel-monocrystalline-polycrystalline-thin-film/ Enva. N.d. How Contaminated Soil Affects Construction Projects. Read on 29.04.2019. https://enva.com/case-studies/contaminated-soil-in-construction-projects EPA. N.d. NAAQS Table. Read on 21.05.2019. https://www.epa.gov/criteria-air-pollutants/naaqs-table European Commission. 2017. Overview of PVGIS data sources and calculation methods. Updated 22.09.2017. Read on 18.05.2019. http://re.jrc.ec.eu-ropa.eu/pvg_static/methods.html#! Forbes. Shellenberger, M. 2018. If Solar Panels Are So Clean, Why Do They Produce So Much Toxic Waste? Published 23.05.2018. Read on 21.05.2019. https://www.forbes.com/sites/michaelshellenberger/2018/05/23/if-solar-panels-are-so-clean-why-do-they-produce-so-much-toxic-waste/#c693d44121cc Frontier Economics. 2005. The cost of capital for GTS: A report for DTE. Frontier Economics Ltd, London. IEE (Institute of Energy and Environment Vietnam). 2017. Điều chỉnh bổ sung: Quy hoạch phát triển điện lực tỉnh Bình Thuận giai đoạn 2011 – 2015 có xét đến 2020. Xây dựng nhà máy điện mặt trời Phong Phú 2. Hanoi, Vietnam.

Investopia. 2018. Economical efficiency. Updated 06.06.2018. Read on 25.05.2019. https://www.investopedia.com/terms/e/economic_efficiency.asp Investopia. 2019a. Net Present Value (NPV). Updated 24.04.2019. Read on 25.05.2019. https://www.investopedia.com/terms/n/npv.asp Investipia. 2019b. Benefit-Cost Ratio – BCR Definition. Updated 11.04.2019. Read on 24.05.2019. https://www.investopedia.com/terms/b/bcr.asp Investopia. 2019c. Weighted Average Cost of Capital – WACC Definition. Up-dated 17.05.2019. Read on 25.05.2019. https://www.in-vestopedia.com/terms/w/wacc.asp Investopia. 2019d. Capital Asset Pricing Model (CAPM). Updated 02.04.2019. Read on 27.05.2019. https://www.investopedia.com/terms/c/capm.asp Investopia. 2019e. What is the formula for calculating net present value (NPV) in Excel? Updated 02.02.2019. Read on 19.05.2019. https://www.in-vestopedia.com/ask/answers/021115/what-formula-calculating-net-present-value-npv-excel.asp Jordan, D. C. & Kurtz, S. R. 2012. Photovoltaic Degradation Rates – An Analytical Review. National Renewable Energy Laboratory. U.S. Department of Energy, 6 – 16. Komínková, D. 2008. Environmental Impact Assessment and Application – Part 2. Encyclopedia of Ecology. LHFSNA. 2014. Controlling Noise on Construction Sites. Read on 12.04.2019. https://www.lhsfna.org/LHSFNA/assets/File/bpguide%202014.pdf
Marsh, J. EnergySage. 2018. What is solar energy? Published on 19.01.2019.
Read on 22.05.2019. https://news.energysage.com/what-is-solar-energy/
McCrary, M.D.; McKernan, R.L.; Flanagan, P.A.; Wagner, W.D. 1984. Wildlife interactions at Solar One. Final report. Published on 01.01.1984. Los Angeles County Natural History Museum Foundation, CA (USA). Montag, H., Parker, G. & Clarkson, T. 2016. The effects of solar farm on local biodiversity: A comparative study. Clarkson and Woods and Wychwood Biodiver-sity. Mulvaney, D. 2014. Solar Energy Isn’t Always as Green as You Think. Published 13.11.2014. Read on 22.05.2019. https://spectrum.ieee.org/green-tech/solar/so-lar-energy-isnt-always-as-green-as-you-think Mulvaney, D. 2015. Act now to handle the coming wave of toxic PV waste. Solar Industry Magazine 8(6), 17–20.

Neville, R. C. 1995. Solar Energy Conservation: The Solar Cell. 2nd edition. Col-lege of Engineering & Technology, Northern Arizona University, Flagstaff, AZ, U.S.A. PennState. N.d. Types of PV technology and recent innovations. Read on 23.05.2019. https://www.e-education.psu.edu/eme812/node/608 Photovoltaic software. N.d. How to calculate the annual solar energy output of a photovoltaic system? Read on 17.05.2019. https://photovoltaic-soft-ware.com/principle-ressources/how-calculate-solar-energy-power-pv-systems Prakash, A., Rao, U., Saxena, S. & Rayabagi, S. 2015. Challenges in manufac-turing and end-of-life recycling or disposal of solar PV panels. IOSR Journal of Electrical and Electronics Engineering, 84. Polywater. N.d. Water Consumption in PV Panel Cleaning. Read on 21.05.2019. http://www.polywater.com/wp-content/uploads/pdf/Intl-blog-Water-Use-Indi-aCA.pdf Raj, P. 2018. Environment impact assessment. Published 06.06.2018. Read on 24.05.2019. https://www.slideshare.net/pramodgpramod/environment-impact-assessment-100998492 SEIA. N.d. Water use management. Read on 21.05.2019. https://www.seia.org/initiatives/water-use-management Smit, H. A. N.d. Guidelines to minimise the impact on birds of Solar Facilities and Associated Infrastructure in South Africa. Birdlife South Africa. http://www.the-eis.com/data/literature/Solar%20guidelines_version2.pdf Swatowska, B., Stapinski, T., Drabczyk, K. & Panek, P. 2011. The role of antire-flective coatings in silicon solar cells – the influence on their electrical parameters. https://www.researchgate.net/publication/236201697_The_Role_of_Antireflec-tion_Coatings_in_Silicon_Solar_Cells_-_The_Influence_on_Their_Electri-cal_Parameters The World Bank. N.d. Vietnam - Solar Irradiation And PV Power Potential Maps. Read on 22.05.2019. https://datacatalog.worldbank.org/dataset/vietnam-solar-ir-radiation-and-pv-power-potential-maps Thoubboron, K. 2018. Energy Sage. Are solar panels toxic to the environment? Published 01.02.2018. Read on 23.04.2019. https://news.energysage.com/solar-panels-toxic-environment/ Turney, D. & Fthenakis, V. 2011. Environmental impacts from the installation and operation of large-scale solar power plants. Renewable and Sustainable Energy Reviews 15, 3261–3270. Vietnam Briefing. 2019. Renewables in Vietnam: Current Opportunities and Fu-ture Outlook. Published 01.03.2019. Read on 19.05.2019. https://www.vietnam-briefing.com/news/vietnams-push-for-renewable-energy.html/

Vietnam Investment Review. 2018. Vietnam Renewable Energy Report 2018. Published 11.10.2018. Read on 22.05.2019. https://www.vir.com.vn/vietnam-re-newable-energy-report-2018-63034.html WHO. 2018. Ambient (outdoor) air quality and health. Published 02.05.2018. Read on 21.05.2019. https://www.who.int/news-room/fact-sheets/detail/ambient-(outdoor)-air-quality-and-health