data report on coastal water quality monitoring …. itpcl_mar_2019.pdfdata report on coastal water...
TRANSCRIPT
DATA REPORT ON COASTAL WATER QUALITY MONITORING
FOR ITPCL POWER PROJECT (March -2019)
CONTINUOUS MONITORING OF SEA WATER IN
AND AROUND THE ITPCL POWER PROJECT AT PARANGIPETTAI, CUDDALORE DISTRICT
Monthly Report (March -2019)
Submitted by
Dr. P. MURUGESAN Asst. Professor & Principal Investigator
Annamalai University
Research Scholars
Dr. P. Damotharan (Research Associate)
Mr. V. Bharathidasan
Mr. P. Partha Sarathy
Mr. R. Punniyamoorthy
CAS IN MARINE BIOLOGY FACULTY OF MARINE SCIENCES
ANNAMALAI UNIVERSITY
Parangipettai, 608502 Tamil Nadu
March-2019
DATA REPORT ON COASTAL WATER QUALITY MONITORING
FOR ITPCL POWER PROJECT (March-2019)
CAS IN MARINE BIOLOGY
1 RESULTS OF COASTAL WATER QUALITY PARAMETERS
1.1 Sampling Details
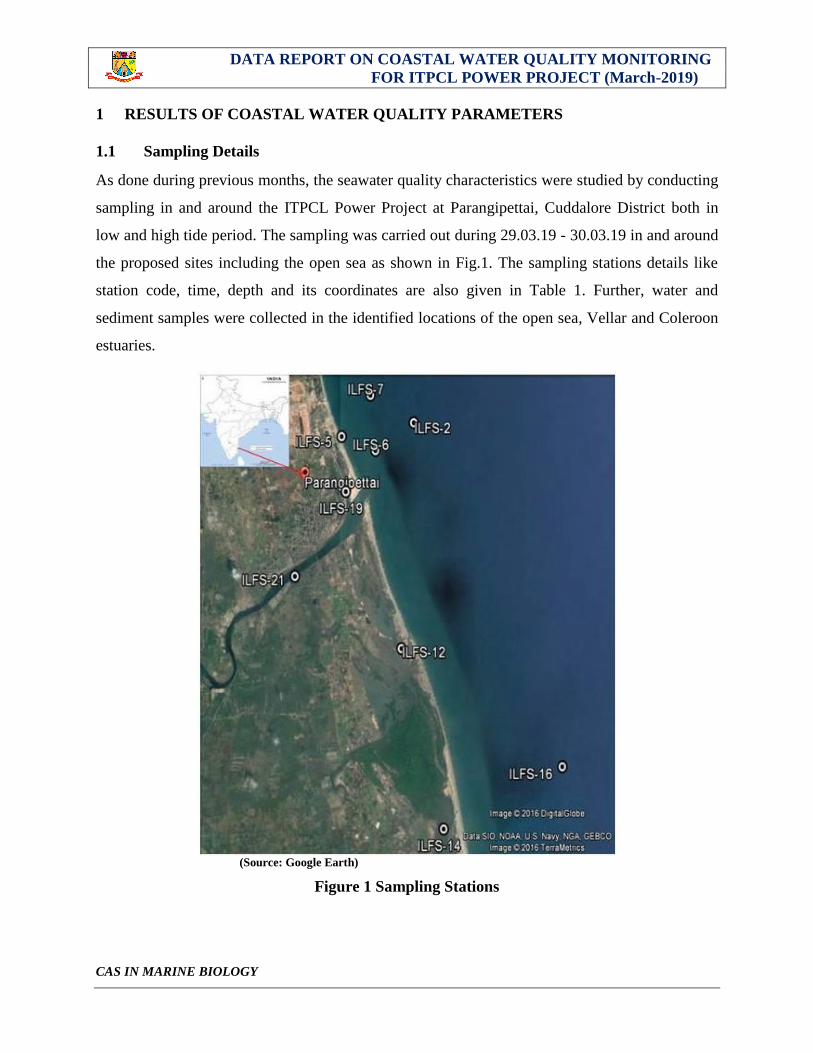
As done during previous months, the seawater quality characteristics were studied by conducting
sampling in and around the ITPCL Power Project at Parangipettai, Cuddalore District both in
low and high tide period. The sampling was carried out during 29.03.19 - 30.03.19 in and around
the proposed sites including the open sea as shown in Fig.1. The sampling stations details like
station code, time, depth and its coordinates are also given in Table 1. Further, water and
sediment samples were collected in the identified locations of the open sea, Vellar and Coleroon
estuaries.
(Source: Google Earth)
Figure 1 Sampling Stations
DATA REPORT ON COASTAL WATER QUALITY MONITORING
FOR ITPCL POWER PROJECT (March-2019)
CAS IN MARINE BIOLOGY
TABLE 1 Details of sampling Stations
Sl. No. Station Code Time GPS
Coordinates
1 ILFS-2-HT (Dredged soil dumping) 6.40AM 11°31'27.94"N
79°47'50.77"E 2 ILFS-2-LT 2.05PM
3 ILFS-5-HT (Intake) 6.58AM 11°31'13.31"N
79°46'14.37"E 4 ILFS-5-LT 2.28PM
5 ILFS-6-HT (Outfall) 7.15AM 11°30'58.78"N
79°46'59.61"E 6 ILFS-6-LT 2.50PM
7 ILFS-7-HT (North Break Water) 7.30AM 11°31'56.49"N
79°46'52.76"E 8 ILFS-7-LT 3.15PM
9 ILFS-16-HT (Off shore parallel to Mangroves-2) 7.45AM 11o25’29.13"N
79o51’10.08"E 10 ILFS-16-LT 3.40PM
11 ILFS-12-HT (Pichavaram Mangroves extension from
Vellar-2) 8.05AM 11°27'32.11"N
79°47'34.79"E
12 ILFS-12-LT 1.15PM
13 ILFS-14-HT (Pichavaram Mangroves extension from
Coleroon-2) 9.15AM 11°24'23.92"N
79°48'31.59"E
14 ILFS-14-LT 12.30PM
15 ILFS-19-HT (Annan kovil landing center) 8.30AM 11° 30' 15.75"N
79° 46'20.07"E 16 ILFS-19-LT 1.30PM
17 ILFS-21-HT (Pappa canal) 8.45AM 11°28'47.22"N
79°45'12.15"E 18 ILFS-21-LT 1.48PM
MATERIALS AND METHODS
Water and Sediment Sampling
Water samples
The water samples were collected from the selected stations considering tidal influences,
discharge and non-discharge points. Subsurface water samples were collected at a depth of 0.5
meter using Niskin water sampler. For accurate measurements of the in situ properties and

DATA REPORT ON COASTAL WATER QUALITY MONITORING
FOR ITPCL POWER PROJECT (March-2019)
CAS IN MARINE BIOLOGY
composition of seawater, proper sampling is of utmost importance. It is essential to ensure that
the sampling is contamination free and all the samples were appropriately sub-sampled and
preserved to avoid/minimize changes in the water composition during storage. After sampling,
adequate care was taken for measurements of hydrographic, chemical and biological properties
of sea water in coastal and near-shore waters.
Prior to sampling, the sampler and sampling containers were acid washed with 1N HCl in
the laboratory. Sample bottles were rinsed thoroughly with the water and after that the samples
were collected.
For dissolved oxygen, the samples were fixed by employing Winkler’s reagent on board
vessel itself and after fixing the samples were kept in shade until analysis. Temperature and pH
in water were measured immediately after collection. The water samples were filtred before
analysis. Trace metal samples were collected in acid-washed and pre-cleaned high density
polyethylene (HDPE) bottles. Disposable, clean gloves were used while sampling and handling
samples for trace metals. All samples were kept in a cool condition away from light to avoid
evaporation. All samples (for trace metals) were filtered immediately using 0.22 µM pore size
filter paper and acidify the pH till 2 by adding SUPRAPURE NITRIC ACID and stored in metal
free plastic bags till analysis, so as to avoid contamination.
Sediment samples
Sediment samples were stored in metal free plastic bags for trace metals and in aluminum
foils for organic constituents. These samples were stored in ice boxes for transportation and put
to dry in an electric oven at low temperatures (about 60 degrees C) in clean glass petri-dishes.
DATA REPORT ON COASTAL WATER QUALITY MONITORING
FOR ITPCL POWER PROJECT (March-2019)
CAS IN MARINE BIOLOGY
Collection of Sediment Samples (Grabs and Corer)
Van Veen Grab with a sampling area of 0.1 m2 was employed as a standard sediment
sampler, since it is (i) an efficient sampler for the range of soft surface sediments encountered in
the near shore area, (ii) reliable and simple to operate and (iii) widely applied, which allows data
comparison with other marine areas.
Preservation and processing of samples
Storage and Preservation of Samples: It should be understood that the concentration of
dissolved constituent is bound to change with time, due to the biological activity of the
microorganisms present in the seawater. Trace quantity are vulnerable to adsorption/desorption
process, therefore, they were analyzed immediately. Where immediate analysis is not possible,
the recommended method include freezing the samples at -80 degree C. A quick note for sample
collection and preservation procedures is given below.
Temperature, Salinity and pH analysis
The physical parameters such as temperature, salinity and pH were measured in-situ in
the field. The subsurface temperature was measured with a mercury thermometer (0.02C
accuracy) and the pH was measured by a calibrated pH pen (pH ep-3 model). Salinity was
estimated using a Hand Refractometer (Atago, Japan). Water samples collected for dissolved
oxygen estimation were transferred carefully to BOD bottles. The DO was immediately fixed
and brought to the laboratory for further analysis.
Preservation and Laboratory Analysis
After collection, the samples were immediately cooled to 4C and then brought to the
laboratory in an insulated thermocool box. In the laboratory, water samples were filtered through
DATA REPORT ON COASTAL WATER QUALITY MONITORING
FOR ITPCL POWER PROJECT (March-2019)
CAS IN MARINE BIOLOGY
Whatman GF/C filter paper and analysed for organic matter and other nutrients. Unfiltered
samples were used for the estimation of total nitrogen and total phosphorus. All the analyses
were carried out by adopting Standard procedures for samples of aquatic origin. Briefly, the
methodology for each analysis is given below:
Nitrate and Nitrite
The nitrate and nitrite content of samples were analysed by following the methods
described by Strickland and Parsons (1972). The nitrite was estimated from highly coloured azo
dye formed by the addition of N (1-Napthyl) ethylene diamine di hydro-chloride and
sulfanilamide into the solution was then measured at 543 nm in a spectrophotometer. The same
procedure was followed for the estimation of nitrate. For this, nitrate was reduced to nitrite by
passing the sample through copper coated cadmium column. The values are expressed in mol of
Nitrogen/l
Inorganic Phosphate
The single solution mixed reagent procedure developed by Murphy and Riley (1962) was
followed for the estimation of dissolved inorganic phosphate levels in water samples. This
involves the conversion of phosphate into phosphomolybdic acid, which was then reduced to
molybdinum blue color complexes and then the intensity of colour was measured at 882 nm in a
spectrophotometer. The calculated values are expressed in µmol of Phosphorus/l.
Total Phosphorus
The Total Phosphate in samples was estimated by adopting the method described by
Menzel and Corwin (1964). This procedure involves the conversion of organically bound
phosphate into inorganic phosphate by wet oxidation of samples with potassium persulphate in
an Autoclave for 30 min at 15 lbs pressure. The converted inorganic phosphate was then
DATA REPORT ON COASTAL WATER QUALITY MONITORING
FOR ITPCL POWER PROJECT (March-2019)
CAS IN MARINE BIOLOGY
estimated by using the method described by Murphy and Riley (1962). The subtraction of
original dissolved inorganic phosphate from total phosphate yielded the organic phosphate in the
water sample. The calculated value is expressed in µmol of Phosphorus/l.
Reactive Silicate
The reactive silicate content of water was estimated by following the method of
Strickland and Parsons (1972). In this method, the intensity of blue color formed by silico-
molybdate complex was measured in a Spectrophotometer at 810 nm and the calculated values
are expressed in µmol of Silica/l
Sediment Analysis
For the analysis of textural composition and pH, the air-dried sediment samples were
used as such. For all other analyses of organic matter, sediment samples were ground to fine
powder and dried in an oven at 110C to constant weight for an hour.
Total Organic Carbon
The estimation of total organic carbon in sediment was performed by adopting the
method of El Wakeel and Riley (1956). The procedure involves chromic acid digestion and
subsequent titration against ferrous ammonium sulphate solution in the presence of 1-10 Ferrous
phenonthroline indicator. The values calculated are expressed in mgC/g of sediment.
Heavy Metal Analysis in Water and Sediment Samples
Seawater samples were collected in pre-cleaned polypropylene bottles with 10% nitric
acid and Milli-Q water and acidified till pH ∼1.6 using HNO3 for further metal detection by
using ICP-MS (Søndergaard et al., 2015). Sediment samples were collected with the aid of
cleaned and dried Teflon/stainless steel coated Peterson grab. Sediment samples were transferred
DATA REPORT ON COASTAL WATER QUALITY MONITORING
FOR ITPCL POWER PROJECT (March-2019)
CAS IN MARINE BIOLOGY
from the Grab to cleaned polyethylene containers using cleaned plastics scoops. The samples
were stored in frozen condition for further analysis. The preserved sediment sub-samples were
dried at 110°C to constant weight for estimation of metals. Dry powdered sediment was gently
heated and digested with Hydrofluoric acid whereby Silica volatizes as Silicon tetra-fluoride.
This is followed by treatment with Nitric acid and Per-chloric acid to destroy the organic matter.
The residue after evaporation of acids was dissolved in 0.1 N HCl and desired metals were
determined by Atomic Absorption Spectrophotometry (AAS).
Bacteriological Methods
Collection of samples:
Surface water samples were collected in 30ml sterile screw capped bottles for
bacteriological assessment. Enough air space was left in the bottles to allow thorough mixing.
Precautionary measures were taken to avoid contamination through handling. For microbial
assessment in sediment samples, a known quantity of samples was collected from the grab
samples using sterilised spatula. The central portion of the collected sediment was aseptically
transferred into sterile polyethylene bags. All the samples were brought to the laboratory in
portable icebox soon after collection and bacteriological analyses were carried out in the
laboratory at CAS immediately, with necessary dilution.
Enumeration of Total Viable Counts:
TVC was enumerated by adopting the spread plate method using Zobell’s Marine Agar
medium (EA123, Hi-Media, Mumbai). The samples (water and sediment) were diluted using the
sterile sea water and 0.1 ml of the diluted sample was pippeted into the petriplates containing
Zobell’s Marine Agar and it was spread using a ‘L’ shaped glass spreader. The plates after
inoculation were incubated in an inverted position at a temperature of 28+2°C for 24to 48 h. The
DATA REPORT ON COASTAL WATER QUALITY MONITORING
FOR ITPCL POWER PROJECT (March-2019)
CAS IN MARINE BIOLOGY
colonies were counted and the population density expressed as Colony Forming Unit (CFU) per
ml or g of the sample. The bacterial colonies were picked up from the pertidishes and re-streaked
in appropriate nutrient agar plates thrice before a pure culture was established in agar slants.
Enumeration of Total Coliforms:
Macconkey agar with 0.15% bile salt, crystal violet and NaCl has been recommended in
accordance with USP/Nfxi (1) for the detection, isolation and enumeration of coliforms and
intestinal pathogens in water, dairy products, pharmaceutical preparations, etc. The agar
weighing 51.5 g in 1000 ml distilled water was heated up to the boiling point to dissolve the
medium completely and sterilized by autoclaving at 15 lbs pressure (121°C) for 15 min. suitably
diluted samples were inoculated in the petriplates containing medium and were incubated for 48
h. After incubation, the colonies of E. coli appeared with pink color.
M-FC agar is employed for detection and enumeration Faecal Coliforms by the
membrane filter technique at higher temperature (44.5°C). The agar weighing 52 g was
suspended in 1000 ml of distilled water and heated up to the boiling point to dissolve the
medium completely, 10ml of Rosolic acid (dissolved in 0.2 N NaOH) was added, heated with
frequent agitation and boiled for 1 min. Then the medium was cooled to 50°C. Finally, the
medium was poured into small 60mm plates. Samples filtered by Millipore apparatus using
0.45µm Whatman filter papers were impregnated in the petriplates. After 48 h of incubation, the
colonies of E. coli appeared with blue colour.

DATA REPORT ON COASTAL WATER QUALITY MONITORING
FOR ITPCL POWER PROJECT (March-2019)
CAS IN MARINE BIOLOGY
Chlorophyll `a':
The samples were filtered through Whatman GF/C filter papers and the chlorophyll was
extracted into 90% acetone. The resulting colored acetone extract was measured in a
spectrophotometer at different wave lengths and the same acetone extracts were acidified and
measured for the phaeo-pigments. The detailed methodology as described in APHA manual
(1989) was followed.
Phytoplankton:
Phytoplankton samples were collected from the surface waters of the study areas by
towing a plankton net (mouth diameter 0.5 m) made of bolting silk (mesh size 20 micron) for
half an hour. These samples were preserved in 5% neutralized formalin and used for qualitative
analysis. For quantitative analysis of phytoplankton, the settling method as described by
Sukhanovo (1978) was adopted. Numerical plankton analysis was carried out using Utermohl's
inverted plankton microscope.
Phytoplankton species was identified using the standard works of Hustedt (1930-1966),
Venkataraman (1939), Cupp (1943), Subramanian (1946), Prescott (1954), Desikachary (1959
and 1987), Hendey (1964), Steidinger and Williams (1970) and Taylor (1976) and Anand et al.
(1986).
Zooplankton:
Zooplankton samples were collected from the surface waters of the study areas by
horizontal towing of plankton net with mouth diameter of 0.35 m, made of bolting silk (No. 70
mesh size 200 µm) for half an hour. After collection, the samples were preserved in 5 - 7%
neutralized formalin and used for quantitative analysis. The zooplankton collected were
DATA REPORT ON COASTAL WATER QUALITY MONITORING
FOR ITPCL POWER PROJECT (March-2019)
CAS IN MARINE BIOLOGY
identified to the species level using the classical works of Dakin and Colefax (1940), Davis
(1955), Kasthurirangan (1963) and Wickstead (1965) and Damodara Naidu (1981). For
quantitative analysis of zooplankton, a known quantity of water (100 L) was filtered through a
bag net (0.33 mm mesh size) and filtrate was made up to 1 litre in a wide mouthed bottle and
then enumerated using Utermohl’s inverted plankton microscope. The plankton density is
expressed as number of organisms/m3.
Benthic Community:
For benthic organisms, sediment samples were collected using a Van veen Grab which
covered an area of 0.1m2. The wet sediment was sieved with varying mesh sizes for segregating
the organisms. The organisms retained in the sieve were fixed in 5-7% formalin and stained
further with Rose Bengal solution for easy spotting at the time of sorting. After a day or two, the
organisms were sorted into various groups. The number of organisms in each Grab sample was
expressed as number per meter square. According to size, benthic animals are divided into three
groups: (i) macrobenthos (ii) meiobenthos and (iii) microbenthos (Mare, 1942). All the species
were sorted, enumerated and identified to the advanced level possible with the consultation of
available literature. The works of Fauvel (1953), Day (1967) were referred for polychaetes;
Barnes (1980) and Lyla et al. (1999) for crustaceans; Subba Rao et al. (1991) and Ramakrishna
(2003) for molluscs.
1.2. Physico-chemical Parameters
The physico-chemical parameters such as depth, transparency, atmospheric temperature
(AT), water temperature (WT), turbdity, total suspended solids (TSS), pH, salinity, dissolved
DATA REPORT ON COASTAL WATER QUALITY MONITORING
FOR ITPCL POWER PROJECT (March-2019)
CAS IN MARINE BIOLOGY
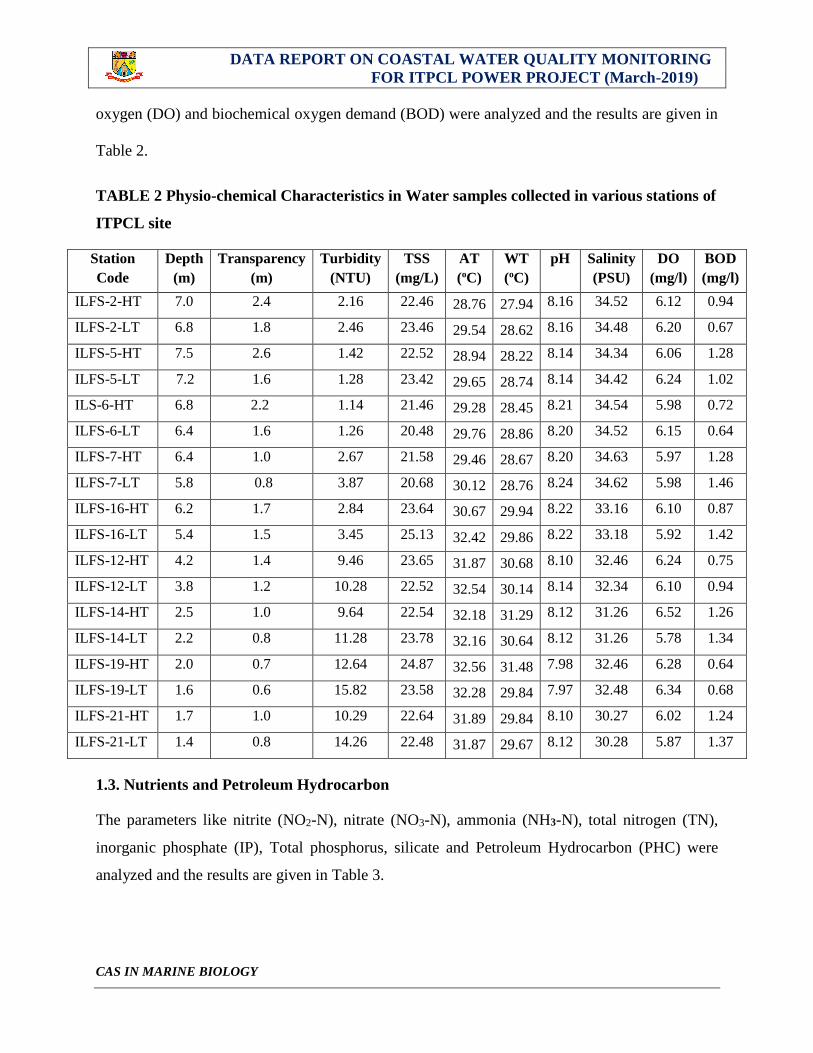
oxygen (DO) and biochemical oxygen demand (BOD) were analyzed and the results are given in
Table 2.
TABLE 2 Physio-chemical Characteristics in Water samples collected in various stations of
ITPCL site
Station
Code
Depth
(m)
Transparency
(m)
Turbidity
(NTU)
TSS
(mg/L)
AT
(oC)
WT
(oC)
pH Salinity
(PSU)
DO
(mg/l)
BOD
(mg/l)
ILFS-2-HT 7.0 2.4 2.16 22.46 28.76 27.94 8.16 34.52 6.12 0.94
ILFS-2-LT 6.8 1.8 2.46 23.46 29.54 28.62 8.16 34.48 6.20 0.67
ILFS-5-HT 7.5 2.6 1.42 22.52 28.94 28.22 8.14 34.34 6.06 1.28
ILFS-5-LT 7.2 1.6 1.28 23.42 29.65 28.74 8.14 34.42 6.24 1.02
ILS-6-HT 6.8 2.2 1.14 21.46 29.28 28.45 8.21 34.54 5.98 0.72
ILFS-6-LT 6.4 1.6 1.26 20.48 29.76 28.86 8.20 34.52 6.15 0.64
ILFS-7-HT 6.4 1.0 2.67 21.58 29.46 28.67 8.20 34.63 5.97 1.28
ILFS-7-LT 5.8 0.8 3.87 20.68 30.12 28.76 8.24 34.62 5.98 1.46
ILFS-16-HT 6.2 1.7 2.84 23.64 30.67 29.94 8.22 33.16 6.10 0.87
ILFS-16-LT 5.4 1.5 3.45 25.13 32.42 29.86 8.22 33.18 5.92 1.42
ILFS-12-HT 4.2 1.4 9.46 23.65 31.87 30.68 8.10 32.46 6.24 0.75
ILFS-12-LT 3.8 1.2 10.28 22.52 32.54 30.14 8.14 32.34 6.10 0.94
ILFS-14-HT 2.5 1.0 9.64 22.54 32.18 31.29 8.12 31.26 6.52 1.26
ILFS-14-LT 2.2 0.8 11.28 23.78 32.16 30.64 8.12 31.26 5.78 1.34
ILFS-19-HT 2.0 0.7 12.64 24.87 32.56 31.48 7.98 32.46 6.28 0.64
ILFS-19-LT 1.6 0.6 15.82 23.58 32.28 29.84 7.97 32.48 6.34 0.68
ILFS-21-HT 1.7 1.0 10.29 22.64 31.89 29.84 8.10 30.27 6.02 1.24
ILFS-21-LT 1.4 0.8 14.26 22.48 31.87 29.67 8.12 30.28 5.87 1.37
1.3. Nutrients and Petroleum Hydrocarbon
The parameters like nitrite (NO2-N), nitrate (NO3-N), ammonia (NH3-N), total nitrogen (TN),
inorganic phosphate (IP), Total phosphorus, silicate and Petroleum Hydrocarbon (PHC) were
analyzed and the results are given in Table 3.

DATA REPORT ON COASTAL WATER QUALITY MONITORING
FOR ITPCL POWER PROJECT (March-2019)
CAS IN MARINE BIOLOGY
TABLE 3 Nutrients and PHC values recorded in various stations of ITPCL site
1.4. Sediment Texture
The results of soil texture and total organic carbon (TOC) analyzed from the sediment samples
are given in Table 4.
TABLE 4 Sediment Texture and Organic Carbon recorded in various stations of ITPCL
site
Station Code Total Organic
Carbon(mgC/g)
Soil Texture (%)
Sand Silt Clay
ILFS-2-HT 1.564 92.685 5.671 1.644
ILFS-2-LT 1.867 93.224 4.124 2.652
ILFS-5-HT 2.631 94.123 3.535 2.342
Station Code SEAWATER NUTRIENTS (µmol/l) PHC
(µg/l) NO2 NO3 NH3 TN IP TP SiO4
ILFS-2-HT 0.231 0.864 0.056 8.945 0.264 1.264 10.264 0.546
ILFS-2-LT 0.328 1.264 0.084 7.684 0.274 2.164 9.645 0.594
ILFS-5-HT 0.164 1.584 0.038 9.164 0.234 1.946 11.264 0.624
ILFS-5-LT 0.315 1.974 0.057 8.645 0.264 2.164 10.264 0.658
ILFS-6-HT 0.134 1.864 0.075 10.264 0.164 2.031 12.635 0.426
ILFS-6-LT 0.152 1.625 0.124 9.867 0.345 2.001 10.821 0.524
ILFS-7-HT 0.128 2.465 0.068 9.845 0.268 2.465 11.264 0.764
ILFS-7-LT 0.132 1.864 0.940 8.946 0.124 1.864 9.684 0.694
ILFS-16-HT 0.254 1.465 0.076 11.364 0.465 1.946 15.642 0.537
ILFS-16-LT 0.098 2.064 0.084 10.264 0.354 3.246 14.264 0.692
ILFS-12-HT 0.134 3.246 0.164 18.624 0.286 4.652 20.314 0.754
ILFS-12-LT 0.564 2.584 0.134 17.534 0.653 3.264 19.652 0.812
ILFS-14-HT 0.497 1.328 0.064 10.264 0.426 1.324 11.264 0.638
ILFS-14-LT 0.235 1.264 0.054 12.564 0.345 1.648 13.264 0.568
ILFS-19-HT 0.182 2.564 0.246 18.465 0.864 3.264 19.642 0.594
ILFS-19-LT 0.121 2.349 0.736 16.524 0.764 4.521 17.634 0.648
ILFS-21-HT 0.168 2.465 0.246 12.345 0.356 3.264 21.536 0.537
ILFS-21-LT 0.164 2.046 0.345 11.264 0.423 2.612 18.642 0.623

DATA REPORT ON COASTAL WATER QUALITY MONITORING
FOR ITPCL POWER PROJECT (March-2019)
CAS IN MARINE BIOLOGY
ILFS-5-LT 2.461 95.586 2.550 1.864
ILFS-6-HT 2.817 94.213 4.264 1.523
ILFS-6-LT 3.124 93.231 4.427 2.342
ILFS-7-HT 2.647 91.234 7.244 1.522
ILFS-7-LT 2.824 90.457 7.112 2.431
ILFS-16-HT 1.974 90.652 5.501 3.847
ILFS-16-LT 2.064 89.974 5.742 4.284
ILFS-12-HT 3.264 64.512 23.243 12.245
ILFS-12-LT 3.264 63.514 23.143 13.343
ILFS-14-HT 4.652 50.224 25.341 24.435
ILFS-14-LT 5.264 48.632 30.214 21.154
ILFS-19-HT 3.846 62.351 24.413 13.236
ILFS-19-LT 4.354 60.234 32.162 7.604
ILFS-21-HT 3.642 54.632 26.254 19.114
ILFS-21-LT 2.467 53.346 26.342 20.312
1.5. Chlorophyll -a and phaeophytin
Chlorophyll ‘a’ and phaeophytin, which are considered as an index of phytoplankton density,
were analyzed in the samples collected at ITPCL power project site, Parangipettai. The results
are given in Table 5.
TABLE 5 Biological Characteristics Water samples collected in various stations of ITPCL
site
Station
Code
Chlorophyll ‘a’(mg/m3) Phaeophytin (mg/m3)
ILFS-2-HT 1.456 0.647
ILFS-2-LT 1.234 0.567
ILFS-5-HT 1.326 0.864
ILFS-5-LT 1.145 0.764
ILFS-6-HT 1.452 0.634
ILFS-6-LT 1.328 0.587
ILFS-7-HT 1.364 0.263
ILFS-7-LT 1.324 0.346
ILFS-16-HT 1.756 0.726
ILFS-16-LT 1.645 0.468

DATA REPORT ON COASTAL WATER QUALITY MONITORING
FOR ITPCL POWER PROJECT (March-2019)
CAS IN MARINE BIOLOGY
ILFS-12-HT 1.424 0.548
ILFS-12-LT 1.234 0.469
ILFS-14-HT 1.324 0.679
ILFS-14-LT 1.064 0.468
ILFS-19-HT 2.142 0.764
ILFS-19-LT 1.642 0.728
ILFS-21-HT 0.984 0.563
ILFS-21-LT 0.643 0.484
1.6. Heavy metals in seawater and sediments
The level of heavy metals recorded in seawater and sediments samples in and araound ITPCL
site are given in the Tables 6 and 7.
Table 6: Heavy Metals (µg/l) in Seawater samples collected from various stations of ITPCL
site
Station Code Fe Zn Mn Cd Ni Cr Pb Cu Hg
ILFS-1 34.56 18.62 42.39 1.76 1.89 2.38 3.64 14.82 0.68
ILFS-2 24.52 17.57 40.52 1.67 1.54 2.42 4.12 15.44 0.64
ILFS-3 18.42 20.41 41.28 2.24 2.24 1.54 3.96 16.38 0.57
ILFS-4 18.57 21.53 41.52 1.86 1.76 2.86 4.37 17.82 0.54
ILFS-5 20.31 22.64 43.29 2.56 1.68 1.93 3.84 16.67 0.48
ILFS-12 16.54 18.97 41.27 1.57 1.92 2.12 2.67 15.54 0.43
ILFS-19 13.25 19.62 40.31 2.48 1.82 1.85 2.62 13.49 0.46
ILFS-21 16.38 15.87 39.45 2.24 1.48 2.32 3.16 14.15 0.38
Table 7 Heavy Metals (µg/g) in sediment samples collected from various stations of ITPCL
sites
Station Code Fe Zn Mn Cd Ni Cr Pb Cu Hg
ILFS - 1 1462.2 16.84 68.4 12.54 16.58 10.57 9.46 25.68 0.96
ILFS - 2 1563.4 17.53 74.5 13.44 14.57 11.24 9.34 24.38 0.86
ILFS - 3 1524.0 14.52 65.3 16.27 15.62 10.28 10.28 23.28 0.64
ILFS - 4 1356.4 15.46 58.2 15.28 14.47 11.43 8.94 26.38 0.62
ILFS - 5 1567.5 15.94 54.8 12.39 16.22 11.68 9.27 32.52 0.72
ILFS - 12 1452.8 16.28 60.2 14.62 15.54 10.84 8.67 28.47 0.65
ILFS - 19 1634.5 14.82 68.3 16.24 13.26 9.58 7.58 24.06 0.62
ILFS - 21 1434.6 13..45 72.5 11.24 12.26 9.28 8.26 30.54 0.54
DATA REPORT ON COASTAL WATER QUALITY MONITORING
FOR ITPCL POWER PROJECT (March-2019)
CAS IN MARINE BIOLOGY
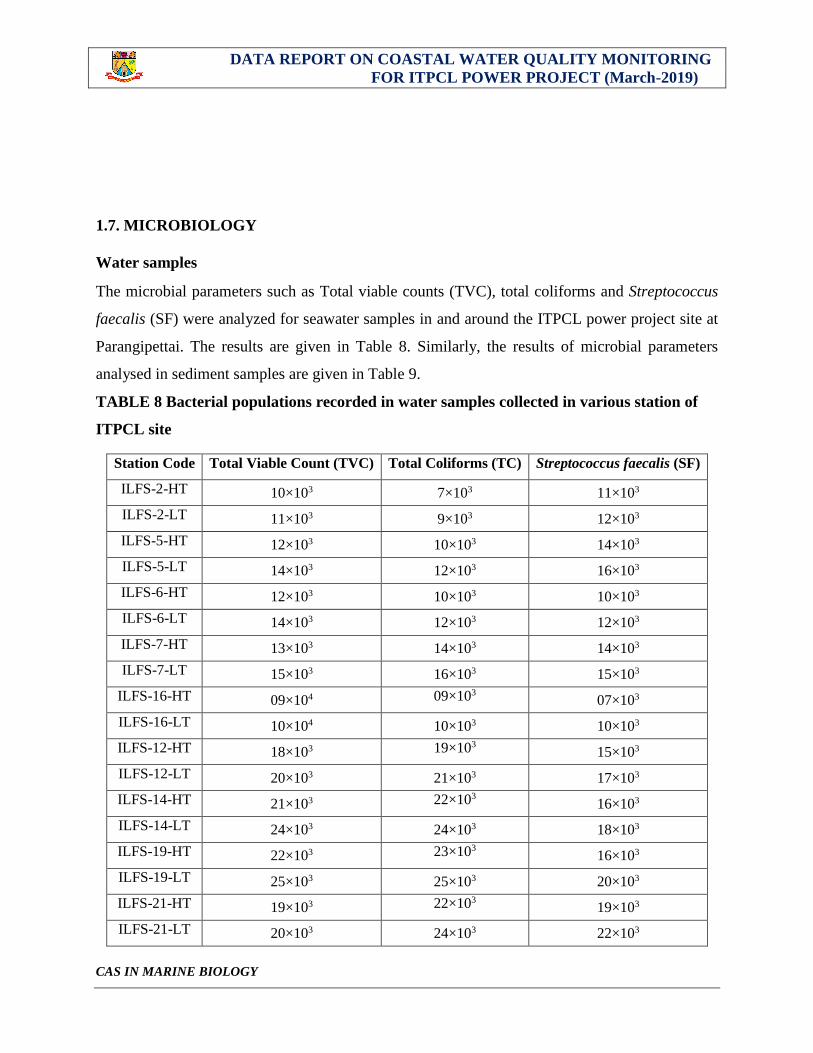
1.7. MICROBIOLOGY
Water samples
The microbial parameters such as Total viable counts (TVC), total coliforms and Streptococcus
faecalis (SF) were analyzed for seawater samples in and around the ITPCL power project site at
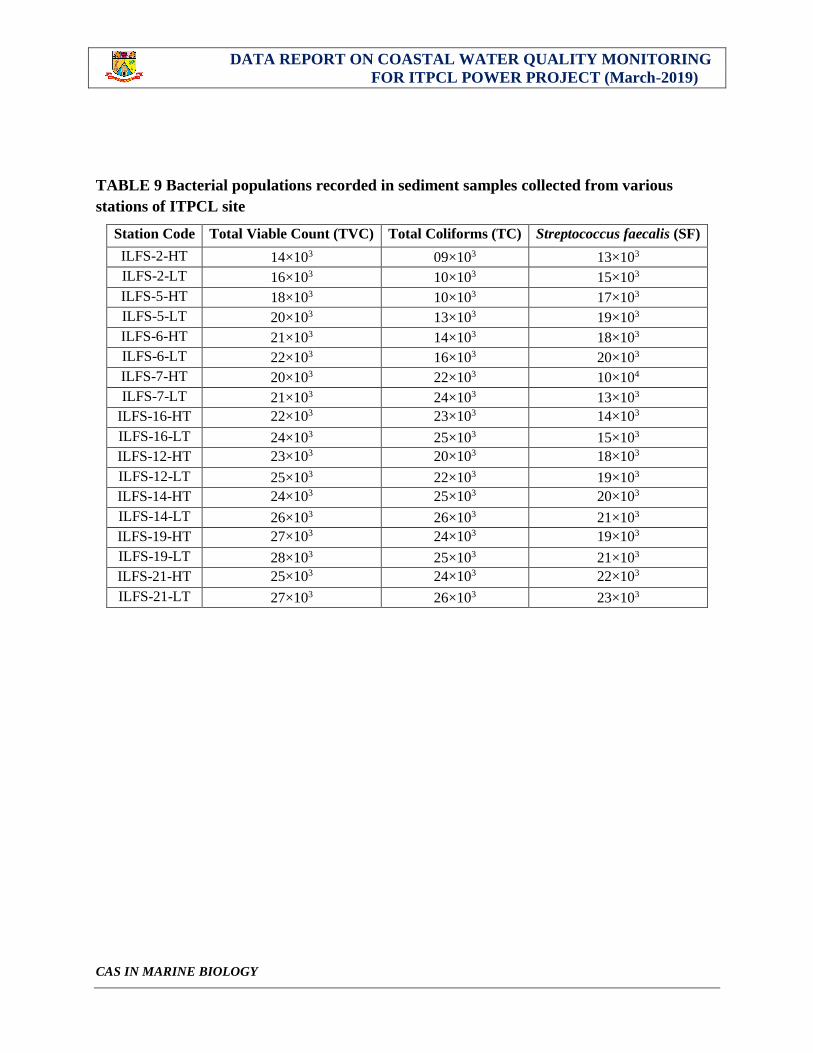
Parangipettai. The results are given in Table 8. Similarly, the results of microbial parameters
analysed in sediment samples are given in Table 9.
TABLE 8 Bacterial populations recorded in water samples collected in various station of
ITPCL site
Station Code Total Viable Count (TVC) Total Coliforms (TC) Streptococcus faecalis (SF)
ILFS-2-HT 10×103 7×10³ 11×103
ILFS-2-LT 11×103 9×10³ 12×103
ILFS-5-HT 12×103 10×103 14×103
ILFS-5-LT 14×103 12×103 16×103
ILFS-6-HT 12×103 10×103 10×103
ILFS-6-LT 14×103 12×103 12×103
ILFS-7-HT 13×103 14×103 14×103
ILFS-7-LT 15×103 16×103 15×103
ILFS-16-HT 09×104 09×103 07×103
ILFS-16-LT 10×104 10×103 10×103
ILFS-12-HT 18×103 19×103 15×103
ILFS-12-LT 20×103 21×103 17×103
ILFS-14-HT 21×103 22×103 16×103
ILFS-14-LT 24×103 24×103 18×103
ILFS-19-HT 22×103 23×103 16×103
ILFS-19-LT 25×103 25×103 20×103
ILFS-21-HT 19×103 22×103 19×103
ILFS-21-LT 20×103 24×103 22×103
DATA REPORT ON COASTAL WATER QUALITY MONITORING
FOR ITPCL POWER PROJECT (March-2019)
CAS IN MARINE BIOLOGY
TABLE 9 Bacterial populations recorded in sediment samples collected from various
stations of ITPCL site
Station Code Total Viable Count (TVC) Total Coliforms (TC) Streptococcus faecalis (SF)
ILFS-2-HT 14×103 09×103 13×103
ILFS-2-LT 16×103 10×103 15×103
ILFS-5-HT 18×103 10×103 17×103
ILFS-5-LT 20×103 13×103 19×103
ILFS-6-HT 21×103 14×103 18×103
ILFS-6-LT 22×103 16×103 20×103
ILFS-7-HT 20×103 22×103 10×104
ILFS-7-LT 21×103 24×103 13×103
ILFS-16-HT 22×103 23×103 14×103
ILFS-16-LT 24×103 25×103 15×103
ILFS-12-HT 23×103 20×103 18×103
ILFS-12-LT 25×103 22×103 19×103
ILFS-14-HT 24×103 25×103 20×103
ILFS-14-LT 26×103 26×103 21×103
ILFS-19-HT 27×103 24×103 19×103
ILFS-19-LT 28×103 25×103 21×103
ILFS-21-HT 25×103 24×103 22×103
ILFS-21-LT 27×103 26×103 23×103
DATA REPORT ON COASTAL WATER QUALITY MONITORING
FOR ITPCL POWER PROJECT (March -2019)
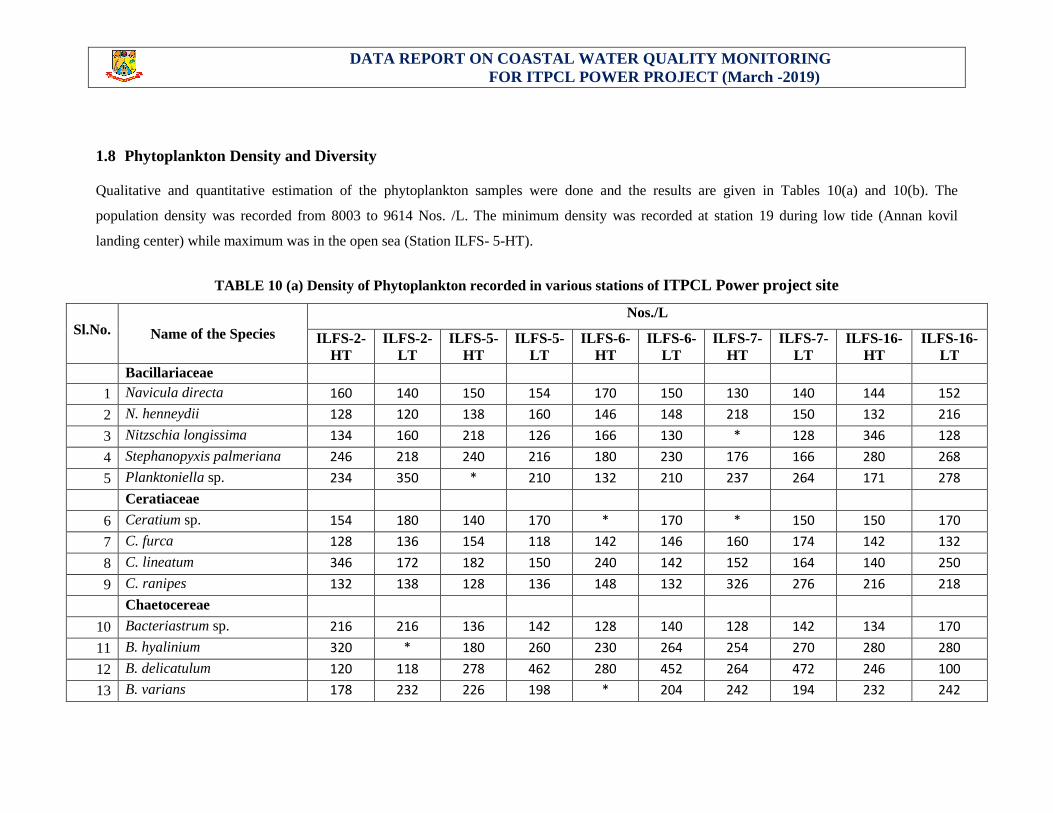
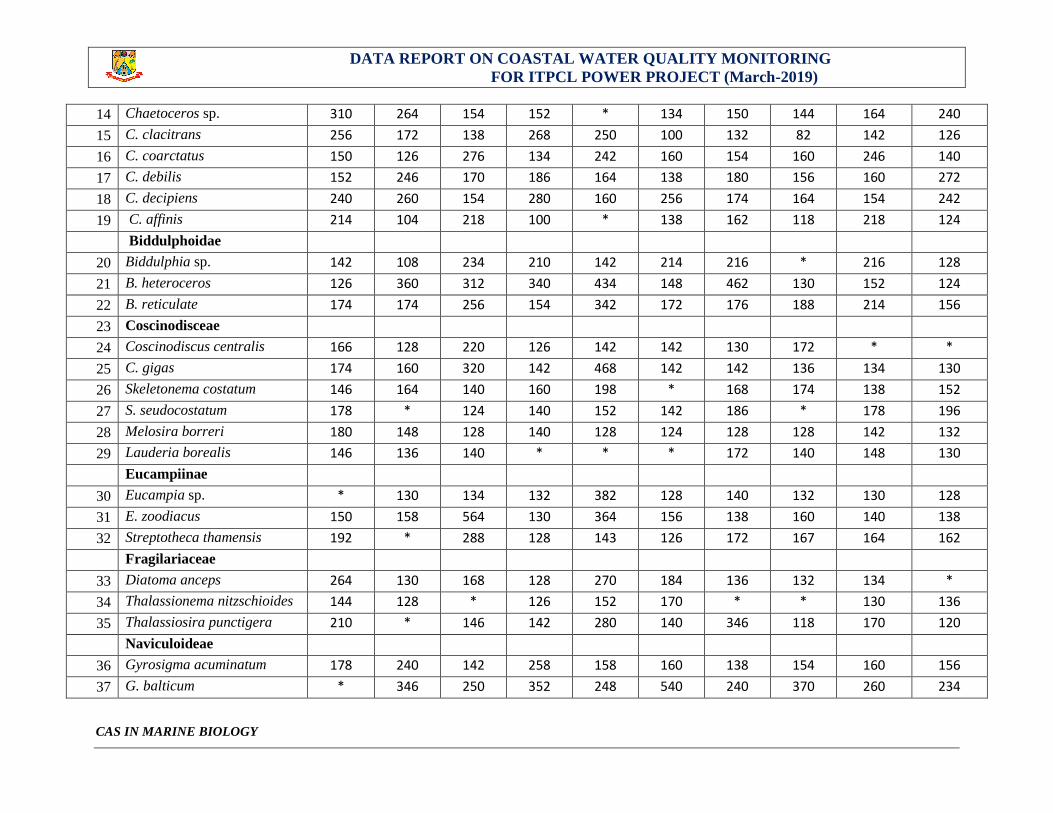
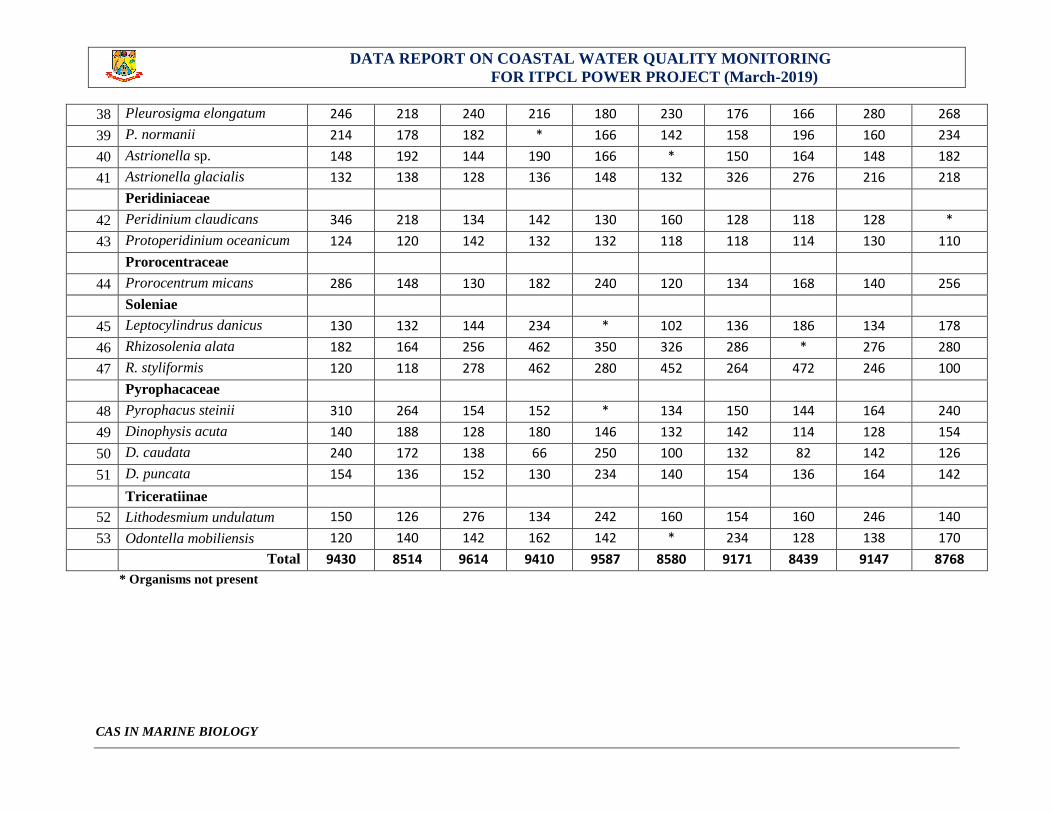
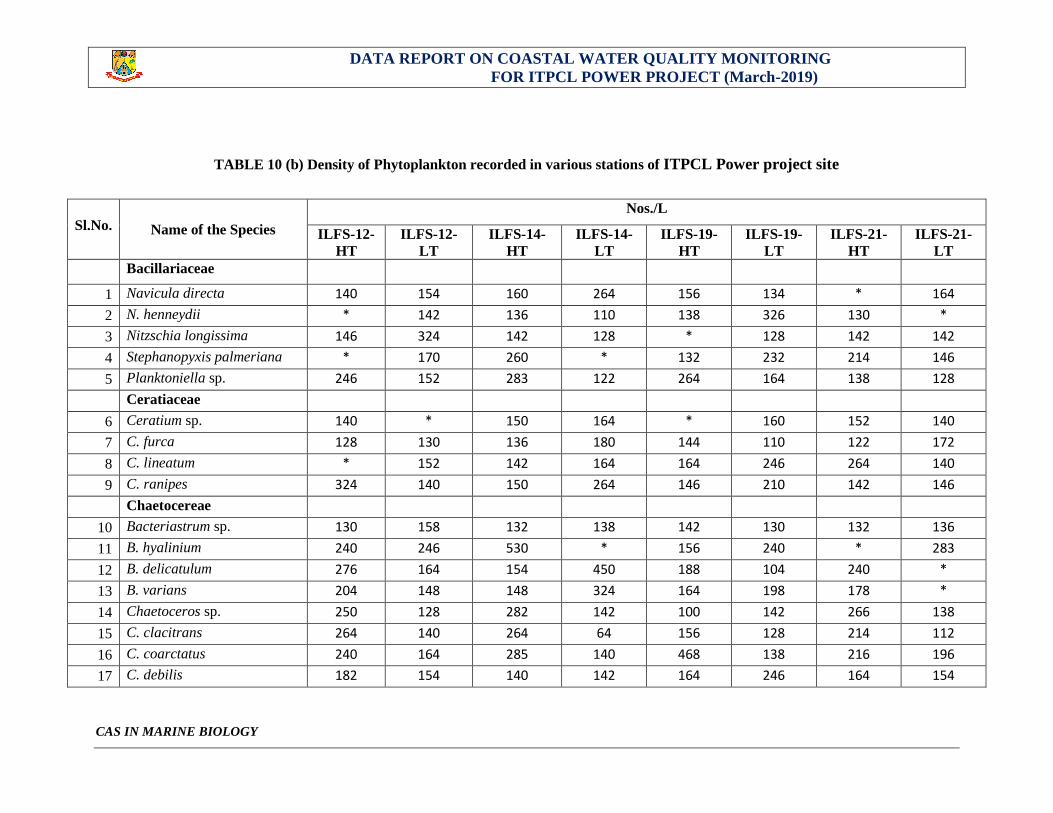
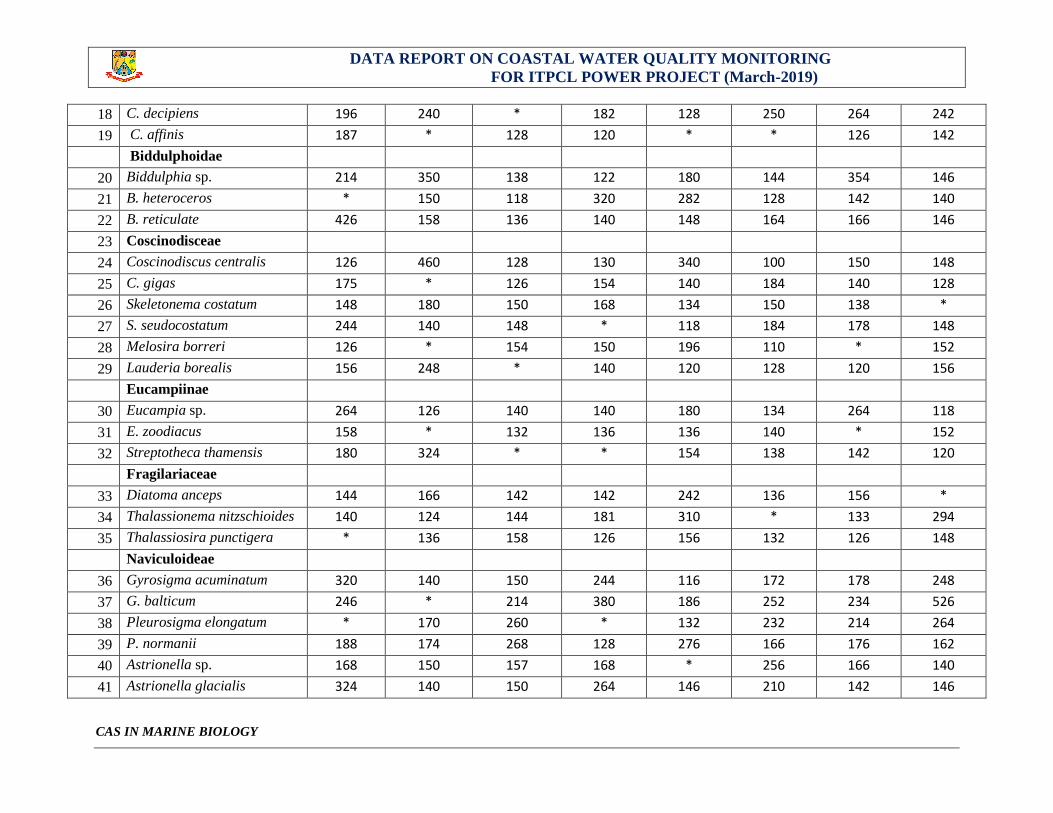
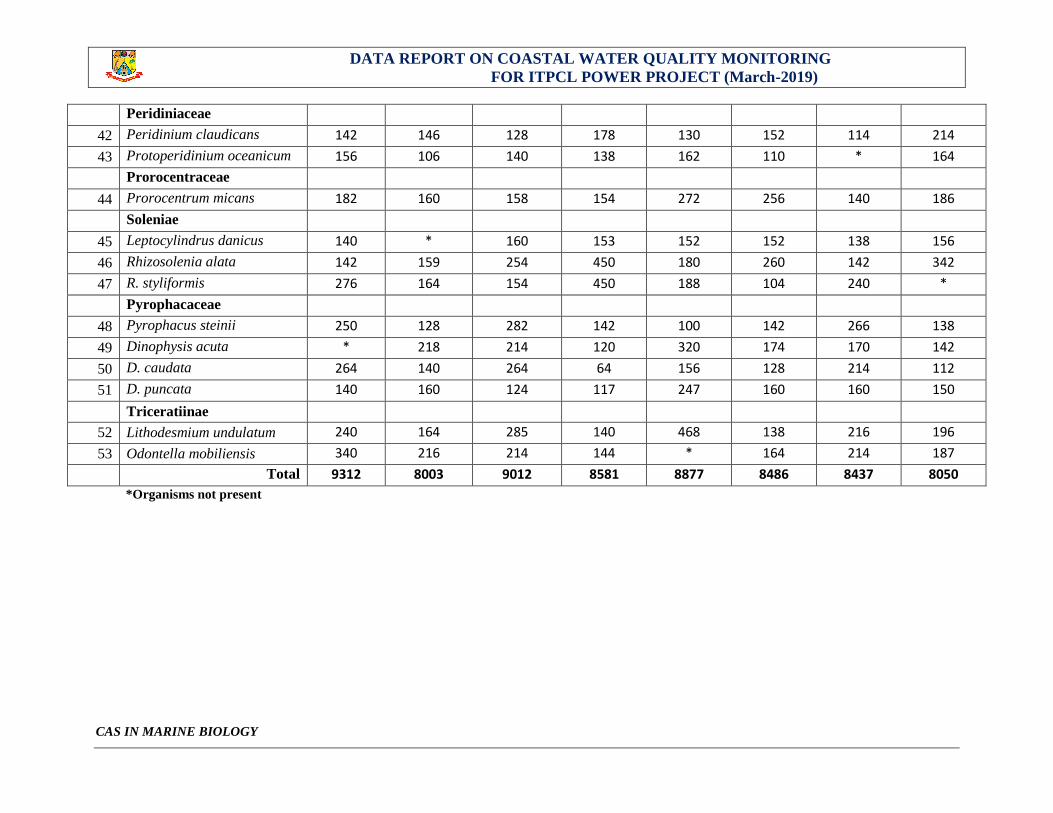
1.8 Phytoplankton Density and Diversity
Qualitative and quantitative estimation of the phytoplankton samples were done and the results are given in Tables 10(a) and 10(b). The
population density was recorded from 8003 to 9614 Nos. /L. The minimum density was recorded at station 19 during low tide (Annan kovil
landing center) while maximum was in the open sea (Station ILFS- 5-HT).
TABLE 10 (a) Density of Phytoplankton recorded in various stations of ITPCL Power project site
Sl.No. Name of the Species
Nos./L
ILFS-2-
HT
ILFS-2-
LT
ILFS-5-
HT
ILFS-5-
LT
ILFS-6-
HT
ILFS-6-
LT
ILFS-7-
HT
ILFS-7-
LT
ILFS-16-
HT
ILFS-16-
LT
Bacillariaceae
1 Navicula directa 160 140 150 154 170 150 130 140 144 152
2 N. henneydii 128 120 138 160 146 148 218 150 132 216
3 Nitzschia longissima 134 160 218 126 166 130 * 128 346 128
4 Stephanopyxis palmeriana 246 218 240 216 180 230 176 166 280 268
5 Planktoniella sp. 234 350 * 210 132 210 237 264 171 278
Ceratiaceae
6 Ceratium sp. 154 180 140 170 * 170 * 150 150 170
7 C. furca 128 136 154 118 142 146 160 174 142 132
8 C. lineatum 346 172 182 150 240 142 152 164 140 250
9 C. ranipes 132 138 128 136 148 132 326 276 216 218
Chaetocereae
10 Bacteriastrum sp. 216 216 136 142 128 140 128 142 134 170
11 B. hyalinium 320 * 180 260 230 264 254 270 280 280
12 B. delicatulum 120 118 278 462 280 452 264 472 246 100
13 B. varians 178 232 226 198 * 204 242 194 232 242
DATA REPORT ON COASTAL WATER QUALITY MONITORING
FOR ITPCL POWER PROJECT (March-2019)
CAS IN MARINE BIOLOGY
14 Chaetoceros sp. 310 264 154 152 * 134 150 144 164 240
15 C. clacitrans 256 172 138 268 250 100 132 82 142 126
16 C. coarctatus 150 126 276 134 242 160 154 160 246 140
17 C. debilis 152 246 170 186 164 138 180 156 160 272
18 C. decipiens 240 260 154 280 160 256 174 164 154 242
19 C. affinis 214 104 218 100 * 138 162 118 218 124
Biddulphoidae
20 Biddulphia sp. 142 108 234 210 142 214 216 * 216 128
21 B. heteroceros 126 360 312 340 434 148 462 130 152 124
22 B. reticulate 174 174 256 154 342 172 176 188 214 156
23 Coscinodisceae
24 Coscinodiscus centralis 166 128 220 126 142 142 130 172 * *
25 C. gigas 174 160 320 142 468 142 142 136 134 130
26 Skeletonema costatum 146 164 140 160 198 * 168 174 138 152
27 S. seudocostatum 178 * 124 140 152 142 186 * 178 196
28 Melosira borreri 180 148 128 140 128 124 128 128 142 132
29 Lauderia borealis 146 136 140 * * * 172 140 148 130
Eucampiinae
30 Eucampia sp. * 130 134 132 382 128 140 132 130 128
31 E. zoodiacus 150 158 564 130 364 156 138 160 140 138
32 Streptotheca thamensis 192 * 288 128 143 126 172 167 164 162
Fragilariaceae
33 Diatoma anceps 264 130 168 128 270 184 136 132 134 *
34 Thalassionema nitzschioides 144 128 * 126 152 170 * * 130 136
35 Thalassiosira punctigera 210 * 146 142 280 140 346 118 170 120
Naviculoideae
36 Gyrosigma acuminatum 178 240 142 258 158 160 138 154 160 156
37 G. balticum * 346 250 352 248 540 240 370 260 234
DATA REPORT ON COASTAL WATER QUALITY MONITORING
FOR ITPCL POWER PROJECT (March-2019)
CAS IN MARINE BIOLOGY
38 Pleurosigma elongatum 246 218 240 216 180 230 176 166 280 268
39 P. normanii 214 178 182 * 166 142 158 196 160 234
40 Astrionella sp. 148 192 144 190 166 * 150 164 148 182
41 Astrionella glacialis 132 138 128 136 148 132 326 276 216 218
Peridiniaceae
42 Peridinium claudicans 346 218 134 142 130 160 128 118 128 *
43 Protoperidinium oceanicum 124 120 142 132 132 118 118 114 130 110
Prorocentraceae
44 Prorocentrum micans 286 148 130 182 240 120 134 168 140 256
Soleniae
45 Leptocylindrus danicus 130 132 144 234 * 102 136 186 134 178
46 Rhizosolenia alata 182 164 256 462 350 326 286 * 276 280
47 R. styliformis 120 118 278 462 280 452 264 472 246 100
Pyrophacaceae
48 Pyrophacus steinii 310 264 154 152 * 134 150 144 164 240
49 Dinophysis acuta 140 188 128 180 146 132 142 114 128 154
50 D. caudata 240 172 138 66 250 100 132 82 142 126
51 D. puncata 154 136 152 130 234 140 154 136 164 142
Triceratiinae
52 Lithodesmium undulatum 150 126 276 134 242 160 154 160 246 140
53 Odontella mobiliensis 120 140 142 162 142 * 234 128 138 170
Total 9430 8514 9614 9410 9587 8580 9171 8439 9147 8768
* Organisms not present
DATA REPORT ON COASTAL WATER QUALITY MONITORING
FOR ITPCL POWER PROJECT (March-2019)
CAS IN MARINE BIOLOGY
TABLE 10 (b) Density of Phytoplankton recorded in various stations of ITPCL Power project site
Sl.No. Name of the Species
Nos./L
ILFS-12-
HT
ILFS-12-
LT
ILFS-14-
HT
ILFS-14-
LT
ILFS-19-
HT
ILFS-19-
LT
ILFS-21-
HT
ILFS-21-
LT
Bacillariaceae
1 Navicula directa 140 154 160 264 156 134 * 164
2 N. henneydii * 142 136 110 138 326 130 *
3 Nitzschia longissima 146 324 142 128 * 128 142 142
4 Stephanopyxis palmeriana * 170 260 * 132 232 214 146
5 Planktoniella sp. 246 152 283 122 264 164 138 128
Ceratiaceae
6 Ceratium sp. 140 * 150 164 * 160 152 140
7 C. furca 128 130 136 180 144 110 122 172
8 C. lineatum * 152 142 164 164 246 264 140
9 C. ranipes 324 140 150 264 146 210 142 146
Chaetocereae
10 Bacteriastrum sp. 130 158 132 138 142 130 132 136
11 B. hyalinium 240 246 530 * 156 240 * 283
12 B. delicatulum 276 164 154 450 188 104 240 *
13 B. varians 204 148 148 324 164 198 178 *
14 Chaetoceros sp. 250 128 282 142 100 142 266 138
15 C. clacitrans 264 140 264 64 156 128 214 112
16 C. coarctatus 240 164 285 140 468 138 216 196
17 C. debilis 182 154 140 142 164 246 164 154
DATA REPORT ON COASTAL WATER QUALITY MONITORING
FOR ITPCL POWER PROJECT (March-2019)
CAS IN MARINE BIOLOGY
18 C. decipiens 196 240 * 182 128 250 264 242
19 C. affinis 187 * 128 120 * * 126 142
Biddulphoidae
20 Biddulphia sp. 214 350 138 122 180 144 354 146
21 B. heteroceros * 150 118 320 282 128 142 140
22 B. reticulate 426 158 136 140 148 164 166 146
23 Coscinodisceae
24 Coscinodiscus centralis 126 460 128 130 340 100 150 148
25 C. gigas 175 * 126 154 140 184 140 128
26 Skeletonema costatum 148 180 150 168 134 150 138 *
27 S. seudocostatum 244 140 148 * 118 184 178 148
28 Melosira borreri 126 * 154 150 196 110 * 152
29 Lauderia borealis 156 248 * 140 120 128 120 156
Eucampiinae
30 Eucampia sp. 264 126 140 140 180 134 264 118
31 E. zoodiacus 158 * 132 136 136 140 * 152
32 Streptotheca thamensis 180 324 * * 154 138 142 120
Fragilariaceae
33 Diatoma anceps 144 166 142 142 242 136 156 *
34 Thalassionema nitzschioides 140 124 144 181 310 * 133 294
35 Thalassiosira punctigera * 136 158 126 156 132 126 148
Naviculoideae
36 Gyrosigma acuminatum 320 140 150 244 116 172 178 248
37 G. balticum 246 * 214 380 186 252 234 526
38 Pleurosigma elongatum * 170 260 * 132 232 214 264
39 P. normanii 188 174 268 128 276 166 176 162
40 Astrionella sp. 168 150 157 168 * 256 166 140
41 Astrionella glacialis 324 140 150 264 146 210 142 146
DATA REPORT ON COASTAL WATER QUALITY MONITORING
FOR ITPCL POWER PROJECT (March-2019)
CAS IN MARINE BIOLOGY
Peridiniaceae
42 Peridinium claudicans 142 146 128 178 130 152 114 214
43 Protoperidinium oceanicum 156 106 140 138 162 110 * 164
Prorocentraceae
44 Prorocentrum micans 182 160 158 154 272 256 140 186
Soleniae
45 Leptocylindrus danicus 140 * 160 153 152 152 138 156
46 Rhizosolenia alata 142 159 254 450 180 260 142 342
47 R. styliformis 276 164 154 450 188 104 240 *
Pyrophacaceae
48 Pyrophacus steinii 250 128 282 142 100 142 266 138
49 Dinophysis acuta * 218 214 120 320 174 170 142
50 D. caudata 264 140 264 64 156 128 214 112
51 D. puncata 140 160 124 117 247 160 160 150
Triceratiinae
52 Lithodesmium undulatum 240 164 285 140 468 138 216 196
53 Odontella mobiliensis 340 216 214 144 * 164 214 187
Total 9312 8003 9012 8581 8877 8486 8437 8050
*Organisms not present
DATA REPORT ON COASTAL WATER QUALITY MONITORING
FOR ITPCL POWER PROJECT (March-2019)
CAS IN MARINE BIOLOGY
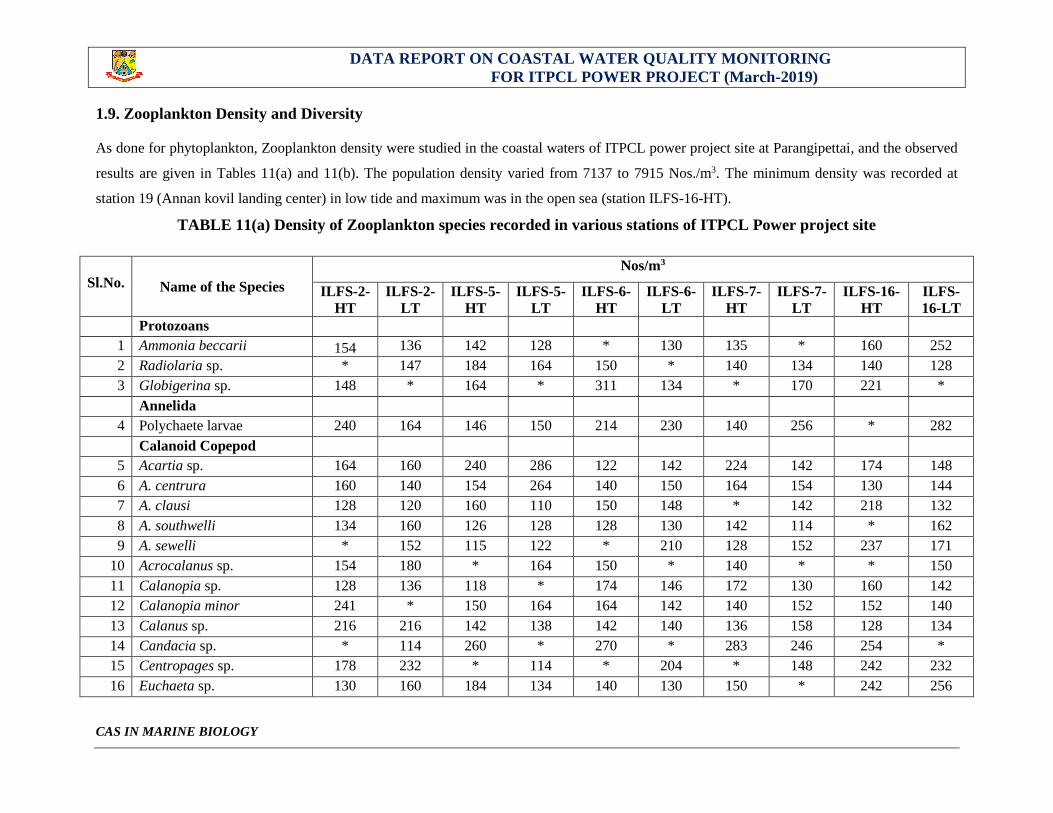
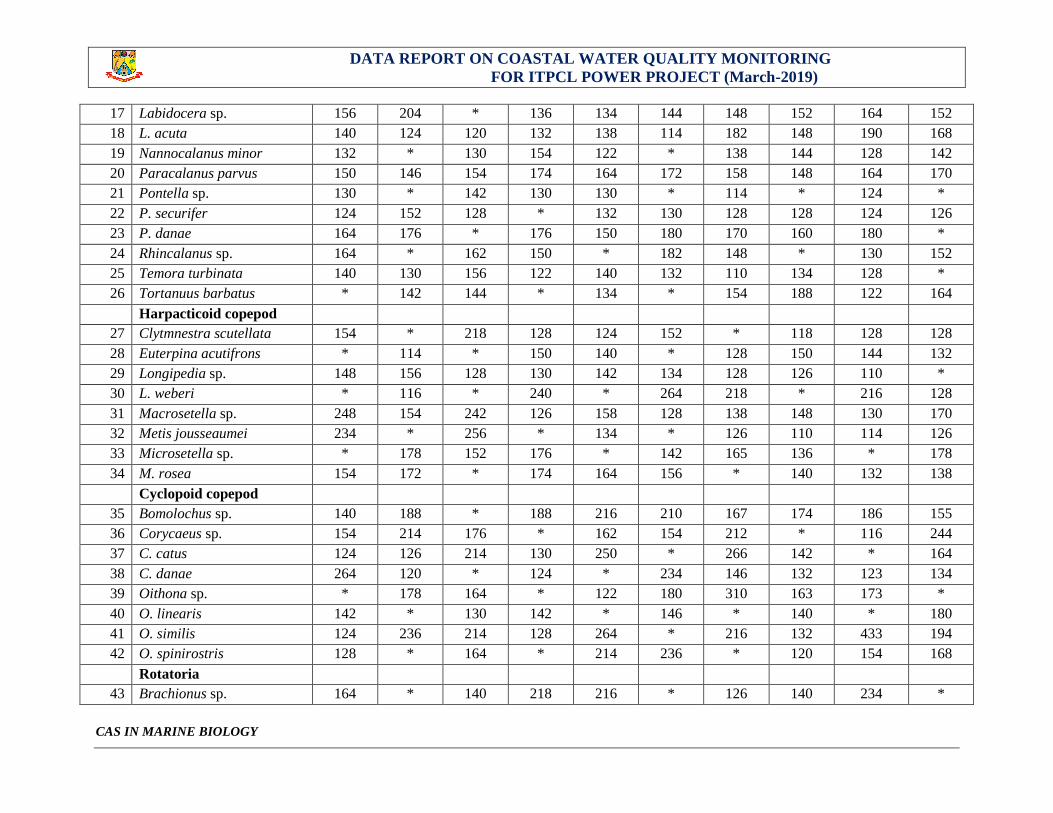
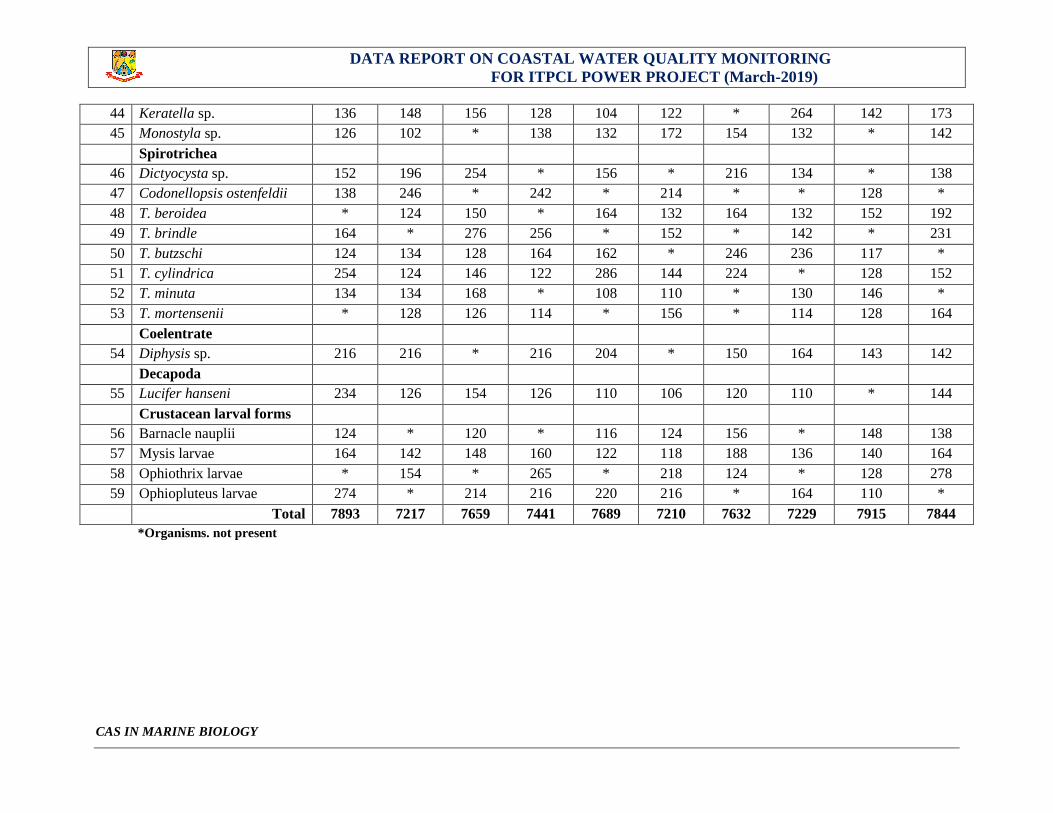
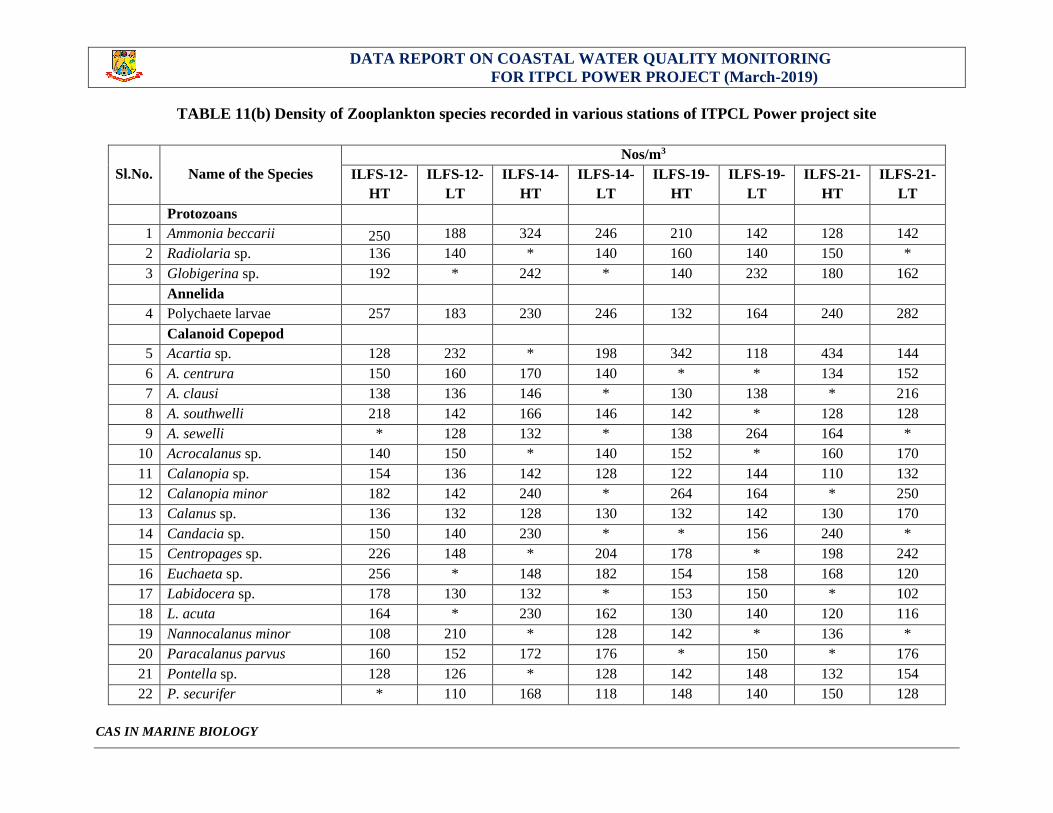
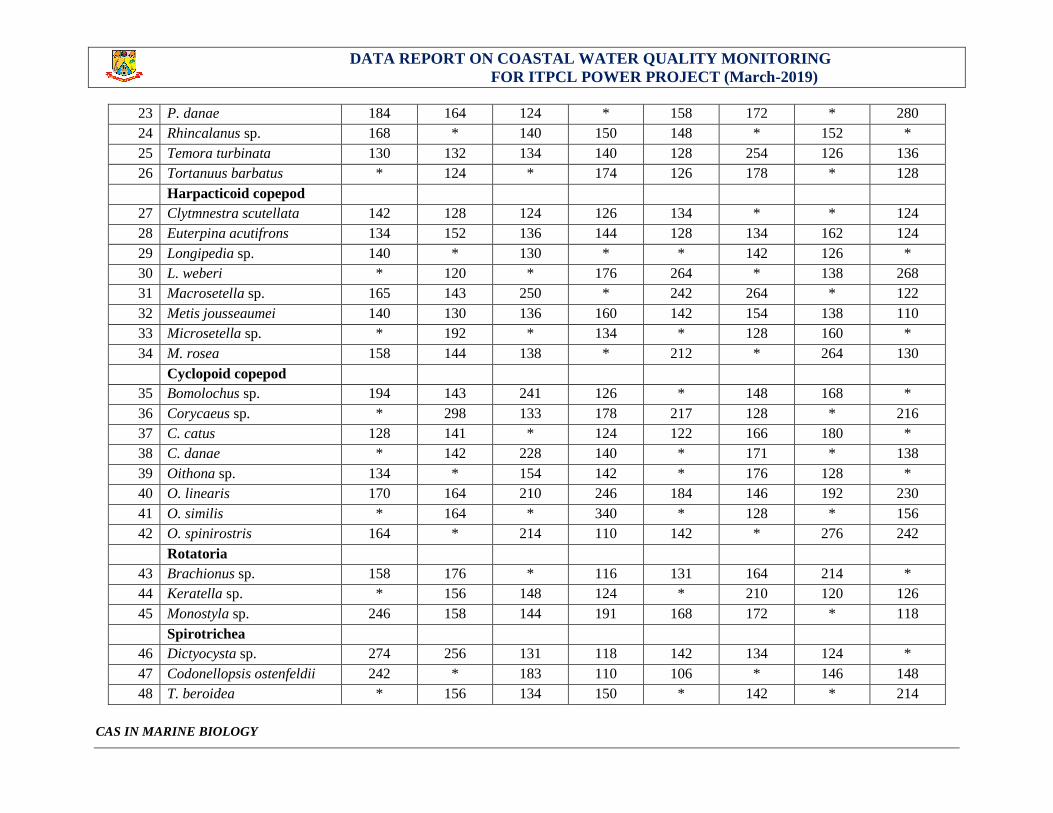
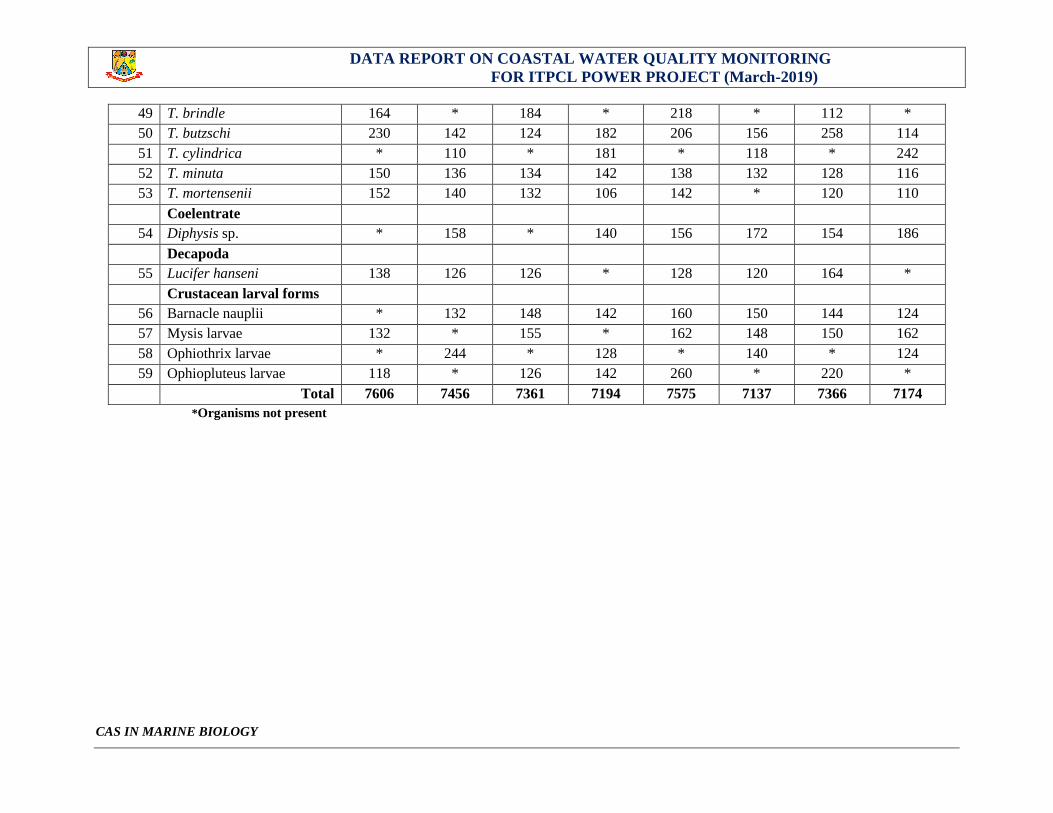
1.9. Zooplankton Density and Diversity
As done for phytoplankton, Zooplankton density were studied in the coastal waters of ITPCL power project site at Parangipettai, and the observed
results are given in Tables 11(a) and 11(b). The population density varied from 7137 to 7915 Nos./m3. The minimum density was recorded at
station 19 (Annan kovil landing center) in low tide and maximum was in the open sea (station ILFS-16-HT).
TABLE 11(a) Density of Zooplankton species recorded in various stations of ITPCL Power project site
Sl.No. Name of the Species
Nos/m3
ILFS-2-
HT
ILFS-2-
LT
ILFS-5-
HT
ILFS-5-
LT
ILFS-6-
HT
ILFS-6-
LT
ILFS-7-
HT
ILFS-7-
LT
ILFS-16-
HT
ILFS-
16-LT
Protozoans
1 Ammonia beccarii 154 136 142 128 * 130 135 * 160 252
2 Radiolaria sp. * 147 184 164 150 * 140 134 140 128
3 Globigerina sp. 148 * 164 * 311 134 * 170 221 *
Annelida
4 Polychaete larvae 240 164 146 150 214 230 140 256 * 282
Calanoid Copepod
5 Acartia sp. 164 160 240 286 122 142 224 142 174 148
6 A. centrura 160 140 154 264 140 150 164 154 130 144
7 A. clausi 128 120 160 110 150 148 * 142 218 132
8 A. southwelli 134 160 126 128 128 130 142 114 * 162
9 A. sewelli * 152 115 122 * 210 128 152 237 171
10 Acrocalanus sp. 154 180 * 164 150 * 140 * * 150
11 Calanopia sp. 128 136 118 * 174 146 172 130 160 142
12 Calanopia minor 241 * 150 164 164 142 140 152 152 140
13 Calanus sp. 216 216 142 138 142 140 136 158 128 134
14 Candacia sp. * 114 260 * 270 * 283 246 254 *
15 Centropages sp. 178 232 * 114 * 204 * 148 242 232
16 Euchaeta sp. 130 160 184 134 140 130 150 * 242 256
DATA REPORT ON COASTAL WATER QUALITY MONITORING
FOR ITPCL POWER PROJECT (March-2019)
CAS IN MARINE BIOLOGY
17 Labidocera sp. 156 204 * 136 134 144 148 152 164 152
18 L. acuta 140 124 120 132 138 114 182 148 190 168
19 Nannocalanus minor 132 * 130 154 122 * 138 144 128 142
20 Paracalanus parvus 150 146 154 174 164 172 158 148 164 170
21 Pontella sp. 130 * 142 130 130 * 114 * 124 *
22 P. securifer 124 152 128 * 132 130 128 128 124 126
23 P. danae 164 176 * 176 150 180 170 160 180 *
24 Rhincalanus sp. 164 * 162 150 * 182 148 * 130 152
25 Temora turbinata 140 130 156 122 140 132 110 134 128 *
26 Tortanuus barbatus * 142 144 * 134 * 154 188 122 164
Harpacticoid copepod
27 Clytmnestra scutellata 154 * 218 128 124 152 * 118 128 128
28 Euterpina acutifrons * 114 * 150 140 * 128 150 144 132
29 Longipedia sp. 148 156 128 130 142 134 128 126 110 *
30 L. weberi * 116 * 240 * 264 218 * 216 128
31 Macrosetella sp. 248 154 242 126 158 128 138 148 130 170
32 Metis jousseaumei 234 * 256 * 134 * 126 110 114 126
33 Microsetella sp. * 178 152 176 * 142 165 136 * 178
34 M. rosea 154 172 * 174 164 156 * 140 132 138
Cyclopoid copepod
35 Bomolochus sp. 140 188 * 188 216 210 167 174 186 155
36 Corycaeus sp. 154 214 176 * 162 154 212 * 116 244
37 C. catus 124 126 214 130 250 * 266 142 * 164
38 C. danae 264 120 * 124 * 234 146 132 123 134
39 Oithona sp. * 178 164 * 122 180 310 163 173 *
40 O. linearis 142 * 130 142 * 146 * 140 * 180
41 O. similis 124 236 214 128 264 * 216 132 433 194
42 O. spinirostris 128 * 164 * 214 236 * 120 154 168
Rotatoria
43 Brachionus sp. 164 * 140 218 216 * 126 140 234 *
DATA REPORT ON COASTAL WATER QUALITY MONITORING
FOR ITPCL POWER PROJECT (March-2019)
CAS IN MARINE BIOLOGY
44 Keratella sp. 136 148 156 128 104 122 * 264 142 173
45 Monostyla sp. 126 102 * 138 132 172 154 132 * 142
Spirotrichea
46 Dictyocysta sp. 152 196 254 * 156 * 216 134 * 138
47 Codonellopsis ostenfeldii 138 246 * 242 * 214 * * 128 *
48 T. beroidea * 124 150 * 164 132 164 132 152 192
49 T. brindle 164 * 276 256 * 152 * 142 * 231
50 T. butzschi 124 134 128 164 162 * 246 236 117 *
51 T. cylindrica 254 124 146 122 286 144 224 * 128 152
52 T. minuta 134 134 168 * 108 110 * 130 146 *
53 T. mortensenii * 128 126 114 * 156 * 114 128 164
Coelentrate
54 Diphysis sp. 216 216 * 216 204 * 150 164 143 142
Decapoda
55 Lucifer hanseni 234 126 154 126 110 106 120 110 * 144
Crustacean larval forms
56 Barnacle nauplii 124 * 120 * 116 124 156 * 148 138
57 Mysis larvae 164 142 148 160 122 118 188 136 140 164
58 Ophiothrix larvae * 154 * 265 * 218 124 * 128 278
59 Ophiopluteus larvae 274 * 214 216 220 216 * 164 110 *
Total 7893 7217 7659 7441 7689 7210 7632 7229 7915 7844
*Organisms. not present
DATA REPORT ON COASTAL WATER QUALITY MONITORING
FOR ITPCL POWER PROJECT (March-2019)
CAS IN MARINE BIOLOGY
TABLE 11(b) Density of Zooplankton species recorded in various stations of ITPCL Power project site
Sl.No. Name of the Species
Nos/m3
ILFS-12-
HT
ILFS-12-
LT
ILFS-14-
HT
ILFS-14-
LT
ILFS-19-
HT
ILFS-19-
LT
ILFS-21-
HT
ILFS-21-
LT
Protozoans
1 Ammonia beccarii 250 188 324 246 210 142 128 142
2 Radiolaria sp. 136 140 * 140 160 140 150 *
3 Globigerina sp. 192 * 242 * 140 232 180 162
Annelida
4 Polychaete larvae 257 183 230 246 132 164 240 282
Calanoid Copepod
5 Acartia sp. 128 232 * 198 342 118 434 144
6 A. centrura 150 160 170 140 * * 134 152
7 A. clausi 138 136 146 * 130 138 * 216
8 A. southwelli 218 142 166 146 142 * 128 128
9 A. sewelli * 128 132 * 138 264 164 *
10 Acrocalanus sp. 140 150 * 140 152 * 160 170
11 Calanopia sp. 154 136 142 128 122 144 110 132
12 Calanopia minor 182 142 240 * 264 164 * 250
13 Calanus sp. 136 132 128 130 132 142 130 170
14 Candacia sp. 150 140 230 * * 156 240 *
15 Centropages sp. 226 148 * 204 178 * 198 242
16 Euchaeta sp. 256 * 148 182 154 158 168 120
17 Labidocera sp. 178 130 132 * 153 150 * 102
18 L. acuta 164 * 230 162 130 140 120 116
19 Nannocalanus minor 108 210 * 128 142 * 136 *
20 Paracalanus parvus 160 152 172 176 * 150 * 176
21 Pontella sp. 128 126 * 128 142 148 132 154
22 P. securifer * 110 168 118 148 140 150 128
DATA REPORT ON COASTAL WATER QUALITY MONITORING
FOR ITPCL POWER PROJECT (March-2019)
CAS IN MARINE BIOLOGY
23 P. danae 184 164 124 * 158 172 * 280
24 Rhincalanus sp. 168 * 140 150 148 * 152 *
25 Temora turbinata 130 132 134 140 128 254 126 136
26 Tortanuus barbatus * 124 * 174 126 178 * 128
Harpacticoid copepod
27 Clytmnestra scutellata 142 128 124 126 134 * * 124
28 Euterpina acutifrons 134 152 136 144 128 134 162 124
29 Longipedia sp. 140 * 130 * * 142 126 *
30 L. weberi * 120 * 176 264 * 138 268
31 Macrosetella sp. 165 143 250 * 242 264 * 122
32 Metis jousseaumei 140 130 136 160 142 154 138 110
33 Microsetella sp. * 192 * 134 * 128 160 *
34 M. rosea 158 144 138 * 212 * 264 130
Cyclopoid copepod
35 Bomolochus sp. 194 143 241 126 * 148 168 *
36 Corycaeus sp. * 298 133 178 217 128 * 216
37 C. catus 128 141 * 124 122 166 180 *
38 C. danae * 142 228 140 * 171 * 138
39 Oithona sp. 134 * 154 142 * 176 128 *
40 O. linearis 170 164 210 246 184 146 192 230
41 O. similis * 164 * 340 * 128 * 156
42 O. spinirostris 164 * 214 110 142 * 276 242
Rotatoria
43 Brachionus sp. 158 176 * 116 131 164 214 *
44 Keratella sp. * 156 148 124 * 210 120 126
45 Monostyla sp. 246 158 144 191 168 172 * 118
Spirotrichea
46 Dictyocysta sp. 274 256 131 118 142 134 124 *
47 Codonellopsis ostenfeldii 242 * 183 110 106 * 146 148
48 T. beroidea * 156 134 150 * 142 * 214
DATA REPORT ON COASTAL WATER QUALITY MONITORING
FOR ITPCL POWER PROJECT (March-2019)
CAS IN MARINE BIOLOGY
49 T. brindle 164 * 184 * 218 * 112 *
50 T. butzschi 230 142 124 182 206 156 258 114
51 T. cylindrica * 110 * 181 * 118 * 242
52 T. minuta 150 136 134 142 138 132 128 116
53 T. mortensenii 152 140 132 106 142 * 120 110
Coelentrate
54 Diphysis sp. * 158 * 140 156 172 154 186
Decapoda
55 Lucifer hanseni 138 126 126 * 128 120 164 *
Crustacean larval forms
56 Barnacle nauplii * 132 148 142 160 150 144 124
57 Mysis larvae 132 * 155 * 162 148 150 162
58 Ophiothrix larvae * 244 * 128 * 140 * 124
59 Ophiopluteus larvae 118 * 126 142 260 * 220 *
Total 7606 7456 7361 7194 7575 7137 7366 7174
*Organisms not present
DATA REPORT ON COASTAL WATER QUALITY MONITORING
FOR ITPCL POWER PROJECT (March-2019)
CAS IN MARINE BIOLOGY
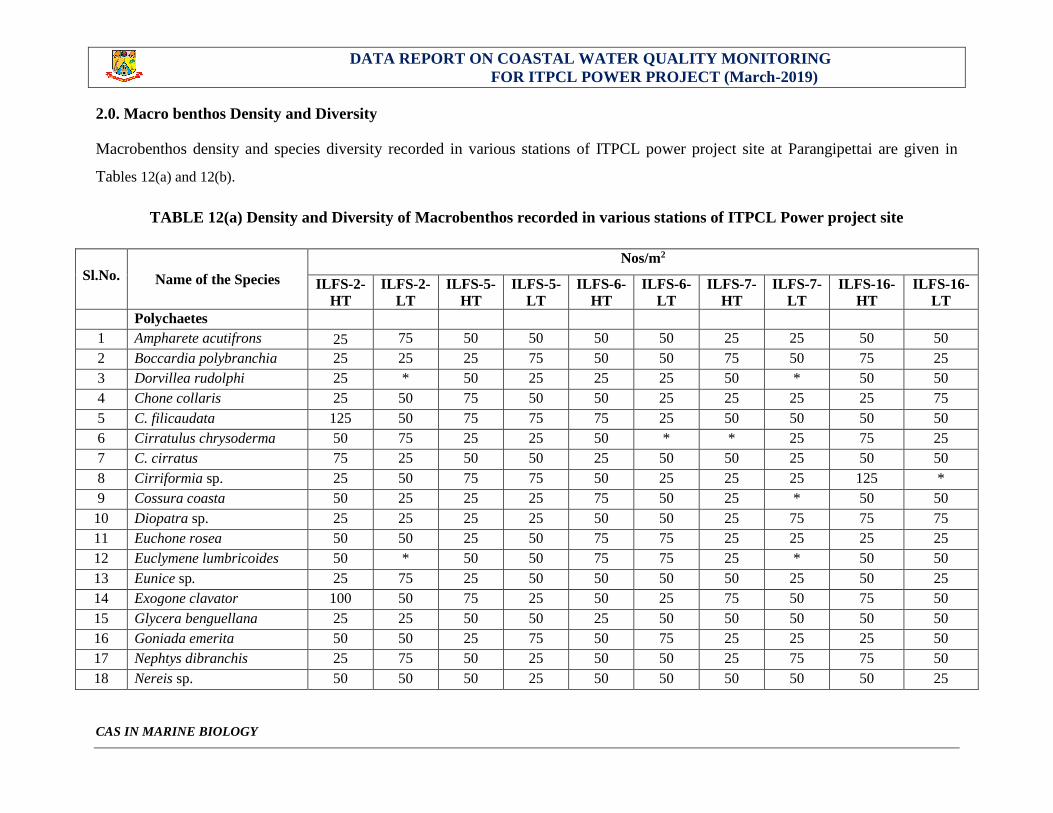
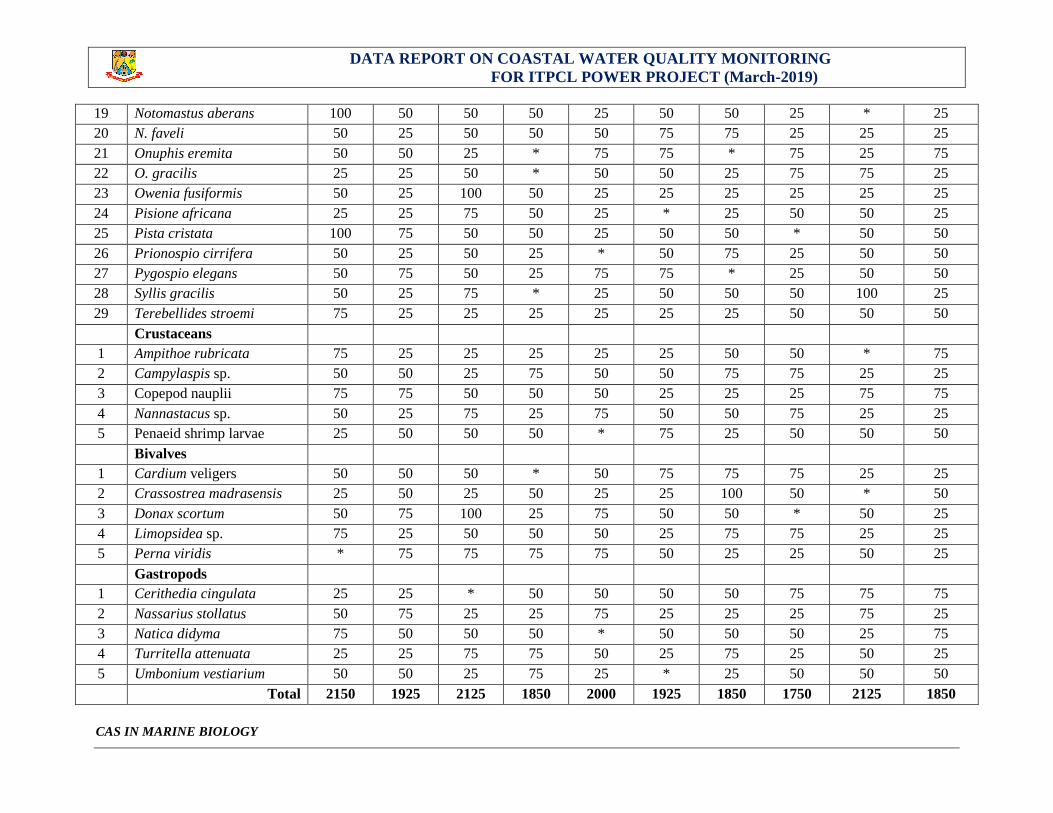
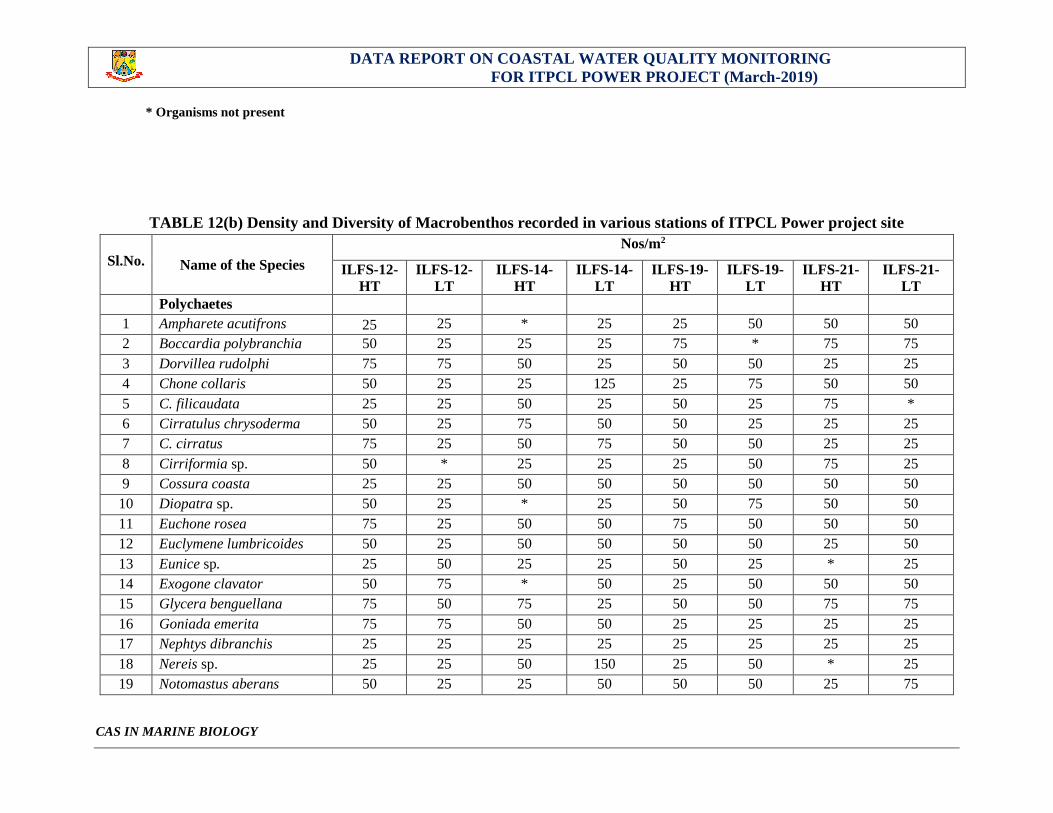
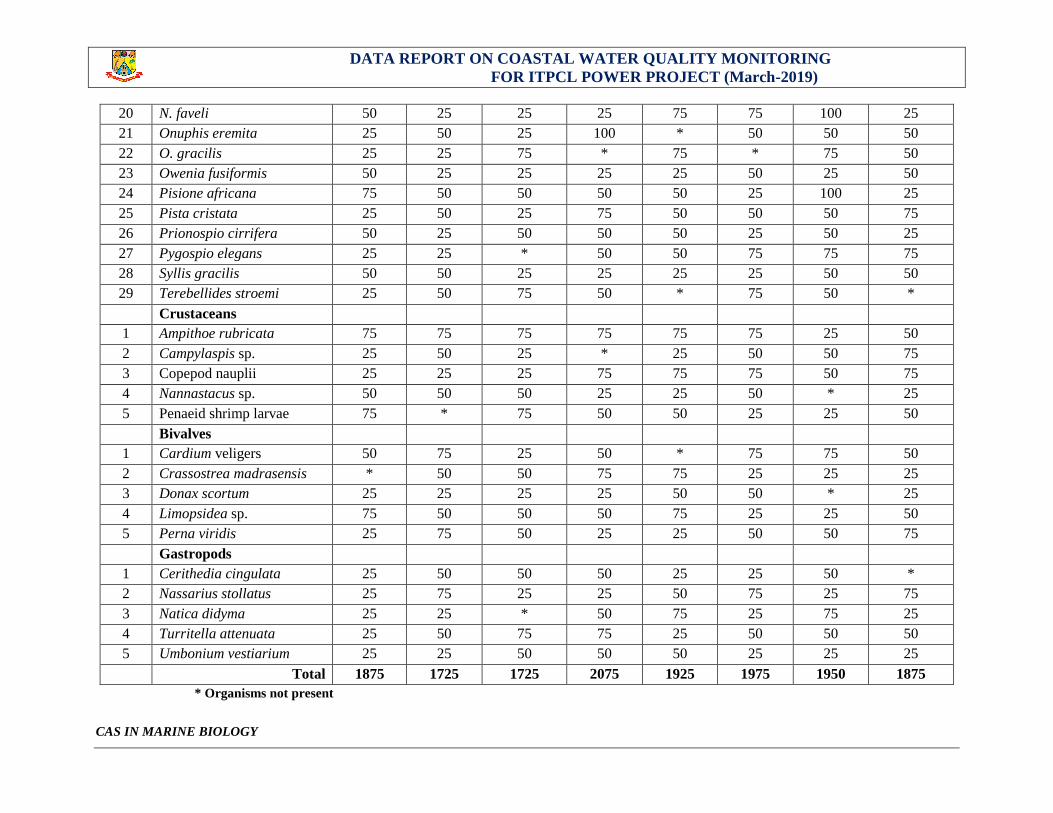
2.0. Macro benthos Density and Diversity
Macrobenthos density and species diversity recorded in various stations of ITPCL power project site at Parangipettai are given in
Tables 12(a) and 12(b).
TABLE 12(a) Density and Diversity of Macrobenthos recorded in various stations of ITPCL Power project site
Sl.No. Name of the Species
Nos/m2
ILFS-2-
HT
ILFS-2-
LT
ILFS-5-
HT
ILFS-5-
LT
ILFS-6-
HT
ILFS-6-
LT
ILFS-7-
HT
ILFS-7-
LT
ILFS-16-
HT
ILFS-16-
LT
Polychaetes
1 Ampharete acutifrons 25 75 50 50 50 50 25 25 50 50
2 Boccardia polybranchia 25 25 25 75 50 50 75 50 75 25
3 Dorvillea rudolphi 25 * 50 25 25 25 50 * 50 50
4 Chone collaris 25 50 75 50 50 25 25 25 25 75
5 C. filicaudata 125 50 75 75 75 25 50 50 50 50
6 Cirratulus chrysoderma 50 75 25 25 50 * * 25 75 25
7 C. cirratus 75 25 50 50 25 50 50 25 50 50
8 Cirriformia sp. 25 50 75 75 50 25 25 25 125 *
9 Cossura coasta 50 25 25 25 75 50 25 * 50 50
10 Diopatra sp. 25 25 25 25 50 50 25 75 75 75
11 Euchone rosea 50 50 25 50 75 75 25 25 25 25
12 Euclymene lumbricoides 50 * 50 50 75 75 25 * 50 50
13 Eunice sp. 25 75 25 50 50 50 50 25 50 25
14 Exogone clavator 100 50 75 25 50 25 75 50 75 50
15 Glycera benguellana 25 25 50 50 25 50 50 50 50 50
16 Goniada emerita 50 50 25 75 50 75 25 25 25 50
17 Nephtys dibranchis 25 75 50 25 50 50 25 75 75 50
18 Nereis sp. 50 50 50 25 50 50 50 50 50 25
DATA REPORT ON COASTAL WATER QUALITY MONITORING
FOR ITPCL POWER PROJECT (March-2019)
CAS IN MARINE BIOLOGY
19 Notomastus aberans 100 50 50 50 25 50 50 25 * 25
20 N. faveli 50 25 50 50 50 75 75 25 25 25
21 Onuphis eremita 50 50 25 * 75 75 * 75 25 75
22 O. gracilis 25 25 50 * 50 50 25 75 75 25
23 Owenia fusiformis 50 25 100 50 25 25 25 25 25 25
24 Pisione africana 25 25 75 50 25 * 25 50 50 25
25 Pista cristata 100 75 50 50 25 50 50 * 50 50
26 Prionospio cirrifera 50 25 50 25 * 50 75 25 50 50
27 Pygospio elegans 50 75 50 25 75 75 * 25 50 50
28 Syllis gracilis 50 25 75 * 25 50 50 50 100 25
29 Terebellides stroemi 75 25 25 25 25 25 25 50 50 50
Crustaceans
1 Ampithoe rubricata 75 25 25 25 25 25 50 50 * 75
2 Campylaspis sp. 50 50 25 75 50 50 75 75 25 25
3 Copepod nauplii 75 75 50 50 50 25 25 25 75 75
4 Nannastacus sp. 50 25 75 25 75 50 50 75 25 25
5 Penaeid shrimp larvae 25 50 50 50 * 75 25 50 50 50
Bivalves
1 Cardium veligers 50 50 50 * 50 75 75 75 25 25
2 Crassostrea madrasensis 25 50 25 50 25 25 100 50 * 50
3 Donax scortum 50 75 100 25 75 50 50 * 50 25
4 Limopsidea sp. 75 25 50 50 50 25 75 75 25 25
5 Perna viridis * 75 75 75 75 50 25 25 50 25
Gastropods
1 Cerithedia cingulata 25 25 * 50 50 50 50 75 75 75
2 Nassarius stollatus 50 75 25 25 75 25 25 25 75 25
3 Natica didyma 75 50 50 50 * 50 50 50 25 75
4 Turritella attenuata 25 25 75 75 50 25 75 25 50 25
5 Umbonium vestiarium 50 50 25 75 25 * 25 50 50 50
Total 2150 1925 2125 1850 2000 1925 1850 1750 2125 1850
DATA REPORT ON COASTAL WATER QUALITY MONITORING
FOR ITPCL POWER PROJECT (March-2019)
CAS IN MARINE BIOLOGY
* Organisms not present
TABLE 12(b) Density and Diversity of Macrobenthos recorded in various stations of ITPCL Power project site
Sl.No. Name of the Species
Nos/m2
ILFS-12-
HT
ILFS-12-
LT
ILFS-14-
HT
ILFS-14-
LT
ILFS-19-
HT
ILFS-19-
LT
ILFS-21-
HT
ILFS-21-
LT
Polychaetes
1 Ampharete acutifrons 25 25 * 25 25 50 50 50
2 Boccardia polybranchia 50 25 25 25 75 * 75 75
3 Dorvillea rudolphi 75 75 50 25 50 50 25 25
4 Chone collaris 50 25 25 125 25 75 50 50
5 C. filicaudata 25 25 50 25 50 25 75 *
6 Cirratulus chrysoderma 50 25 75 50 50 25 25 25
7 C. cirratus 75 25 50 75 50 50 25 25
8 Cirriformia sp. 50 * 25 25 25 50 75 25
9 Cossura coasta 25 25 50 50 50 50 50 50
10 Diopatra sp. 50 25 * 25 50 75 50 50
11 Euchone rosea 75 25 50 50 75 50 50 50
12 Euclymene lumbricoides 50 25 50 50 50 50 25 50
13 Eunice sp. 25 50 25 25 50 25 * 25
14 Exogone clavator 50 75 * 50 25 50 50 50
15 Glycera benguellana 75 50 75 25 50 50 75 75
16 Goniada emerita 75 75 50 50 25 25 25 25
17 Nephtys dibranchis 25 25 25 25 25 25 25 25
18 Nereis sp. 25 25 50 150 25 50 * 25
19 Notomastus aberans 50 25 25 50 50 50 25 75
DATA REPORT ON COASTAL WATER QUALITY MONITORING
FOR ITPCL POWER PROJECT (March-2019)
CAS IN MARINE BIOLOGY
20 N. faveli 50 25 25 25 75 75 100 25
21 Onuphis eremita 25 50 25 100 * 50 50 50
22 O. gracilis 25 25 75 * 75 * 75 50
23 Owenia fusiformis 50 25 25 25 25 50 25 50
24 Pisione africana 75 50 50 50 50 25 100 25
25 Pista cristata 25 50 25 75 50 50 50 75
26 Prionospio cirrifera 50 25 50 50 50 25 50 25
27 Pygospio elegans 25 25 * 50 50 75 75 75
28 Syllis gracilis 50 50 25 25 25 25 50 50
29 Terebellides stroemi 25 50 75 50 * 75 50 *
Crustaceans
1 Ampithoe rubricata 75 75 75 75 75 75 25 50
2 Campylaspis sp. 25 50 25 * 25 50 50 75
3 Copepod nauplii 25 25 25 75 75 75 50 75
4 Nannastacus sp. 50 50 50 25 25 50 * 25
5 Penaeid shrimp larvae 75 * 75 50 50 25 25 50
Bivalves
1 Cardium veligers 50 75 25 50 * 75 75 50
2 Crassostrea madrasensis * 50 50 75 75 25 25 25
3 Donax scortum 25 25 25 25 50 50 * 25
4 Limopsidea sp. 75 50 50 50 75 25 25 50
5 Perna viridis 25 75 50 25 25 50 50 75
Gastropods
1 Cerithedia cingulata 25 50 50 50 25 25 50 *
2 Nassarius stollatus 25 75 25 25 50 75 25 75
3 Natica didyma 25 25 * 50 75 25 75 25
4 Turritella attenuata 25 50 75 75 25 50 50 50
5 Umbonium vestiarium 25 25 50 50 50 25 25 25
Total 1875 1725 1725 2075 1925 1975 1950 1875
* Organisms not present
DATA REPORT ON COASTAL WATER QUALITY MONITORING
FOR ITPCL POWER PROJECT (March-2019)
CAS IN MARINE BIOLOGY
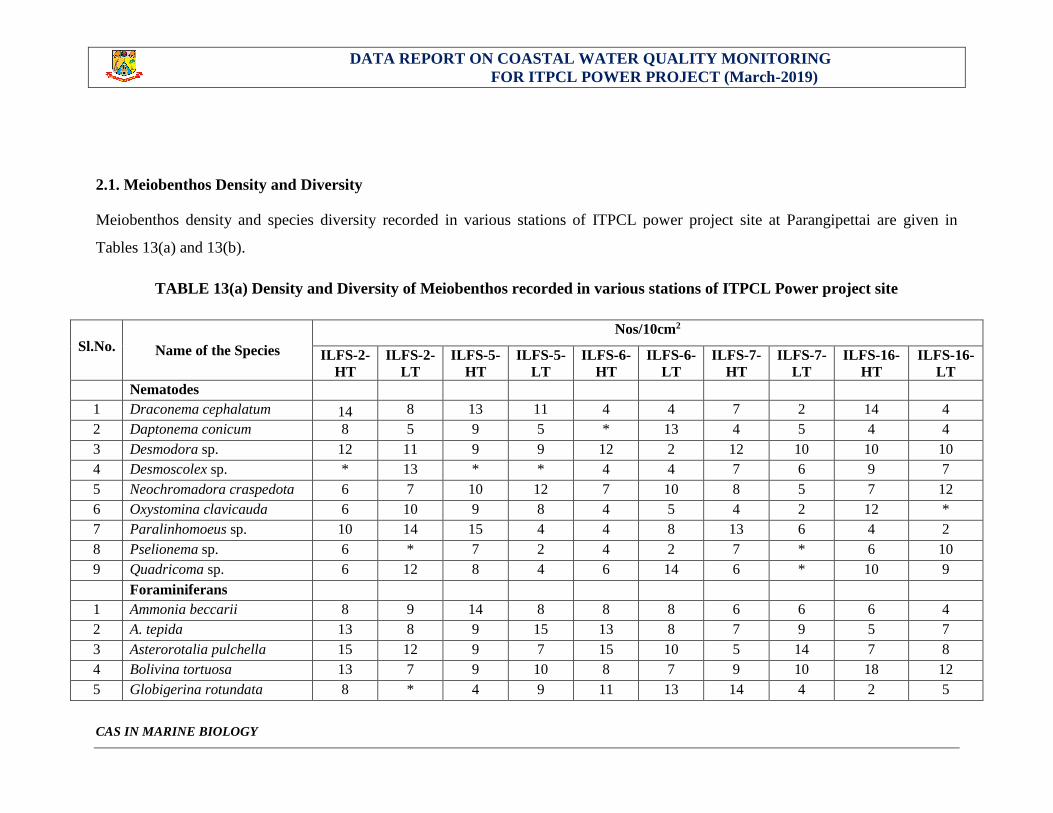
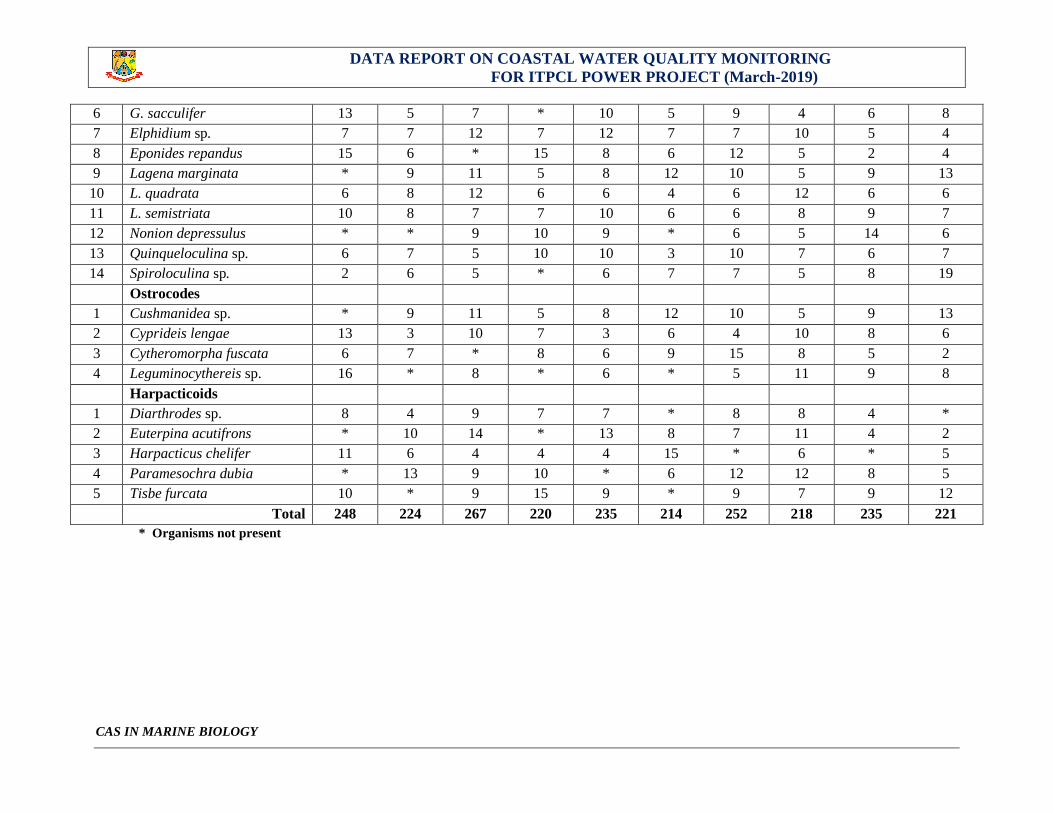
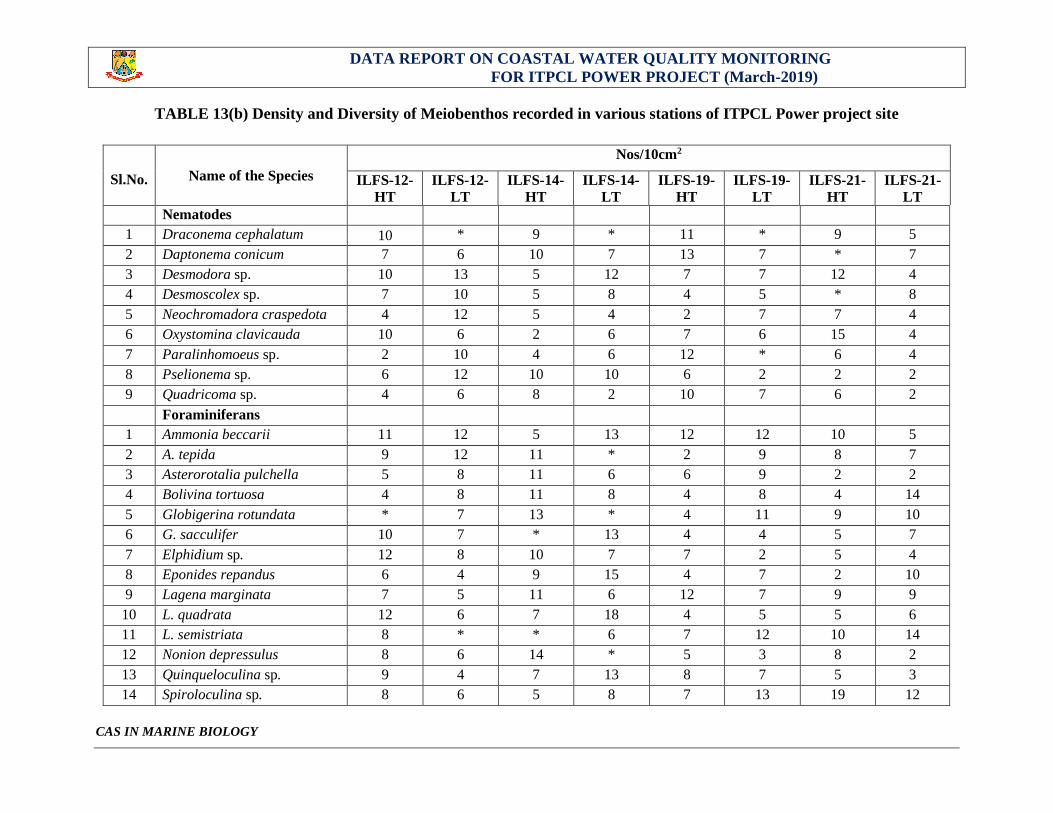
2.1. Meiobenthos Density and Diversity
Meiobenthos density and species diversity recorded in various stations of ITPCL power project site at Parangipettai are given in
Tables 13(a) and 13(b).
TABLE 13(a) Density and Diversity of Meiobenthos recorded in various stations of ITPCL Power project site
Sl.No. Name of the Species
Nos/10cm2
ILFS-2-
HT
ILFS-2-
LT
ILFS-5-
HT
ILFS-5-
LT
ILFS-6-
HT
ILFS-6-
LT
ILFS-7-
HT
ILFS-7-
LT
ILFS-16-
HT
ILFS-16-
LT
Nematodes
1 Draconema cephalatum 14 8 13 11 4 4 7 2 14 4
2 Daptonema conicum 8 5 9 5 * 13 4 5 4 4
3 Desmodora sp. 12 11 9 9 12 2 12 10 10 10
4 Desmoscolex sp. * 13 * * 4 4 7 6 9 7
5 Neochromadora craspedota 6 7 10 12 7 10 8 5 7 12
6 Oxystomina clavicauda 6 10 9 8 4 5 4 2 12 *
7 Paralinhomoeus sp. 10 14 15 4 4 8 13 6 4 2
8 Pselionema sp. 6 * 7 2 4 2 7 * 6 10
9 Quadricoma sp. 6 12 8 4 6 14 6 * 10 9
Foraminiferans
1 Ammonia beccarii 8 9 14 8 8 8 6 6 6 4
2 A. tepida 13 8 9 15 13 8 7 9 5 7
3 Asterorotalia pulchella 15 12 9 7 15 10 5 14 7 8
4 Bolivina tortuosa 13 7 9 10 8 7 9 10 18 12
5 Globigerina rotundata 8 * 4 9 11 13 14 4 2 5
DATA REPORT ON COASTAL WATER QUALITY MONITORING
FOR ITPCL POWER PROJECT (March-2019)
CAS IN MARINE BIOLOGY
6 G. sacculifer 13 5 7 * 10 5 9 4 6 8
7 Elphidium sp. 7 7 12 7 12 7 7 10 5 4
8 Eponides repandus 15 6 * 15 8 6 12 5 2 4
9 Lagena marginata * 9 11 5 8 12 10 5 9 13
10 L. quadrata 6 8 12 6 6 4 6 12 6 6
11 L. semistriata 10 8 7 7 10 6 6 8 9 7
12 Nonion depressulus * * 9 10 9 * 6 5 14 6
13 Quinqueloculina sp. 6 7 5 10 10 3 10 7 6 7
14 Spiroloculina sp. 2 6 5 * 6 7 7 5 8 19
Ostrocodes
1 Cushmanidea sp. * 9 11 5 8 12 10 5 9 13
2 Cyprideis lengae 13 3 10 7 3 6 4 10 8 6
3 Cytheromorpha fuscata 6 7 * 8 6 9 15 8 5 2
4 Leguminocythereis sp. 16 * 8 * 6 * 5 11 9 8
Harpacticoids
1 Diarthrodes sp. 8 4 9 7 7 * 8 8 4 *
2 Euterpina acutifrons * 10 14 * 13 8 7 11 4 2
3 Harpacticus chelifer 11 6 4 4 4 15 * 6 * 5
4 Paramesochra dubia * 13 9 10 * 6 12 12 8 5
5 Tisbe furcata 10 * 9 15 9 * 9 7 9 12
Total 248 224 267 220 235 214 252 218 235 221
* Organisms not present
DATA REPORT ON COASTAL WATER QUALITY MONITORING
FOR ITPCL POWER PROJECT (March-2019)
CAS IN MARINE BIOLOGY
TABLE 13(b) Density and Diversity of Meiobenthos recorded in various stations of ITPCL Power project site
Sl.No. Name of the Species
Nos/10cm2
ILFS-12-
HT
ILFS-12-
LT
ILFS-14-
HT
ILFS-14-
LT
ILFS-19-
HT
ILFS-19-
LT
ILFS-21-
HT
ILFS-21-
LT
Nematodes
1 Draconema cephalatum 10 * 9 * 11 * 9 5
2 Daptonema conicum 7 6 10 7 13 7 * 7
3 Desmodora sp. 10 13 5 12 7 7 12 4
4 Desmoscolex sp. 7 10 5 8 4 5 * 8
5 Neochromadora craspedota 4 12 5 4 2 7 7 4
6 Oxystomina clavicauda 10 6 2 6 7 6 15 4
7 Paralinhomoeus sp. 2 10 4 6 12 * 6 4
8 Pselionema sp. 6 12 10 10 6 2 2 2
9 Quadricoma sp. 4 6 8 2 10 7 6 2
Foraminiferans
1 Ammonia beccarii 11 12 5 13 12 12 10 5
2 A. tepida 9 12 11 * 2 9 8 7
3 Asterorotalia pulchella 5 8 11 6 6 9 2 2
4 Bolivina tortuosa 4 8 11 8 4 8 4 14
5 Globigerina rotundata * 7 13 * 4 11 9 10
6 G. sacculifer 10 7 * 13 4 4 5 7
7 Elphidium sp. 12 8 10 7 7 2 5 4
8 Eponides repandus 6 4 9 15 4 7 2 10
9 Lagena marginata 7 5 11 6 12 7 9 9
10 L. quadrata 12 6 7 18 4 5 5 6
11 L. semistriata 8 * * 6 7 12 10 14
12 Nonion depressulus 8 6 14 * 5 3 8 2
13 Quinqueloculina sp. 9 4 7 13 8 7 5 3
14 Spiroloculina sp. 8 6 5 8 7 13 19 12

DATA REPORT ON COASTAL WATER QUALITY MONITORING
FOR ITPCL POWER PROJECT (March-2019)
CAS IN MARINE BIOLOGY
Ostrocodes
1 Cushmanidea sp. 7 5 11 6 12 7 9 9
2 Cyprideis lengae 5 7 9 10 7 7 7 5
3 Cytheromorpha fuscata 9 2 8 8 12 * 10 7
4 Leguminocythereis sp. 14 10 11 * 4 9 3 7
Harpacticoids
1 Diarthrodes sp. 9 12 4 10 * 11 8 *
2 Euterpina acutifrons 4 5 * 9 4 13 11 9
3 Harpacticus chelifer 14 10 5 6 12 7 * 5
4 Paramesochra dubia 9 * * 5 7 4 4 7
5 Tisbe furcata 4 7 14 7 5 6 5 4
Total 244 226 234 229 221 214 215 198
*Organisms not present

DATA REPORT ON COASTAL WATER QUALITY MONITORING
FOR ITPCL POWER PROJECT (March -2019)
CONCLUDING REMARKS
In the present survey, which lasted for two days (29th - 30th March 2019), the physico-
chemical and biological parameters were analyzed both in the water and sediment samples from
18 locations at ITPCL Power Project at Parangipettai. The physico-chemical parameters did not
vary much except a few parameters which showed only minimal variations. Further, the results
of physico-chemical and biological parameters indicate that the water is well oxygenated and
nutrients were plenty supporting fairly good plankton population as the planktonic organisms
form the base in the food chain. The dominant diatom species recorded during this survey were
Coscinodiscus sp., Skeletonema costatum, Chaetoceros sp., Asterionella glacialis and
Thalasionema sp., further, dinoflagellate species such as Ceratium sp., Protoperidinium sp., and
Peridinium sp., were recorded commonly during the survey. Besides, macro benthic species like
Terebellides sp., Eunice sp., Nephtys sp., Prionospio sp., Euclymene sp., and Nereis sp., were
predominantly occurred in the ITPCL, Parangipettai coastal waters which reflect the stable
nature of the ecosystem. Not only is that, the metal concentration in coastal water and sediment
samples indicates that it is well within the ERM (Effective Range Median) values which means
that there are no possibilities of Heavy metal contamination in the region.
To sum up, relating the values of the seawater quality, sediment quality and biotic
components in and around the ITPCL Power Project at Parangipettai suggests that the physico-
chemical parameters were found more or less similar to the previous month (February) and are
within the permissible range, which is quite common and comparable to the levels recorded in
the coastal waters elsewhere.