south florida coastal water quality monitoring network
TRANSCRIPT

SOUTH FLORIDA COASTAL WATER QUALITY MONITORING NETWORK
FY2004 Cumulative Report to the South Florida Water
Management District (Contract No. C-15397)
Including the waters of: FLORIDA BAY WHITEWATER BAY TEN THOUSAND ISLANDS BISCAYNE BAY SOUTHWEST FLORIDA SHELF MARCO ISLAND NAPLES BAY ESTERO BAY ROOKERY BAY SAN CARLOS BAY PINE ISLAND SOUND
Prepared by:
Joseph N. Boyer, Ph.D.
Southeast Environmental Research Center Florida International University
Miami, FL 33199 http://serc.fiu.edu/wqmnetwork/

2
SOUTH FLORIDA COASTAL WATER QUALITY MONITORING NETWORK
FY2004 Cumulative Report to the South Florida Water Management District (Contract No. C-15397)
Joseph N. Boyer, Southeast Environmental Research Center, Florida International University,
Miami, FL 33199 http://serc.fiu.edu/wqmnetwork/
EXECUTIVE SUMMARY This report summarizes the existing data from the FIU South Florida Coastal Water Quality Monitoring Network. This includes water quality data collected from 28 stations in Florida Bay, 22 stations in Whitewater Bay, 25 stations in Ten Thousand Islands, 25 stations in Biscayne Bay, 49 stations on the Southwest Florida Shelf (Shelf), and 28 stations in the Cape Romano-Pine Island Sound area. Each of the stations in Florida Bay were monitored on a monthly basis with monitoring beginning in March 1991; Whitewater Bay monitoring began in September 1992; Biscayne Bay monthly monitoring began September 1993; the SW Florida Shelf was sampled quarterly beginning in spring 1995; and monthly sampling in the Cape Romano-Pine Island Sound area started January 1999. We have continued our systematic analysis and interpretation starting with the most extensive dataset: Florida Bay. We have analyzed the data for spatial trends, temporal trends, and for freshwater loading effects. Spatial analysis can be performed on data of relatively short period of record, however, time series analysis usually requires a minimum 5 years before significant trends can be recognized over the background noise of inter-annual variability. Therefore, the type of analysis performed on each estuary is determined by the length of the record. Trend analysis is an ongoing process; ecosystems change with climate and management strategy, therefore, analytical results may change as more data is collected. It is also important to understand that trend analysis alone will not necessarily provide cause and effect relationships. One of the purposes of any monitoring program should be to use the data gained by routine sampling to extend our understanding of the system by developing new hypotheses as to the underlying driving processes. Much inference into the behavior of South Florida estuaries can be made from the observed magnitude and distribution of water quality parameters. This type of multivariate approach should prove useful to scientists and managers faced with the task of interpreting large water quality datasets. This monitoring program has been very useful in helping to define restoration targets and will be even more valuable in determining whether these goals are met. Florida Bay
2004 was a relatively dry year with much of the bay experiencing a period of hypersalinity which began in late spring/early summer. The Eastern and Central Bay were most affected by the hypersalinity. Even the four hurricanes circulating around South Florida did not alleviate the hypersalinity in Eastern Bay. Overall DIN concentrations in the Eastern and Central Bay were lower that the grand median, except for September when we saw a spike, possibly as a result of

3
the hurricanes. It is hard to tell because Florida Bay was not sampled between Aug 29 and Sept. 28 when the bulk of hurricane activity occurred.
TON, TP, CHLA, and turbidity in all parts of the Bay were lower during 2004 than the grand median. TOC fluctuated but was generally lower than the grand median. Annual patterns in temperature and DO were unremarkable with values generally fluctuating around the median for all areas of the bay. Whitewater Bay-Ten Thousand Islands
The influence of freshwater input from the Everglades is very significant to this region. Large salinity variations are the norm, being driven by both climactic events and water management practices. As 2004 was a dry year in terms of precipitation, some hypersaline events were observed. Hypersalinity was pronounced in Whitewater Bay, Mangrove Rivers, Gulf Islands, and Inner Waterway zones. The most extensive period of elevated salinity occurred in Whitewater Bay, with salinities doubled the norm during June and July.
Overall DIN concentrations in the area were lower that the grand median. The exception was the Ten Thousand Islands during Aug. to Oct. when we saw a spike in concentration (with a concurrent drop in salinity), possibly as a result of the hurricanes.
Most of the time, TON, TP, TOC, and turbidity in all parts of the TTI_WWB were lower during 2004 than the grand median. Spikes in CHLA were evident from the record showing a generalized response of the phytoplankton to DIN inputs. An interesting spike in DIN was observed in Whitewater Bay and Mangrove Rivers during December. We have no idea as to what precipitated this event, but the data from Jan. 2005 showed that concentrations had returned to normal by the next sampling event. Annual patterns in temperature and DO were unremarkable with values generally fluctuating around the median for all areas. Biscayne Bay
Salinity in Biscayne Bay is strongly influenced by its large tidal exchange with the ocean. Nevertheless, canal inputs do have a significant impact on the ecosystem, as evidenced by the reduced nearshore salinity patterns.
As 2004 was a relatively dry year, some areas of Biscayne Bay experienced an extended period of hypersalinity which began in late spring/early summer. Contrary to what might be expected, the areas closest to the western shore were most affected by the hypersalinity. This is because of the short residence time of water in the main section of the bay as a result of large tidal forcing. All areas of Biscayne Bay experienced large inputs of DIN during Sept./Oct. It is difficult to ascertain a cause (there was no drop in salinity), but as it was a baywide phenomena, it was probably not terrestrially driven.
TOC concentrations in almost all areas of the Bay were higher than the grand median for the first half of the year, then returned to normal levels. DO levels in nearshore waters were lower than usual; we are unsure as to the cause. Annual patterns in TON, TP, CHLA, and temperature were unremarkable with values generally fluctuating around the median for all areas of the bay. Southwest Florida Shelf Since this component of the monitoring program began in 1995 and is only sampled quarterly, there is little trend data to analyze. Although these analyses are very preliminary it is possible to speculate that the clusters are formed as a function of hydrology and circulation patterns. We believe that the inshore cluster clearly shows the input of freshwater from Shark

4
River being transported south and east around the Cape. Water overlying the shoal stations probably originates somewhere in or north of the Ten Thousand Islands. Our level of resolution is very low due to the limited numbers of sampling events and by the relatively large spatial gap between coastal and Shelf sampling sites. A better understanding of local circulation patterns in addition to increased density and frequency of sampling in the nearshore region may help define the coupling between freshwater inflow and Shelf water quality
Overall, 2004 was relatively unremarkable except for a few outliers. TON was lower than the grand median for most areas, a result observed in other areas of the southwest coast. Cape Romano-Pine Island Sound
Overall, this area has significantly higher concentrations of CHLA, TP, and DIN than the bulk of the Ten Thousand Islands stations. Much of this is due to geological changes from carbonates to silicates, which facilitates transport of phosphorus, and to major land use changes from the Big Cypress National Preserve to suburban and agricultural.
The largest interannual variations in salinity in this area are driven by freshwater releases from the Caloosahatchee River. The large freshwater inputs result in high DIN loads and concentrations. Freshwater releases during Sept./Oct. resulted in DIN concentrations up to 10 times normal. This was due to the need to lower the water table inland because of potential flooding from the hurricanes. The large and rapid increase in N (and P) loading to the estuaries caused large phytoplankton blooms and increased turbidity across the region.
Annual patterns in TON, TOC, temperature, and DO were unremarkable with values generally fluctuating around the median for all areas of the bay.
5
ACKNOWLEDGMENTS We thank all of our many field personnel, laboratory technicians, and data support staff for their diligence and perseverance in this ongoing program, especially Pete Lorenzo. This project was possible due to the continued funding by the South Florida Water Management District (District Contract No. C-15397). We also thank Rookery Bay NERR/FDEP and the captain and crew of the R/V Bellows of the Florida Institute of Oceanography for their field support of the monitoring program. This report is contribution #T-265 of the Southeast Environmental Research Center at Florida International University.

6
TABLE OF CONTENTS
Page 1. PROJECT DESCRIPTION................................................................................................... 7
2. STATE OF WATER QUALITY IN FLORIDA BAY ........................................................ 11
3. STATE OF WATER QUALITY IN WHITEWATER BAY - TTI COMPLEX.................. 17
4. STATE OF WATER QUALITY IN BISCAYNE BAY...................................................... 28
5. STATE OF WATER QUALITY ON THE SOUTHWEST FLORIDA SHELF.................. 41
6. STATE OF WATER QUALITY IN THE CAPE ROMANO - PINE ISLAND SOUND.... 52
7. PUBLICATIONS DERIVED FROM THIS PROJECT...................................................... 63
8. PRESENTATIONS DERIVED FROM THIS PROJECT................................................... 73
9. TABLES ............................................................................................................................. 76

7
1. PROJECT DESCRIPTION
1.1. Background
One of the primary purposes for conducting long-term monitoring projects is to be able to detect trends in the measured parameters over time. These programs are usually initiated as a response to public perception (and possibly some scientific data) that “the river-bay-prairie-forest-etc. is dying”. In the case of Florida Bay, the major impetus was the combination of a seagrass die-off, increased phytoplankton abundance, sponge mortality, and a perceived decline in fisheries beginning in 1987. In response to these phenomena, a network of water quality monitoring stations was established in 1989 to explicate both spatial patterns and temporal trends in water quality in an effort to elucidate mechanisms behind the recent ecological change.
This report summarizes the existing data from our South Florida Coastal Water Quality Monitoring Network through Dec. 2004 (Fig. 1.1). This network includes water quality data collected from 28 stations in Florida Bay, 22 stations in Whitewater Bay to Lostmans River, 25 stations in Ten Thousand Islands, 25 stations in Biscayne Bay, 49 stations on the Southwest Florida Shelf (Shelf), and 28 stations in the Cape Romano-Pine Island Sound area.
Each of the stations in Florida Bay were sampled on a monthly basis with monitoring beginning in March 1991 (except stations 14, 19, 22, and 23 which began April 1991). In July 1992, stations 25 through 28 were added in Florida Bay. Monthly sampling at stations 29-50 in Whitewater Bay were added to the monitoring program in September 1992. Biscayne Bay monthly monitoring began September 1993 for stations 100-125. In May 1996 an analysis of the data was performed to address the adequacy of spatial coverage. At that time, 10 station locations in the Biscayne Bay monitoring network were moved to provide coverage of North Biscayne Bay. The Ten Thousand Islands sites 51-75 were begun in Sept. 1994, the Shelf was sampled quarterly beginning in spring 1995, and the Cape Romano-Pine Island Sound area was started Jan. 1999. A summary of station locations and sampling period of record is shown in Table 1.

8
Figure 1.1. Fixed station locations for the SFWMD funded portion of the South Florida Coastal Water Quality Monitoring Network.

9
1.2. Field and Analytical Methods
Water samples were collected and analyzed using standard methodology outlined in the Quality Assurance Plan with prior approval from SFWMD and FDEP. Salinity, temperature (°C), dissolved oxygen (DO, mg l-1), and pH were measured 10 cm below the surface and 10 cm above the bottom using a combination sonde (Hydrolab 140). Sondes were calibrated prior to and after sampling to ensure accuracy.
Duplicate, unfiltered water samples were collected from 10 cm below the surface using sample rinsed 120 ml HDPE bottles and kept at ambient temperature in the dark during transport. Duplicate water samples for dissolved nutrient analysis were collected using sample rinsed 150 ml syringes. These samples were filtered by hand (25 mm glass fiber GF/F) into acetone-washed and sample rinsed 60 ml HDPE bottles, which were then capped and immediately placed on ice in the dark for transport. The wet filters, used for chlorophyll a analysis (CHLA), were placed in 2 ml plastic centrifuge tubes to which 1.5 ml of 90% acetone was added. They were then immediately capped and put into a dark bottle on ice for transport (APHA 1999).
Unfiltered water samples were analyzed for total organic carbon (TOC), total nitrogen (TN), total phosphorus (TP), alkaline phosphatase activity (APA), and turbidity (NTU). TOC was measured by direct injection onto hot platinum catalyst in a Shimadzu TOC-5000 after first acidifying to pH<2 and purging with CO2-free air. TN was measured using an ANTEK 7000N Nitrogen Analyzer using O2 as carrier gas instead of argon to promote complete recovery of the nitrogen in the water samples (Frankovich and Jones 1998). TP was determined using a dry ashing, acid hydrolysis technique (Solorzano and Sharp 1980). The APA assay measures the activity of alkaline phosphatase, an enzyme used by bacteria to mineralize phosphate from organic compounds (Hashimoto et al. 1985). This assay is performed by adding a known concentration of an organic phosphate compound (o-methylfluorescein phosphate) to an unfiltered water sample. Alkaline phosphatase in the water sample cleaves the phosphate, leaving o-methylfluorescein, a highly fluorescent compound. The fluorescence of initial and 2 hr incubations were measured using a Gilford Fluoro IV spectrofluorometer (excitation = 430 nm, emission = 507 nm) and subtracted to give APA (µM h-1). Turbidity was measured using an HF Scientific model DRT-15C turbidimeter and reported in NTU.
Filtrates were analyzed for soluble reactive phosphorus (SRP), nitrate + nitrite (NOX-), nitrite
(NO2-), ammonium (NH4
+), and silicate (Si(OH)4) by flow injection analysis (Alpkem model RFA 300). Filters for CHLA content (µg l-1) were allowed to extract for a minimum of 2 days at -20° C before analysis. Extracts were analyzed using a Gilford Fluoro IV Spectrofluorometer (excitation = 435 nm, emission = 667 nm) and compared to a standard curve of pure CHLA (Sigma).
Some parameters were not measured directly, but were calculated by difference. Nitrate (NO3
-) was calculated as NOX- - NO2
-. Dissolved inorganic nitrogen (DIN) was calculated as NOX
- + NH4+. Total organic nitrogen (TON) was defined as TN - DIN. Concentrations for all of
these water quality variables are reported in units of milligrams per liter (mg l-1) or the equivalent parts per million (ppm), except where noted. All nutrient concentrations are based on the atomic weight of primary nutrient species (ppm-N, ppm-P, and ppm-C), not the molecular weight. All N:P ratios discussed are calculated on a molar basis.

10
1.3. References APHA. 1999. Standard Methods for the Examination of Water and Wastewater. EPA Methods for Chemical Analysis of Water and Wastes, Revised March 1983. Frankovich, T. A., and R. D. Jones. 1998. A rapid, precise, and sensitive method for the determination of total nitrogen in natural waters. Marine Chemistry 60: 227-234. Hashimoto, Kitao, and Keiichiro. 1985. Relationship between alkaline phosphatase activity and orthophosphate in the present Tokyo Bay. Environ. Sci. Health A20: 781-908) Solorzano, L., and J. H. Sharp. 1980. Determination of total dissolved phosphorus and particulate phosphorus in natural waters. Limnol. Oceanogr. 25: 754-758.

11
2. STATE OF WATER QUALITY IN FLORIDA BAY Overall Period of Record
A spatial analysis of data from our monitoring program resulted in the delineation of 3 groups of stations, which have robust similarities in water quality (Fig. 2.1). We contend that these spatially contiguous groups of stations are the result of similar hydrodynamic forcing and processing of materials, hence we call them 'zones of similar influence'. The Eastern Bay zone acts most like a 'conventional' estuary in that it has a quasi-longitudinal salinity gradient caused by the mixing of freshwater runoff with seawater. In contrast, the Central Bay is a hydrographically isolated area with low and infrequent terrestrial freshwater input, a long water residence time, and high evaporative potential. The Western Bay zone is the most influenced by the Gulf of Mexico tides and is also isolated from direct overland freshwater sources.
-81.2 -81.0 -80.8 -80.6 -80.4 -80.224.8
25.0
25.2
25.4Florida Bay Water Quality Zones
Eastern Bay ( ), Central Bay, ( ), Western Bay ( ) Figure 2.1. Zones of similar water quality in Florida Bay
Climactic changes occurring over the data collection period of record had major effects on
the health of the bay. Precipitation rebounded from the drought during the late 1980's being equal to or greater than the long term average (141.5 cm yr-1) for 10 of the last 14 years (Fig 2.2.).

0
10
20
30
40
50
199119921993199419951996199719981999200020012002200320042005
cm m
o-1
Figure 2.2. Monthly rainfall in the Florida Bay area. The red line is long term monthly average (since 1948); the blue line is 12 month moving average.

Early in the record, salinity and total phosphorus (TP) concentrations declined baywide while turbidity (cloudiness of the water) increased dramatically. The salinity decline in Eastern and Central Florida Bay was dramatic early on and has since stabilized into a regular seasonal cycle (Fig. 2.3-2.5). The box-and-whisker plots presented in this and following figures show the range (boxes are quartiles; whiskers include 90% of data) and median (line in box) of the monthly data. Some of this decrease in Eastern Bay could be accounted for by increased freshwater flows from the Everglades but declines in other areas point to the climactic effect of increased rainfall during this period. The Central Bay continues to experience hypersaline conditions (>35) during the summer but the extent and duration of the events is much smaller.
Chlorophyll a concentrations (CHLA), a proxy for phytoplankton biomass, were particularly dynamic and spatially heterogeneous (Fig. 2.3-2.5). The Eastern Bay generally has the lowest CHLA while the Central Bay is highest. In the Eastern Bay, which makes up roughly half of the surface area of Florida Bay, CHLA has declined by 0.9 µg l-1 or 63%. Most of this decline occurred over a few months in the spring/summer of 1994 and has remained relatively stable. The isolated Central Bay zone underwent a 5-fold increase in CHLA from 1989-94 then rapidly declined to previous levels by 1996. In Western Florida Bay, there was a significant increase in CHLA, yet median concentrations remained modest (2 µg l-1) by most estuarine standards. There were significant blooms in Central and Western Bay immediately following Hurricanes Georges (Nov. 1998) but it was Hurricane Irene’s large rainfall input (Oct. 1999) which spiked the largest blooms all throughout the bay. It is important to note that these changes in CHLA (and turbidity) happened years after the poorly-understood seagrass die-off in 1987. It is possible that the death and decomposition of large amounts of seagrass biomass might partially explain some of the changes in water quality of Florida Bay but the connections are temporally disjoint and the processes indirect and not well understood.
As mentioned previously, TP concentrations have declined baywide over the 14 year period of record. As with salinity, most of these declines occurred early in the record. Unlike most other estuaries, increased terrestrial runoff may have been partially responsible for the decrease in TP concentrations in the Eastern Bay. This is because the TP concentrations of the runoff are at or below ambient levels in the bay. The elevated TP in the Central Bay is mostly due to concentration effect of high evaporation. Recently, there have been significant peaks during the fall season in both Eastern and Western Bays. It is important to understand that almost all the phosphorus measured as TP is in the form of organic matter which is less accessible to plants and algae than inorganic phosphate.
The dissolved inorganic nitrogen assemblage (DIN) is made up of ammonium (NH4+), nitrate
(NO3-), and nitrate (NO2
-). The Western Bay is lowest in DIN; phytoplankton in this region may be limited by N availability on a regular basis. DIN in the Eastern Bay is a little higher and is mostly in the form of NO3
- while highest levels are found in the Central Bay as NH4+.
Turbidity in the Central and Western Bays have increased greatly since 1991 (not shown). Turbidity in Eastern Bay increased 2-fold from 1991-93, while Central and Western Bays increased by factors of 20 and 4, respectively. Turbidity across the bay has since stabilized and possibly declined but certainly not to previous levels. In general, the Eastern Bay has the clearest water, which is due to a combination of factors such as high seagrass cover, more protected basins, low tidal energy, and shallow sediment coverage. We are unsure as to the cause, but the loss of seagrass coverage may have destabilized the bottom so that it is more easily disturbed by wind events.

14
Eastern Florida Bay Zone
0
10
20
30
40
50
60
1989
-06
1989
-12
1990
-04
1990
-08
1990
-12
1991
-04
1991
-09
1992
-01
1992
-05
1992
-09
1993
-01
1993
-05
1993
-09
1994
-01
1994
-05
1994
-09
1995
-02
1995
-06
1995
-10
1996
-02
1996
-06
1996
-10
1997
-02
1997
-06
1997
-10
1998
-02
1998
-06
1998
-11
1999
-03
1999
-07
1999
-11
2000
-03
2000
-07
2000
-11
2001
-03
2001
-07
2001
-11
2002
-03
2002
-07
2002
-11
2003
-03
2003
-07
2003
-11
2004
-03
2004
-07
2004
-11
0.0
0.2
0.4
0.6
0.8
1.0
ppm
1989
-06
1989
-12
1990
-04
1990
-08
1990
-12
1991
-04
1991
-09
1992
-01
1992
-05
1992
-09
1993
-01
1993
-05
1993
-09
1994
-01
1994
-05
1994
-09
1995
-02
1995
-06
1995
-10
1996
-02
1996
-06
1996
-10
1997
-02
1997
-06
1997
-10
1998
-02
1998
-06
1998
-11
1999
-03
1999
-07
1999
-11
2000
-03
2000
-07
2000
-11
2001
-03
2001
-07
2001
-11
2002
-03
2002
-07
2002
-11
2003
-03
2003
-07
2003
-11
2004
-03
2004
-07
2004
-11
0.00
0.01
0.02
0.03
0.04
ppm
1989
-06
1989
-12
1990
-04
1990
-08
1990
-12
1991
-04
1991
-09
1992
-01
1992
-05
1992
-09
1993
-01
1993
-05
1993
-09
1994
-01
1994
-05
1994
-09
1995
-02
1995
-06
1995
-10
1996
-02
1996
-06
1996
-10
1997
-02
1997
-06
1997
-10
1998
-02
1998
-06
1998
-11
1999
-03
1999
-07
1999
-11
2000
-03
2000
-07
2000
-11
2001
-03
2001
-07
2001
-11
2002
-03
2002
-07
2002
-11
2003
-03
2003
-07
2003
-11
2004
-03
2004
-07
2004
-11
0.0
1.0
2.0
3.0
4.0
5.0
6.0
7.0
ug/l
1989
-06
1989
-12
1990
-04
1990
-08
1990
-12
1991
-04
1991
-09
1992
-01
1992
-05
1992
-09
1993
-01
1993
-05
1993
-09
1994
-01
1994
-05
1994
-09
1995
-02
1995
-06
1995
-10
1996
-02
1996
-06
1996
-10
1997
-02
1997
-06
1997
-10
1998
-02
1998
-06
1998
-11
1999
-03
1999
-07
1999
-11
2000
-03
2000
-07
2000
-11
2001
-03
2001
-07
2001
-11
2002
-03
2002
-07
2002
-11
2003
-03
2003
-07
2003
-11
2004
-03
2004
-07
2004
-11
Salinity
DIN
TP
CHLA
Figure 2.3. Box-and-whisker plots of water quality in Eastern Florida Bay by survey.

15
Central Florida Bay Zone
0
10
20
30
40
50
60
70
1989
-06
1989
-12
1990
-04
1990
-08
1990
-12
1991
-04
1991
-09
1992
-01
1992
-05
1992
-09
1993
-01
1993
-05
1993
-09
1994
-01
1994
-05
1994
-09
1995
-02
1995
-06
1995
-10
1996
-02
1996
-06
1996
-10
1997
-02
1997
-06
1997
-10
1998
-02
1998
-06
1998
-11
1999
-03
1999
-07
1999
-11
2000
-03
2000
-07
2000
-11
2001
-03
2001
-07
2001
-11
2002
-03
2002
-07
2002
-11
2003
-03
2003
-07
2003
-11
2004
-03
2004
-07
2004
-11
0.0
0.2
0.4
0.6
0.8
1.0
1.2
ppm
1989
-06
1989
-12
1990
-04
1990
-08
1990
-12
1991
-04
1991
-09
1992
-01
1992
-05
1992
-09
1993
-01
1993
-05
1993
-09
1994
-01
1994
-05
1994
-09
1995
-02
1995
-06
1995
-10
1996
-02
1996
-06
1996
-10
1997
-02
1997
-06
1997
-10
1998
-02
1998
-06
1998
-11
1999
-03
1999
-07
1999
-11
2000
-03
2000
-07
2000
-11
2001
-03
2001
-07
2001
-11
2002
-03
2002
-07
2002
-11
2003
-03
2003
-07
2003
-11
2004
-03
2004
-07
2004
-11
0.00
0.02
0.04
0.06
0.08
0.10
0.12
0.14
ppm
1989
-06
1989
-12
1990
-04
1990
-08
1990
-12
1991
-04
1991
-09
1992
-01
1992
-05
1992
-09
1993
-01
1993
-05
1993
-09
1994
-01
1994
-05
1994
-09
1995
-02
1995
-06
1995
-10
1996
-02
1996
-06
1996
-10
1997
-02
1997
-06
1997
-10
1998
-02
1998
-06
1998
-11
1999
-03
1999
-07
1999
-11
2000
-03
2000
-07
2000
-11
2001
-03
2001
-07
2001
-11
2002
-03
2002
-07
2002
-11
2003
-03
2003
-07
2003
-11
2004
-03
2004
-07
2004
-11
0
5
10
15
20
25
30
35
ug/l
1989
-06
1989
-12
1990
-04
1990
-08
1990
-12
1991
-04
1991
-09
1992
-01
1992
-05
1992
-09
1993
-01
1993
-05
1993
-09
1994
-01
1994
-05
1994
-09
1995
-02
1995
-06
1995
-10
1996
-02
1996
-06
1996
-10
1997
-02
1997
-06
1997
-10
1998
-02
1998
-06
1998
-11
1999
-03
1999
-07
1999
-11
2000
-03
2000
-07
2000
-11
2001
-03
2001
-07
2001
-11
2002
-03
2002
-07
2002
-11
2003
-03
2003
-07
2003
-11
2004
-03
2004
-07
2004
-11
Salinity
DIN
TP
CHLA
Figure 2.4. Box-and-whisker plots of water quality in Central Florida Bay by survey.

16
Western Florida Bay Zone
0
10
20
30
40
50
60
1989
-06
1989
-12
1990
-04
1990
-08
1990
-12
1991
-04
1991
-09
1992
-01
1992
-05
1992
-09
1993
-01
1993
-05
1993
-09
1994
-01
1994
-05
1994
-09
1995
-02
1995
-06
1995
-10
1996
-02
1996
-06
1996
-10
1997
-02
1997
-06
1997
-10
1998
-02
1998
-06
1998
-11
1999
-03
1999
-07
1999
-11
2000
-03
2000
-07
2000
-11
2001
-03
2001
-07
2001
-11
2002
-03
2002
-07
2002
-11
2003
-03
2003
-07
2003
-11
2004
-03
2004
-07
2004
-11
0.00
0.05
0.10
0.15
0.20
0.25
0.30
0.35
ppm
1989
-06
1989
-12
1990
-04
1990
-08
1990
-12
1991
-04
1991
-09
1992
-01
1992
-05
1992
-09
1993
-01
1993
-05
1993
-09
1994
-01
1994
-05
1994
-09
1995
-02
1995
-06
1995
-10
1996
-02
1996
-06
1996
-10
1997
-02
1997
-06
1997
-10
1998
-02
1998
-06
1998
-11
1999
-03
1999
-07
1999
-11
2000
-03
2000
-07
2000
-11
2001
-03
2001
-07
2001
-11
2002
-03
2002
-07
2002
-11
2003
-03
2003
-07
2003
-11
2004
-03
2004
-07
2004
-11
0.00
0.05
0.10
0.15
0.20
0.25
ppm
1989
-06
1989
-12
1990
-04
1990
-08
1990
-12
1991
-04
1991
-09
1992
-01
1992
-05
1992
-09
1993
-01
1993
-05
1993
-09
1994
-01
1994
-05
1994
-09
1995
-02
1995
-06
1995
-10
1996
-02
1996
-06
1996
-10
1997
-02
1997
-06
1997
-10
1998
-02
1998
-06
1998
-11
1999
-03
1999
-07
1999
-11
2000
-03
2000
-07
2000
-11
2001
-03
2001
-07
2001
-11
2002
-03
2002
-07
2002
-11
2003
-03
2003
-07
2003
-11
2004
-03
2004
-07
2004
-11
0
5
10
15
20
25
ug/l
1989
-06
1989
-12
1990
-04
1990
-08
1990
-12
1991
-04
1991
-09
1992
-01
1992
-05
1992
-09
1993
-01
1993
-05
1993
-09
1994
-01
1994
-05
1994
-09
1995
-02
1995
-06
1995
-10
1996
-02
1996
-06
1996
-10
1997
-02
1997
-06
1997
-10
1998
-02
1998
-06
1998
-11
1999
-03
1999
-07
1999
-11
2000
-03
2000
-07
2000
-11
2001
-03
2001
-07
2001
-11
2002
-03
2002
-07
2002
-11
2003
-03
2003
-07
2003
-11
2004
-03
2004
-07
2004
-11
Salinity
DIN
TP
CHLA
Figure 2.5. Box-and-whisker plots of water quality in Western Florida Bay by survey.

17
2004 Alone 2004 was a relatively dry year with much of the bay experiencing a period of hypersalinity
which began in late spring/early summer (Fig 2.6-2.8). The Eastern and Central Bay were most affected by the hypersalinity. Even the four hurricanes circulating around South Florida did not alleviate the hypersalinity in Eastern Bay. Overall DIN concentrations in the Eastern and Central Bay were lower that the grand median, except for September when we saw a spike, possibly as a result of the hurricanes. It is hard to tell because Florida Bay was not sampled between Aug 29 and Sept. 28 when the bulk of hurricane activity occurred.
TON, TP, CHLA, and turbidity in all parts of the Bay were lower during 2004 than the grand median. TOC fluctuated but was generally lower than the grand median. Annual patterns in temperature and DO were unremarkable with values generally fluctuating around the median for all areas of the bay. Data, Graphs, and Figures All data for the period of record are available at:
http://serc.fiu.edu/wqmnetwork/SFWMD-CD/DataDL.htm Monthly time series graphs for all measured variables for each station are available at:
http://serc.fiu.edu/wqmnetwork/SFWMD-CD/FB.htm Contour maps showing spatial distributions of all measured variables (quarterly) are available at:
http://serc.fiu.edu/wqmnetwork/SFWMD-CD/ContourMaps.htm

18
Eastern Florida Bay (FBE)
DIN
0.000.020.040.060.080.100.120.140.16
1 2 3 4 5 6 7 8 9 10 11 12
Month
ppm
Median
2004
TON
0.0
2.0
4.0
6.0
8.0
10.0
1 2 3 4 5 6 7 8 9 10 11 12
Month
ppm
Median
2004
TOC
0.00.10.20.30.40.50.60.70.8
1 2 3 4 5 6 7 8 9 10 11 12
Month
ppm
Median
2004
TP
0.000
0.002
0.004
0.006
0.008
0.010
1 2 3 4 5 6 7 8 9 10 11 12
Month
ppm
Median
2004
Temp.
05
101520253035
1 2 3 4 5 6 7 8 9 10 11 12
Month
oC
Median
2004
CHLA
0.00.10.20.30.40.50.60.7
1 2 3 4 5 6 7 8 9 10 11 12
Month
ppb
Median
2004
DO
0.01.02.03.04.05.06.07.08.0
1 2 3 4 5 6 7 8 9 10 11 12
Month
ppm
Median
2004
Salinity
0
10
20
30
40
50
1 2 3 4 5 6 7 8 9 10 11 12
MonthMedian
2004
Turbidity
0.00.51.01.52.02.53.03.5
1 2 3 4 5 6 7 8 9 10 11 12
Month
NTU
Median
2004
Figure 2.6. Comparison of long-term median with 2004 data.

19
Central Florida Bay (FBC)
DIN
0.00
0.02
0.04
0.06
0.08
0.10
1 2 3 4 5 6 7 8 9 10 11 12
Month
ppm
Median
2004
TON
0
5
10
15
20
1 2 3 4 5 6 7 8 9 10 11 12
Month
ppm
Median
2004
TOC
0.00.20.40.60.81.01.21.4
1 2 3 4 5 6 7 8 9 10 11 12
Month
ppm
Median
2004
TP
0.000
0.005
0.010
0.015
0.020
0.025
1 2 3 4 5 6 7 8 9 10 11 12
Month
ppm
Median
2004
Temp.
05
101520253035
1 2 3 4 5 6 7 8 9 10 11 12
Month
oC
Median
2004
CHLA
0.0
1.0
2.0
3.0
4.0
5.0
1 2 3 4 5 6 7 8 9 10 11 12
Month
ppb
Median
2004
DO
0.01.02.03.04.05.06.07.08.0
1 2 3 4 5 6 7 8 9 10 11 12
Month
ppm
Median
2004
Salinity
0
10
20
30
40
50
1 2 3 4 5 6 7 8 9 10 11 12
MonthMedian
2004
Turbidity
0.0
2.0
4.0
6.0
8.0
10.0
1 2 3 4 5 6 7 8 9 10 11 12
Month
NTU
Median
2004
Figure 2.7. Comparison of long-term median with 2004 data.

20
Western Florida Bay (FBW)
DIN
0.000
0.005
0.010
0.015
0.020
1 2 3 4 5 6 7 8 9 10 11 12
Month
ppm
Median
2004
TON
0.01.02.03.04.05.06.07.0
1 2 3 4 5 6 7 8 9 10 11 12
Month
ppm
Median
2004
TOC
0.0
0.2
0.4
0.6
0.8
1.0
1 2 3 4 5 6 7 8 9 10 11 12
Month
ppm
Median
2004
TP
0.000
0.005
0.010
0.015
0.020
1 2 3 4 5 6 7 8 9 10 11 12
Month
ppm
Median
2004
Temp.
05
101520253035
1 2 3 4 5 6 7 8 9 10 11 12
Month
oC
Median
2004
CHLA
0.0
0.5
1.0
1.5
2.0
2.5
3.0
1 2 3 4 5 6 7 8 9 10 11 12
Month
ppb
Median
2004
DO
0.01.02.03.04.05.06.07.08.0
1 2 3 4 5 6 7 8 9 10 11 12
Month
ppm
Median
2004
Salinity
0
10
20
30
40
50
1 2 3 4 5 6 7 8 9 10 11 12
MonthMedian
2004
Turbidity
0.01.02.03.04.05.06.07.08.0
1 2 3 4 5 6 7 8 9 10 11 12
Month
NTU
Median
2004
Figure 2.7. Comparison of long-term median with 2004 data.

21
3. STATE OF WATER QUALITY IN WHITEWATER BAY - TEN THOUSAND ISLANDS COMPLEX
Overall Period of Record
A spatial analysis of data from our monitoring program resulted in the delineation of 6 groups of stations, which have robust similarities in water quality (Fig. 3.1). The first cluster was composed of 13 stations in and around the Shark, Harney, Broad, and Lostmans Rivers and is called the Mangrove River (MR) group. This cluster also included a sampling station just off the Faka Union Canal. The second cluster was made up of the 8 stations enclosed within Whitewater Bay proper (WWB). Twelve stations were sited mostly in and around the coastal islands of TTI-WWB formed the Gulf Island group (GI). The water quality characteristics at the Coot Bay site (COOT) were sufficiently different so as to be a cluster of its own. The next cluster contained the northernmost 2 stations in the Blackwater River estuary (BLK). Finally, the Inland Wilderness Waterway zone (IWW) included 11 stations distributed throughout the inside passage as well as the Chatham River and the station off Everglades City.
-81.5 -81.025.0
25.5
4243
444546 474849
2930 31
32333435
3637 38
39
63
70
4041
5152
6566
6768
69717273
50
7475
53545556
57585960
6162
64Faka Union Canal
Everglades City
Blackwater River
Gulf IslandsInner Waterway
MangroveRivers
Coot Bay
WhitewaterBay
Mangrove Rivers, Whitewater Bay, Gulf Islands,Coot Bay, Blackwater River, Inner Waterway
Figure 3.1. Zones of similar water quality in Whitewater Bay-Ten Thousand Islands complex
Marked differences in physical, chemical, and biological characteristics among zones were illustrated by this technique. The general spatial trend is one of highly variable salinity as a

22
result of Shark Slough inputs in the south (Fig. 3.2-3.6). Salinity in the Gulf Islands zone was more consistent due to Gulf of Mexico influence but also is affected by Caloosahatchee River outputs. CHLA concentrations were relatively high in this region compared to Florida Bay and the Shelf. Highest CHLA were observed in the semi-enclosed areas such as Whitewater Bay and the Inner Wilderness Waterway. It is possible that the longer water residence times exhibited in these areas promoted the intensification of algal biomass. TP tended to be lowest in Whitewater Bay and Mangrove Rivers but increased northward along the coast. The spatial distribution of DIN was generally opposite to that of TP. The net effect was the formation of a gradient with strong phosphorus limitation occurring in the southern region which shifted to a more balanced N:P ratio in the northern area around the Blackwater River. The Mangrove Rivers were a significant source of TOC to the Shelf. TOC was highest in the south and declined northward along the coast.
We believe these gradients are the result of coastal geomorphology and watershed characteristics in the region. The width of the mangrove forest is widest in the south (15 km) but grades to only 4 km wide in the northern TTI; this being a function of elevation and sediment type. Whitewater Bay is a semi-enclosed body of water with a relatively long residence time, which receives overland freshwater input from the Everglades marsh. The long water residence time may explain the very low P concentrations (from biological uptake), while the high evaporation rate would tend to concentrate dissolved organic matter (DOM). The Mangrove Rivers are directly connected to the Shark River Slough and therefore have a huge watershed relative to their volume. Freshwater inputs from this source are very low in P while the extensive mangrove forest contributes much DOM. The Inner Waterway is an intermediate zone in all respects; having extensive channelization but low freshwater input. The Gulf Island zone has very low freshwater input due to the poorly drained watershed of the Big Cypress Basin. Instead of mangrove river channels there are many mangrove islands set in low tidal energy environment situated behind the Cape Romano Shoals. Finally there is the Blackwater River cluster with highest TP concentrations. There is considerable agriculture (tomatoes, etc.) in the Blackwater River watershed, which may contribute significant amounts of P to the system via drainage ditches. Further analysis of this relationship is planned.

23
Whitewater Bay Zone
05
10152025303540
1992
-09
1993
-01
1993
-05
1993
-09
1994
-01
1994
-05
1994
-09
1995
-01
1995
-05
1995
-09
1996
-01
1996
-05
1996
-09
1997
-02
1997
-06
1997
-10
1998
-02
1998
-06
1998
-11
1999
-03
1999
-07
1999
-11
2000
-03
2000
-07
2000
-11
2001
-03
2001
-09
2002
-01
2002
-05
2002
-09
2003
-01
2003
-05
2003
-09
2004
-01
2004
-05
2004
-09
0.0
0.1
0.2
0.3
0.4
0.5
ppm
1992
-09
1993
-01
1993
-05
1993
-09
1994
-01
1994
-05
1994
-09
1995
-01
1995
-05
1995
-09
1996
-01
1996
-05
1996
-09
1997
-02
1997
-06
1997
-10
1998
-02
1998
-06
1998
-11
1999
-03
1999
-07
1999
-11
2000
-03
2000
-07
2000
-11
2001
-03
2001
-09
2002
-01
2002
-05
2002
-09
2003
-01
2003
-05
2003
-09
2004
-01
2004
-05
2004
-09
0.00
0.02
0.04
0.06
0.08
0.10
ppm
1992
-09
1993
-01
1993
-05
1993
-09
1994
-01
1994
-05
1994
-09
1995
-01
1995
-05
1995
-09
1996
-01
1996
-05
1996
-09
1997
-02
1997
-06
1997
-10
1998
-02
1998
-06
1998
-11
1999
-03
1999
-07
1999
-11
2000
-03
2000
-07
2000
-11
2001
-03
2001
-09
2002
-01
2002
-05
2002
-09
2003
-01
2003
-05
2003
-09
2004
-01
2004
-05
2004
-09
0
5
10
15
20
25
30
ug/l
1992
-09
1993
-01
1993
-05
1993
-09
1994
-01
1994
-05
1994
-09
1995
-01
1995
-05
1995
-09
1996
-01
1996
-05
1996
-09
1997
-02
1997
-06
1997
-10
1998
-02
1998
-06
1998
-11
1999
-03
1999
-07
1999
-11
2000
-03
2000
-07
2000
-11
2001
-03
2001
-09
2002
-01
2002
-05
2002
-09
2003
-01
2003
-05
2003
-09
2004
-01
2004
-05
2004
-09
Salinity
DIN
TP
CHLA
Figure 3.2. Box-and-whisker plots of water quality in WWB-TTI by survey.

24
Mangrove Rivers Zone
05
10152025303540
1992
-09
1993
-01
1993
-05
1993
-09
1994
-01
1994
-05
1994
-09
1995
-01
1995
-05
1995
-09
1996
-01
1996
-05
1996
-09
1997
-01
1997
-05
1997
-09
1998
-01
1998
-05
1998
-10
1999
-02
1999
-06
1999
-10
2000
-02
2000
-06
2000
-10
2001
-02
2001
-06
2001
-10
2002
-02
2002
-06
2002
-10
2003
-02
2003
-06
2003
-10
2004
-02
2004
-06
2004
-10
0.0
0.1
0.2
0.3
0.4
0.5
ppm
1992
-09
1993
-01
1993
-05
1993
-09
1994
-01
1994
-05
1994
-09
1995
-01
1995
-05
1995
-09
1996
-01
1996
-05
1996
-09
1997
-01
1997
-05
1997
-09
1998
-01
1998
-05
1998
-10
1999
-02
1999
-06
1999
-10
2000
-02
2000
-06
2000
-10
2001
-02
2001
-06
2001
-10
2002
-02
2002
-06
2002
-10
2003
-02
2003
-06
2003
-10
2004
-02
2004
-06
2004
-10
0.00
0.02
0.04
0.06
0.08
0.10
0.12
ppm
1992
-09
1993
-01
1993
-05
1993
-09
1994
-01
1994
-05
1994
-09
1995
-01
1995
-05
1995
-09
1996
-01
1996
-05
1996
-09
1997
-01
1997
-05
1997
-09
1998
-01
1998
-05
1998
-10
1999
-02
1999
-06
1999
-10
2000
-02
2000
-06
2000
-10
2001
-02
2001
-06
2001
-10
2002
-02
2002
-06
2002
-10
2003
-02
2003
-06
2003
-10
2004
-02
2004
-06
2004
-10
02468
1012141618
ug/l
1992
-09
1993
-01
1993
-05
1993
-09
1994
-01
1994
-05
1994
-09
1995
-01
1995
-05
1995
-09
1996
-01
1996
-05
1996
-09
1997
-01
1997
-05
1997
-09
1998
-01
1998
-05
1998
-10
1999
-02
1999
-06
1999
-10
2000
-02
2000
-06
2000
-10
2001
-02
2001
-06
2001
-10
2002
-02
2002
-06
2002
-10
2003
-02
2003
-06
2003
-10
2004
-02
2004
-06
2004
-10
Salinity
DIN
TP
CHLA
Figure 3.3. Box-and-whisker plots of water quality in WWB-TTI by survey.
25
Gulf Islands Zone
05
10152025303540
1992
-09
1993
-01
1993
-05
1993
-09
1994
-01
1994
-05
1994
-09
1995
-01
1995
-05
1995
-09
1996
-01
1996
-05
1996
-09
1997
-01
1997
-05
1997
-09
1998
-01
1998
-05
1998
-10
1999
-02
1999
-06
1999
-10
2000
-02
2000
-06
2000
-10
2001
-02
2001
-06
2001
-10
2002
-02
2002
-06
2002
-10
2003
-02
2003
-06
2003
-10
2004
-02
2004
-06
2004
-10
0.00
0.05
0.10
0.15
0.20
0.25
ppm
1992
-09
1993
-01
1993
-05
1993
-09
1994
-01
1994
-05
1994
-09
1995
-01
1995
-05
1995
-09
1996
-01
1996
-05
1996
-09
1997
-01
1997
-05
1997
-09
1998
-01
1998
-05
1998
-10
1999
-02
1999
-06
1999
-10
2000
-02
2000
-06
2000
-10
2001
-02
2001
-06
2001
-10
2002
-02
2002
-06
2002
-10
2003
-02
2003
-06
2003
-10
2004
-02
2004
-06
2004
-10
0.00
0.05
0.10
0.15
0.20
ppm
1992
-09
1993
-01
1993
-05
1993
-09
1994
-01
1994
-05
1994
-09
1995
-01
1995
-05
1995
-09
1996
-01
1996
-05
1996
-09
1997
-01
1997
-05
1997
-09
1998
-01
1998
-05
1998
-10
1999
-02
1999
-06
1999
-10
2000
-02
2000
-06
2000
-10
2001
-02
2001
-06
2001
-10
2002
-02
2002
-06
2002
-10
2003
-02
2003
-06
2003
-10
2004
-02
2004
-06
2004
-10
02468
1012141618
ug/l
1992
-09
1993
-01
1993
-05
1993
-09
1994
-01
1994
-05
1994
-09
1995
-01
1995
-05
1995
-09
1996
-01
1996
-05
1996
-09
1997
-01
1997
-05
1997
-09
1998
-01
1998
-05
1998
-10
1999
-02
1999
-06
1999
-10
2000
-02
2000
-06
2000
-10
2001
-02
2001
-06
2001
-10
2002
-02
2002
-06
2002
-10
2003
-02
2003
-06
2003
-10
2004
-02
2004
-06
2004
-10
Salinity
DIN
TP
CHLA
Figure 3.4. Box-and-whisker plots of water quality in WWB-TTI by survey.

26
Inner Waterway Zone
05
1015202530354045
1994
-09
1994
-12
1995
-03
1995
-06
1995
-09
1996
-01
1996
-05
1996
-09
1996
-12
1997
-03
1997
-06
1997
-09
1997
-12
1998
-03
1998
-06
1998
-10
1999
-01
1999
-04
1999
-07
1999
-10
2000
-01
2000
-04
2000
-07
2000
-10
2001
-01
2001
-04
2001
-07
2001
-10
2002
-01
2002
-04
2002
-07
2002
-10
2003
-01
2003
-04
2003
-07
2003
-10
2004
-01
2004
-04
2004
-07
2004
-10
0.00
0.05
0.10
0.15
0.20
0.25
0.30
0.35
ppm
1994
-09
1994
-12
1995
-03
1995
-06
1995
-09
1996
-01
1996
-05
1996
-09
1996
-12
1997
-03
1997
-06
1997
-09
1997
-12
1998
-03
1998
-06
1998
-10
1999
-01
1999
-04
1999
-07
1999
-10
2000
-01
2000
-04
2000
-07
2000
-10
2001
-01
2001
-04
2001
-07
2001
-10
2002
-01
2002
-04
2002
-07
2002
-10
2003
-01
2003
-04
2003
-07
2003
-10
2004
-01
2004
-04
2004
-07
2004
-10
0.00
0.05
0.10
0.15
0.20
0.25
ppm
1994
-09
1994
-12
1995
-03
1995
-06
1995
-09
1996
-01
1996
-05
1996
-09
1996
-12
1997
-03
1997
-06
1997
-09
1997
-12
1998
-03
1998
-06
1998
-10
1999
-01
1999
-04
1999
-07
1999
-10
2000
-01
2000
-04
2000
-07
2000
-10
2001
-01
2001
-04
2001
-07
2001
-10
2002
-01
2002
-04
2002
-07
2002
-10
2003
-01
2003
-04
2003
-07
2003
-10
2004
-01
2004
-04
2004
-07
2004
-10
0
5
10
15
20
25
ug/l
1994
-09
1994
-12
1995
-03
1995
-06
1995
-09
1996
-01
1996
-05
1996
-09
1996
-12
1997
-03
1997
-06
1997
-09
1997
-12
1998
-03
1998
-06
1998
-10
1999
-01
1999
-04
1999
-07
1999
-10
2000
-01
2000
-04
2000
-07
2000
-10
2001
-01
2001
-04
2001
-07
2001
-10
2002
-01
2002
-04
2002
-07
2002
-10
2003
-01
2003
-04
2003
-07
2003
-10
2004
-01
2004
-04
2004
-07
2004
-10
Salinity
DIN
TP
CHLA
Figure 3.5. Box-and-whisker plots of water quality in WWB-TTI by survey.

27
Blackwater River Zone
05
10152025303540
1994
-09
1994
-12
1995
-03
1995
-06
1995
-09
1996
-02
1996
-07
1996
-10
1997
-01
1997
-04
1997
-07
1997
-10
1998
-01
1998
-04
1998
-07
1998
-11
1999
-02
1999
-05
1999
-08
1999
-11
2000
-02
2000
-05
2000
-08
2000
-11
2001
-02
2001
-05
2001
-08
2001
-11
2002
-02
2002
-05
2002
-08
2002
-11
2003
-02
2003
-05
2003
-08
2003
-11
2004
-02
2004
-05
2004
-08
2004
-11
0.00
0.05
0.10
0.15
0.20
0.25
0.30
ppm
1994
-09
1994
-12
1995
-03
1995
-06
1995
-09
1996
-02
1996
-07
1996
-10
1997
-01
1997
-04
1997
-07
1997
-10
1998
-01
1998
-04
1998
-07
1998
-11
1999
-02
1999
-05
1999
-08
1999
-11
2000
-02
2000
-05
2000
-08
2000
-11
2001
-02
2001
-05
2001
-08
2001
-11
2002
-02
2002
-05
2002
-08
2002
-11
2003
-02
2003
-05
2003
-08
2003
-11
2004
-02
2004
-05
2004
-08
2004
-11
0.00
0.05
0.10
0.15
0.20
0.25
ppm
1994
-09
1994
-12
1995
-03
1995
-06
1995
-09
1996
-02
1996
-07
1996
-10
1997
-01
1997
-04
1997
-07
1997
-10
1998
-01
1998
-04
1998
-07
1998
-11
1999
-02
1999
-05
1999
-08
1999
-11
2000
-02
2000
-05
2000
-08
2000
-11
2001
-02
2001
-05
2001
-08
2001
-11
2002
-02
2002
-05
2002
-08
2002
-11
2003
-02
2003
-05
2003
-08
2003
-11
2004
-02
2004
-05
2004
-08
2004
-11
0
5
10
15
20
ug/l
1994
-09
1994
-12
1995
-03
1995
-06
1995
-09
1996
-02
1996
-07
1996
-10
1997
-01
1997
-04
1997
-07
1997
-10
1998
-01
1998
-04
1998
-07
1998
-11
1999
-02
1999
-05
1999
-08
1999
-11
2000
-02
2000
-05
2000
-08
2000
-11
2001
-02
2001
-05
2001
-08
2001
-11
2002
-02
2002
-05
2002
-08
2002
-11
2003
-02
2003
-05
2003
-08
2003
-11
2004
-02
2004
-05
2004
-08
2004
-11
Salinity
DIN
TP
CHLA
Figure 3.6. Box-and-whisker plots of water quality in WWB-TTI by survey.
28
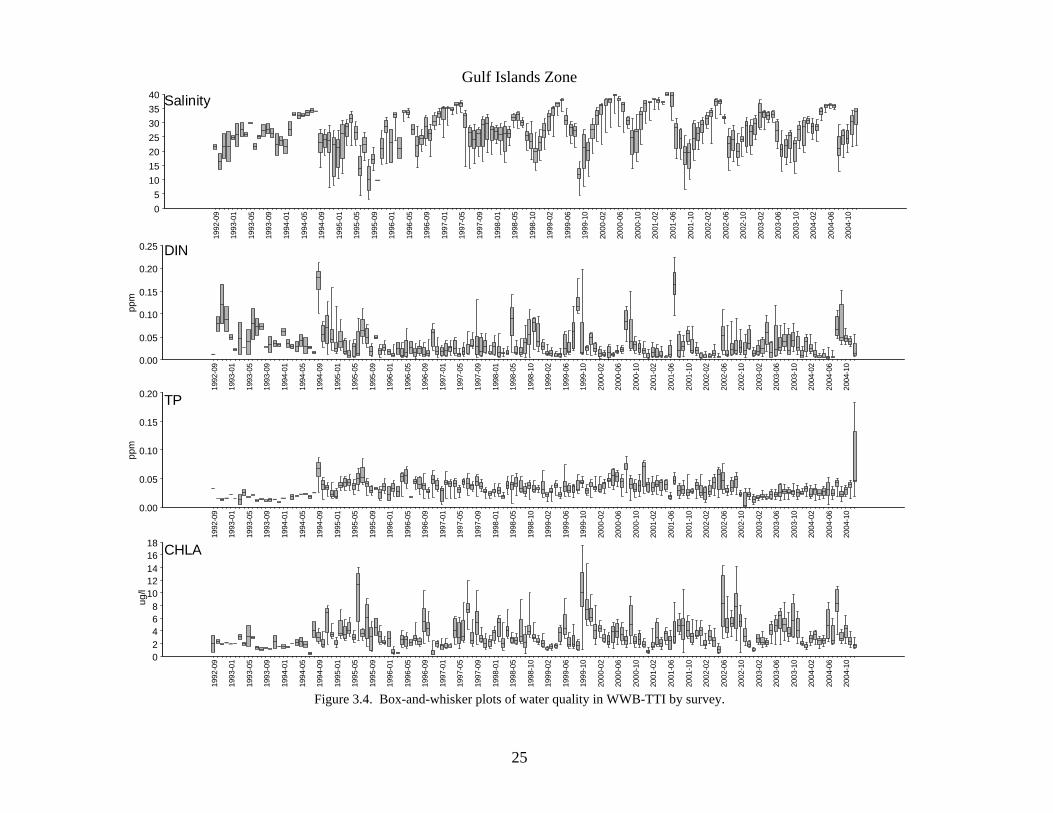
2004 Alone The influence of freshwater input from the Everglades is very significant to this region.
Large salinity variations are the norm, being driven by both climactic events and water management practices (Fig. 3.7-3.10). As 2004 was a dry year in terms of precipitation, some hypersaline events were observed. Hypersalinity was pronounced in Whitewater Bay, Mangrove Rivers, Gulf Islands, and Inner Waterway zones. The most extensive period of elevated salinity occurred in Whitewater Bay, with salinities doubled the norm during June and July.
Overall DIN concentrations in the area were lower that the grand median. The exception was the Ten Thousand Islands during Aug. to Oct. when we saw a spike in concentration (with a concurrent drop in salinity), possibly as a result of the hurricanes.
Most of the time, TON, TP, TOC, and turbidity in all parts of the TTI_WWB were lower during 2004 than the grand median. Spikes in CHLA were evident from the record showing a generalized response of the phytoplankton to DIN inputs. An interesting spike in DIN was observed in Whitewater Bay and Mangrove Rivers during December. We have no idea as to what precipitated this event, but the data from Jan. 2005 showed that concentrations had returned to normal by the next sampling event. Annual patterns in temperature and DO were unremarkable with values generally fluctuating around the median for all areas.
Data, Graphs, and Figures All data for the period of record are available at:
http://serc.fiu.edu/wqmnetwork/SFWMD-CD/DataDL.htm Monthly time series graphs for all measured variables for each station are available at:
http://serc.fiu.edu/wqmnetwork/SFWMD-CD/WWB.htm Contour maps showing spatial distributions of all measured variables (quarterly) are available at:
http://serc.fiu.edu/wqmnetwork/SFWMD-CD/ContourMaps.htm

29
Whitewater Bay (WWB)
DIN
0.00
0.05
0.10
0.15
0.20
0.25
1 2 3 4 5 6 7 8 9 10 11 12
Month
ppm
Median
2004
TON
0
5
10
15
20
1 2 3 4 5 6 7 8 9 10 11 12
Month
ppm
Median
2004
TOC
0.0
0.2
0.4
0.6
0.8
1.0
1 2 3 4 5 6 7 8 9 10 11 12
Month
ppm
Median
2004
TP
0.000
0.005
0.010
0.015
0.020
0.025
1 2 3 4 5 6 7 8 9 10 11 12
Month
ppm
Median
2004
Temp.
05
101520253035
1 2 3 4 5 6 7 8 9 10 11 12
Month
oC
Median
2004
CHLA
0.00.51.01.52.02.53.03.54.0
1 2 3 4 5 6 7 8 9 10 11 12
Month
ppb
Median
2004
DO
0.0
2.0
4.0
6.0
8.0
10.0
1 2 3 4 5 6 7 8 9 10 11 12
Month
ppm
Median
2004
Salinity
05
101520253035
1 2 3 4 5 6 7 8 9 10 11 12
MonthMedian
2004
Turbidity
0.01.02.03.04.05.06.07.0
1 2 3 4 5 6 7 8 9 10 11 12
Month
NTU
Median
2004
Figure 3.7. Comparison of long-term median with 2004 data.

30
Mangrove Rivers (MR)
DIN
0.000.010.020.030.040.050.060.07
1 2 3 4 5 6 7 8 9 10 11 12
Month
ppm
Median
2004
TON
02468
10121416
1 2 3 4 5 6 7 8 9 10 11 12
Month
ppm
Median
2004
TOC
0.00.10.20.30.40.50.60.70.8
1 2 3 4 5 6 7 8 9 10 11 12
Month
ppm
Median
2004
TP
0.000
0.005
0.010
0.015
0.020
0.025
0.030
1 2 3 4 5 6 7 8 9 10 11 12
Month
ppm
Median
2004
Temp.
05
101520253035
1 2 3 4 5 6 7 8 9 10 11 12
Month
oC
Median
2004
CHLA
0.01.02.03.04.05.06.07.0
1 2 3 4 5 6 7 8 9 10 11 12
Month
ppb
Median
2004
DO
0.01.02.03.04.05.06.07.08.0
1 2 3 4 5 6 7 8 9 10 11 12
Month
ppm
Median
2004
Salinity
05
10152025303540
1 2 3 4 5 6 7 8 9 10 11 12
MonthMedian
2004
Turbidity
0.0
1.0
2.0
3.0
4.0
5.0
1 2 3 4 5 6 7 8 9 10 11 12
Month
NTU
Median
2004
Figure 3.8. Comparison of long-term median with 2004 data.

31
Gulf Islands (GI)
DIN
0.000.010.020.030.040.050.060.070.08
1 2 3 4 5 6 7 8 9 10 11 12
Month
ppm
Median
2004
TON
0.0
2.0
4.0
6.0
8.0
10.0
1 2 3 4 5 6 7 8 9 10 11 12
Month
ppm
Median
2004
TOC
0.0
0.1
0.2
0.3
0.4
0.5
1 2 3 4 5 6 7 8 9 10 11 12
Month
ppm
Median
2004
TP
0.00
0.01
0.02
0.03
0.04
0.05
0.06
1 2 3 4 5 6 7 8 9 10 11 12
Month
ppm
Median
2004
Temp.
05
101520253035
1 2 3 4 5 6 7 8 9 10 11 12
Month
oC
Median
2004
CHLA
0
2
4
6
8
10
1 2 3 4 5 6 7 8 9 10 11 12
Month
ppb
Median
2004
DO
0.01.02.03.04.05.06.07.08.0
1 2 3 4 5 6 7 8 9 10 11 12
Month
ppm
Median
2004
Salinity
05
10152025303540
1 2 3 4 5 6 7 8 9 10 11 12
MonthMedian
2004
Turbidity
0.01.02.03.04.05.06.07.08.0
1 2 3 4 5 6 7 8 9 10 11 12
Month
NTU
Median
2004
Figure 3.8. Comparison of long-term median with 2004 data.

32
Inner Waterway (IWW)
DIN
0.000.020.040.060.080.100.120.140.16
1 2 3 4 5 6 7 8 9 10 11 12
Month
ppm
Median
2004
TON
02468
10121416
1 2 3 4 5 6 7 8 9 10 11 12
Month
ppm
Median
2004
TOC
0.00.10.20.30.40.50.60.7
1 2 3 4 5 6 7 8 9 10 11 12
Month
ppm
Median
2004
TP
0.000.020.040.060.080.100.120.14
1 2 3 4 5 6 7 8 9 10 11 12
Month
ppm
Median
2004
Temp.
05
101520253035
1 2 3 4 5 6 7 8 9 10 11 12
Month
oC
Median
2004
CHLA
0.01.02.03.04.05.06.07.0
1 2 3 4 5 6 7 8 9 10 11 12
Month
ppb
Median
2004
DO
0.01.02.03.04.05.06.07.08.0
1 2 3 4 5 6 7 8 9 10 11 12
Month
ppm
Median
2004
Salinity
05
10152025303540
1 2 3 4 5 6 7 8 9 10 11 12
MonthMedian
2004
Turbidity
0.0
1.0
2.0
3.0
4.0
5.0
6.0
1 2 3 4 5 6 7 8 9 10 11 12
Month
NTU
Median
2004
Figure 3.9. Comparison of long-term median with 2004 data.

33
Blackwater River (BLK)
DIN
0.000.020.040.060.080.100.120.14
1 2 3 4 5 6 7 8 9 10 11 12
Month
ppm
Median
2004
TON
02468
101214
1 2 3 4 5 6 7 8 9 10 11 12
Month
ppm
Median
2004
TOC
0.0
0.1
0.2
0.3
0.4
0.5
0.6
1 2 3 4 5 6 7 8 9 10 11 12
Month
ppm
Median
2004
TP
0.000.020.040.060.080.100.120.140.16
1 2 3 4 5 6 7 8 9 10 11 12
Month
ppm
Median
2004
Temp.
05
101520253035
1 2 3 4 5 6 7 8 9 10 11 12
Month
oC
Median
2004
CHLA
0.0
2.0
4.0
6.0
8.0
10.0
1 2 3 4 5 6 7 8 9 10 11 12
Month
ppb
Median
2004
DO
0.01.02.03.04.05.06.07.0
1 2 3 4 5 6 7 8 9 10 11 12
Month
ppm
Median
2004
Salinity
05
10152025303540
1 2 3 4 5 6 7 8 9 10 11 12
MonthMedian
2004
Turbidity
0.0
2.0
4.0
6.0
8.0
10.0
12.0
1 2 3 4 5 6 7 8 9 10 11 12
Month
NTU
Median
2004
Figure 3.10. Comparison of long-term median with 2004 data.

34
4. STATE OF WATER QUALITY IN BISCAYNE BAY Overall Period of Record
A spatial analysis of data from our monitoring program resulted in the delineation of 6 groups of stations, which have robust similarities in water quality (Fig. 4.1). The first cluster was composed of 2 stations closest to the shore in the south Bay and was called the Alongshore group (AS). These are stations most influenced by the Goulds, Military and Mowry Canals. The second cluster was made up of the 5 stations farther from the coast called Inshore (IS). Thirteen stations situated mostly in the bay proper were called the main Bay (MAIN) group. The next cluster contained 3 stations situated in areas of great tidal exchange (ocean channel, not shown). Two stations in Card Sound grouped together SCARD. Finally, the Turkey Point station comprised its own cluster (not shown).
-80.4 -80.3 -80.2 -80.1
25.5 101
102
103
110
122
127
128
104
108109
111
112
113
116
123
124
126
129
121
135
130
131132
133
134
Miami
Alongshore, Inshore, Main Bay, North Bay, South Card Sound
Figure 4.1. Zones of similar water quality in Biscayne Bay.

35
As mentioned previously, 10 stations were selected for their status as being either redundant (as in some of the Main Bay stations) or as outliers (Turkey Point and the ocean channel sites) and redistributed throughout the Bay to provide us with more complete coverage. For purposes of this report, the stations added to the area north of the Rickenbacker Causeway are defined, a priori, as a distinct cluster, North Bay (NBAY).
There was a gradient of increasing salinity with distance from the west coast of the Bay (AS <IS <MAIN clusters Fig. 4.2-4.6). Opposite to the salinity gradient, highest concentrations of CHLA, DIN, and TP were observed near the coast. These type of gradients are indicative of anthropogenic inputs. NBAY showed DIN levels comparable to the high concentrations seen AS but had a higher median salinity. In addition, NBAY had the highest median TP concentration of any zone. SCARD had relatively high DIN concentrations relative to the other nutrients. Some of this may be attributed to the long water residence time of this basin as evidence by near ocean salinities. TOC concentrations were highest in AS > IS > MAIN, denoting a freshwater source (not shown).

36
Alongshore Zone
05
1015202530354045
1993
-09
1993
-12
1994
-03
1994
-06
1994
-09
1994
-12
1995
-03
1995
-06
1995
-09
1995
-12
1996
-03
1996
-06
1996
-09
1996
-12
1997
-03
1997
-06
1997
-09
1997
-12
1998
-03
1998
-06
1998
-10
1999
-01
1999
-04
1999
-07
1999
-10
2000
-01
2000
-04
2000
-07
2000
-10
2001
-01
2001
-05
2001
-08
2001
-11
2002
-02
2002
-05
2002
-08
2002
-11
2003
-02
2003
-05
2003
-08
2003
-11
2004
-02
2004
-05
2004
-08
2004
-11
0.0
0.2
0.4
0.6
0.8
1.0
1.2
1.4
ppm
1993
-09
1993
-12
1994
-03
1994
-06
1994
-09
1994
-12
1995
-03
1995
-06
1995
-09
1995
-12
1996
-03
1996
-06
1996
-09
1996
-12
1997
-03
1997
-06
1997
-09
1997
-12
1998
-03
1998
-06
1998
-10
1999
-01
1999
-04
1999
-07
1999
-10
2000
-01
2000
-04
2000
-07
2000
-10
2001
-01
2001
-05
2001
-08
2001
-11
2002
-02
2002
-05
2002
-08
2002
-11
2003
-02
2003
-05
2003
-08
2003
-11
2004
-02
2004
-05
2004
-08
2004
-11
0.00
0.01
0.02
0.03
0.04
0.05
ppm
1993
-09
1993
-12
1994
-03
1994
-06
1994
-09
1994
-12
1995
-03
1995
-06
1995
-09
1995
-12
1996
-03
1996
-06
1996
-09
1996
-12
1997
-03
1997
-06
1997
-09
1997
-12
1998
-03
1998
-06
1998
-10
1999
-01
1999
-04
1999
-07
1999
-10
2000
-01
2000
-04
2000
-07
2000
-10
2001
-01
2001
-05
2001
-08
2001
-11
2002
-02
2002
-05
2002
-08
2002
-11
2003
-02
2003
-05
2003
-08
2003
-11
2004
-02
2004
-05
2004
-08
2004
-11
0.0
0.5
1.0
1.5
2.0
2.5
3.0
ug/l
1993
-09
1993
-12
1994
-03
1994
-06
1994
-09
1994
-12
1995
-03
1995
-06
1995
-09
1995
-12
1996
-03
1996
-06
1996
-09
1996
-12
1997
-03
1997
-06
1997
-09
1997
-12
1998
-03
1998
-06
1998
-10
1999
-01
1999
-04
1999
-07
1999
-10
2000
-01
2000
-04
2000
-07
2000
-10
2001
-01
2001
-05
2001
-08
2001
-11
2002
-02
2002
-05
2002
-08
2002
-11
2003
-02
2003
-05
2003
-08
2003
-11
2004
-02
2004
-05
2004
-08
2004
-11
Salinity
DIN
TP
CHLA
Figure 4.2. Box-and-whisker plots of water quality in Biscayne Bay by survey.
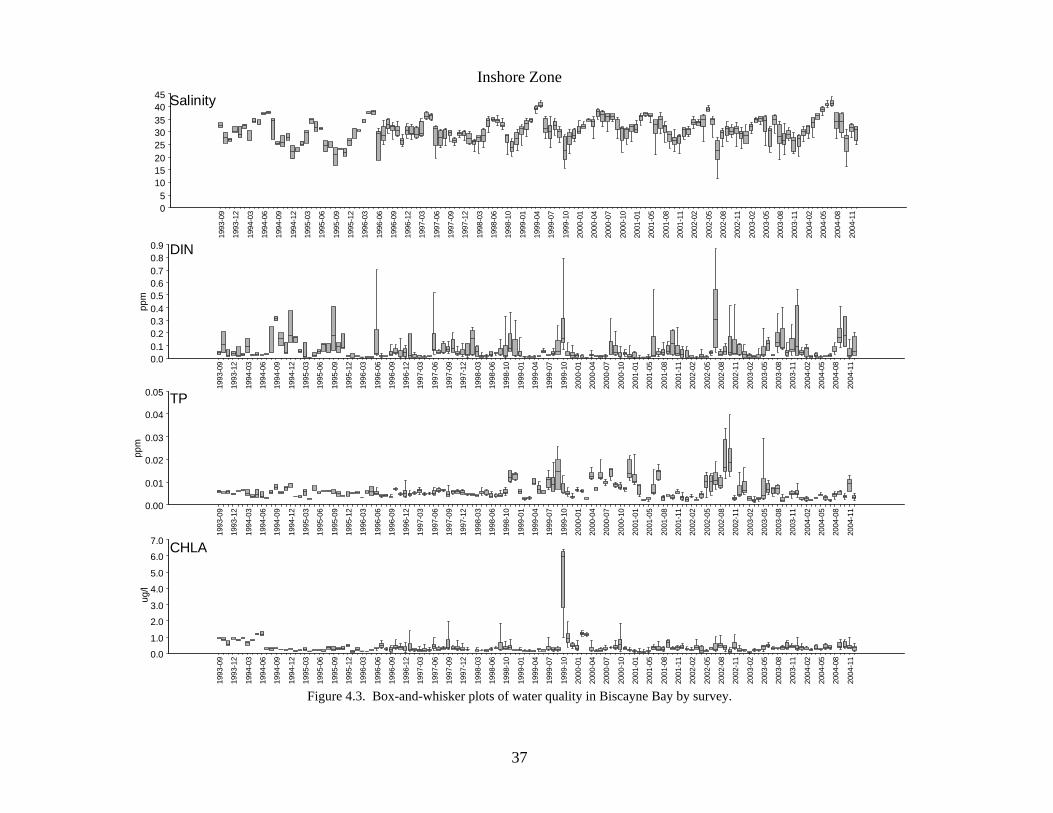
37
Inshore Zone
05
1015202530354045
1993
-09
1993
-12
1994
-03
1994
-06
1994
-09
1994
-12
1995
-03
1995
-06
1995
-09
1995
-12
1996
-03
1996
-06
1996
-09
1996
-12
1997
-03
1997
-06
1997
-09
1997
-12
1998
-03
1998
-06
1998
-10
1999
-01
1999
-04
1999
-07
1999
-10
2000
-01
2000
-04
2000
-07
2000
-10
2001
-01
2001
-05
2001
-08
2001
-11
2002
-02
2002
-05
2002
-08
2002
-11
2003
-02
2003
-05
2003
-08
2003
-11
2004
-02
2004
-05
2004
-08
2004
-11
0.00.10.20.30.40.50.60.70.80.9
ppm
1993
-09
1993
-12
1994
-03
1994
-06
1994
-09
1994
-12
1995
-03
1995
-06
1995
-09
1995
-12
1996
-03
1996
-06
1996
-09
1996
-12
1997
-03
1997
-06
1997
-09
1997
-12
1998
-03
1998
-06
1998
-10
1999
-01
1999
-04
1999
-07
1999
-10
2000
-01
2000
-04
2000
-07
2000
-10
2001
-01
2001
-05
2001
-08
2001
-11
2002
-02
2002
-05
2002
-08
2002
-11
2003
-02
2003
-05
2003
-08
2003
-11
2004
-02
2004
-05
2004
-08
2004
-11
0.00
0.01
0.02
0.03
0.04
0.05
ppm
1993
-09
1993
-12
1994
-03
1994
-06
1994
-09
1994
-12
1995
-03
1995
-06
1995
-09
1995
-12
1996
-03
1996
-06
1996
-09
1996
-12
1997
-03
1997
-06
1997
-09
1997
-12
1998
-03
1998
-06
1998
-10
1999
-01
1999
-04
1999
-07
1999
-10
2000
-01
2000
-04
2000
-07
2000
-10
2001
-01
2001
-05
2001
-08
2001
-11
2002
-02
2002
-05
2002
-08
2002
-11
2003
-02
2003
-05
2003
-08
2003
-11
2004
-02
2004
-05
2004
-08
2004
-11
0.0
1.0
2.0
3.0
4.0
5.0
6.0
7.0
ug/l
1993
-09
1993
-12
1994
-03
1994
-06
1994
-09
1994
-12
1995
-03
1995
-06
1995
-09
1995
-12
1996
-03
1996
-06
1996
-09
1996
-12
1997
-03
1997
-06
1997
-09
1997
-12
1998
-03
1998
-06
1998
-10
1999
-01
1999
-04
1999
-07
1999
-10
2000
-01
2000
-04
2000
-07
2000
-10
2001
-01
2001
-05
2001
-08
2001
-11
2002
-02
2002
-05
2002
-08
2002
-11
2003
-02
2003
-05
2003
-08
2003
-11
2004
-02
2004
-05
2004
-08
2004
-11
Salinity
DIN
TP
CHLA
Figure 4.3. Box-and-whisker plots of water quality in Biscayne Bay by survey.

38
Main Bay Zone
05
10152025303540
1993
-09
1993
-12
1994
-03
1994
-06
1994
-09
1994
-12
1995
-03
1995
-06
1995
-09
1995
-12
1996
-03
1996
-06
1996
-09
1996
-12
1997
-03
1997
-06
1997
-09
1997
-12
1998
-03
1998
-06
1998
-10
1999
-01
1999
-04
1999
-07
1999
-10
2000
-01
2000
-04
2000
-07
2000
-10
2001
-01
2001
-05
2001
-08
2001
-11
2002
-02
2002
-05
2002
-08
2002
-11
2003
-02
2003
-05
2003
-08
2003
-11
2004
-02
2004
-05
2004
-08
2004
-11
0.0
0.1
0.2
0.3
0.4
0.5
ppm
1993
-09
1993
-12
1994
-03
1994
-06
1994
-09
1994
-12
1995
-03
1995
-06
1995
-09
1995
-12
1996
-03
1996
-06
1996
-09
1996
-12
1997
-03
1997
-06
1997
-09
1997
-12
1998
-03
1998
-06
1998
-10
1999
-01
1999
-04
1999
-07
1999
-10
2000
-01
2000
-04
2000
-07
2000
-10
2001
-01
2001
-05
2001
-08
2001
-11
2002
-02
2002
-05
2002
-08
2002
-11
2003
-02
2003
-05
2003
-08
2003
-11
2004
-02
2004
-05
2004
-08
2004
-11
0.00
0.01
0.02
0.03
0.04
ppm
1993
-09
1993
-12
1994
-03
1994
-06
1994
-09
1994
-12
1995
-03
1995
-06
1995
-09
1995
-12
1996
-03
1996
-06
1996
-09
1996
-12
1997
-03
1997
-06
1997
-09
1997
-12
1998
-03
1998
-06
1998
-10
1999
-01
1999
-04
1999
-07
1999
-10
2000
-01
2000
-04
2000
-07
2000
-10
2001
-01
2001
-05
2001
-08
2001
-11
2002
-02
2002
-05
2002
-08
2002
-11
2003
-02
2003
-05
2003
-08
2003
-11
2004
-02
2004
-05
2004
-08
2004
-11
0.00.51.01.52.02.53.03.54.04.5
ug/l
1993
-09
1993
-12
1994
-03
1994
-06
1994
-09
1994
-12
1995
-03
1995
-06
1995
-09
1995
-12
1996
-03
1996
-06
1996
-09
1996
-12
1997
-03
1997
-06
1997
-09
1997
-12
1998
-03
1998
-06
1998
-10
1999
-01
1999
-04
1999
-07
1999
-10
2000
-01
2000
-04
2000
-07
2000
-10
2001
-01
2001
-05
2001
-08
2001
-11
2002
-02
2002
-05
2002
-08
2002
-11
2003
-02
2003
-05
2003
-08
2003
-11
2004
-02
2004
-05
2004
-08
2004
-11
Salinity
DIN
TP
CHLA
Figure 4.4. Box-and-whisker plots of water quality in Biscayne Bay by survey.

39
South Card Sound Zone
05
1015202530354045
1993
-10
1994
-01
1994
-04
1994
-07
1994
-10
1995
-01
1995
-04
1995
-07
1995
-10
1996
-01
1996
-04
1996
-07
1996
-10
1997
-01
1997
-04
1997
-07
1997
-10
1998
-01
1998
-04
1998
-07
1998
-11
1999
-02
1999
-05
1999
-08
1999
-11
2000
-02
2000
-05
2000
-08
2000
-11
2001
-03
2001
-06
2001
-09
2001
-12
2002
-03
2002
-06
2002
-09
2002
-12
2003
-03
2003
-06
2003
-09
2003
-12
2004
-03
2004
-06
2004
-09
2004
-12
0.00
0.05
0.10
0.15
0.20
0.25
ppm
1993
-10
1994
-01
1994
-04
1994
-07
1994
-10
1995
-01
1995
-04
1995
-07
1995
-10
1996
-01
1996
-04
1996
-07
1996
-10
1997
-01
1997
-04
1997
-07
1997
-10
1998
-01
1998
-04
1998
-07
1998
-11
1999
-02
1999
-05
1999
-08
1999
-11
2000
-02
2000
-05
2000
-08
2000
-11
2001
-03
2001
-06
2001
-09
2001
-12
2002
-03
2002
-06
2002
-09
2002
-12
2003
-03
2003
-06
2003
-09
2003
-12
2004
-03
2004
-06
2004
-09
2004
-12
0.00
0.01
0.02
0.03
0.04
ppm
1993
-10
1994
-01
1994
-04
1994
-07
1994
-10
1995
-01
1995
-04
1995
-07
1995
-10
1996
-01
1996
-04
1996
-07
1996
-10
1997
-01
1997
-04
1997
-07
1997
-10
1998
-01
1998
-04
1998
-07
1998
-11
1999
-02
1999
-05
1999
-08
1999
-11
2000
-02
2000
-05
2000
-08
2000
-11
2001
-03
2001
-06
2001
-09
2001
-12
2002
-03
2002
-06
2002
-09
2002
-12
2003
-03
2003
-06
2003
-09
2003
-12
2004
-03
2004
-06
2004
-09
2004
-12
0.0
0.5
1.0
1.5
2.0
2.5
3.0
3.5
ug/l
1993
-10
1994
-01
1994
-04
1994
-07
1994
-10
1995
-01
1995
-04
1995
-07
1995
-10
1996
-01
1996
-04
1996
-07
1996
-10
1997
-01
1997
-04
1997
-07
1997
-10
1998
-01
1998
-04
1998
-07
1998
-11
1999
-02
1999
-05
1999
-08
1999
-11
2000
-02
2000
-05
2000
-08
2000
-11
2001
-03
2001
-06
2001
-09
2001
-12
2002
-03
2002
-06
2002
-09
2002
-12
2003
-03
2003
-06
2003
-09
2003
-12
2004
-03
2004
-06
2004
-09
2004
-12
Salinity
DIN
TP
CHLA
Figure 4.5. Box-and-whisker plots of water quality in Biscayne Bay by survey.

40
North Bay Zone
05
10152025303540
1996
-06
1996
-09
1996
-12
1997
-03
1997
-06
1997
-09
1997
-12
1998
-03
1998
-06
1998
-10
1999
-01
1999
-04
1999
-07
1999
-10
2000
-01
2000
-04
2000
-07
2000
-10
2001
-01
2001
-05
2001
-08
2001
-11
2002
-02
2002
-05
2002
-08
2002
-11
2003
-02
2003
-05
2003
-08
2003
-11
2004
-02
2004
-05
2004
-08
2004
-11
0.000.050.100.150.200.250.300.350.40
ppm
1996
-06
1996
-09
1996
-12
1997
-03
1997
-06
1997
-09
1997
-12
1998
-03
1998
-06
1998
-10
1999
-01
1999
-04
1999
-07
1999
-10
2000
-01
2000
-04
2000
-07
2000
-10
2001
-01
2001
-05
2001
-08
2001
-11
2002
-02
2002
-05
2002
-08
2002
-11
2003
-02
2003
-05
2003
-08
2003
-11
2004
-02
2004
-05
2004
-08
2004
-11
0.00
0.01
0.02
0.03
0.04
ppm
1996
-06
1996
-09
1996
-12
1997
-03
1997
-06
1997
-09
1997
-12
1998
-03
1998
-06
1998
-10
1999
-01
1999
-04
1999
-07
1999
-10
2000
-01
2000
-04
2000
-07
2000
-10
2001
-01
2001
-05
2001
-08
2001
-11
2002
-02
2002
-05
2002
-08
2002
-11
2003
-02
2003
-05
2003
-08
2003
-11
2004
-02
2004
-05
2004
-08
2004
-11
0.01.02.03.04.05.06.07.08.09.0
ug/l
1996
-06
1996
-09
1996
-12
1997
-03
1997
-06
1997
-09
1997
-12
1998
-03
1998
-06
1998
-10
1999
-01
1999
-04
1999
-07
1999
-10
2000
-01
2000
-04
2000
-07
2000
-10
2001
-01
2001
-05
2001
-08
2001
-11
2002
-02
2002
-05
2002
-08
2002
-11
2003
-02
2003
-05
2003
-08
2003
-11
2004
-02
2004
-05
2004
-08
2004
-11
Salinity
DIN
TP
CHLA
Figure 4.6. Box-and-whisker plots of water quality in Biscayne Bay by survey.
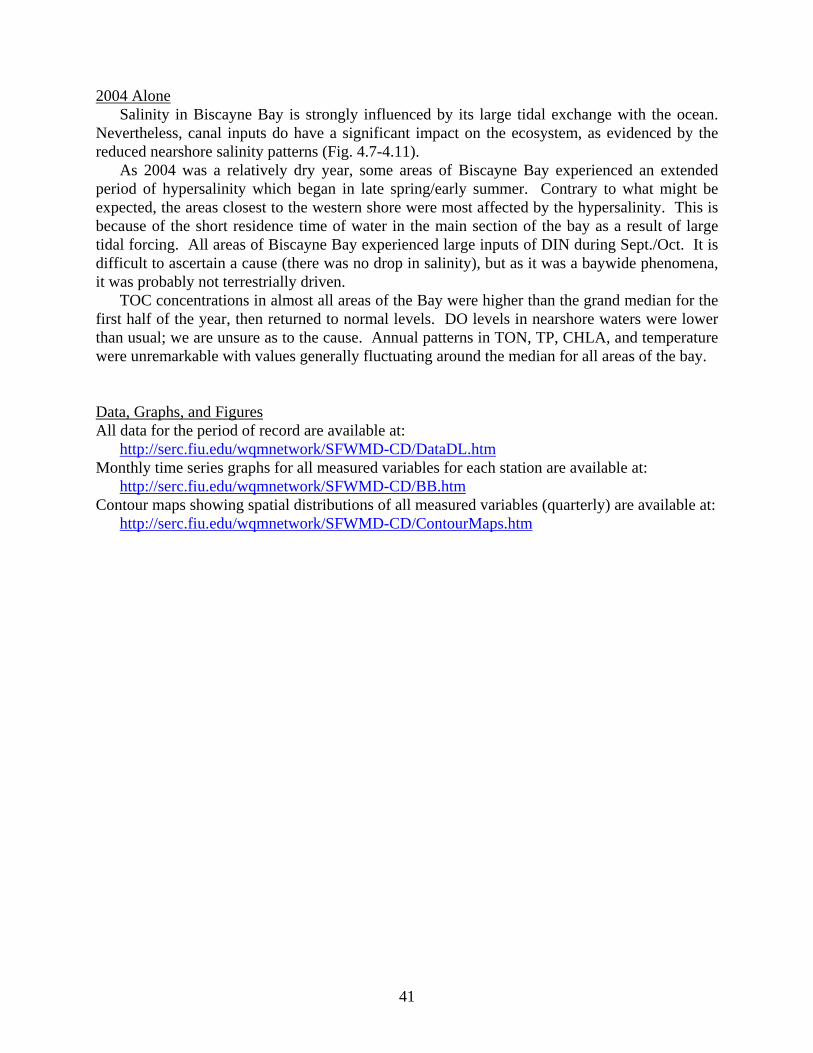
41
2004 Alone Salinity in Biscayne Bay is strongly influenced by its large tidal exchange with the ocean.
Nevertheless, canal inputs do have a significant impact on the ecosystem, as evidenced by the reduced nearshore salinity patterns (Fig. 4.7-4.11).
As 2004 was a relatively dry year, some areas of Biscayne Bay experienced an extended period of hypersalinity which began in late spring/early summer. Contrary to what might be expected, the areas closest to the western shore were most affected by the hypersalinity. This is because of the short residence time of water in the main section of the bay as a result of large tidal forcing. All areas of Biscayne Bay experienced large inputs of DIN during Sept./Oct. It is difficult to ascertain a cause (there was no drop in salinity), but as it was a baywide phenomena, it was probably not terrestrially driven.
TOC concentrations in almost all areas of the Bay were higher than the grand median for the first half of the year, then returned to normal levels. DO levels in nearshore waters were lower than usual; we are unsure as to the cause. Annual patterns in TON, TP, CHLA, and temperature were unremarkable with values generally fluctuating around the median for all areas of the bay.
Data, Graphs, and Figures All data for the period of record are available at:
http://serc.fiu.edu/wqmnetwork/SFWMD-CD/DataDL.htm Monthly time series graphs for all measured variables for each station are available at:
http://serc.fiu.edu/wqmnetwork/SFWMD-CD/BB.htm Contour maps showing spatial distributions of all measured variables (quarterly) are available at:
http://serc.fiu.edu/wqmnetwork/SFWMD-CD/ContourMaps.htm

42
Alongshore (AS)
DIN
0.0
0.2
0.4
0.6
0.8
1.0
1.2
1 2 3 4 5 6 7 8 9 10 11 12
Month
ppm
Median
2004
TON
0.0
1.0
2.0
3.0
4.0
5.0
6.0
1 2 3 4 5 6 7 8 9 10 11 12
Month
ppm
Median
2004
TOC
0.00.10.20.30.40.50.60.70.8
1 2 3 4 5 6 7 8 9 10 11 12
Month
ppm
Median
2004
TP
0.000
0.005
0.010
0.015
0.020
0.025
1 2 3 4 5 6 7 8 9 10 11 12
Month
ppm
Median
2004
Temp.
05
101520253035
1 2 3 4 5 6 7 8 9 10 11 12
Month
oC
Median
2004
CHLA
0.0
0.2
0.4
0.6
0.8
1.0
1 2 3 4 5 6 7 8 9 10 11 12
Month
ppb
Median
2004
DO
0.0
2.0
4.0
6.0
8.0
10.0
1 2 3 4 5 6 7 8 9 10 11 12
Month
ppm
Median
2004
Salinity
0
10
20
30
40
50
1 2 3 4 5 6 7 8 9 10 11 12
MonthMedian
2004
Turbidity
0.01.02.03.04.05.06.07.0
1 2 3 4 5 6 7 8 9 10 11 12
Month
NTU
Median
2004
Figure 4.7. Comparison of long-term median with 2004 data.
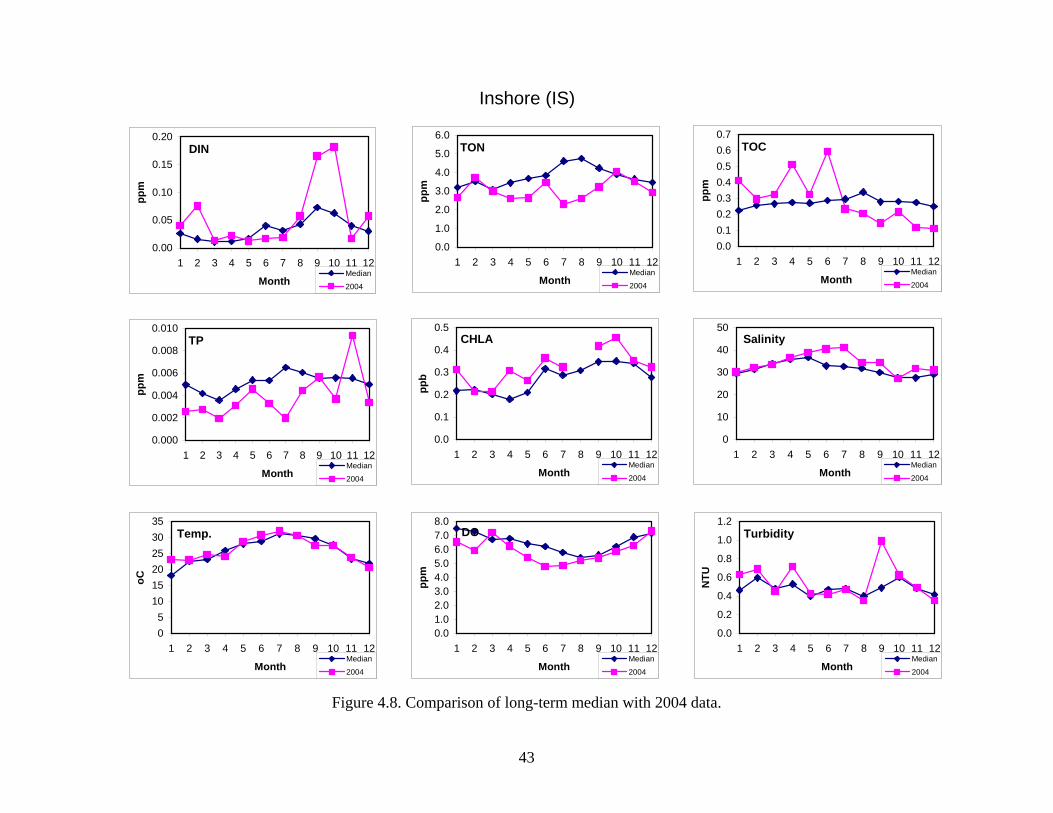
43
Inshore (IS)
DIN
0.00
0.05
0.10
0.15
0.20
1 2 3 4 5 6 7 8 9 10 11 12
Month
ppm
Median
2004
TON
0.0
1.0
2.0
3.0
4.0
5.0
6.0
1 2 3 4 5 6 7 8 9 10 11 12
Month
ppm
Median
2004
TOC
0.00.10.20.30.40.50.60.7
1 2 3 4 5 6 7 8 9 10 11 12
Month
ppm
Median
2004
TP
0.000
0.002
0.004
0.006
0.008
0.010
1 2 3 4 5 6 7 8 9 10 11 12
Month
ppm
Median
2004
Temp.
05
101520253035
1 2 3 4 5 6 7 8 9 10 11 12
Month
oC
Median
2004
CHLA
0.0
0.1
0.2
0.3
0.4
0.5
1 2 3 4 5 6 7 8 9 10 11 12
Month
ppb
Median
2004
DO
0.01.02.03.04.05.06.07.08.0
1 2 3 4 5 6 7 8 9 10 11 12
Month
ppm
Median
2004
Salinity
0
10
20
30
40
50
1 2 3 4 5 6 7 8 9 10 11 12
MonthMedian
2004
Turbidity
0.0
0.2
0.4
0.6
0.8
1.0
1.2
1 2 3 4 5 6 7 8 9 10 11 12
Month
NTU
Median
2004
Figure 4.8. Comparison of long-term median with 2004 data.

44
Main Bay (MAIN)
DIN
0.000.010.020.030.040.050.060.070.08
1 2 3 4 5 6 7 8 9 10 11 12
Month
ppm
Median
2004
TON
0.00.51.01.52.02.53.03.5
1 2 3 4 5 6 7 8 9 10 11 12
Month
ppm
Median
2004
TOC
0.0
0.1
0.2
0.3
0.4
0.5
1 2 3 4 5 6 7 8 9 10 11 12
Month
ppm
Median
2004
TP
0.000
0.001
0.002
0.003
0.004
0.005
0.006
1 2 3 4 5 6 7 8 9 10 11 12
Month
ppm
Median
2004
Temp.
05
101520253035
1 2 3 4 5 6 7 8 9 10 11 12
Month
oC
Median
2004
CHLA
0.0
0.1
0.2
0.3
0.4
0.5
1 2 3 4 5 6 7 8 9 10 11 12
Month
ppb
Median
2004
DO
0.01.02.03.04.05.06.07.08.0
1 2 3 4 5 6 7 8 9 10 11 12
Month
ppm
Median
2004
Salinity
0
10
20
30
40
50
1 2 3 4 5 6 7 8 9 10 11 12
MonthMedian
2004
Turbidity
0.0
0.5
1.0
1.5
2.0
2.5
1 2 3 4 5 6 7 8 9 10 11 12
Month
NTU
Median
2004
Figure 4.9. Comparison of long-term median with 2004 data.

45
South Card Sound (SCARD)
DIN
0.000.010.020.030.040.050.060.070.08
1 2 3 4 5 6 7 8 9 10 11 12
Month
ppm
Median
2004
TON
0.0
1.0
2.0
3.0
4.0
5.0
6.0
1 2 3 4 5 6 7 8 9 10 11 12
Month
ppm
Median
2004
TOC
0.0
0.1
0.2
0.3
0.4
0.5
0.6
1 2 3 4 5 6 7 8 9 10 11 12
Month
ppm
Median
2004
TP
0.0000.0010.0020.0030.0040.0050.0060.0070.008
1 2 3 4 5 6 7 8 9 10 11 12
Month
ppm
Median
2004
Temp.
05
101520253035
1 2 3 4 5 6 7 8 9 10 11 12
Month
oC
Median
2004
CHLA
0.0
0.2
0.4
0.6
0.8
1.0
1.2
1 2 3 4 5 6 7 8 9 10 11 12
Month
ppb
Median
2004
DO
0.01.02.03.04.05.06.07.08.0
1 2 3 4 5 6 7 8 9 10 11 12
Month
ppm
Median
2004
Salinity
0
10
20
30
40
50
1 2 3 4 5 6 7 8 9 10 11 12
MonthMedian
2004
Turbidity
0.0
0.5
1.0
1.5
2.0
1 2 3 4 5 6 7 8 9 10 11 12
Month
NTU
Median
2004
Figure 4.10. Comparison of long-term median with 2004 data.

46
North Bay (NBAY)
DIN
0.00
0.05
0.10
0.15
0.20
1 2 3 4 5 6 7 8 9 10 11 12
Month
ppm
Median
2004
TON
0.0
1.0
2.0
3.0
4.0
5.0
1 2 3 4 5 6 7 8 9 10 11 12
Month
ppm
Median
2004
TOC
0.0
0.1
0.2
0.3
0.4
0.5
0.6
1 2 3 4 5 6 7 8 9 10 11 12
Month
ppm
Median
2004
TP
0.000
0.002
0.004
0.006
0.008
0.010
0.012
1 2 3 4 5 6 7 8 9 10 11 12
Month
ppm
Median
2004
Temp.
05
101520253035
1 2 3 4 5 6 7 8 9 10 11 12
Month
oC
Median
2004
CHLA
0.0
0.5
1.0
1.5
2.0
2.5
1 2 3 4 5 6 7 8 9 10 11 12
Month
ppb
Median
2004
DO
0.01.02.03.04.05.06.07.08.0
1 2 3 4 5 6 7 8 9 10 11 12
Month
ppm
Median
2004
Salinity
05
10152025303540
1 2 3 4 5 6 7 8 9 10 11 12
MonthMedian
2004
Turbidity
0.00.20.40.60.81.01.21.41.6
1 2 3 4 5 6 7 8 9 10 11 12
Month
NTU
Median
2004
Figure 4.11. Comparison of long-term median with 2004 data.

47
5. STATE OF WATER QUALITY ON THE SOUTHWEST FLORIDA SHELF
Overall Period of Record
A spatial analysis of data from our monitoring program resulted in the delineation of 3 groups of stations, which have robust similarities in water quality (Fig. 5.1). The first cluster was composed of only 2 stations, which were closest to the shore off Cape Sable; they were called the SHARK group after the Shark River, the main source of freshwater to the region. The second cluster was made up of the 7 more northerly stations nearest the coast and called SHOAL. The remaining stations were called the SHELF group.
-82.0 -81.5 -81.024.5
25.0
25.5
26.0
364
384
385386
387
388
389
390
399
351
352
353
354
355
356
357
358
359
360
361
362
363
365
366
367
368
369
370
371
372
373
374
375
376
377
378
379
380
381
382
383
391
392
393
394395
396
397
398
Shark, Shoal, Shelf Figure 5.1. Zones of similar water quality on the SW Shelf.
48
Salinity was lowest in the SHARK zone as a result of the Shark River, Everglades influence (Fig. 5.2-5.4). There is a decreasing concentration gradient of SHARK > SHOAL > SHELF for CHLA, TP, and TOC. It is clear that the SHARK stations have higher DIN concentrations while the SHOAL and SHELF stations were similar.
Although these analyses are very preliminary (only 38 sampling events) it is possible to speculate that the clusters are formed as a function of hydrology and circulation patterns. We believe that the SHARK stations clearly show the input of freshwater from Shark River being transported south and east around the Cape. Water overlying the SHOAL stations probably originates somewhere in or north of the Ten Thousand Islands. Our level of resolution is very low due to the limited numbers of sampling events and by the relatively large spatial gap between coastal and Shelf sampling sites.
A better understanding of local circulation patterns in addition to increased density and frequency of sampling in the nearshore region may help define the coupling between freshwater inflow and Shelf water quality. This is a preliminary analysis and will be repeated after a few more years of data have been collected.

49
Shelf Zone
05
10152025303540
1995
-05
1995
-08
1995
-12
1996
-03
1996
-07
1996
-10
1997
-02
1997
-05
1997
-07
1997
-10
1998
-01
1998
-04
1998
-07
1998
-10
1999
-01
1999
-05
1999
-07
1999
-11
2000
-01
2000
-04
2000
-07
2000
-10
2001
-01
2001
-05
2001
-07
2001
-11
2002
-01
2002
-04
2002
-08
2002
-10
2003
-01
2003
-04
2003
-07
2003
-08
2003
-10
2004
-01
2004
-04
2004
-07
2004
-10
0.000.010.020.030.040.050.060.070.080.09
ppm
1995
-05
1995
-08
1995
-12
1996
-03
1996
-07
1996
-10
1997
-02
1997
-05
1997
-07
1997
-10
1998
-01
1998
-04
1998
-07
1998
-10
1999
-01
1999
-05
1999
-07
1999
-11
2000
-01
2000
-04
2000
-07
2000
-10
2001
-01
2001
-05
2001
-07
2001
-11
2002
-01
2002
-04
2002
-08
2002
-10
2003
-01
2003
-04
2003
-07
2003
-08
2003
-10
2004
-01
2004
-04
2004
-07
2004
-10
0.00
0.01
0.02
0.03
0.04
ppm
1995
-05
1995
-08
1995
-12
1996
-03
1996
-07
1996
-10
1997
-02
1997
-05
1997
-07
1997
-10
1998
-01
1998
-04
1998
-07
1998
-10
1999
-01
1999
-05
1999
-07
1999
-11
2000
-01
2000
-04
2000
-07
2000
-10
2001
-01
2001
-05
2001
-07
2001
-11
2002
-01
2002
-04
2002
-08
2002
-10
2003
-01
2003
-04
2003
-07
2003
-08
2003
-10
2004
-01
2004
-04
2004
-07
2004
-10
0.01.02.03.04.05.06.07.08.09.0
ug/l
1995
-05
1995
-08
1995
-12
1996
-03
1996
-07
1996
-10
1997
-02
1997
-05
1997
-07
1997
-10
1998
-01
1998
-04
1998
-07
1998
-10
1999
-01
1999
-05
1999
-07
1999
-11
2000
-01
2000
-04
2000
-07
2000
-10
2001
-01
2001
-05
2001
-07
2001
-11
2002
-01
2002
-04
2002
-08
2002
-10
2003
-01
2003
-04
2003
-07
2003
-08
2003
-10
2004
-01
2004
-04
2004
-07
2004
-10
Salinity
DIN
TP
CHLA
Figure 5.2. Box-and-whisker plots of water quality in SW Florida Shelf by survey.

50
Shark Zone
05
1015202530354045
1995
-05
1995
-08
1995
-12
1996
-03
1996
-07
1996
-10
1997
-02
1997
-05
1997
-07
1997
-10
1998
-01
1998
-04
1998
-07
1998
-10
1999
-01
1999
-05
1999
-07
1999
-11
2000
-01
2000
-04
2000
-07
2000
-10
2001
-01
2001
-05
2001
-07
2001
-11
2002
-01
2002
-04
2002
-08
2002
-10
2003
-01
2003
-04
2003
-08
2003
-10
2004
-01
2004
-04
2004
-07
2004
-10
0.00
0.02
0.04
0.06
0.08
0.10
0.12
ppm
1995
-05
1995
-08
1995
-12
1996
-03
1996
-07
1996
-10
1997
-02
1997
-05
1997
-07
1997
-10
1998
-01
1998
-04
1998
-07
1998
-10
1999
-01
1999
-05
1999
-07
1999
-11
2000
-01
2000
-04
2000
-07
2000
-10
2001
-01
2001
-05
2001
-07
2001
-11
2002
-01
2002
-04
2002
-08
2002
-10
2003
-01
2003
-04
2003
-08
2003
-10
2004
-01
2004
-04
2004
-07
2004
-10
0.00
0.02
0.04
0.06
0.08
0.10
ppm
1995
-05
1995
-08
1995
-12
1996
-03
1996
-07
1996
-10
1997
-02
1997
-05
1997
-07
1997
-10
1998
-01
1998
-04
1998
-07
1998
-10
1999
-01
1999
-05
1999
-07
1999
-11
2000
-01
2000
-04
2000
-07
2000
-10
2001
-01
2001
-05
2001
-07
2001
-11
2002
-01
2002
-04
2002
-08
2002
-10
2003
-01
2003
-04
2003
-08
2003
-10
2004
-01
2004
-04
2004
-07
2004
-10
0.01.02.03.04.05.06.07.08.09.0
ug/l
1995
-05
1995
-08
1995
-12
1996
-03
1996
-07
1996
-10
1997
-02
1997
-05
1997
-07
1997
-10
1998
-01
1998
-04
1998
-07
1998
-10
1999
-01
1999
-05
1999
-07
1999
-11
2000
-01
2000
-04
2000
-07
2000
-10
2001
-01
2001
-05
2001
-07
2001
-11
2002
-01
2002
-04
2002
-08
2002
-10
2003
-01
2003
-04
2003
-08
2003
-10
2004
-01
2004
-04
2004
-07
2004
-10
Salinity
DIN
TP
CHLA
Figure 5.3. Box-and-whisker plots of water quality in SW Florida Shelf by survey.

51
Shoal Zone
05
10152025303540
1995
-05
1995
-08
1995
-12
1996
-03
1996
-07
1996
-10
1997
-02
1997
-05
1997
-07
1997
-10
1998
-01
1998
-04
1998
-07
1998
-10
1999
-01
1999
-05
1999
-07
1999
-11
2000
-01
2000
-04
2000
-07
2000
-10
2001
-01
2001
-05
2001
-07
2001
-11
2002
-01
2002
-04
2002
-08
2002
-10
2003
-01
2003
-04
2003
-07
2003
-08
2003
-10
2004
-01
2004
-04
2004
-05
2004
-07
2004
-10
0.00
0.01
0.02
0.03
0.04
0.05
0.06
ppm
1995
-05
1995
-08
1995
-12
1996
-03
1996
-07
1996
-10
1997
-02
1997
-05
1997
-07
1997
-10
1998
-01
1998
-04
1998
-07
1998
-10
1999
-01
1999
-05
1999
-07
1999
-11
2000
-01
2000
-04
2000
-07
2000
-10
2001
-01
2001
-05
2001
-07
2001
-11
2002
-01
2002
-04
2002
-08
2002
-10
2003
-01
2003
-04
2003
-07
2003
-08
2003
-10
2004
-01
2004
-04
2004
-05
2004
-07
2004
-10
0.00
0.01
0.02
0.03
0.04
ppm
1995
-05
1995
-08
1995
-12
1996
-03
1996
-07
1996
-10
1997
-02
1997
-05
1997
-07
1997
-10
1998
-01
1998
-04
1998
-07
1998
-10
1999
-01
1999
-05
1999
-07
1999
-11
2000
-01
2000
-04
2000
-07
2000
-10
2001
-01
2001
-05
2001
-07
2001
-11
2002
-01
2002
-04
2002
-08
2002
-10
2003
-01
2003
-04
2003
-07
2003
-08
2003
-10
2004
-01
2004
-04
2004
-05
2004
-07
2004
-10
0.0
1.0
2.0
3.0
4.0
5.0
6.0
7.0
ug/l
1995
-05
1995
-08
1995
-12
1996
-03
1996
-07
1996
-10
1997
-02
1997
-05
1997
-07
1997
-10
1998
-01
1998
-04
1998
-07
1998
-10
1999
-01
1999
-05
1999
-07
1999
-11
2000
-01
2000
-04
2000
-07
2000
-10
2001
-01
2001
-05
2001
-07
2001
-11
2002
-01
2002
-04
2002
-08
2002
-10
2003
-01
2003
-04
2003
-07
2003
-08
2003
-10
2004
-01
2004
-04
2004
-05
2004
-07
2004
-10
Salinity
DIN
TP
CHLA
Figure 5.4. Box-and-whisker plots of water quality in SW Florida Shelf by survey.

52
2004 Alone Since this component of the monitoring program began in 1995 and is only sampled
quarterly, there is little trend data to analyze. Although these analyses are very preliminary it is possible to speculate that the clusters are formed as a function of hydrology and circulation patterns. We believe that the inshore cluster clearly shows the input of freshwater from Shark River being transported south and east around the Cape. Water overlying the shoal stations probably originates somewhere in or north of the Ten Thousand Islands. Our level of resolution is very low due to the limited numbers of sampling events and by the relatively large spatial gap between coastal and Shelf sampling sites. A better understanding of local circulation patterns in addition to increased density and frequency of sampling in the nearshore region may help define the coupling between freshwater inflow and Shelf water quality
Overall, 2004 was relatively unremarkable except for a few outliers (Fig. 5.5-5.7). TON was lower than the grand median for most areas, a result observed in other areas of the southwest coast. Data, Graphs, and Figures All data for the period of record are available at:
http://serc.fiu.edu/wqmnetwork/SFWMD-CD/DataDL.htm Monthly time series graphs for all measured variables for each station are available at:
http://serc.fiu.edu/wqmnetwork/SFWMD-CD/Shelf.htm Contour maps showing spatial distributions of all measured variables (quarterly) are available at:
http://serc.fiu.edu/wqmnetwork/SFWMD-CD/ContourMaps.htm

53
Shark (SHARK)
DIN
0.000
0.005
0.010
0.015
0.020
0.025
1 2 3 4 5 6 7 8 9 10 11 12
Month
ppm
Median
2004
TON
0.0
1.0
2.0
3.0
4.0
5.0
6.0
1 2 3 4 5 6 7 8 9 10 11 12
Month
ppm
Median
2004
TOC
0.0
0.1
0.2
0.3
0.4
0.5
0.6
1 2 3 4 5 6 7 8 9 10 11 12
Month
ppm
Median
2004
TP
0.00
0.01
0.02
0.03
0.04
1 2 3 4 5 6 7 8 9 10 11 12
Month
ppm
Median
2004
Temp.
05
101520253035
1 2 3 4 5 6 7 8 9 10 11 12
Month
oC
Median
2004
CHLA
0.0
2.0
4.0
6.0
8.0
10.0
1 2 3 4 5 6 7 8 9 10 11 12
Month
ppb
Median
2004
DO
0.0
2.0
4.0
6.0
8.0
10.0
1 2 3 4 5 6 7 8 9 10 11 12
Month
ppm
Median
2004
Salinity
05
10152025303540
1 2 3 4 5 6 7 8 9 10 11 12
MonthMedian
2004
Turbidity
0
10
20
30
40
50
60
1 2 3 4 5 6 7 8 9 10 11 12
Month
NTU
Median
2004
Figure 5.5. Comparison of long-term median with 2004 data.

54
Shelf (SHELF)
DIN
0.0000.0020.0040.0060.0080.0100.0120.014
1 2 3 4 5 6 7 8 9 10 11 12
Month
ppm
Median
2004
TON
0.00.51.01.52.02.53.03.5
1 2 3 4 5 6 7 8 9 10 11 12
Month
ppm
Median
2004
TOC
0.0
0.1
0.2
0.3
0.4
0.5
1 2 3 4 5 6 7 8 9 10 11 12
Month
ppm
Median
2004
TP
0.0000.0020.0040.0060.0080.0100.0120.0140.016
1 2 3 4 5 6 7 8 9 10 11 12
Month
ppm
Median
2004
Temp.
05
101520253035
1 2 3 4 5 6 7 8 9 10 11 12
Month
oC
Median
2004
CHLA
0.0
0.5
1.0
1.5
2.0
1 2 3 4 5 6 7 8 9 10 11 12
Month
ppb
Median
2004
DO
0.01.02.03.04.05.06.07.08.0
1 2 3 4 5 6 7 8 9 10 11 12
Month
ppm
Median
2004
Salinity
34
34
35
35
36
36
37
1 2 3 4 5 6 7 8 9 10 11 12
MonthMedian
2004
Turbidity
0.00.51.01.52.02.53.03.54.0
1 2 3 4 5 6 7 8 9 10 11 12
Month
NTU
Median
2004
Figure 5.6. Comparison of long-term median with 2004 data.

55
Shoal (SHOAL)
DIN
0.000
0.002
0.004
0.006
0.008
0.010
0.012
1 2 3 4 5 6 7 8 9 10 11 12
Month
ppm
Median
2004
TON
0.00.51.01.52.02.53.03.5
1 2 3 4 5 6 7 8 9 10 11 12
Month
ppm
Median
2004
TOC
0.00.10.20.30.40.50.60.70.8
1 2 3 4 5 6 7 8 9 10 11 12
Month
ppm
Median
2004
TP
0.000
0.005
0.010
0.015
0.020
0.025
1 2 3 4 5 6 7 8 9 10 11 12
Month
ppm
Median
2004
Temp.
05
101520253035
1 2 3 4 5 6 7 8 9 10 11 12
Month
oC
Median
2004
CHLA
0.0
0.5
1.0
1.5
2.0
2.5
3.0
1 2 3 4 5 6 7 8 9 10 11 12
Month
ppb
Median
2004
DO
0.01.02.03.04.05.06.07.08.0
1 2 3 4 5 6 7 8 9 10 11 12
Month
ppm
Median
2004
Salinity
32
33
34
35
36
37
1 2 3 4 5 6 7 8 9 10 11 12
MonthMedian
2004
Turbidity
0.0
2.0
4.0
6.0
8.0
10.0
1 2 3 4 5 6 7 8 9 10 11 12
Month
NTU
Median
2004
Figure 5.7. Comparison of long-term median with 2004 data.

56
6. STATE OF WATER QUALITY IN THE CAPE ROMANO - PINE ISLAND SOUND AREA
Overall Period of Record
Sampling in this area began Jan. 1999, therefore we now have five years of data available for analysis. However, until we perform a full spatial analysis, we will use generally accepted geomorphological characteristics to group the stations (Fig. 6.1). These groupings are the Cocohatchee River at Wiggins Pass (COCO), Estero Bay (EST), Cape Romano-Marco Island (MARC), Naples Bay (NPL), Pine Island Sound (PIS), Rookery Bay (RB), and San Carlos Bay (SCB). SCB is located at the mouth of the Caloosahatchee River, a major managed outlet for freshwater from Lake Okeechobee.
Figure 6.1. Map of station locations in Cape Romano-Pine Island Sound area.
All zones experienced low salinity during the beginning of the wet season with the opening
of the Caloosahatchee structure (Fig. 6.2-6.7). CHLA is elevated in this area but not excessive when compared to the overall Ten Thousand Islands. SCB is most directly affected by the releases also had highest concentrations of TP, DIN, and TOC. Estero Bay also exhibited lower salinities than the other areas as a result of freshwater input from the Estero and Imperial Rivers as well as Hendry Creek. EST is relatively enclosed, has a long water residence time, and is bordered on the north by the city of Ft. Meyers. These facts may account for the elevated CHLA, DIN and TP.
Overall, this area has significantly higher concentrations of CHLA, TP, and DIN than the bulk of the Ten Thousand Islands stations. Much of this is due to geological changes from carbonates to silicates, which facilitates transport of phosphorus, and to major land use changes from the Big Cypress National Preserve to suburban and agricultural.

57
Marco Zone
05
1015202530354045
1999
-01
1999
-03
1999
-05
1999
-07
1999
-09
1999
-11
2000
-01
2000
-03
2000
-05
2000
-07
2000
-09
2000
-11
2001
-01
2001
-03
2001
-05
2001
-07
2001
-09
2001
-11
2002
-01
2002
-03
2002
-05
2002
-07
2002
-09
2002
-11
2003
-01
2003
-03
2003
-05
2003
-07
2003
-09
2003
-11
2004
-01
2004
-03
2004
-05
2004
-07
2004
-09
2004
-11
0.00
0.05
0.10
0.15
0.20
0.25
ppm
1999
-01
1999
-03
1999
-05
1999
-07
1999
-09
1999
-11
2000
-01
2000
-03
2000
-05
2000
-07
2000
-09
2000
-11
2001
-01
2001
-03
2001
-05
2001
-07
2001
-09
2001
-11
2002
-01
2002
-03
2002
-05
2002
-07
2002
-09
2002
-11
2003
-01
2003
-03
2003
-05
2003
-07
2003
-09
2003
-11
2004
-01
2004
-03
2004
-05
2004
-07
2004
-09
2004
-11
0.00
0.02
0.04
0.06
0.08
0.10
0.12
0.14
ppm
1999
-01
1999
-03
1999
-05
1999
-07
1999
-09
1999
-11
2000
-01
2000
-03
2000
-05
2000
-07
2000
-09
2000
-11
2001
-01
2001
-03
2001
-05
2001
-07
2001
-09
2001
-11
2002
-01
2002
-03
2002
-05
2002
-07
2002
-09
2002
-11
2003
-01
2003
-03
2003
-05
2003
-07
2003
-09
2003
-11
2004
-01
2004
-03
2004
-05
2004
-07
2004
-09
2004
-11
02468
101214161820
ug/l
1999
-01
1999
-03
1999
-05
1999
-07
1999
-09
1999
-11
2000
-01
2000
-03
2000
-05
2000
-07
2000
-09
2000
-11
2001
-01
2001
-03
2001
-05
2001
-07
2001
-09
2001
-11
2002
-01
2002
-03
2002
-05
2002
-07
2002
-09
2002
-11
2003
-01
2003
-03
2003
-05
2003
-07
2003
-09
2003
-11
2004
-01
2004
-03
2004
-05
2004
-07
2004
-09
2004
-11
Salinity
DIN
TP
CHLA
Figure 6.2. Box-and-whisker plots of water quality in RB-PIS by survey.

58
Rookery Bay Zone
05
10152025303540
1999
-01
1999
-03
1999
-05
1999
-07
1999
-09
1999
-11
2000
-01
2000
-03
2000
-05
2000
-07
2000
-09
2000
-11
2001
-01
2001
-03
2001
-05
2001
-07
2001
-09
2001
-11
2002
-01
2002
-03
2002
-05
2002
-07
2002
-09
2002
-11
2003
-01
2003
-03
2003
-05
2003
-07
2003
-09
2003
-11
2004
-01
2004
-03
2004
-05
2004
-07
2004
-09
2004
-11
0.00
0.05
0.10
0.15
0.20
0.25
0.30
ppm
1999
-01
1999
-03
1999
-05
1999
-07
1999
-09
1999
-11
2000
-01
2000
-03
2000
-05
2000
-07
2000
-09
2000
-11
2001
-01
2001
-03
2001
-05
2001
-07
2001
-09
2001
-11
2002
-01
2002
-03
2002
-05
2002
-07
2002
-09
2002
-11
2003
-01
2003
-03
2003
-05
2003
-07
2003
-09
2003
-11
2004
-01
2004
-03
2004
-05
2004
-07
2004
-09
2004
-11
0.00
0.02
0.04
0.06
0.08
0.10
ppm
1999
-01
1999
-03
1999
-05
1999
-07
1999
-09
1999
-11
2000
-01
2000
-03
2000
-05
2000
-07
2000
-09
2000
-11
2001
-01
2001
-03
2001
-05
2001
-07
2001
-09
2001
-11
2002
-01
2002
-03
2002
-05
2002
-07
2002
-09
2002
-11
2003
-01
2003
-03
2003
-05
2003
-07
2003
-09
2003
-11
2004
-01
2004
-03
2004
-05
2004
-07
2004
-09
2004
-11
0
5
10
15
20
25
30
ug/l
1999
-01
1999
-03
1999
-05
1999
-07
1999
-09
1999
-11
2000
-01
2000
-03
2000
-05
2000
-07
2000
-09
2000
-11
2001
-01
2001
-03
2001
-05
2001
-07
2001
-09
2001
-11
2002
-01
2002
-03
2002
-05
2002
-07
2002
-09
2002
-11
2003
-01
2003
-03
2003
-05
2003
-07
2003
-09
2003
-11
2004
-01
2004
-03
2004
-05
2004
-07
2004
-09
2004
-11
Salinity
DIN
TP
CHLA
Figure 6.3. Box-and-whisker plots of water quality in RB-PIS by survey.

59
Naples Zone
05
10152025303540
1999
-01
1999
-03
1999
-05
1999
-07
1999
-09
1999
-11
2000
-01
2000
-03
2000
-05
2000
-07
2000
-09
2000
-11
2001
-01
2001
-03
2001
-05
2001
-07
2001
-09
2001
-11
2002
-01
2002
-03
2002
-05
2002
-07
2002
-09
2002
-11
2003
-01
2003
-03
2003
-05
2003
-07
2003
-09
2003
-11
2004
-01
2004
-03
2004
-05
2004
-07
2004
-09
2004
-11
0.00
0.05
0.10
0.15
0.20
0.25
ppm
1999
-01
1999
-03
1999
-05
1999
-07
1999
-09
1999
-11
2000
-01
2000
-03
2000
-05
2000
-07
2000
-09
2000
-11
2001
-01
2001
-03
2001
-05
2001
-07
2001
-09
2001
-11
2002
-01
2002
-03
2002
-05
2002
-07
2002
-09
2002
-11
2003
-01
2003
-03
2003
-05
2003
-07
2003
-09
2003
-11
2004
-01
2004
-03
2004
-05
2004
-07
2004
-09
2004
-11
0.00
0.02
0.04
0.06
0.08
0.10
0.12
ppm
1999
-01
1999
-03
1999
-05
1999
-07
1999
-09
1999
-11
2000
-01
2000
-03
2000
-05
2000
-07
2000
-09
2000
-11
2001
-01
2001
-03
2001
-05
2001
-07
2001
-09
2001
-11
2002
-01
2002
-03
2002
-05
2002
-07
2002
-09
2002
-11
2003
-01
2003
-03
2003
-05
2003
-07
2003
-09
2003
-11
2004
-01
2004
-03
2004
-05
2004
-07
2004
-09
2004
-11
02468
1012141618
ug/l
1999
-01
1999
-03
1999
-05
1999
-07
1999
-09
1999
-11
2000
-01
2000
-03
2000
-05
2000
-07
2000
-09
2000
-11
2001
-01
2001
-03
2001
-05
2001
-07
2001
-09
2001
-11
2002
-01
2002
-03
2002
-05
2002
-07
2002
-09
2002
-11
2003
-01
2003
-03
2003
-05
2003
-07
2003
-09
2003
-11
2004
-01
2004
-03
2004
-05
2004
-07
2004
-09
2004
-11
Salinity
DIN
TP
CHLA
Figure 6.4. Box-and-whisker plots of water quality in RB-PIS by survey.

60
San Carlos Bay Zone
05
10152025303540
1999
-01
1999
-03
1999
-05
1999
-07
1999
-09
1999
-11
2000
-01
2000
-03
2000
-05
2000
-07
2000
-09
2000
-11
2001
-01
2001
-03
2001
-05
2001
-07
2001
-09
2001
-11
2002
-01
2002
-03
2002
-05
2002
-07
2002
-09
2002
-11
2003
-01
2003
-03
2003
-05
2003
-07
2003
-09
2003
-11
2004
-01
2004
-03
2004
-05
2004
-07
2004
-09
2004
-11
0.0
0.1
0.2
0.3
0.4
0.5
0.6
ppm
1999
-01
1999
-03
1999
-05
1999
-07
1999
-09
1999
-11
2000
-01
2000
-03
2000
-05
2000
-07
2000
-09
2000
-11
2001
-01
2001
-03
2001
-05
2001
-07
2001
-09
2001
-11
2002
-01
2002
-03
2002
-05
2002
-07
2002
-09
2002
-11
2003
-01
2003
-03
2003
-05
2003
-07
2003
-09
2003
-11
2004
-01
2004
-03
2004
-05
2004
-07
2004
-09
2004
-11
0.00
0.05
0.10
0.15
0.20
ppm
1999
-01
1999
-03
1999
-05
1999
-07
1999
-09
1999
-11
2000
-01
2000
-03
2000
-05
2000
-07
2000
-09
2000
-11
2001
-01
2001
-03
2001
-05
2001
-07
2001
-09
2001
-11
2002
-01
2002
-03
2002
-05
2002
-07
2002
-09
2002
-11
2003
-01
2003
-03
2003
-05
2003
-07
2003
-09
2003
-11
2004
-01
2004
-03
2004
-05
2004
-07
2004
-09
2004
-11
0
5
10
15
20
25
30
ug/l
1999
-01
1999
-03
1999
-05
1999
-07
1999
-09
1999
-11
2000
-01
2000
-03
2000
-05
2000
-07
2000
-09
2000
-11
2001
-01
2001
-03
2001
-05
2001
-07
2001
-09
2001
-11
2002
-01
2002
-03
2002
-05
2002
-07
2002
-09
2002
-11
2003
-01
2003
-03
2003
-05
2003
-07
2003
-09
2003
-11
2004
-01
2004
-03
2004
-05
2004
-07
2004
-09
2004
-11
Salinity
DIN
TP
CHLA
Figure 6.5. Box-and-whisker plots of water quality in RB-PIS by survey.

61
Estero Bay Zone
05
10152025303540
1999
-01
1999
-03
1999
-05
1999
-07
1999
-09
1999
-11
2000
-01
2000
-03
2000
-05
2000
-07
2000
-09
2000
-11
2001
-01
2001
-03
2001
-05
2001
-07
2001
-09
2001
-11
2002
-01
2002
-03
2002
-05
2002
-07
2002
-09
2002
-11
2003
-01
2003
-03
2003
-05
2003
-07
2003
-09
2003
-11
2004
-01
2004
-03
2004
-05
2004
-07
2004
-09
2004
-11
0.00
0.05
0.10
0.15
0.20
0.25
0.30
0.35
ppm
1999
-01
1999
-03
1999
-05
1999
-07
1999
-09
1999
-11
2000
-01
2000
-03
2000
-05
2000
-07
2000
-09
2000
-11
2001
-01
2001
-03
2001
-05
2001
-07
2001
-09
2001
-11
2002
-01
2002
-03
2002
-05
2002
-07
2002
-09
2002
-11
2003
-01
2003
-03
2003
-05
2003
-07
2003
-09
2003
-11
2004
-01
2004
-03
2004
-05
2004
-07
2004
-09
2004
-11
0.00
0.05
0.10
0.15
0.20
ppm
1999
-01
1999
-03
1999
-05
1999
-07
1999
-09
1999
-11
2000
-01
2000
-03
2000
-05
2000
-07
2000
-09
2000
-11
2001
-01
2001
-03
2001
-05
2001
-07
2001
-09
2001
-11
2002
-01
2002
-03
2002
-05
2002
-07
2002
-09
2002
-11
2003
-01
2003
-03
2003
-05
2003
-07
2003
-09
2003
-11
2004
-01
2004
-03
2004
-05
2004
-07
2004
-09
2004
-11
0
5
10
15
20
25
ug/l
1999
-01
1999
-03
1999
-05
1999
-07
1999
-09
1999
-11
2000
-01
2000
-03
2000
-05
2000
-07
2000
-09
2000
-11
2001
-01
2001
-03
2001
-05
2001
-07
2001
-09
2001
-11
2002
-01
2002
-03
2002
-05
2002
-07
2002
-09
2002
-11
2003
-01
2003
-03
2003
-05
2003
-07
2003
-09
2003
-11
2004
-01
2004
-03
2004
-05
2004
-07
2004
-09
2004
-11
Salinity
DIN
TP
CHLA
Figure 6.6. Box-and-whisker plots of water quality in RB-PIS by survey.

62
Pine Island Sound Zone
05
10152025303540
1999
-01
1999
-03
1999
-05
1999
-07
1999
-09
1999
-11
2000
-01
2000
-03
2000
-05
2000
-07
2000
-09
2000
-11
2001
-01
2001
-03
2001
-05
2001
-07
2001
-09
2001
-11
2002
-01
2002
-03
2002
-05
2002
-07
2002
-09
2002
-11
2003
-01
2003
-03
2003
-05
2003
-07
2003
-09
2003
-11
2004
-01
2004
-03
2004
-05
2004
-07
2004
-09
2004
-11
0.00
0.05
0.10
0.15
0.20
ppm
1999
-01
1999
-03
1999
-05
1999
-07
1999
-09
1999
-11
2000
-01
2000
-03
2000
-05
2000
-07
2000
-09
2000
-11
2001
-01
2001
-03
2001
-05
2001
-07
2001
-09
2001
-11
2002
-01
2002
-03
2002
-05
2002
-07
2002
-09
2002
-11
2003
-01
2003
-03
2003
-05
2003
-07
2003
-09
2003
-11
2004
-01
2004
-03
2004
-05
2004
-07
2004
-09
2004
-11
0
5
10
15
20
25
ug/l
1999
-01
1999
-03
1999
-05
1999
-07
1999
-09
1999
-11
2000
-01
2000
-03
2000
-05
2000
-07
2000
-09
2000
-11
2001
-01
2001
-03
2001
-05
2001
-07
2001
-09
2001
-11
2002
-01
2002
-03
2002
-05
2002
-07
2002
-09
2002
-11
2003
-01
2003
-03
2003
-05
2003
-07
2003
-09
2003
-11
2004
-01
2004
-03
2004
-05
2004
-07
2004
-09
2004
-11
Salinity
DIN
TP
CHLA
Figure 6.7. Box-and-whisker plots of water quality in RB-PIS by survey.

63
2004 Alone Overall, this area has significantly higher concentrations of CHLA, TP, and DIN than the
bulk of the Ten Thousand Islands stations. Much of this is due to geological changes from carbonates to silicates, which facilitates transport of phosphorus, and to major land use changes from the Big Cypress National Preserve to suburban and agricultural.
The largest interannual variations in salinity in this area are driven by freshwater releases from the Caloosahatchee River. (Fig. 6.8-6.14). The large freshwater inputs result in high DIN loads and concentrations. Freshwater releases during Sept./Oct. resulted in DIN concentrations up to 10 times normal. This was due to the need to lower the water table inland because of potential flooding from the hurricanes. The large and rapid increase in N (and P) loading to the estuaries caused large phytoplankton blooms and increased turbidity across the region.
Annual patterns in TON, TOC, temperature, and DO were unremarkable with values generally fluctuating around the median for all areas of the bay.
Data, Graphs, and Figures All data for the period of record are available at:
http://serc.fiu.edu/wqmnetwork/SFWMD-CD/DataDL.htm Monthly time series graphs for all measured variables for each station are available at:
http://serc.fiu.edu/wqmnetwork/SFWMD-CD/RB.htm Contour maps showing spatial distributions of all measured variables (quarterly) are available at:
http://serc.fiu.edu/wqmnetwork/SFWMD-CD/ContourMaps.htm

64
Marco Island (MARC)
DIN
0.000
0.005
0.010
0.015
0.020
0.025
1 2 3 4 5 6 7 8 9 10 11 12
Month
ppm
Median
2004
TON
0.01.02.03.04.05.06.07.0
1 2 3 4 5 6 7 8 9 10 11 12
Month
ppm
Median
2004
TOC
0.0
0.1
0.2
0.3
0.4
0.5
1 2 3 4 5 6 7 8 9 10 11 12
Month
ppm
Median
2004
TP
0.00
0.01
0.02
0.03
0.04
0.05
0.06
1 2 3 4 5 6 7 8 9 10 11 12
Month
ppm
Median
2004
Temp.
05
101520253035
1 2 3 4 5 6 7 8 9 10 11 12
Month
oC
Median
2004
CHLA
0.02.04.06.08.0
10.012.014.0
1 2 3 4 5 6 7 8 9 10 11 12
Month
ppb
Median
2004
DO
0.01.02.03.04.05.06.07.08.0
1 2 3 4 5 6 7 8 9 10 11 12
Month
ppm
Median
2004
Salinity
05
10152025303540
1 2 3 4 5 6 7 8 9 10 11 12
MonthMedian
2004
Turbidity
0.0
2.0
4.0
6.0
8.0
10.0
1 2 3 4 5 6 7 8 9 10 11 12
Month
NTU
Median
2004
Figure 6.8. Comparison of long-term median with 2004 data.
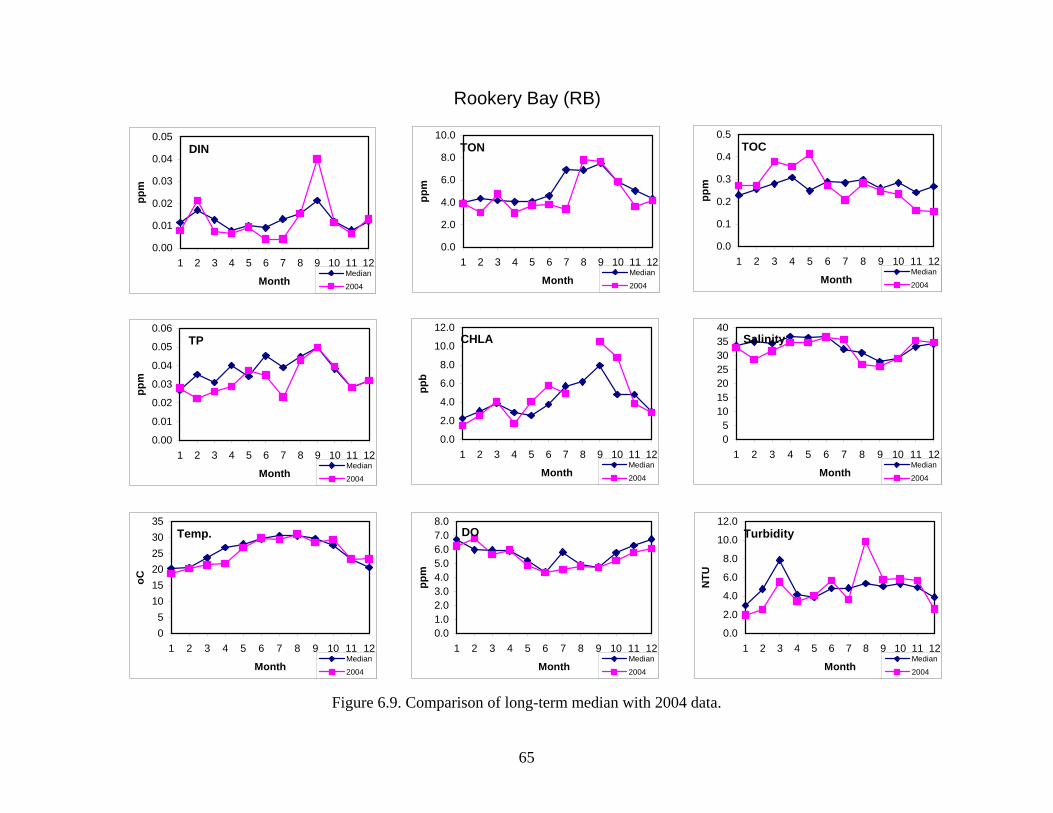
65
Rookery Bay (RB)
DIN
0.00
0.01
0.02
0.03
0.04
0.05
1 2 3 4 5 6 7 8 9 10 11 12
Month
ppm
Median
2004
TON
0.0
2.0
4.0
6.0
8.0
10.0
1 2 3 4 5 6 7 8 9 10 11 12
Month
ppm
Median
2004
TOC
0.0
0.1
0.2
0.3
0.4
0.5
1 2 3 4 5 6 7 8 9 10 11 12
Month
ppm
Median
2004
TP
0.00
0.01
0.02
0.03
0.04
0.05
0.06
1 2 3 4 5 6 7 8 9 10 11 12
Month
ppm
Median
2004
Temp.
05
101520253035
1 2 3 4 5 6 7 8 9 10 11 12
Month
oC
Median
2004
CHLA
0.0
2.0
4.0
6.0
8.0
10.0
12.0
1 2 3 4 5 6 7 8 9 10 11 12
Month
ppb
Median
2004
DO
0.01.02.03.04.05.06.07.08.0
1 2 3 4 5 6 7 8 9 10 11 12
Month
ppm
Median
2004
Salinity
05
10152025303540
1 2 3 4 5 6 7 8 9 10 11 12
MonthMedian
2004
Turbidity
0.0
2.0
4.0
6.0
8.0
10.0
12.0
1 2 3 4 5 6 7 8 9 10 11 12
Month
NTU
Median
2004
Figure 6.9. Comparison of long-term median with 2004 data.

66
Naples Bay (NPL)
DIN
0.000.020.040.060.080.100.120.140.16
1 2 3 4 5 6 7 8 9 10 11 12
Month
ppm
Median
2004
TON
0.01.02.03.04.05.06.07.0
1 2 3 4 5 6 7 8 9 10 11 12
Month
ppm
Median
2004
TOC
0.0
0.1
0.2
0.3
0.4
0.5
1 2 3 4 5 6 7 8 9 10 11 12
Month
ppm
Median
2004
TP
0.00
0.01
0.02
0.03
0.04
0.05
1 2 3 4 5 6 7 8 9 10 11 12
Month
ppm
Median
2004
Temp.
05
101520253035
1 2 3 4 5 6 7 8 9 10 11 12
Month
oC
Median
2004
CHLA
0.0
2.0
4.0
6.0
8.0
10.0
1 2 3 4 5 6 7 8 9 10 11 12
Month
ppb
Median
2004
DO
0.01.02.03.04.05.06.07.08.0
1 2 3 4 5 6 7 8 9 10 11 12
Month
ppm
Median
2004
Salinity
05
10152025303540
1 2 3 4 5 6 7 8 9 10 11 12
MonthMedian
2004
Turbidity
0.01.02.03.04.05.06.07.08.0
1 2 3 4 5 6 7 8 9 10 11 12
Month
NTU
Median
2004
Figure 6.10. Comparison of long-term median with 2004 data.

67
San Carlos Bay (SCB)
DIN
0.00
0.10
0.20
0.30
0.40
0.50
1 2 3 4 5 6 7 8 9 10 11 12
Month
ppm
Median
2004
TON
0
5
10
15
20
1 2 3 4 5 6 7 8 9 10 11 12
Month
ppm
Median
2004
TOC
0.0
0.1
0.2
0.3
0.4
0.5
1 2 3 4 5 6 7 8 9 10 11 12
Month
ppm
Median
2004
TP
0.000.010.020.030.040.050.060.070.080.090.10
1 2 3 4 5 6 7 8 9 10 11 12
Month
ppm
Median
2004
Temp.
05
101520253035
1 2 3 4 5 6 7 8 9 10 11 12
Month
oC
Median
2004
CHLA
0.01.02.03.04.05.06.07.08.0
1 2 3 4 5 6 7 8 9 10 11 12
Month
ppb
Median
2004
DO
0.01.02.03.04.05.06.07.08.0
1 2 3 4 5 6 7 8 9 10 11 12
Month
ppm
Median
2004
Salinity
05
10152025303540
1 2 3 4 5 6 7 8 9 10 11 12
MonthMedian
2004
Turbidity
0.0
2.0
4.0
6.0
8.0
10.0
12.0
1 2 3 4 5 6 7 8 9 10 11 12
Month
NTU
Median
2004
Figure 6.11. Comparison of long-term median with 2004 data.

68
Estero Bay (EST)
DIN
0.00
0.02
0.04
0.06
0.08
0.10
0.12
1 2 3 4 5 6 7 8 9 10 11 12
Month
ppm
Median
2004
TON
0.0
1.0
2.0
3.0
4.0
5.0
6.0
1 2 3 4 5 6 7 8 9 10 11 12
Month
ppm
Median
2004
TOC
0.0
0.1
0.2
0.3
0.4
0.5
0.6
1 2 3 4 5 6 7 8 9 10 11 12
Month
ppm
Median
2004
TP
0.000.010.020.030.040.050.060.07
1 2 3 4 5 6 7 8 9 10 11 12
Month
ppm
Median
2004
Temp.
05
101520253035
1 2 3 4 5 6 7 8 9 10 11 12
Month
oC
Median
2004
CHLA
0.02.04.06.08.0
10.012.014.0
1 2 3 4 5 6 7 8 9 10 11 12
Month
ppb
Median
2004
DO
0.01.02.03.04.05.06.07.08.0
1 2 3 4 5 6 7 8 9 10 11 12
Month
ppm
Median
2004
Salinity
05
10152025303540
1 2 3 4 5 6 7 8 9 10 11 12
MonthMedian
2004
Turbidity
0.0
2.0
4.0
6.0
8.0
10.0
1 2 3 4 5 6 7 8 9 10 11 12
Month
NTU
Median
2004
Figure 6.12. Comparison of long-term median with 2004 data.
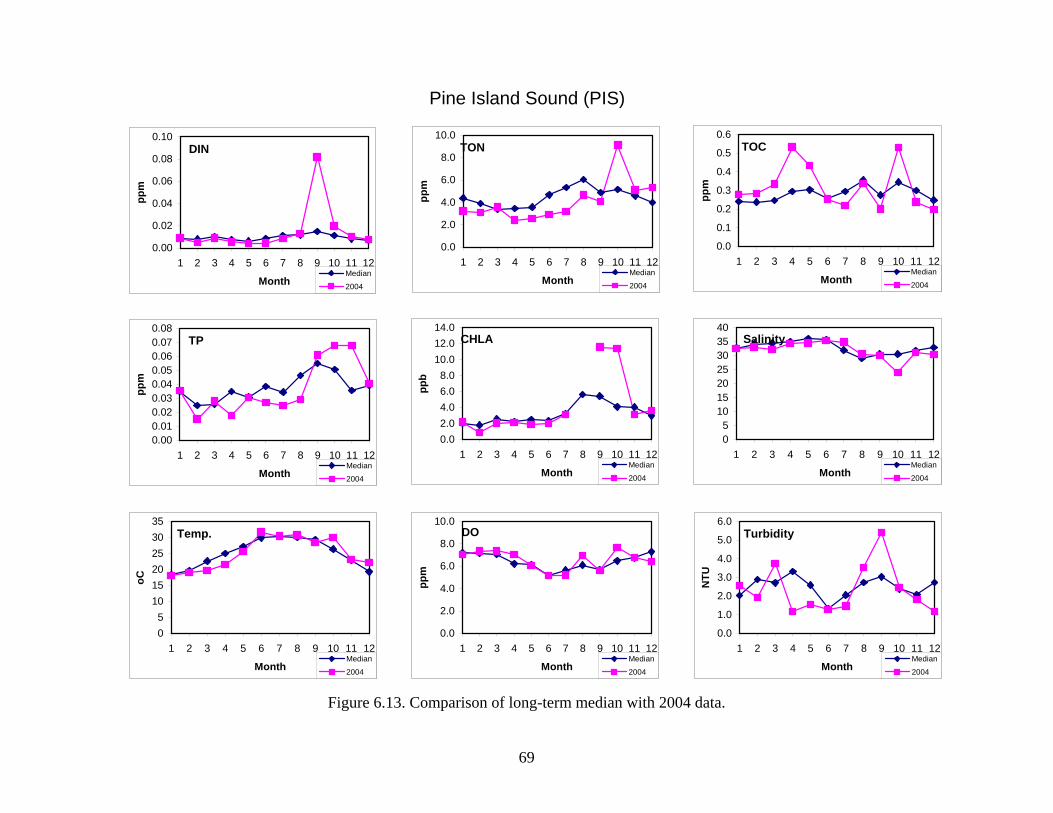
69
Pine Island Sound (PIS)
DIN
0.00
0.02
0.04
0.06
0.08
0.10
1 2 3 4 5 6 7 8 9 10 11 12
Month
ppm
Median
2004
TON
0.0
2.0
4.0
6.0
8.0
10.0
1 2 3 4 5 6 7 8 9 10 11 12
Month
ppm
Median
2004
TOC
0.0
0.1
0.2
0.3
0.4
0.5
0.6
1 2 3 4 5 6 7 8 9 10 11 12
Month
ppm
Median
2004
TP
0.000.010.020.030.040.050.060.070.08
1 2 3 4 5 6 7 8 9 10 11 12
Month
ppm
Median
2004
Temp.
05
101520253035
1 2 3 4 5 6 7 8 9 10 11 12
Month
oC
Median
2004
CHLA
0.02.04.06.08.0
10.012.014.0
1 2 3 4 5 6 7 8 9 10 11 12
Month
ppb
Median
2004
DO
0.0
2.0
4.0
6.0
8.0
10.0
1 2 3 4 5 6 7 8 9 10 11 12
Month
ppm
Median
2004
Salinity
05
10152025303540
1 2 3 4 5 6 7 8 9 10 11 12
MonthMedian
2004
Turbidity
0.0
1.0
2.0
3.0
4.0
5.0
6.0
1 2 3 4 5 6 7 8 9 10 11 12
Month
NTU
Median
2004
Figure 6.13. Comparison of long-term median with 2004 data.

70
Cocohatchee River (COCO)
DIN
0.000.050.100.150.200.250.300.35
1 2 3 4 5 6 7 8 9 10 11 12
Month
ppm
Median
2004
TON
0.02.04.06.08.0
10.012.014.016.0
1 2 3 4 5 6 7 8 9 10 11 12
Month
ppm
Median
2004
TOC
0.00.10.20.30.40.50.60.7
1 2 3 4 5 6 7 8 9 10 11 12
Month
ppm
Median
2004
TP
0.000.010.020.030.040.050.060.070.080.09
1 2 3 4 5 6 7 8 9 10 11 12
Month
ppm
Median
2004
Temp.
05
101520253035
1 2 3 4 5 6 7 8 9 10 11 12
Month
oC
Median
2004
CHLA
0
5
10
15
20
1 2 3 4 5 6 7 8 9 10 11 12
Month
ppb
Median
2004
DO
0.01.02.03.04.05.06.07.0
1 2 3 4 5 6 7 8 9 10 11 12
Month
ppm
Median
2004
Salinity
05
10152025303540
1 2 3 4 5 6 7 8 9 10 11 12
MonthMedian
2004
Turbidity
0.01.02.03.04.05.06.07.0
1 2 3 4 5 6 7 8 9 10 11 12
Month
NTU
Median
2004
Figure 6.14. Comparison of long-term median with 2004 data.

71
7. PUBLICATIONS DERIVED FROM THIS PROJECT FOURQUREAN, J. W., R. D. JONES, AND J. C. ZIEMAN. 1993. Processes influencing water column
nutrient characteristics and phosphorus limitation of phytoplankton biomass in Florida Bay, FL, USA: Inferences from spatial distributions. Estuarine, Coastal and Shelf Science 36:295-314.
BOYER, J. N., J. W. FOURQUREAN, AND R. D. JONES. 1997. Spatial characterization of water quality in Florida Bay and Whitewater Bay by principal component and cluster analyses: Zones of similar influence (ZSI). Estuaries 20:743-758.
BOYER, J. N., AND R. D. JONES. 1999. Effects of freshwater inputs and loading of phosphorus and nitrogen on the water quality of Eastern Florida Bay, p. 545-561. In K. R. Reddy, G. A. O’Connor, and C. L. Schelske (eds.) Phosphorus biogeochemistry in sub-tropical ecosystems: Florida as a case example. CRC/Lewis Publishers, Boca Raton.
BOYER, J. N., J. W. FOURQUREAN, AND R. D. JONES. 1999. Seasonal and long-term trends in water quality of Florida Bay (1989-97). Estuaries 22: 417-430.
RUDNICK, D., Z. CHEN, D. CHILDERS, T. FONTAINE, AND J. N. BOYER. 1999. Phosphorus and nitrogen inputs to Florida Bay: the importance of the Everglades watershed. Estuaries 22: 398-416.
PENNOCK, J. R., J. N. BOYER, J. A. HERERRA-SILVIERA, R. L. IVERSON, T. E. WHITLEDGE, B. MORTAZAVI, AND F. A. COMIN. 1999. Nutrient behavior and pelagic processes, p. 109-162. In T. S. Bianchi, J. R. Pennock, and R. R. Twilley (eds.), Biogeochemistry of Gulf of Mexico Estuaries. Wiley, New York.
BOYER, J. N., P. STERLING, AND R. D. JONES. 2000. Maximizing information from estuarine and coastal water quality monitoring networks by diverse visualization approaches. Estuarine, Coastal and Shelf Science 50: 39-48.
BOYER, J. N. AND R. D. JONES. 2000. Trends in water quality of Florida Bay (1989-1999). State of Florida Bay. NPS - Everglades National Park Report.
BOYER, J. N., AND R. D. JONES. 2001. A view from the bridge: External and internal forces affecting the ambient water quality of the Florida Keys National Marine Sanctuary, p. 601-620. In J. W. Porter and K. G. Porter (eds.), The Everglades, Florida Bay, and Coral Reefs of the Florida Keys. CRC Press.
HU, C., F. E. MULLER-KARGER, Z.-P. LEE, K. L. CARDER, B. ROBERTS, J. J. WALSH, R. H. WEISBERG, R. HE, E. JOHNS, T. LEE, N. KURING, J. PATCH, J. IVEY, P. G. COBLE, C. HEIL, G. A. VARGO, R. G. ZEPP, K. STEIDINGER, G. MCRAE, J. BOYER, R. JONES, G. KIRKPATRICK, E. MUELLER, R. PIERCE, J. CULTER, B. KELLER, J. HUNT. 2002. The 2002 “black water” event off SW Florida as detected by satellites. EOS 83: 281, 285.
FOURQUREAN, J. W., J. N. BOYER, AND M. J. DURAKO. 2003. The influence of water quality on seagrass distribution and abundance in Florida Bay: predictive models from long-term monitoring programs. Ecological Applications 13: 474-489.
JAFFÉ, R, J. N. BOYER, X. LU, N. MAIE, C. YANG, N. SCULLY, AND S. MOCK. 2004. Source characterization of dissolved organic matter in a subtropical mangrove-dominated estuary by fluorescence analysis. Marine Chemistry 84: 195-210.
SCULLEY, N. M., N. MAIE, S. K. DAILEY, J. N. BOYER, AND R. JAFFÉ. 2004. Photochemical and microbial transformation of plant derived dissolved organic matter in the Florida Everglades. Limnology and Oceanography 49: 1667-1678.
BOYER, J. N. AND B. KELLER. 2005. Nutrient Dynamics, In W. K. Nuttle (ed.), A Synthesis of Research on Florida Bay. Compiled for the Science Oversight Panel. (in press)

72
CHILDERS, D. L., J. N. BOYER, S. E. DAVIS, C. J. MADDEN, D. T. RUDNICK, AND F. H. SKLAR. 2005. Nutrient concentration patterns in the oligotrophic “upside-down” estuaries of the Florida Everglades. Limnology and Oceanography (in press)
KELBLE, C. R., P. B. ORTNER, G. L. HITCHCOCK, AND J. N. BOYER. (in press) A re-examination of the light environment of Florida Bay. Estuaries.
CACCIA-GONZALEZ, V. AND J. N. BOYER. (in review). Spatial patterning of water quality in Biscayne Bay, Florida as a function of land use and water management. Marine Pollution Bulletin.
DAILEY, S. K., AND J. N. BOYER. (in prep.) Nutrient, dissolved organic matter, and microbial coupling in the Shark River Estuary, FL. Estuaries.
BOYER, J. N., S. K. DAILEY, R. JAFFÉ, N. MAIE. (in prep.) Biological availability of organic nitrogen along an oligotrophic marsh/mangrove/estuary ecotone in South Florida, USA. Aquatic Microbial Ecology.

73
8. PRESENTATIONS DERIVED FROM THIS PROJECT BOYER, J. N., J. W. FOURQUREAN, AND R. D. JONES. 1995. Spatial analysis of long term water
quality data from Florida Bay. Estuarine Research Federation - Corpus Christi, TX. BOYER, J. N. AND R. D. JONES. 1996. The Florida Bay water quality monitoring program:
assessing status and trends. 1996 Florida Bay Science Conference - Key Largo, FL. BOYER, J. N., J. W. FOURQUREAN, AND R. D. JONES. 1997. Temporal trends in water chemistry of
Florida Bay (1989-1995): Influence of water management activities. ASLO Aquatic Sciences Meeting, Santa Fe, NM.
JONES, R. D., AND J. N. BOYER. 1998. An overview of water quality in Florida Bay and surrounding waters: current status and trends. 1998 Florida Bay Science Conference, Miami, FL.
BOYER, J. N., AND R. D. JONES. 1998. Influence of coastal geomorphology and watershed characteristics on the water quality of mangrove estuaries in the Ten Thousand Islands - Whitewater Bay complex, Florida. 1998 Florida Bay Science Conference, Miami, FL.
FOURQUREAN, J. W., M. J. DURAKO, J. C. ZIEMAN, AND J. N. BOYER. 1998. Seagrass beds respond to the magnitude and location of nutrient sources in the South Florida hydroscape. ASLO/ESA, St. Louis, MO.
BOYER, J. N., AND R. D. JONES. 1998. A view from the bridge: the influence of Biscayne Bay, Florida Bay, and the Southwest Shelf on the reefs in the Florida Keys National Marine Sanctuary. ASLO/ESA, St. Louis, MO.
BOYER, J. N. AND R. D. JONES 1999. Relative influence of Florida Bay on the water quality of the Florida Keys National Marine Sanctuary. 1999 Florida Bay Science Conference, Key Largo.
BOYER, J. N., AND R. D. JONES. 1999. An ecotone of estuaries? Influence of watershed characteristics on the mangrove estuaries in southwest Florida. ERF, New Orleans, LA.
CHILDERS, D. L., J. BOYER, J. FOURQUREAN, R. JAFFE, ET AL. 2000. Regional Controls of Population and Ecosystem Dynamics in an Oligotrophic Wetland-dominated Coastal Landscape - Introducing a New LTER in the Coastal Everglades. International Association of Landscape Ecologists, Ft. Lauderdale.
LU, X., J. N. BOYER, AND R. JAFFE. 2000. Source characterization of DOM in southwest Florida estuaries by UV-Visible and fluorescence analysis. South Florida ACS Meeting, Orlando.
FOURQUREAN, J., AND J. N. BOYER. 2000. Seagrass species react independently to water quality in South Florida. ASLO, Orlando.
BOYER, J. N., D. CHILDERS, R. JAFFE, R. JONES, AND L. J. SCINTO. 2000. What We Already know About the Water Quality/Nutrient Status of the Florida Coastal Everglades LTER and Its Environs. LTER All Scientists Meeting, Snowbird, UT.
LU, X., J. N. BOYER, AND R. JAFFE. 2000. Source characterization of DOM in southwest Florida estuaries by UV-Visible and fluorescence analysis. ASLO, Albuquerque, NM.
BOYER, J. N., AND R. D. JONES. 2001. Trends in water quality of Florida Bay. 2001 Florida Bay Science Conference, Key Largo, FL.
FOURQUREAN, J. W., J. N. BOYER, M. J. DURAKO. The statistical relationship between benthic habitats and water quality in Florida Bay. 2001 Florida Bay Science Conference, Key Largo, FL.
BOYER, J. N., AND S. K. DAILEY. 2002. Microbial dynamics in Florida Bay and the Florida Coastal Everglades LTER. Southeastern Estuarine Research Society - Oct. 2002.

74
DAILEY, S. K., AND J. N. BOYER. 2002. Evidence of mid-river productivity maxima in the Shark River, Florida Coastal Everglades LTER. Southeastern Estuarine Research Society - Oct. 2002.
AZUA, A., J. N. BOYER, AND P. R. GARDINALI. 2002. Trace Determination of Caffeine in Coastal Waters from the Florida Keys. SETAC - Nov. 2002.
BOYER, J. N. AND S. K. DAILEY. 2003. Microbial Dynamics in Florida Bay: A New Paradigm for the Microbial Loop in Oligotrophic Marine Waters. Joint Conference on the Science and Restoration of the Greater Everglades and Florida Bay Ecosystem - April. 2003.
DAILEY, S. K. AND J. N. BOYER. 2003. Uncoupling autotrophic and heterotrophic microbial response to increased DOM in Florida Bay. Joint Conference on the Science and Restoration of the Greater Everglades and Florida Bay Ecosystem - April. 2003.
FOURQUREAN, J. W., J. N. BOYER, B. J. PETERSON, M. J. DURAKO, L. N. HEFTY. 2003. The response of seagrass distribution to changing water quality: predictive models from monitoring data. Joint Conference on the Science and Restoration of the Greater Everglades and Florida Bay Ecosystem - April. 2003.
GIBSON, P. J., S. K. DAILEY, AND J. N. BOYER. 2003. Bloom in a Bottle: Experimental Derivation of the Mechanism for the Onset and Persistence of Phytoplankton Blooms in Florida Bay. Joint Conference on the Science and Restoration of the Greater Everglades and Florida Bay Ecosystem - April. 2003.
KELBLE, C. R., G. L. HITCHCOCK, P. B. ORTNER, AND J. N. BOYER. 2003. A recent study of the light environment in Florida Bay. Joint Conference on the Science and Restoration of the Greater Everglades and Florida Bay Ecosystem - April. 2003.
KUHNLEIN, E., S. K. DAILEY, AND J. N. BOYER. 2003. Florida Bay Phytoplankton Community Structure and Algal Energetics using PAM Fluorometry. Joint Conference on the Science and Restoration of the Greater Everglades and Florida Bay Ecosystem - April. 2003.
MIR-GONZALEZ, D., J. MEEDER, AND J. N. BOYER. 2003. Macrophyte Benthic Communities and Groundwater Nutrient Dynamics in Biscayne Bay, Florida. Joint Conference on the Science and Restoration of the Greater Everglades and Florida Bay Ecosystem - April. 2003.
ROGERS, M., S. K. DAILEY, AND J. N. BOYER. 2003. Bacterial Enumeration in Florida Bay Using Epifluorescent Microscopy and Flow Cytometry. Joint Conference on the Science and Restoration of the Greater Everglades and Florida Bay Ecosystem - April. 2003.
SCULLY, N. M., N. MAIE, S. K. DAILEY, J. N. BOYER, R. D. JONES, AND R. JAFFÉ. 2003. Photochemical and Microbial Transformation of Dissolved Organic Matter in the Florida Everglades. Joint Conference on the Science and Restoration of the Greater Everglades and Florida Bay Ecosystem - April. 2003.
GIBSON, P. J., S. K. DAILEY, AND J. N. BOYER. 2003. Does DOM have a role in promoting cyanobacterial blooms in Florida Bay, USA? Estuarine Research Federation Meeting - Sept. 2003.
MIR-GONZALEZ, D., J. N. BOYER, AND J. MEEDER. The Effect of Groundwater Nutrient Inputs on Benthic Macrophyte Community Structure in Biscayne Bay, Florida. Estuarine Research Federation Meeting - Sept. 2003.
ROGERS, M. T., J. N. BOYER, AND S. K. DAILEY. 2003. Bacterial biomass and production in Florida Bay, USA. Estuarine Research Federation Meeting - Sept. 2003.
BENNETT, R. J., P. H. DOERING, D. T. RUDNICK, AND J. N. BOYER. 2003. Nutrient – phytoplankton relationships: a comparison of South Florida’s estuaries. Estuarine Research Federation Meeting - Sept. 2003.

75
BOYER, J. N. 2004. The value of a regional water quality monitoring network in restoration planning in South Florida. EMAP Symposium, May 6, 2004 – Newport, RI.
BOYER, J. N., R. JAFFE, S. K. DAILEY, N. MAIE. 2004. Biological availability of dissolved organic nitrogen entering Florida Bay from the Everglades and fringing mangroves. ASLO Meeting, Savannah, GA - June 17, 2004.
BOYER, J. N. 2004. Long term water quality monitoring in South Florida. Coral Reef Joint Task Force Special Session, Miami Beach, FL. – Sept. 2004.
BOYER, J. N. 2004. Water Quality Issues in the FKNMS. Keys Connectivity Meeting, Key West, FL - Aug. 2004.

76
9. TABLES 9.1. List of fixed station location and sampling period of record.
9.2. Statistical summary of Florida Bay water quality variables by zone.
9.3. Statistical summary of Whitewater Bay-Ten Thousand Islands water quality by zone.
9.4. Statistical summary of Biscayne Bay water quality variables by zone.
9.5. Statistical summary of Southwest Florida Shelf water quality variables by zone.
9.6. Statistical summary of Cape Romano-Pine Island Sound water quality variables by zone.

77
Table 9.1. List of fixed station location and sampling period of record. Station
Station Name Number Area Latitude Longitude Period of Record SurveysCard Sound Bridge 1 FB 25 16.413 -80 22.475 Mar 91 - Dec 04 1-166 Middle Key 2 FB 25 17.102 -80 23.702 Mar 91 - Dec 04 1-166 Manatee Bay 3 FB 25 15.062 -80 24.910 Mar 91 - Dec 04 1-166 Barnes Sound 4 FB 25 13.304 -80 23.299 Mar 91 - Dec 04 1-166 Blackwater Sound 5 FB 25 10.443 -80 25.385 Mar 91 - Dec 04 1-166 Little Blackwater Sound 6 FB 25 12.401 -80 26.424 Mar 91 - Dec 04 1-166 Highway Creek 7 FB 25 15.216 -80 26.649 Mar 91 - Dec 04 1-166 Long Sound 8 FB 25 13.642 -80 27.700 Mar 91 - Dec 04 1-166 Duck Key 9 FB 25 10.624 -80 29.494 Mar 91 - Dec 04 1-166 Joe Bay 10 FB 25 13.468 -80 32.195 Mar 91 - Dec 04 1-166 Little Madeira Bay 11 FB 25 10.510 -80 37.615 Mar 91 - Dec 04 1-166 Terrapin Bay 12 FB 25 08.422 -80 42.967 Mar 91 - Dec 04 1-166 Whipray Basin 13 FB 25 05.485 -80 45.287 Mar 91 - Dec 04 1-166 Garfield Bight 14 FB 25 09.029 -80 48.553 Apr 91 - Dec 04 2-166 Rankin Lake 15 FB 25 07.283 -80 48.173 Mar 91 - Dec 04 1-166 Murray Key 16 FB 25 07.096 -80 56.379 Mar 91 - Dec 04 1-166 Johnson Key Basin 17 FB 25 02.548 -80 54.889 Mar 91 - Dec 04 1-166 Rabbit Key Basin 18 FB 25 00.145 -80 54.006 Mar 91 - Dec 04 1-166 Twin Key Basin 19 FB 24 58.660 -80 45.211 Apr 91 - Dec 04 2-166 Peterson Keys 20 FB 24 55.770 -80 45.028 Mar 91 - Dec 04 1-166 Porpoise Lake 21 FB 25 00.396 -80 40.876 Mar 91 - Dec 04 1-166 Captain Key 22 FB 25 02.405 -80 36.843 Apr 91 - Dec 04 2-166 Park Key 23 FB 25 07.078 -80 35.983 Apr 91 - Dec 04 2-166 Butternut Key 24 FB 25 06.105 -80 31.884 Mar 91 - Dec 04 1-166 East Cape 25 FB 25 05.022 -81 04.835 July 92 - Dec 04 17-166 Oxfoot Bank 26 FB 24 58.844 -81 00.098 July 92 - Dec 04 17-166 Sprigger Bank 27 FB 24 55.116 -80 56.092 July 92 - Dec 04 17-166 Old Dan Bank 28 FB 24 52.032 -80 48.429 July 92 - Dec 04 17-166 First Bay 29 WWB 25 33.272 -81 11.020 Sept 92 - Dec 04 19-166 Third Bay 30 WWB 25 34.810 -81 07.256 Sept 92 - Dec 04 19-166 Big Lostmans Bay 31 WWB 25 34.055 -81 04.288 Sept 92 - Dec 04 19-166 Cabbage Island 32 WWB 25 31.764 -81 02.603 Sept 92 - Dec 04 19-166 Broad River Bay 33 WWB 25 29.984 -81 02.939 Sept 92 - Dec 04 19-166 Middle Broad River 34 WWB 25 29.163 -81 06.669 Sept 92 - Dec 04 19-166 Broad River Mouth 35 WWB 25 28.501 -81 09.176 Sept 92 - Dec 04 19-166 Harney River Mouth 36 WWB 25 24.701 -81 08.487 Sept 92 - Dec 04 19-166 Harney Rivers Junction 37 WWB 25 25.901 -81 04.943 Sept 92 - Dec 04 19-166 Tarpon Bay 38 WWB 25 25.037 -80 59.906 Sept 92 - Dec 04 19-166 Gunboat Island 39 WWB 25 22.735 -81 01.844 Sept 92 - Dec 04 19-166 Ponce de Leon Bay 40 WWB 25 20.983 -81 07.474 Sept 92 - Dec 04 19-166 Oyster Bay 41 WWB 25 19.869 -81 04.360 Sept 92 - Dec 04 19-166 North Marker 36 42 WWB 25 19.560 -81 00.873 Sept 92 - Dec 04 19-166 West Marker 34 43 WWB 25 17.168 -81 01.419 Sept 92 - Dec 04 19-166 Watson River Chickee 44 WWB 25 19.912 -80 59.022 Sept 92 - Dec 04 19-166 North River Mouth 45 WWB 25 18.054 -80 57.620 Sept 92 - Dec 04 19-166 Midway Keys 46 WWB 25 17.102 -80 58.548 Sept 92 - Dec 04 19-166 Roberts River Mouth 47 WWB 25 16.779 -80 55.846 Sept 92 - Dec 04 19-166 West Marker 18 48 WWB 25 14.448 -80 57.476 Sept 92 - Dec 04 19-166 Southeast Marker 12 49 WWB 25 13.704 -80 55.980 Sept 92 - Dec 04 19-166 Coot Bay 50 WWB 25 11.452 -80 54.848 Sept 92 - Dec 04 19-166

78
Station Station Name Number Area Latitude Longitude Period of Record Surveys
Chokoloskee 51 TTI 25 48.450 -81 20.970 Sept 94 - Dec 04 43-166 Rabbit Key Pass 52 TTI 25 46.200 -81 23.000 Sept 94 - Dec 04 43-166 Lopez Bay 53 TTI 25 47.050 -81 19.930 Sept 94 - Dec 04 43-166 Lopez River 54 TTI 25 47.130 -81 18.550 Sept 94 - Dec 04 43-166 Sunday Bay 55 TTI 25 47.760 -81 16.800 Sept 94 - Dec 04 43-166 Huston Bay 56 TTI 25 45.180 -81 15.330 Sept 94 - Dec 04 43-166 Upper Chatham River 57 TTI 25 43.050 -81 13.830 Sept 94 - Dec 04 43-166 Watson Place 58 TTI 25 42.470 -81 15.130 Sept 94 - Dec 04 43-166 Gun Rock Point 59 TTI 25 41.500 -81 17.920 Sept 94 - Dec 04 43-166 Huston River 60 TTI 25 43.880 -81 17.080 Sept 94 - Dec 04 43-166 Chevalier Bay 61 TTI 25 42.750 -81 12.420 Sept 94 - Dec 04 43-166 Alligator Bay 62 TTI 25 40.210 -81 10.120 Sept 94 - Dec 04 43-166 Lostmans Five Bay 63 TTI 25 38.000 -81 08.700 Sept 94 - Dec 04 43-166 Barron River 64 TTI 25 51.196 -81 23.602 Sept 94 - Dec 04 43-166 Indian Key Pass 65 TTI 25 49.631 -81 26.465 Sept 94 - Dec 04 43-166 Indian Key 66 TTI 25 48.290 -81 27.750 Sept 94 - Dec 04 43-166 West Pass 67 TTI 25 49.820 -81 30.170 Sept 94 - Dec 04 43-166 Panther Key 68 TTI 25 50.960 -81 32.530 Sept 94 - Dec 04 43-166 Faka Union Pass 69 TTI 25 52.450 -81 30.960 Sept 94 - Dec 04 43-166 Faka Union Bay 70 TTI 25 54.000 -81 30.960 Sept 94 - Dec 04 43-166 White Horse Key 71 TTI 25 52.007 -81 34.489 Sept 94 - Dec 04 43-166 Dismal Key 72 TTI 25 53.668 -81 33.532 Sept 94 - Dec 04 43-166 Long Rock 73 TTI 25 52.920 -81 36.380 Sept 94 - Dec 04 43-166 Shell Key 74 TTI 25 54.670 -81 36.920 Sept 94 - Dec 04 43-166 Blackwater River 75 TTI 25 55.788 -81 36.019 Sept 94 - Dec 04 43-166 Fakahatchee Bay 76 TTI 25 53.369 -81 28.592 Jan 02 - Dec-04 131-166Convoy Point 101 BB 25 28.700 -80 19.250 Sept 93 - Dec 04 31-166 Black Point 102 BB 25 32.750 -80 17.680 Sept 93 - Dec 04 31-166 Near Black Ledge 103 BB 25 34.400 -80 17.200 Sept 93 - Dec 04 31-166 BNP Marker C 104 BB 25 36.100 -80 13.250 Sept 93 - Dec 04 31-166 Biscayne Channel 105 BB 25 39.252 -80 11.202 Sept 93 - May 96 31-63 White Marker 106 BB 25 38.052 -80 07.800 Sept 93 - May 96 31-63 Fowey Rocks 107 BB 25 35.400 -80 06.000 Sept 93 - May 96 31-63 Marker G-1B 108 BB 25 34.150 -80 11.550 Sept 93 - Dec 04 31-166 North Midbay 109 BB 25 33.850 -80 14.100 Sept 93 - Dec 04 31-166 Fender Point 110 BB 25 30.300 -80 17.250 Sept 93 - Dec 04 31-166 Featherbed Bank 111 BB 25 30.950 -80 14.400 Sept 93 - Dec 04 31-166 Sands Cut 112 BB 25 29.300 -80 11.300 Sept 93 - Dec 04 31-166 Elliott Key 113 BB 25 26.500 -80 13.400 Sept 93 - Dec 04 31-166 Caesar Creek 114 BB 25 23.100 -80 11.502 Sept 93 - May 96 31-63 Adams Key 115 BB 25 24.252 -80 14.448 Sept 93 - May 96 31-63 Rubicon Keys 116 BB 25 24.000 -80 15.300 Sept 93 - Dec 04 31-166 Totten Key 117 BB 25 23.100 -80 15.900 Sept 93 - May 96 31-63 Broad Creek 118 BB 25 20.898 -80 15.300 Sept 93 - May 96 31-63 Pumpkin Key 119 BB 25 19.098 -80 18.198 Sept 93 - May 96 31-63 Card Bank, G-17 120 BB 25 18.852 -80 20.598 Sept 93 - May 96 31-63 North Card Sound 121 BB 25 21.300 -80 17.500 Sept 93 - Dec 04 31-166 West Arsenicker 122 BB 25 25.210 -80 18.650 Sept 93 - Dec 04 31-166 Pelican Bank 123 BB 25 26.700 -80 17.000 Sept 93 - Dec 04 31-166

79
Station Station Name Number Area Latitude Longitude Period of Record Surveys
South Midbay 124 BB 25 28.350 -80 14.000 Sept 93 - Dec 04 31-166 Turkey Point 125 BB 25 28.200 -80 16.998 Sept 93 - May 96 31-63 BNP Marker B 126 BB 25 40.300 -80 12.300 June 96 - Dec 04 64-166 Shoal Point 127 BB 25 37.800 -80 15.000 June 96 - Dec 04 64-166 Matheson Beach 128 BB 25 41.300 -80 14.000 June 96 - Dec 04 64-166 Marker G-71 129 BB 25 44.200 -80 11.100 June 96 - Dec 04 64-166 South Dodge Island 130 BB 25 45.800 -80 10.300 June 96 - Dec 04 64-166 North Venetian Basin 131 BB 25 48.000 -80 10.000 June 96 - Dec 04 64-166 North I-195 Basin 132 BB 25 49.000 -80 10.000 June 96 - Dec 04 64-166 North Normandy Isle 133 BB 25 52.000 -80 09.000 June 96 - Dec 04 64-166 Oleta River Park 134 BB 25 54.300 -80 08.000 June 96 - Dec 04 64-166 South Card Sound 135 BB 25 19.000 -80 19.000 June 96 - Dec 04 64-166 Lower Harbor Keys 351 SHELF 24 41.500 -81 47.500 May 95 - Dec 04 1-38 352 SHELF 24 46.550 -81 46.980 May 95 - Dec 04 1-38 353 SHELF 24 51.500 -81 46.600 May 95 - Dec 04 1-38 354 SHELF 24 56.480 -81 46.120 May 95 - Dec 04 1-38 355 SHELF 25 01.480 -81 45.750 May 95 - Dec 04 1-38 356 SHELF 25 06.460 -81 45.230 May 95 - Dec 04 1-38 357 SHELF 25 11.470 -81 44.720 May 95 - Dec 04 1-38 358 SHELF 25 16.480 -81 44.290 May 95 - Dec 04 1-38 359 SHELF 25 21.500 -81 43.800 May 95 - Dec 04 1-38 360 SHELF 25 26.470 -81 43.260 May 95 - Dec 04 1-38 361 SHELF 25 31.480 -81 42.900 May 95 - Dec 04 1-38 362 SHELF 25 36.520 -81 42.400 May 95 - Dec 04 1-38 Off Cape Romano 363 SHELF 25 41.520 -81 41.900 May 95 - Dec 04 1-38 364 SHELF 25 41.500 -81 32.000 May 95 - Dec 04 1-38 365 SHELF 25 36.510 -81 32.360 May 95 - Dec 04 1-38 366 SHELF 25 31.560 -81 32.930 May 95 - Dec 04 1-38 367 SHELF 25 26.550 -81 33.300 May 95 - Dec 04 1-38 368 SHELF 25 21.510 -81 33.800 May 95 - Dec 04 1-38 369 SHELF 25 16.530 -81 34.320 May 95 - Dec 04 1-38 370 SHELF 25 11.510 -81 34.750 May 95 - Dec 04 1-38 371 SHELF 25 06.500 -81 35.210 May 95 - Dec 04 1-38 372 SHELF 25 01.500 -81 35.720 May 95 - Dec 04 1-38 373 SHELF 24 56.530 -81 36.180 May 95 - Dec 04 1-38 374 SHELF 24 51.530 -81 36.650 May 95 - Dec 04 1-38 Off Johnson Key 375 SHELF 24 46.540 -81 37.070 May 95 - Dec 04 1-38 Harbor Key Bank 376 SHELF 24 50.600 -81 26.300 May 95 - Dec 04 1-38 377 SHELF 24 56.100 -81 25.900 May 95 - Dec 04 1-38 378 SHELF 25 01.000 -81 24.950 May 95 - Dec 04 1-38 379 SHELF 25 06.000 -81 24.530 May 95 - Dec 04 1-38 380 SHELF 25 11.000 -81 24.000 May 95 - Dec 04 1-38 381 SHELF 25 16.000 -81 23.700 May 95 - Dec 04 1-38 382 SHELF 25 21.000 -81 23.200 May 95 - Dec 04 1-38 383 SHELF 25 25.950 -81 22.670 May 95 - Dec 04 1-38 384 SHELF 25 30.930 -81 22.200 May 95 - Dec 04 1-38 385 SHELF 25 36.010 -81 21.790 May 95 - Dec 04 1-38 386 SHELF 25 33.330 -81 20.430 May 95 - Dec 04 1-38 387 SHELF 25 30.530 -81 19.010 May 95 - Dec 04 1-38 388 SHELF 25 25.500 -81 17.820 May 95 - Dec 04 1-38 389 SHELF 25 20.500 -81 16.620 May 95 - Dec 04 1-38

80
Station Station Name Number Area Latitude Longitude Period of Record Surveys
390 SHELF 25 15.600 -81 15.610 May 95 - Dec 04 1-38 391 SHELF 25 10.500 -81 14.320 May 95 - Dec 04 1-38 392 SHELF 25 05.500 -81 14.900 May 95 - Dec 04 1-38 393 SHELF 25 00.500 -81 15.200 May 95 - Dec 04 1-38 394 SHELF 24 55.500 -81 15.600 May 95 - Dec 04 1-38 Off Bluefish Bank 395 SHELF 24 52.700 -81 11.500 May 95 - Dec 04 1-38 Off Bullard Bank 396 SHELF 24 50.000 -81 07.700 May 95 - Dec 04 1-38 397 SHELF 24 55.000 -81 07.100 May 95 - Dec 04 1-38 398 SHELF 25 00.000 -81 06.600 May 95 - Dec 04 1-38 Off East Cape 300 SHELF 25 05.000 -81 05.960 May 95 - Dec 04 1-348 Coon Key Pass, G3 451 ROOK 25 54.626 -81 38.309 Jan 99 - Dec 04 97-166 Coon Key Light 452 ROOK 25 52.918 -81 37.954 Jan 99 - Dec 04 97-166 Fred Key, G5 453 ROOK 25 53.978 -81 41.027 Jan 99 - Dec 04 97-166 Caxambas Pass, R4 454 ROOK 25 54.360 -81 43.733 Jan 99 - Dec 04 97-166 Capri Pass, R2A 455 ROOK 25 59.285 -81 43.740 Jan 99 - Dec 04 97-166 Rt. 951 Bridge, R26 456 ROOK 25 57.737 -81 42.524 Jan 99 - Dec 04 97-166 Big Marco River, R24 457 ROOK 25 57.122 -81 41.243 Jan 99 - Dec 04 97-166 Goodland Bridge, G15 458 ROOK 25 56.080 -81 39.204 Jan 99 - Dec 04 97-166 Johnson Bay 459 ROOK 25 59.291 -81 43.748 Jan 99 - Dec 04 97-166 Hall Bay 460 ROOK 26 00.941 -81 44.566 Jan 99 - Dec 04 97-166 Rookery Bay 461 ROOK 26 01.755 -81 44.888 Jan 99 - Dec 04 97-166 First National 462 ROOK 26 02.441 -81 45.955 Jan 99 - Dec 04 97-166 Kewaydin Channel, G55 463 ROOK 26 03.611 -81 46.713 Jan 99 - Dec 04 97-166 Dollar Bay, G73 464 ROOK 26 06.000 -81 47.213 Jan 99 - Dec 04 97-166 Outer Gordon Pass, G1 465 ROOK 26 05.480 -81 48.686 Jan 99 - Dec 04 97-166 Outer Clam Pass 466 ROOK 26 22.692 -81 51.508 Jan 99 - Dec 04 97-166 Wiggins Pass Bridge 467 ROOK 26 17.441 -81 49.105 Jan 99 - Dec 04 97-166 Big Carlos Pass Bridge 468 ROOK 26 24.146 -81 52.850 Jan 99 - Dec 04 97-166 Coon Key, R2A 469 ROOK 26 25.422 -81 52.400 Jan 99 - Dec 04 97-166 Central Estero Bay, R2 470 ROOK 26 24.459 -81 51.885 Jan 99 - Dec 04 97-166 Point Ybel, R8 471 ROOK 26 27.492 -82 00.444 Jan 99 - Dec 04 97-166 San Carlos Bay, R4 472 ROOK 26 28.013 -82 02.723 Jan 99 - Dec 04 97-166 Kitchel Key, G13 473 ROOK 26 30.070 -82 00.789 Jan 99 - Dec 04 97-166 Shell Point 474 ROOK 26 31.368 -82 00.417 Jan 99 - Dec 04 97-166 Reckems Point 475 ROOK 26 32.108 -82 03.548 Jan 99 - Dec 04 97-166 Sanibel 476 ROOK 26 30.472 -82 09.113 Jan 99 - Dec 04 97-166 Pine Island Sound 477 ROOK 26 33.702 -82 09.934 Jan 99 - Dec 04 97-166 Cayo Costa 478 ROOK 26 38.150 -82 12.517 Jan 99 - Dec 04 97-166

81
Table 9.2. Statistical summary of Florida Bay water quality variables by zone.
Variable Zone Median Min. Max. n Alkaline Phosphatase FBC 1.19 0.01 6.90 671
Activity (µM hr-1) FBE 0.33 0.01 6.11 2826 FBW 0.17 0.01 4.93 969
Chlorophyll a FBC 1.58 0.11 35.61 686(µg l-1) FBE 0.49 0.00 11.35 2896
FBW 1.37 0.13 22.08 1002Surface FBC 6.3 1.5 12.2 658
Dissolved Oxygen FBE 6.6 1.4 13.4 2786(mg l-1) FBW 6.2 3.0 11.1 942Bottom FBC 6.3 2.8 12.3 689
Dissolved Oxygen FBE 6.6 0.4 11.7 2901(mg l-1) FBW 6.2 3.0 11.5 1015
Ammonium FBC 0.043 0.000 1.681 678(ppm) FBE 0.036 0.000 1.149 2889
FBW 0.009 0.000 0.342 996Nitrite FBC 0.002 0.000 0.111 683(ppm) FBE 0.002 0.000 0.037 2890
FBW 0.001 0.000 0.025 996Nitrate FBC 0.003 0.000 0.080 681(ppm) FBE 0.008 0.000 0.154 2880
FBW 0.002 0.000 0.101 991Surface Salinity FBC 33.17 11.90 63.00 654
FBE 29.00 0.20 54.30 2752 FBW 34.80 16.60 51.00 942
Bottom Salinity FBC 33.69 8.70 63.00 698 FBE 29.20 0.20 54.30 2936 FBW 35.00 16.50 52.00 1029
Silicate FBC 0.824 0.000 5.731 148(ppm) FBE 0.238 0.000 4.604 629
FBW 0.406 0.000 5.089 222Soluble Reactive FBC 0.001 0.000 0.026 681
Phosphorus (ppm) FBE 0.001 0.000 0.016 2871 FBW 0.001 0.000 0.058 989
Surface Temperature FBC 26.5 13.3 35.3 662(oC) FBE 26.4 14.3 34.6 2796
FBW 26.3 14.1 34.7 948Bottom Temperature FBC 26.6 13.3 36.7 694
(oC) FBE 26.5 14.3 34.5 2918 FBW 26.4 14.1 36.0 1023
Total Nitrogen FBC 0.986 0.188 4.408 683(ppm) FBE 0.599 0.060 3.142 2891
FBW 0.363 0.067 1.691 997Total Organic FBC 12.401 3.585 42.872 678Carbon (ppm) FBE 8.012 0.000 58.043 2879
FBW 4.838 1.199 27.370 990Total Organic FBC 0.827 0.135 4.355 676
Nitrogen (ppm) FBE 0.526 0.000 3.098 2879

82
FBW 0.342 0.046 1.680 990Variable Zone Median Min. Max. n
Total Phosphorus FBC 0.017 0.002 0.131 682(ppm) FBE 0.007 0.001 0.049 2891
FBW 0.014 0.000 0.232 998Turbidity FBC 5.85 0.12 134.85 667(NTU) FBE 2.06 0.01 172.95 2818
FBW 4.91 0.07 178.55 953

83
Table 9.3. Statistical summary of Whitewater Bay-Ten Thousand Islands water quality variables by zone.
Variable Zone Median Min. Max. n Alkaline
Phosphatase BLK 0.04 0.02 0.28 243Activity (µM hr-1) GI 0.05 0.00 3.23 1514
IW 0.10 0.00 8.31 1339 MR 0.22 0.00 3.70 1849 WB 1.16 0.00 5.96 1174
Chlorophyll a BLK 3.22 0.25 17.02 246(µg l-1) GI 2.79 0.12 23.78 1524
IW 3.45 0.19 45.11 1350 MR 2.63 0.15 28.76 1862 WB 2.67 0.11 29.78 1175
Surface BLK 5.0 0.1 9.8 246Dissolved Oxygen GI 5.6 0.2 11.8 1522
(mg l-1) IW 5.8 1.1 11.9 1350 MR 5.0 0.4 12.3 1850 WB 6.8 0.4 24.4 1168
Bottom BLK 5.2 0.3 10.3 246Dissolved Oxygen GI 5.7 1.4 12.1 1522
(mg l-1) IW 5.9 1.8 11.8 1350 MR 5.2 0.4 13.9 1851 WB 6.8 2.2 24.4 1168
Ammonium BLK 0.022 0.001 0.195 246(ppm) GI 0.011 0.000 0.183 1524
IW 0.017 0.000 0.314 1350 MR 0.017 0.000 0.402 1862 WB 0.013 0.000 0.408 1176
Nitrite BLK 0.003 0.000 0.017 246(ppm) GI 0.002 0.000 0.033 1524
IW 0.003 0.000 0.036 1350 MR 0.002 0.000 0.012 1862 WB 0.002 0.000 0.086 1176
Nitrate BLK 0.009 0.000 0.080 246(ppm) GI 0.008 0.000 0.135 1524
IW 0.010 0.000 0.133 1350 MR 0.015 0.000 0.142 1862 WB 0.005 0.000 0.268 1176
Surface Salinity BLK 31.9 1.4 39.9 246 GI 29.2 1.0 40.7 1522 IW 16.3 0.2 53.6 1350 MR 6.5 0.0 40.5 1847 WB 11.2 0.3 34.9 1168
Bottom Salinity BLK 31.8 1.4 39.9 246 GI 28.5 1.3 40.7 1524 IW 15.0 0.1 42.8 1350 MR 5.6 0.0 40.5 1859 WB 10.7 0.3 35.4 1176

84
Variable Zone Median Min. Max. n Silicate BLK 1.733 0.000 4.493 68(ppm) GI 1.513 0.000 4.705 411
IW 1.659 0.000 4.688 373 MR 2.064 0.000 6.400 475 WB 1.141 0.002 4.880 296
Soluble Reactive BLK 0.017 0.002 0.066 246Phosphorus (ppm) GI 0.006 0.000 0.044 1519
IW 0.003 0.000 0.028 1350 MR 0.002 0.000 0.034 1859 WB 0.002 0.000 0.026 1173
Surface Temperature BLK 27.0 15.9 35.9 246(oC) GI 27.0 14.9 37.2 1522
IW 27.1 15.2 33.3 1350 MR 26.6 13.6 33.3 1850 WB 26.6 11.8 33.5 1168
Bottom Temperature BLK 27.3 15.9 38.4 246(oC) GI 27.0 14.9 37.2 1522
IW 27.2 15.2 37.5 1350 MR 26.7 13.6 34.4 1851 WB 26.7 12.3 34.2 1168
Total Nitrogen BLK 0.407 0.084 1.380 245(ppm) GI 0.408 0.077 1.955 1523
IW 0.564 0.048 2.031 1350 MR 0.638 0.038 3.046 1862 WB 0.772 0.057 2.588 1176
Total Organic BLK 6.574 2.897 21.385 245Carbon (ppm) GI 6.690 1.482 27.170 1515
IW 11.078 2.112 23.348 1344 MR 12.955 0.458 64.008 1861 WB 14.811 5.615 39.373 1174
Total Organic BLK 0.358 0.074 1.313 245Nitrogen (ppm) GI 0.379 0.066 1.896 1523
IW 0.521 0.021 2.011 1350 MR 0.594 0.021 2.989 1862 WB 0.726 0.000 2.535 1176
Total Phosphorus BLK 0.053 0.014 0.237 240(ppm) GI 0.032 0.001 0.204 1516
IW 0.029 0.002 0.207 1349 MR 0.020 0.001 0.125 1861 WB 0.017 0.003 0.094 1176
Turbidity BLK 7.15 0.49 40.50 245(NTU) GI 4.94 0.42 68.00 1523
IW 4.33 0.06 66.60 1350 MR 2.67 0.09 58.65 1862 WB 3.35 0.21 107.81 1176
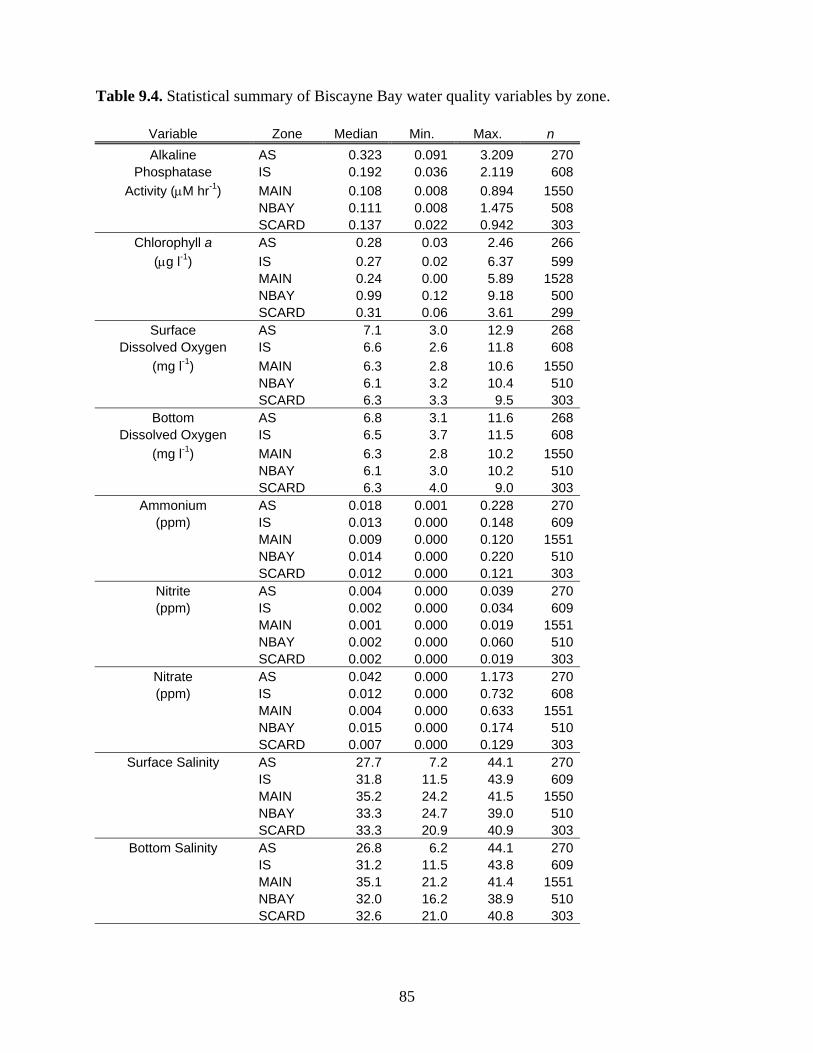
85
Table 9.4. Statistical summary of Biscayne Bay water quality variables by zone.
Variable Zone Median Min. Max. n Alkaline AS 0.323 0.091 3.209 270
Phosphatase IS 0.192 0.036 2.119 608 Activity (µM hr-1) MAIN 0.108 0.008 0.894 1550
NBAY 0.111 0.008 1.475 508 SCARD 0.137 0.022 0.942 303
Chlorophyll a AS 0.28 0.03 2.46 266 (µg l-1) IS 0.27 0.02 6.37 599
MAIN 0.24 0.00 5.89 1528 NBAY 0.99 0.12 9.18 500 SCARD 0.31 0.06 3.61 299
Surface AS 7.1 3.0 12.9 268 Dissolved Oxygen IS 6.6 2.6 11.8 608
(mg l-1) MAIN 6.3 2.8 10.6 1550 NBAY 6.1 3.2 10.4 510 SCARD 6.3 3.3 9.5 303
Bottom AS 6.8 3.1 11.6 268 Dissolved Oxygen IS 6.5 3.7 11.5 608
(mg l-1) MAIN 6.3 2.8 10.2 1550 NBAY 6.1 3.0 10.2 510 SCARD 6.3 4.0 9.0 303
Ammonium AS 0.018 0.001 0.228 270 (ppm) IS 0.013 0.000 0.148 609
MAIN 0.009 0.000 0.120 1551 NBAY 0.014 0.000 0.220 510 SCARD 0.012 0.000 0.121 303
Nitrite AS 0.004 0.000 0.039 270 (ppm) IS 0.002 0.000 0.034 609
MAIN 0.001 0.000 0.019 1551 NBAY 0.002 0.000 0.060 510 SCARD 0.002 0.000 0.019 303
Nitrate AS 0.042 0.000 1.173 270 (ppm) IS 0.012 0.000 0.732 608
MAIN 0.004 0.000 0.633 1551 NBAY 0.015 0.000 0.174 510 SCARD 0.007 0.000 0.129 303
Surface Salinity AS 27.7 7.2 44.1 270 IS 31.8 11.5 43.9 609 MAIN 35.2 24.2 41.5 1550 NBAY 33.3 24.7 39.0 510 SCARD 33.3 20.9 40.9 303
Bottom Salinity AS 26.8 6.2 44.1 270 IS 31.2 11.5 43.8 609 MAIN 35.1 21.2 41.4 1551 NBAY 32.0 16.2 38.9 510 SCARD 32.6 21.0 40.8 303

86
Variable Zone Median Min. Max. n Silicate AS 0.186 0.000 1.972 68 (ppm) IS 0.080 0.000 1.268 170
MAIN 0.028 0.000 0.720 374 NBAY 0.196 0.001 1.287 170 SCARD 0.031 0.000 0.270 68
Soluble Reactive AS 0.001 0.000 0.010 269 Phosphorus (ppm) IS 0.001 0.000 0.009 605
MAIN 0.001 0.000 0.009 1544 NBAY 0.001 0.000 0.021 506 SCARD 0.001 0.000 0.008 301
Surface Temperature AS 26.9 10.3 33.2 270 (oC) IS 26.6 14.2 33.4 609
MAIN 26.3 13.5 32.5 1551 NBAY 25.8 14.5 32.9 510 SCARD 26.7 15.8 33.8 303
Bottom Temperature AS 26.9 10.2 33.0 270 (oC) IS 26.6 14.2 33.3 609
MAIN 26.3 13.5 32.8 1551 NBAY 26.1 14.3 32.5 510 SCARD 26.6 15.9 32.5 303
Total Nitrogen AS 0.476 0.101 1.560 270 (ppm) IS 0.324 0.048 1.026 607
MAIN 0.224 0.043 1.313 1551 NBAY 0.258 0.047 0.847 510 SCARD 0.305 0.055 1.325 303
Total Organic AS 4.571 1.379 9.330 270 Carbon (ppm) IS 3.678 1.463 9.415 608
MAIN 2.641 0.326 11.982 1551 NBAY 3.408 1.231 10.690 509 SCARD 3.798 1.875 8.872 302
Total Organic AS 0.344 0.000 1.010 270 Nitrogen (ppm) IS 0.278 0.016 0.877 607
MAIN 0.200 0.031 1.288 1551 NBAY 0.213 0.032 0.823 510 SCARD 0.274 0.030 1.229 303
Total Phosphorus AS 0.006 0.000 0.037 270 (ppm) IS 0.005 0.001 0.040 607
MAIN 0.005 0.000 0.049 1551 NBAY 0.009 0.002 0.038 509 SCARD 0.005 0.002 0.030 303
Turbidity AS 0.50 0.05 11.53 270 (NTU) IS 0.47 0.00 3.75 608
MAIN 0.75 0.00 19.00 1550 NBAY 1.13 0.01 22.35 510 SCARD 0.50 0.00 3.80 303

87
Table 9.5. Statistical summary of Southwest Florida Shelf water quality variables by zone.
Variable Zone Median Min. Max. n Alkaline SHARK 0.055 0.016 2.485 69
Phosphatase SHELF 0.042 0.004 12.017 1364Activity (µM hr-1) SHOAL 0.046 0.006 7.627 241
Chlorophyll a SHARK 1.608 0.254 8.910 76(µg l-1) SHELF 0.913 0.000 13.791 1512
SHOAL 0.922 0.229 6.560 265Surface SHARK 5.6 2.8 8.6 46
Dissolved Oxygen SHELF 5.9 1.7 13.0 922(mg l-1) SHOAL 5.9 2.6 9.7 164Bottom SHARK 6.1 2.4 8.6 75
Dissolved Oxygen SHELF 6.2 1.0 12.6 1490(mg l-1) SHOAL 6.1 0.9 12.8 263
Ammonium SHARK 0.006 0.001 0.049 76(ppm) SHELF 0.004 0.000 0.129 1512
SHOAL 0.004 0.000 0.064 265Nitrite SHARK 0.001 0.000 0.006 76(ppm) SHELF 0.000 0.000 0.008 1512
SHOAL 0.000 0.000 0.005 265Nitrate SHARK 0.002 0.000 0.072 76(ppm) SHELF 0.001 0.000 0.078 1512
SHOAL 0.001 0.000 0.022 265Surface Salinity SHARK 34.8 26.0 40.7 46
SHELF 35.9 27.8 40.1 928 SHOAL 35.9 31.0 39.2 164
Bottom Salinity SHARK 34.7 24.4 40.7 75 SHELF 35.6 27.0 40.1 1496 SHOAL 35.6 27.9 38.8 263
Silicate SHARK 0.424 0.000 1.199 69(ppm) SHELF 0.069 0.000 2.238 1425
SHOAL 0.041 0.000 1.698 250Soluble Reactive SHARK 0.001 0.000 0.006 76
Phosphorus (ppm) SHELF 0.001 0.000 0.014 1512 SHOAL 0.001 0.000 0.008 265
Surface SHARK 25.1 14.8 31.4 46Temperature SHELF 25.5 14.7 31.9 928
(oC) SHOAL 25.8 15.2 32.0 164Bottom SHARK 26.3 14.8 32.1 75
Temperature SHELF 26.4 14.7 32.7 1496(oC) SHOAL 26.4 15.2 32.3 263
Total Nitrogen SHARK 0.271 0.073 0.967 75(ppm) SHELF 0.213 0.027 1.028 1504
SHOAL 0.219 0.023 1.043 265Total Organic SHARK 3.810 1.970 5.812 75Carbon (ppm) SHELF 2.588 1.164 16.708 1509
SHOAL 2.560 1.130 5.864 265

88
Variable Zone Median Min. Max. n Total Organic SHARK 0.257 0.065 0.957 75
Nitrogen (ppm) SHELF 0.205 0.023 1.021 1504 SHOAL 0.210 0.020 1.040 265
Total Phosphorus SHARK 0.015 0.004 0.079 76(ppm) SHELF 0.012 0.000 0.190 1512
SHOAL 0.012 0.003 0.038 265Turbidity SHARK 6.23 1.00 66.25 72(NTU) SHELF 2.04 0.00 45.05 1432
SHOAL 2.78 0.21 20.70 250

89
Table 9.6. Statistical summary of Cape Romano-Pine Island Sound water quality variables by zone.
Variable Zone Median Min. Max. n Alkaline COCO 0.05 0.02 0.30 70
Phosphatase EST 0.05 0.01 0.22 288Activity (µM hr-1) MARC 0.04 0.01 0.29 575
NPL 0.04 0.02 0.31 216 PIS 0.04 0.02 0.17 216 RB 0.04 0.01 0.44 323 SCB 0.04 0.01 0.19 360
Chlorophyll a COCO 4.32 0.63 17.36 70(µg l-1) EST 3.80 0.41 24.68 283
MARC 4.35 0.38 20.85 567 NPL 2.87 0.44 18.22 213 PIS 3.19 0.49 21.76 213 RB 3.86 0.67 28.30 318 SCB 2.81 0.53 28.47 355
Surface COCO 5.4 1.8 6.4 13Dissolved Oxygen EST 5.8 2.0 9.2 288
(mg l-1) MARC 5.9 2.8 14.8 575 NPL 5.7 2.1 11.7 216 PIS 6.3 1.0 9.8 216 RB 5.6 1.3 12.9 311 SCB 6.2 3.0 10.4 360
Bottom COCO 4.9 2.6 7.2 71Dissolved Oxygen EST 6.1 2.8 9.4 288
(mg l-1) MARC 6.1 2.8 13.2 575 NPL 5.8 2.3 11.5 216 PIS 6.5 3.9 10.1 216 RB 5.7 2.7 10.0 323 SCB 6.4 3.1 11.1 360
Ammonium COCO 0.046 0.001 0.217 69(ppm) EST 0.007 0.000 0.126 288
MARC 0.005 0.000 0.194 575 NPL 0.007 0.000 0.170 216 PIS 0.005 0.000 0.173 216 RB 0.007 0.000 0.239 323 SCB 0.009 0.000 0.184 357
Nitrite COCO 0.002 0.000 0.015 70(ppm) EST 0.001 0.000 0.006 288
MARC 0.001 0.000 0.010 575 NPL 0.001 0.000 0.009 216 PIS 0.001 0.000 0.023 216 RB 0.001 0.000 0.009 323 SCB 0.001 0.000 0.024 360

90
Variable Zone Median Min. Max. n Nitrate COCO 0.013 0.000 0.134 70(ppm) EST 0.003 0.000 0.038 288
MARC 0.002 0.000 0.052 575 NPL 0.003 0.000 0.079 216 PIS 0.002 0.000 0.073 216 RB 0.003 0.000 0.034 323 SCB 0.006 0.000 0.424 360
Surface Salinity COCO 33.3 10.1 38.3 13 EST 33.7 18.6 38.3 288 MARC 34.5 21.6 40.7 575 NPL 34.4 17.4 41.5 216 PIS 33.8 18.3 38.6 216 RB 34.2 14.2 40.5 310 SCB 30.8 2.1 37.9 360
Bottom Salinity COCO 29.7 0.0 37.1 71 EST 33.7 14.8 38.5 288 MARC 34.4 15.5 40.6 575 NPL 34.2 17.9 41.4 216 PIS 33.6 18.0 38.5 216 RB 34.1 13.2 39.9 322 SCB 28.9 1.9 38.0 360
Silicate COCO 0.825 0.166 2.923 23(ppm) EST 0.609 0.033 2.476 96
MARC 0.605 0.003 3.488 191 NPL 0.533 0.006 1.988 72 PIS 0.374 0.000 1.612 72 RB 0.668 0.014 2.419 107 SCB 0.821 0.045 4.175 120
Soluble Reactive COCO 0.011 0.000 0.052 70Phosphorus (ppm) EST 0.005 0.000 0.026 288
MARC 0.004 0.000 0.032 575 NPL 0.005 0.000 0.034 216 PIS 0.004 0.000 0.153 216 RB 0.004 0.000 0.026 323 SCB 0.012 0.000 0.122 357
Surface COCO 28.7 21.5 32.7 13Temperature EST 25.8 15.7 32.0 288
(oC) MARC 26.1 12.7 32.5 575 NPL 26.1 15.4 32.0 216
PIS 25.1 14.3 33.0 216 RB 26.5 15.1 33.5 311 SCB 25.4 14.9 34.5 360
Bottom COCO 26.3 17.7 32.8 71Temperature EST 25.8 15.7 32.2 288
(oC) MARC 26.1 14.8 32.6 575 NPL 26.0 15.8 32.1 216 PIS 25.2 14.2 32.0 216 RB 26.6 15.1 33.6 323 SCB 25.4 15.0 32.4 360
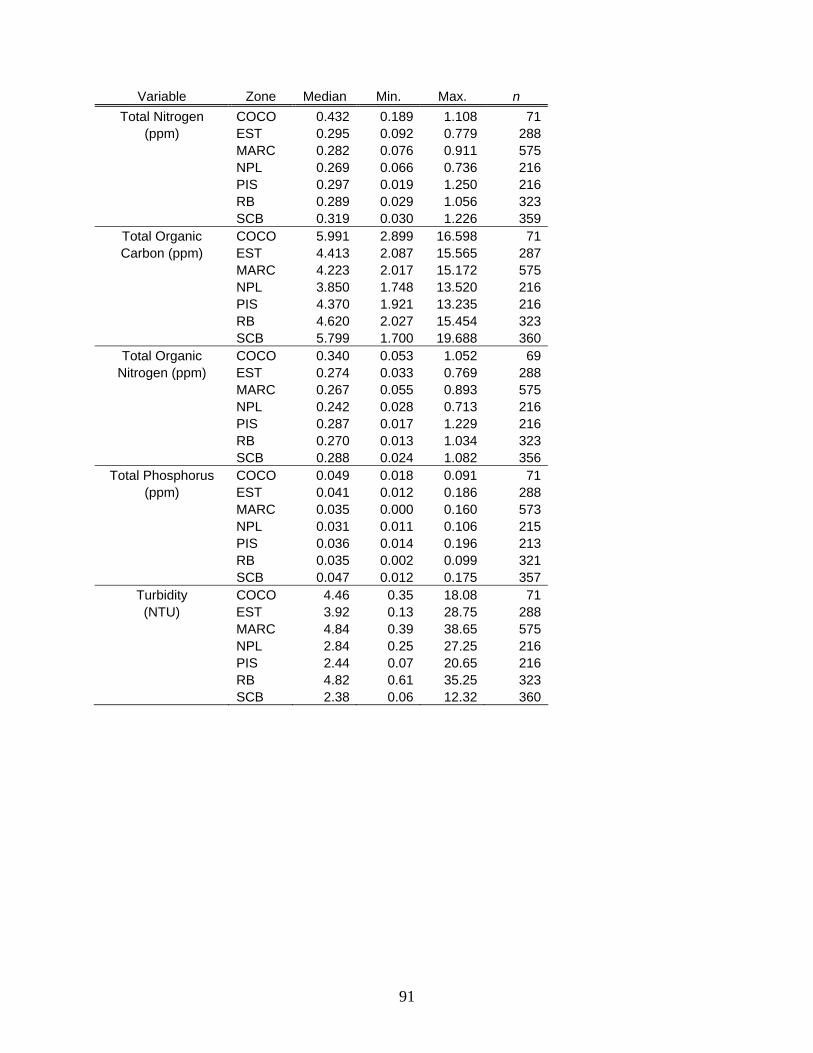
91
Variable Zone Median Min. Max. n Total Nitrogen COCO 0.432 0.189 1.108 71
(ppm) EST 0.295 0.092 0.779 288 MARC 0.282 0.076 0.911 575 NPL 0.269 0.066 0.736 216 PIS 0.297 0.019 1.250 216 RB 0.289 0.029 1.056 323 SCB 0.319 0.030 1.226 359
Total Organic COCO 5.991 2.899 16.598 71Carbon (ppm) EST 4.413 2.087 15.565 287
MARC 4.223 2.017 15.172 575 NPL 3.850 1.748 13.520 216 PIS 4.370 1.921 13.235 216 RB 4.620 2.027 15.454 323 SCB 5.799 1.700 19.688 360
Total Organic COCO 0.340 0.053 1.052 69Nitrogen (ppm) EST 0.274 0.033 0.769 288
MARC 0.267 0.055 0.893 575 NPL 0.242 0.028 0.713 216 PIS 0.287 0.017 1.229 216 RB 0.270 0.013 1.034 323 SCB 0.288 0.024 1.082 356
Total Phosphorus COCO 0.049 0.018 0.091 71(ppm) EST 0.041 0.012 0.186 288
MARC 0.035 0.000 0.160 573 NPL 0.031 0.011 0.106 215 PIS 0.036 0.014 0.196 213 RB 0.035 0.002 0.099 321 SCB 0.047 0.012 0.175 357
Turbidity COCO 4.46 0.35 18.08 71(NTU) EST 3.92 0.13 28.75 288
MARC 4.84 0.39 38.65 575 NPL 2.84 0.25 27.25 216
PIS 2.44 0.07 20.65 216 RB 4.82 0.61 35.25 323 SCB 2.38 0.06 12.32 360