glic: coastal monitoring water quality sops sample ... · glic: coastal monitoring water quality...
TRANSCRIPT
i
GLIC: Coastal Monitoring Water Quality SOPs
The following sections describe protocols to be used for field water quality measurements, water sampling, and water sample processing. Standard Operating Procedures (SOPs) will follow the Protocols developed by NRRI-UMD for the National Park Service’s Great Lakes Network (Elias et al. 2008; see below). Relevant sections applicable to shallow water systems were extracted from this document and are reproduced below. Sample collection locations: Chemical/physical measurements will be made in each vegetation type where fish and macroinvertebrate data are collected. Fish and macroinvertebrates are collected by vegetation zone; water quality should be collected in association with fyke nets, one water quality sample per vegetation zone. In the event that fyke nets are not set due to very shallow depth, but invertebrates are collected, then a water quality sample should also be collected from that zone. These samples are required. Crews have the option of taking water quality meter samples at each individual fyke net location (or invertebrate dip net replicate point if fyke nets are not set in that zone). This additional sampling effort is recommended if vegetation patches forming the zone are separated rather than contiguous. Water quality data collection is critical at each wetland, but parameters will be classified as critical, recommended, or supplementary on an individual parameter-by-parameter basis in this section. Defining parameters as "critical" does not mean that biological samples should not be taken at a site if water quality parameters cannot be taken because, for example, the DO sensor on the meter is malfunctioning. Every attempt should be made to get critical measurements, including borrowing equipment from a nearby field crew and obtaining a replacement meter as soon as possible. We also define water quality parameters in terms of 1) field measurements using instruments with sensors used at the site, 2) parameters requiring analysis of a water sample either the evening or the day after the sample was collected, or 3) parameters measured at one of our project water quality laboratories. Critical:
Field: temperature, dissolved oxygen, pH, specific conductivity Lab: alkalinity, turbidity, soluble reactive phosphorus (SRP), [nitrate+nitrite]-nitrogen,
ammonium-nitrogen, chlorophyll-a Recommended:
Field: transparency tube clarity Lab: total nitrogen (TN), total phosphorus (TP), chloride, color
Supplementary:
Field: oxidation-reduction potential (redox), in situ chlorophyll fluorescence Lab: Sediment percent organic matter
In general, two or three vegetation zones will be sampled by fish and macroinvertebrate crews in each wetland, although four zones are possible. The basic water quality sampling design is based primarily on the placement of three fyke nets within each vegetation zone at a site. If fyke nets
ii
cannot be set in a zone, then macroinvertebrate sampling points will be used instead as water quality sampling locations. Water quality data will be collected from fyke net or macroinvertebrate locations as follows:
Field: critical, recommended, and supplementary measurements will be made at the first net set location within each vegetation zone. It is recommended that water quality measurements be made at each net set within the zone, but only one location is required.
Lab: water will be collected from each of the fyke net locations within a vegetation zone
and combined to form a single composite sample, which will be analyzed for critical and recommended water quality parameters.
iii
Contents6.0INTRODUCTION.......................................................................................................................................................................................96.0.1CoreSuiteofWaterQualityVariables........................................................................................................................................96.0.2AdvancedSuiteofWaterQualityVariables..............................................................................................................................96.1.2AdditionalEquipment,Supplies,Forms,etc............................................................................................................................96.2OVERVIEWOFFIELDWORK............................................................................................................................................................106.2.1SequenceofActivitiesduringFieldWorkday.......................................................................................................................106.2.2RecordingFieldInformationUponArrivalatMonitoringSite......................................................................................116.2.3PreventingContamination.............................................................................................................................................................126.2.5BottlePreparation–TypesandSizesofBottles..................................................................................................................126.3FIELDMEASUREMENTPROCEDURES.........................................................................................................................................126.3.2StabilizationofSensorProbeReadings...................................................................................................................................136.3.4DetailedDescriptionandTroubleshootingHintsforFieldVariables........................................................................146.3.4.1Temperature...............................................................................................................................................................................146.3.4.2SpecificConductivity...............................................................................................................................................................146.3.4.3HydrogenIonActivity(pH)..................................................................................................................................................156.3.4.4DissolvedOxygen......................................................................................................................................................................156.3.4.6Clarity.............................................................................................................................................................................................16
6.4WATERSAMPLECOLLECTION........................................................................................................................................................176.4.1IntegratedSampling.........................................................................................................................................................................176.4.3DistributingSampleWaterfromtheCompositingJugs....................................................................................................176.4.4SampleHandlingWhileintheField...........................................................................................................................................176.4.5QualityAssuranceofFieldDuplicates......................................................................................................................................176.5DEPARTUREFROMMONITORINGSITE......................................................................................................................................186.6QUALITYASSURANCE/QUALITYCONTROL(QA/QC)..........................................................................................................186.6.1CalibrationofFieldInstrumentSensors..................................................................................................................................186.6.1.1InstrumentCalibrationandMaintenanceLogbooks.................................................................................................186.6.1.2HandlingofCalibrationStandardSolutions.................................................................................................................216.6.1.3Temperature...............................................................................................................................................................................216.6.1.4SpecificConductivity...............................................................................................................................................................216.6.1.5pH.....................................................................................................................................................................................................216.6.1.6DissolvedOxygen......................................................................................................................................................................226.6.1.7Depth..............................................................................................................................................................................................226.6.1.8Post‐FieldCalibrationChecks..............................................................................................................................................226.6.1.9SensorMaintenanceandStorage.......................................................................................................................................236.6.3.2SamplingDuplicates................................................................................................................................................................23
6.6.4SummaryofQualityAssurance/QualityControlFieldProcedures.............................................................................246.8LITERATURECITED.............................................................................................................................................................................267.0INTRODUCTION.....................................................................................................................................................................................297.1SUMMARYOFANALYTICALMETHODS......................................................................................................................................297.2SAMPLEHANDLINGANDPROCESSINGPROCEDURES........................................................................................................297.2.1TotalChlorophyll‐a...........................................................................................................................................................................307.2.2Unfiltered(Raw)Samples..............................................................................................................................................................317.2.3FilteredSamples.................................................................................................................................................................................317.3SHIPPINGPROCEDURES....................................................................................................................................................................317.4QUALITYASSURANCE/QUALITYCONTROL.............................................................................................................................327.6LITERATURECITED.............................................................................................................................................................................32
iv
National Park Service U.S. Department of the Interior Natural Resource Program Center
Water Quality Monitoring Protocol for Inland Lakes
Great Lakes Inventory and Monitoring Network
Version 1.0
Natural Resource Technical Report NPS/GLKN/NRTR-2008/109 Joan Elias National Park Service Great Lakes Inventory and Monitoring Network 2800 Lake Shore Drive East Ashland, Wisconsin 54806 [email protected]
and
Richard Axler and Elaine Ruzycki Center for Water and the Environment Natural Resources Research Institute University of Minnesota Duluth 5013 Miller Trunk Highway Duluth, Minnesota 55811-1442 June 2008 U.S. Department of the Interior
v
National Park Service Natural Resource Program Center Fort Collins, Colorado
The Natural Resource Publication series addresses natural resource topics that are of interest and applicability to a broad readership in the National Park Service and to others in the management of natural resources, including the scientific community, the public, and the NPS conservation and environmental constituencies. Manuscripts are peer-reviewed to ensure that the information is scientifically credible, technically accurate, appropriately written for the intended audience, and is designed and published in a professional manner.
The Natural Resources Technical Reports series is used to disseminate the peer-reviewed results of scientific studies in the physical, biological, and social sciences for both the advancement of science and the achievement of the National Park Service’s mission. The reports provide contributors with a forum for displaying comprehensive data that are often deleted from journals because of page limitations. Current examples of such reports include the results of research that addresses natural resource management issues; natural resource inventory and monitoring activities; resource assessment reports; scientific literature reviews; and peer reviewed proceedings of technical workshops, conferences, or symposia.
Views, statements, findings, conclusions, recommendations and data in this report are solely those of the author(s) and do not necessarily reflect views and policies of the U.S. Department of the Interior, NPS. Mention of trade names or commercial products does not constitute endorsement or recommendation for use by the National Park Service.
Printed copies of reports in these series may be produced in a limited quantity and they are only available as long as the supply lasts. This report is also available from the Natural Resource Publications Management website (http://www.nature.nps.gov/publications/NRPM) on the Internet or by sending a request to the address on the back cover.
Please cite this publication as: Elias, J. E, R. Axler, and E. Ruzycki. 2008. Water quality monitoring protocol for inland lakes. Version 1.0. National Park Service, Great Lakes Inventory and Monitoring Network. Natural Resources Technical Report NPS/GLKN/NRTR—2008/109. National Park Service, Fort Collins, Colorado. NPS D-77, June 2008
vi
Note: The Inland Lakes Water Quality Monitoring Protocol consists of the following: 1. Protocol Narrative 2. Standard Operating Procedures SOP #1: Pre-season Preparation SOP #2: Training and Safety SOP #3: Using the GPS SOP #4: Measuring Water Level SOP #5: Decontamination of Equipment to Remove Exotic Species SOP #6: Field Measurements and Water Sample Collection SOP #7: Processing Water Samples and Analytical Laboratory Requirements SOP #8: Data Entry and Management SOP #9: Data Analysis SOP #10: Reporting SOP #11: Post- Season Procedures SOP #12: Quality Assurance/Quality Control SOP #13: Procedure for Revising the Protocol
vii
Standard Operating Procedure #6: Field Measurements and Water Sample Collection Version 1.1 In Water Quality Monitoring Protocol for Inland Lakes Prepared by Richard Axler and Elaine Ruzycki Center for Water and the Environment Natural Resources Research Institute University of Minnesota-Duluth 5013 Miller Trunk Highway Duluth, Minnesota 55811 and Joan Elias (contact author) National Park Service Great Lakes Inventory and Monitoring Network 2800 Lake Shore Drive East Ashland, Wisconsin 54559 [email protected] March 2010 Suggested citation: Axler, R., E. Ruzycki, and J.E. Elias. 2010. Standard operating procedure #6, Field measurements and water sample collection, Version 1.1. in Elias, J.E., R. Axler, and E. Ruzycki. 2008. Water quality monitoring protocol for inland lakes, Version 1.0. National Park Service, Great Lakes Network, Ashland, Wisconsin. NPS/MWR/GLKN/NRTR—2008/109. National Park Service, Fort Collins, Colorado.
viii
Acknowledgements
Combinations of existing protocols were used to develop this standard operating procedure for measuring the required water quality field parameters for the Great Lakes Network (GLKN). We consulted protocols written for the EPA (Baker et al. 1997), USGS (Hoffman et al. 2005, USGS 2005), and this and other NPS networks (Magdalene et al. 2007; O’Ney 2005); an on-line curriculum for monitoring water quality (WOW 2004); and NPS internal documents (Irwin 2006, 2004; Penoyer 2003; and the WRD website [http://www.nature.nps.gov/water/VitalSignsGuidance.cfm]). We wish to acknowledge these sources and thank them for the valuable contribution that they have made to this document.
9
6.0 Introduction
Field measurements should represent, as closely as possible, the natural condition of the surface water at the time of sampling. Experience with and knowledge of the sampling equipment and the collection, storage, and processing of water samples for subsequent laboratory analyses are critical for collecting data of high quality. To ensure consistent, high-quality data, always:
・Make field measurements only with calibrated instruments that have been error-checked.
・Maintain a permanent log book for each field instrument for recording calibrations and repairs.
Review the log book before leaving for the field. This book should also be used for recording results of pre-and post-calibration checks as well as housing copies of results from alternate measurement sensitivity (AMS) checks, if applicable.
・Test each instrument (meters and sensors) before leaving for the field. Become familiar with
new instruments and new measurement techniques before collecting data.
・Have backup instruments readily available and in good working condition, whenever possible.
・Follow quality assurance/quality control procedures. Such protocols are mandatory for every
data collection effort, and include practicing good field procedures and implementing quality-control checks. Make field measurements in a manner to minimize artifacts that can bias the result.
6.0.1 Core Suite of Water Quality Variables The core field variables are temperature, specific conductance, pH, water level, and dissolved oxygen. To this mandated suite, add a measure of water clarity. Water clarity will be measured with a transparency tube.
6.0.2 Advanced Suite of Water Quality Variables The advanced suite variables consist of total phosphorus, total nitrogen, nitrate+nitrite-nitrogen, ammonia-nitrogen, chloride, alkalinity, and total chlorophyll-a. The methods for collecting water samples for these variables are described in Section 6.5.
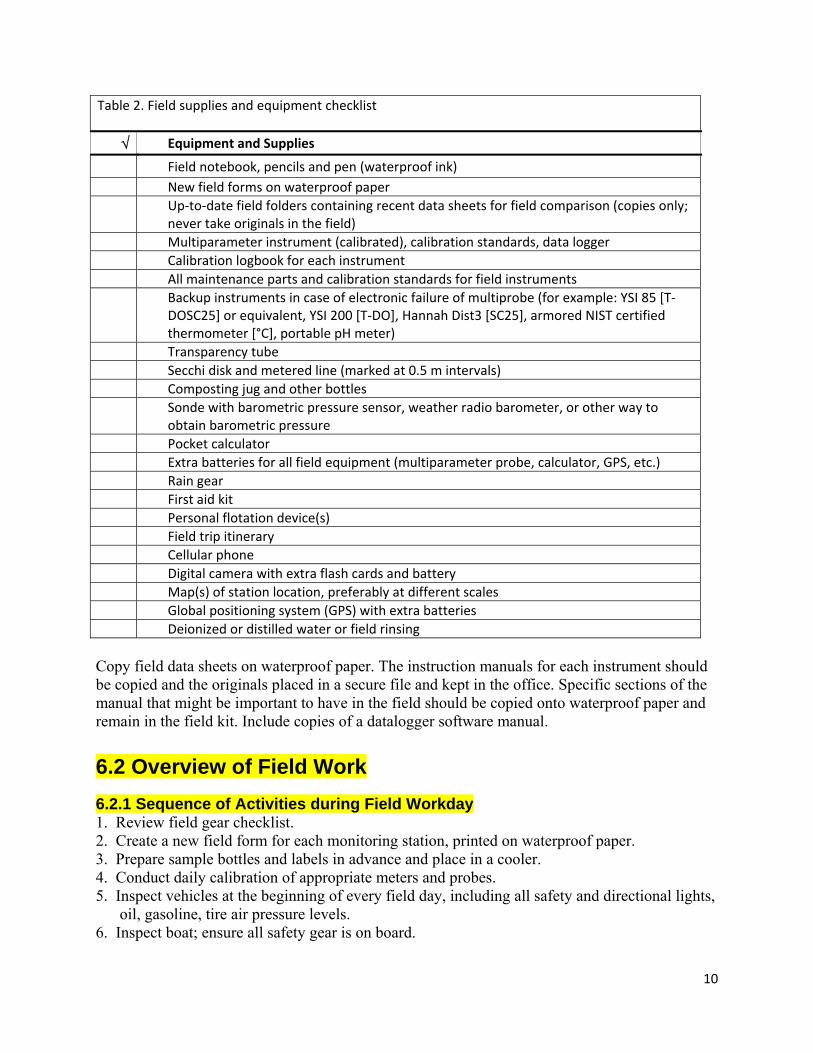
6.1.2 Additional Equipment, Supplies, Forms, etc. Refer to the checklist of supplies and equipment needed for field sampling (Table 2) prior to each sampling trip. Keep on hand all necessary forms, calibration logbooks, field logbooks, field data sheets, procedural manuals, and equipment instructional manuals.
10
Table 2. Field supplies and equipment checklist
Equipment and Supplies
Field notebook, pencils and pen (waterproof ink)
New field forms on waterproof paper
Up‐to‐date field folders containing recent data sheets for field comparison (copies only; never take originals in the field)
Multiparameter instrument (calibrated), calibration standards, data logger
Calibration logbook for each instrument
All maintenance parts and calibration standards for field instruments
Backup instruments in case of electronic failure of multiprobe (for example: YSI 85 [T‐DOSC25] or equivalent, YSI 200 [T‐DO], Hannah Dist3 [SC25], armored NIST certified thermometer [°C], portable pH meter)
Transparency tube
Secchi disk and metered line (marked at 0.5 m intervals)
Composting jug and other bottles
Sonde with barometric pressure sensor, weather radio barometer, or other way to obtain barometric pressure
Pocket calculator
Extra batteries for all field equipment (multiparameter probe, calculator, GPS, etc.)
Rain gear
First aid kit
Personal flotation device(s)
Field trip itinerary
Cellular phone
Digital camera with extra flash cards and battery
Map(s) of station location, preferably at different scales
Global positioning system (GPS) with extra batteries
Deionized or distilled water or field rinsing
Copy field data sheets on waterproof paper. The instruction manuals for each instrument should be copied and the originals placed in a secure file and kept in the office. Specific sections of the manual that might be important to have in the field should be copied onto waterproof paper and remain in the field kit. Include copies of a datalogger software manual.
6.2 Overview of Field Work
6.2.1 Sequence of Activities during Field Workday 1. Review field gear checklist. 2. Create a new field form for each monitoring station, printed on waterproof paper. 3. Prepare sample bottles and labels in advance and place in a cooler. 4. Conduct daily calibration of appropriate meters and probes. 5. Inspect vehicles at the beginning of every field day, including all safety and directional lights,
oil, gasoline, tire air pressure levels. 6. Inspect boat; ensure all safety gear is on board.
11
7. Drive to boat landing or portage boat into lake to be sampled. Load boat with sampling gear, launch boat, and navigate to monitoring site. Set up a clean work space on the boat for sampling.
8. Refer to description of monitoring station location, directions, maps, and photo to verify correct location. Verify coordinates on GPS unit.
9. Measure field water quality variables per Section 6.4 and collect samples per Section 6.5. 10. Be sure that all samples are correctly labeled and preserved on ice. 11. Locate benchmark and record measurements of water level as detailed in SOP #4. 12. Verify that field form is completely filled out, and initial the form. 13. If sampling from more than one monitoring station in a day, follow procedures for
decontamination of equipment per SOP #5, and go back to step 6, above. 14. Upon return to shore, inspect boat, trailer, and all equipment that has come into contact with
the water for invasive species. 15. Return to office or field station. 16. Process samples according to SOP #7. Refrigerate or freeze samples, as required and package
samples for sending to analytical laboratory. 17. Clean sampling equipment per SOP #7. Rinse sensors with deionized water and perform
calibration re-checks. 18. As soon as possible after returning from the field, review both hardcopy and multiprobe data;
offload multiprobe data onto computer; review laboratory data as it is received.
6.2.2 Recording Field Information Upon Arrival at Monitoring Site Consistent methods are important to long-term data quality. In actuality, the ideal conditions are not always met in the field or in the lab and changes in staff occur. Therefore, documentation of procedures, site conditions, laboratory analysis, and reasons for deviations of any kind is important. Personnel are encouraged to write down more than they feel may be necessary in the moment, as the future interpretation of their data will depend on the written record and not the memory of an individual. Waterproof field forms (copy available in the attachments) should be prepared ahead of time labeled with the project and station IDs. Field sampling forms are used to record the physical and chemical water quality variables measured at the time of sample collection. In addition to recording the field variables, any samples collected for laboratory analyses must be so indicated. Documentation should include calibration data for each instrument, field conditions at the time of sample collection, visual observations, and other information that might prove useful in interpreting these data in the future. While at each monitoring site, the information recorded on field sampling forms should include:
・ Date
・ Time of arrival
・ Names of field team members
・ GPS coordinates, to verify location
・ Current weather (air temperature and wind speed) and relevant notes about recent weather
(storms or drought), including days since last significant precipitation
・ Observations of water quality conditions (see below)
12
・ Multiparameter meter (model), calibration date, and field measurements of core suite
variables
・ List of sample IDs and collection times for advanced suite variables or quality assurance
samples
・ Whether any samples were not collected, and reason
・ Quality assurance/quality control procedures followed
・ Time of departure
Upon arrival at the monitoring station, record visual observations of water quality conditions that will be useful in interpreting water quality data.
・ Water appearance — General observations on water may include color, unusual amount of
suspended matter, debris, or foam.
・ Biological activity — Excessive macrophyte, phytoplankton, or periphyton growth. The
observation of water color and excessive algal growth is important in explaining high chlorophyll-a values. Other observations to note include types of fish, birds, or spawning fish.
・ Unusual odors — Examples include hydrogen sulfide, mustiness, sewage, petroleum,
chemicals, or chlorine.
・ Watershed activities — Activities or events that are impacting water quality; for example,
road construction, timber harvest, shoreline mowing, or livestock watering.
6.2.3 Preventing Contamination Field technicians should be aware of and record potential sources of contamination at each field site. Decontaminate field sampling equipment for minimizing the risk of spreading invasive species. Clean field and laboratory equipment to avoid contamination of analytes to be measured. Do not allow sample water to touch hands; do not touch insides of sampling equipment, containers, or laboratory bottles.
6.2.5 Bottle Preparation – Types and Sizes of Bottles For each monitoring station, select the bottles appropriate for each analyte and label them with Station ID, sample date, and analyte code according to the requirements of the contact analytical laboratory. Store pre-labeled bottles in a dry box or in separate bags for each station.
6.3 Field Measurement Procedures
For all sampling, it is critical to avoid sampling water showing evidence of oil, gasoline or anything else from the boat motor. It is best to turn off the engine and set the anchor, although this may not be possible or advisable in bad weather or with a balky engine. After setting anchor, allow surface water to clear of disturbances. Collect samples on the upwind side of the boat, to minimize contamination and disturbance. Avoid surfactants, floating debris, and turbid aeration during sample collection. Discard rinse water or excess sampling water on the downwind side of the boat.

13
6.3.2 Stabilization of Sensor Probe Readings Before making field measurements, properly-calibrated sensors must be allowed to equilibrate to the condition of the water being monitored. Sensors have equilibrated adequately when instrument readings have stabilized, that is, when the variability among measurements does not exceed an established criterion.
Table3.Recommendedinstrumentstabilizationcriteriaforrecordingfieldmeasurements.
StandardDirectFieldMeasurement
StabilizationCriteria(O’Ney2005)
StabilizationCriteriaInsituMultisensors
(WOW2005)Temperature:ThermistorthermometerLiquid‐in‐glassthermometer
±0.2°C±0.5°C
±0.2°C(5%)
Specificconductivity(SC25)When≤100μS/cmWhen>100μS/cm
±5%±3%
<5uS/cm(10%)
pH:Meterdisplaysto0.01 ±0.1unit ±0.2uni(10%)
Dissolvedoxygen:Amperometric(sameaspolarigraphic)method
±0.3mg/L±2%
±0.5mg/L(10%)
6.3.3 Outline of Water Profile Measurements
Acquiring high quality results requires the use of consistent measurement methods. Adhere to the following guidelines: 1. Wait for the DO value to stabilize first, record the value, then read the other
parameters.Because DO takes the longest to stabilize this assures all parameters have equilibrated. Stabilization of the DO value will typically take anywhere from 30 seconds to several minutes, depending on the gradient from the previous depth and the age and type of oxygen membrane or probe. Extra time should be allowed for equilibration when values are below approximately 3 mg/L. If the sonde does not have a stirring mechanism, jiggle the cable gently approximately once per second.
2. Enter all data on field forms. 3. Quality assurance (QA): At a minimum, replicate one of every 10 sets of measurements. The
replicate should be taken immediately following the original reading. Values should agree within + 10% or the detection limits listed in Table 3, whichever is larger.
Instrument problems or failure
・ If water quality sensor measurements are not representative of field conditions based on
previous data or limnological knowledge, re-calibrate and try again.
・ If readings seem reasonable, proceed. If not, first check the troubleshooting guide in the
instrument manual. If problem persists, collect as much data as possible using back-up hand
14
held instruments, if available. In the case of measuring DO, jiggle the probe without causing bubbles to form in low DO 2 min, the value continues to decrease, increase the rate of swirling or jiggling to see if it will stabilize; if it is increasing after 2 minutes, you may be agitating the water enough to be causing an aeration artifact near the surface.
6.3.4 Detailed Description and Troubleshooting Hints for Field Variables Because temperature, DO, and other water quality variables are important determinants of biotic habitats, it is important that observers write down values on field forms and think about their ecological meaning, even if a data logger is recording the measurements. The hard copy also serves as backup in case there is an electronic failure.
6.3.4.1 Temperature Temperature (T) is measured in units of degrees Celsius (°C) and recorded to the nearest degree or tenth of a degree as warranted by instrument. The upper few centimeters of soft sediments are often several tenths of a degree warmer than the overlying water. The rise in temperature can be an indication that the probe is submersed into the sediments. If this happens, be sure to vigorously shake the instrument in shallow water with high DO to clean it before re-taking measurements. Check intermediate depth values, and if these values do not meet QA criteria, pull the instrument to the surface and clean it.
6.3.4.2 Specific Conductivity Specific conductivity (SC) is the ability of water to conduct an electrical current for a unit length and unit cross-section at a certain temperature, measured in units of microsiemens per centimeter (μS/cm), and recorded to the nearest μS/cm. Commonly used in water quality monitoring, SC is a general measure of the number of ions dissolved in the water. It is important to be aware of the difference between SC (specific conductivity at the ambient temperature of the sensor) and SC25 (an abbreviation for specific conductivity temperature compensated to 25°C). The difference between SC and SC25 can confound analyses of seasonal patterns of dissolved ions since water temperatures vary throughout the year. The SC25 can be used to monitor seasonal changes in total dissolved salts (TDS) such as a spring flush of road salt, which is why the temperature compensation is so important. Many instruments will display SC in addition to SC25. In the event that an uncompensated sensor must be used, the value of SC25 can be calculated from SC and temperature values. 1. A common physical problem in using a specific conductance probe (or meter) is entrapment
of air in the conductivity probe chambers. Its presence is indicated by unstable specific conductance values fluctuating up to + 100 uS/cm. This problem is much more prevalent in turbulent stream waters and can be minimized by slowly and carefully placing the probe vertically into the water and when completely submerged, quickly moving it back and forth through the water to release any air bubbles. An SC probe with an open flow design does not trap air.
2. Is the value real or is the instrument out of calibration? Having specific conductance standards in the field can help verify values that fall outside the expected range. For example, the expected specific conductivity is around 200 and the reading is 1500. A known standard can be put in the instrument storage cup to determine if the instrument is reading correctly or is out of calibration.
3. SC25 values can be calculated from uncompensated SC values via a temperature compensation formula. For example, for YSI probes, use:
15
Where, SC25 = corrected conductivity value adjusted to 25°C, SCm = measured conductivity before correction; and, tm = water temperature at time of SCm measurement.
Contact the instrument vendor for the appropriate formula.
6.3.4.3 Hydrogen Ion Activity (pH) Commonly used in water quality monitoring, pH is a measure of the acidity of water, measured in standard pH units (SU), and recorded to the nearest 0.1 pH unit. The pH scale is from 1 to 14: neutral water is pH 7, acidic waters have pH <7, and alkaline waters have pH >7.
・ Is the value real or is the instrument out of calibration? Having pH standards in the field can
help verify values that fall outside the expected range. For example, the expected pH is around 7.0 and the reading is 9.5. A known standard can be put in the instrument storage cup to determine if the instrument is reading correctly or out of calibration.
・ As with dissolved oxygen, a pH probe can take longer to equilibrate when the gradient from
the previous measurement is large (>1.0 pH SU).
・ Low ionic strength waters with SC25 < 50 μS/cm can cause pH measurement stability
problems with some probes, necessitating use of low ionic strength probes. Probes will often calibrate fine in strong ionic strength buffers but will not read accurately in lower ionic strength surface waters. If you suspect this is the case, use a sensor that is designed for low ionic strength waters.
6.3.4.4 Dissolved Oxygen Dissolved oxygen (DO): units of mg/L record value to nearest 0.1 mg/L unless otherwise justified; percent saturation (% DO) record value to nearest %; also temperature compensated to 25°C.
・ Be aware that if a water sample has a strong rotten egg smell (H2S gas) it must have a DO of
zero. This is one way to check your meter. You can use the measured offset value to correct your higher DO values. Do not report negative DO values in the final database although it is important to report them on the field data sheet. Do the correction afterwards but note on the field sheet the depth at which you could smell sulfide gas. Avoid touching the bottom, if possible, as the membrane may become fouled.
・ Equilibration time is critical; the steeper the DO gradient, the longer the equilibration time. It
may take >5 minutes when DO drops abruptly to near zero.
・ The DO probes with membranes (Clark cell) actually consume oxygen in the immediate
vicinity around the membrane as they work; measurements therefore require moving water using either a built-in stirrer (typical in multiparameter sondes and BOD probes) or moving the cable up and down (e.g., 6” each side of the desired depth) during the measurement. Optical sensors do not consume oxygen and hence do not require moving water.
)25(0191.0125
m
m
t
CC
16
・ Accuracy of an optical DO probe can be compromised if it is covered with a residue that
inhibits or increases oxygen reaching the sensor surface. Algae on the sensor surface may increase DO measurements, while oils or sediments may lower them. If measurements seem suspect, or if the instrument was used in contaminated water, the sensing surface should be cleaned with a soft brush and a mild detergent.
6.3.4.6 Clarity 6.3.4.6.2 Transparency Tube: 1. Measure transparency tube clarity using a 120 cm tube2. 2. The tube should be set on a white towel background, shaded by your body, and read without
sunglasses. 3. Water should be dispensed from a carboy that was used for integrating water samples (see
below) rather than dipped from the water body. The carboy must be well shaken prior to filling the tube to minimize artifacts due to settling of sand and larger silt particles. Allow air bubbles to disappear before making the final measurement.
4. While slowly releasing water from the bottom of the tube via its valve, note and record the depth at which the mini-Secchi first becomes visible. Discard the remaining water and repeat the measurement with a second subsample from the carboy.
5. Several attempts to read the clarity may be necessary because of overshooting the endpoint, so collect plenty of water for this analysis. A standard 120 cm x 4.5cm outside diameter tube requires approximately1.5 L to fill it, so dedicate at least 4 L of water for this measurement..
6. During clear water periods, the tube may not be long enough for a measurement. In such cases, the value should be recorded as >120 cm. If it appears to be barely visible, this fact should be recorded to distinguish it from a measurement where it is clearly visible.
7. Quality Assurance (QA): At a minimum, replicate transparency tube readings at every tenth site. Because of the apparent ease of this measurement yet its potential difficulty in less than ideal conditions, all field crew members should take this measurement at each site for at least the first round of sampling. Crew members should not reveal their values until all are finished and then all values should be recorded and compared. Values should agree within 10%.
Maintenance notes and other precautions: 1. The rubber stopper (with attached Secchi) can be dislodged easily. Tape the stopper with
black vinyl electricians tape and carry an extra stopper-Secchi. 2. Clean the transparency tube periodically with mild dish soap and a soft cloth. 3. Although water from the tube may be saved for turbidity and TSS measurements, do not save
it for nutrient or other pollutant analyses because the tubes are not cleaned according to certified protocols.
4. Subsampling and settling issues are important, as particles settle quickly. A stopper for the top of the tube is useful to allow for resuspension during the measurement if rapid settling occurs.\
5. Dissolved color due to organic matter (humic and fulvic acids, usually from bogs and conifer needles) can confound comparisons of transparency tube data between lakes. Also, lakes with similar concentrations of suspended sediments can have different transparency because smaller particles scatter more light.
17
6.4 Water Sample Collection
Before its first use, the sampler will be cleaned thoroughly by rinsing three times with hot tap water, rinsing three times with 0.1 N HCl, and finally, rinsing three times with deionized water.
6.4.1 Integrated Sampling 1. Rinse compositing jug 3 times before sampling. Increase surface water flushing to 6 rinses if
the compositing jug previously contained water that was contaminated with sediment or water deemed to have much higher nutrient levels.
2. Fill the jug at least 75% full to ensure adequate water for all analyses; if a transparency tube measurement will be done, an entire jug is needed. Extra water simply reduces variance associated with the site.
3. Once water is collected, immediately begin dispensing it into appropriate analyte bottles or keep jug cold and dark until processing in the park lab or home base at the end of the day (details below).
6.4.3 Distributing Sample Water from the Compositing Jugs
・ Always ensure composite water is well mixed prior to dispensing it to any other containers.
・ Rinse bottles and caps for chlorophyll-a with lake water 3 times, prior to filling. Uncap and
re-cap bottles below water surface to avoid surface scum or debris.
・ Fill plastic bottle for chlorophyll-a (at least 1 L); keep cold and dark until filtering at the end
of the day. If the water sample is processed on-site, follow the instructions below, in addition to those in SOP #7. 1. Rinse caps and bottles with composit water 3 times, using approximately 50 mL for each
rinse, prior to filling. Shake out excess water. 2. Cap and re-agitate composite jug and then dispense water into previously labeled
appropriate. Fill nutrient bottle to the bottom of the neck of the bottle – this will prevent the bottle from breaking when the water expands as it freezes.
3. Use remaining water for transparency tube measurement if specified. If insufficient water is left, collect additional water until there is enough for replicate measurements.
Pay special attention to the appearance (visual color and turbidity) and smell (rotten egg gas, H2S) of the water. If there is any evidence suggesting that bottom sediments were stirred up and captured by the sampler, re-do the collection taking care to vigorously clean the sampler and compositing carboy with surface water.
6.4.4 Sample Handling While in the Field Store water samples in cooler with ice until return to home base for further processing.
6.4.5 Quality Assurance of Field Duplicates Collect a field duplicate every 10 samples. Label the duplicate analysis bottles with the code appropriate for the duplicate, and fabricate a date and time of sampling. Indicate on the data field
18
form which site or lake is the duplicate, the true sampling time and date, and the fabricated time and date. Treat the duplicate as a regular sample for all phases of collection, processing, and analysis. The duplicate should be a split sample, taken from the same composite jug. See section 6.6.3.2, below, for more details.
6.5 Departure from Monitoring Site
Before leaving the monitoring site, all field forms and sample labels must be reviewed for legibility, accuracy, and completeness. Any changes in procedure due to field condition must be explained in the comments section. Make sure the information is complete on all forms. Record the departure time on the field form. After reviewing each form, initial the upper right corner of each page of the form. Document any photos taken by including the photo number and roll number or digital camera photo number on the field form.
6.6 Quality Assurance/Quality Control (QA/QC)
QA/QC basically refers to all those things good investigators do to make sure their measurements are right-on (accurate; the absolute true value), reproducible (precise; consistent), and include good estimates of uncertainty. It specifically involves following established rules in the field and lab to assure everyone that the sample is representative of the site, free from outside contamination by the sample collector, and that it has been analyzed following standard QA/QC methods.
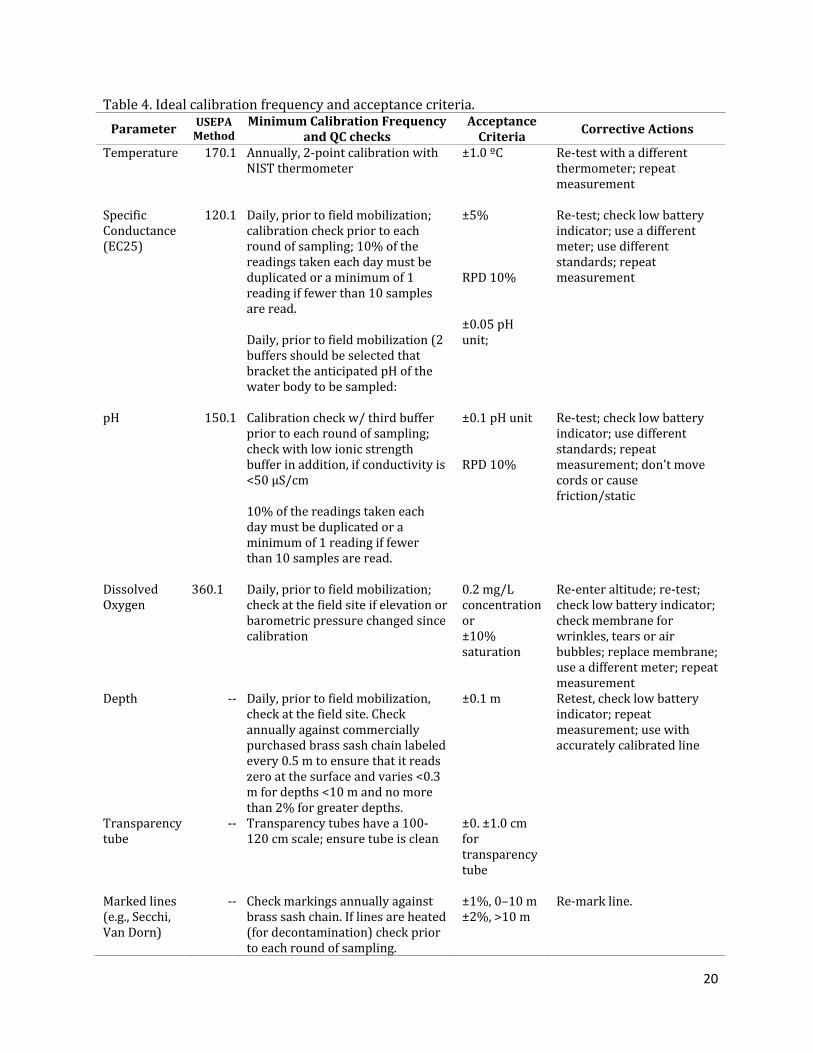
6.6.1 Calibration of Field Instrument Sensors Calibration schedules overlap but differ from sampling schedules, so calibration methods are listed here as a separate procedural step. Instrument calibration is an essential part of quality assurance. Table 4 summarizes the ideal calibration frequency and minimum acceptance criteria for these sensor probes. The reality of logistical constraints at back country sites may preclude calibration and checks of calibration at the ideal frequency. This SOP provides only generic guidelines for equipment use and maintenance. A wide variety of field instruments is available; such instruments are continuously being updated or replaced using newer technology. Keep equipment manufacturers' maintenance and calibration instructions for all instruments for reference purposes. Field personnel must be familiar with the instructions provided by manufacturers. Contact manufacturers for answers to technical questions.
6.6.1.1 Instrument Calibration and Maintenance Logbooks Calibration and maintenance logs for multi-parameter sondes and all back-up sensor probes will be maintained and will document the frequency of calibration, maintenance, and calibration checks. See the attachments for a blank calibration log form. Keep calibration logs with each instrument during the sampling season. Logs will later be archived at the Network office in Ashland, Wisconsin. A new log will be started for each field season. Each instrument will have a logbook for recording all maintenance and calibration information, including:
・ serial number, date received, manufacturer’s contact information, especially technical service
representatives
・ service records, dates of probe replacements
19
・ maintenance records, for example, whenever the following general maintenance occurs: DO
membrane replacement, pH reference probe junction and filling solution, probe cleanings, sonde (the sensor housing) replacement, impellor replacement or cleaning, etc.
・ calibration dates and calibration data
・ any problems with sensors
・ pre-mobilization, post-calibration checks performed on individual sensor probes
20
Table4.Idealcalibrationfrequencyandacceptancecriteria.
Parameter USEPAMethod
MinimumCalibrationFrequencyandQCchecks
AcceptanceCriteria CorrectiveActions
Temperature 170.1 Annually,2‐pointcalibrationwithNISTthermometer
±1.0ºC Re‐testwithadifferentthermometer;repeatmeasurement
SpecificConductance(EC25)
120.1 Daily,priortofieldmobilization;calibrationcheckpriortoeachroundofsampling;10%ofthereadingstakeneachdaymustbeduplicatedoraminimumof1readingiffewerthan10samplesareread.Daily,priortofieldmobilization(2buffersshouldbeselectedthatbrackettheanticipatedpHofthewaterbodytobesampled:
±5%RPD10%±0.05pHunit;
Re‐test;checklowbatteryindicator;useadifferentmeter;usedifferentstandards;repeatmeasurement
pH 150.1 Calibrationcheckw/thirdbufferpriortoeachroundofsampling;checkwithlowionicstrengthbufferinaddition,ifconductivityis<50μS/cm10%ofthereadingstakeneachdaymustbeduplicatedoraminimumof1readingiffewerthan10samplesareread.
±0.1pHunitRPD10%
Re‐test;checklowbatteryindicator;usedifferentstandards;repeatmeasurement;don'tmovecordsorcausefriction/static
DissolvedOxygen
360.1 Daily,priortofieldmobilization;checkatthefieldsiteifelevationorbarometricpressurechangedsincecalibration
0.2mg/Lconcentrationor±10%saturation
Re‐enteraltitude;re‐test;checklowbatteryindicator;checkmembraneforwrinkles,tearsorairbubbles;replacemembrane;useadifferentmeter;repeatmeasurement
Depth ‐‐ Daily,priortofieldmobilization,checkatthefieldsite.Checkannuallyagainstcommerciallypurchasedbrasssashchainlabeledevery0.5mtoensurethatitreadszeroatthesurfaceandvaries<0.3mfordepths<10mandnomorethan2%forgreaterdepths.
±0.1m Retest,checklowbatteryindicator;repeatmeasurement;usewithaccuratelycalibratedline
Transparencytube
‐‐ Transparencytubeshavea100‐120cmscale;ensuretubeisclean
±0.±1.0cmfortransparencytube
Markedlines(e.g.,Secchi,VanDorn)
‐‐ Checkmarkingsannuallyagainstbrasssashchain.Iflinesareheated(fordecontamination)checkpriortoeachroundofsampling.
±1%,0–10m±2%,>10m
Re‐markline.
21
6.6.1.2 Handling of Calibration Standard Solutions Store all calibration standards in a temperature-controlled environment. Standards should be dated upon receipt and upon opening. Commercially-purchased calibration standards come with an expiration date that must be observed. Ensure that calibration standards are not used beyond expiration dates. Properly dispose of all waste materials. Used calibration solutions, in general, may be rinsed down a sink with water after consideration of the wastewater treatment system available to that sink. Material safety data sheets (MSDS) that are sent with manufacturer purchased calibration solutions should be kept on file. These documents describe the flammability, toxicity, and other safety hazards of reagents. Some reagents may include constituents toxic to aquatic life. These should not be rinsed down a sink in any large quantities in primitive areas where the ultimate destination of wastewater is the aquatic environment. Instead, these reagents should be collected in a properly-marked leak-proof container for disposal in an adequate treatment system.
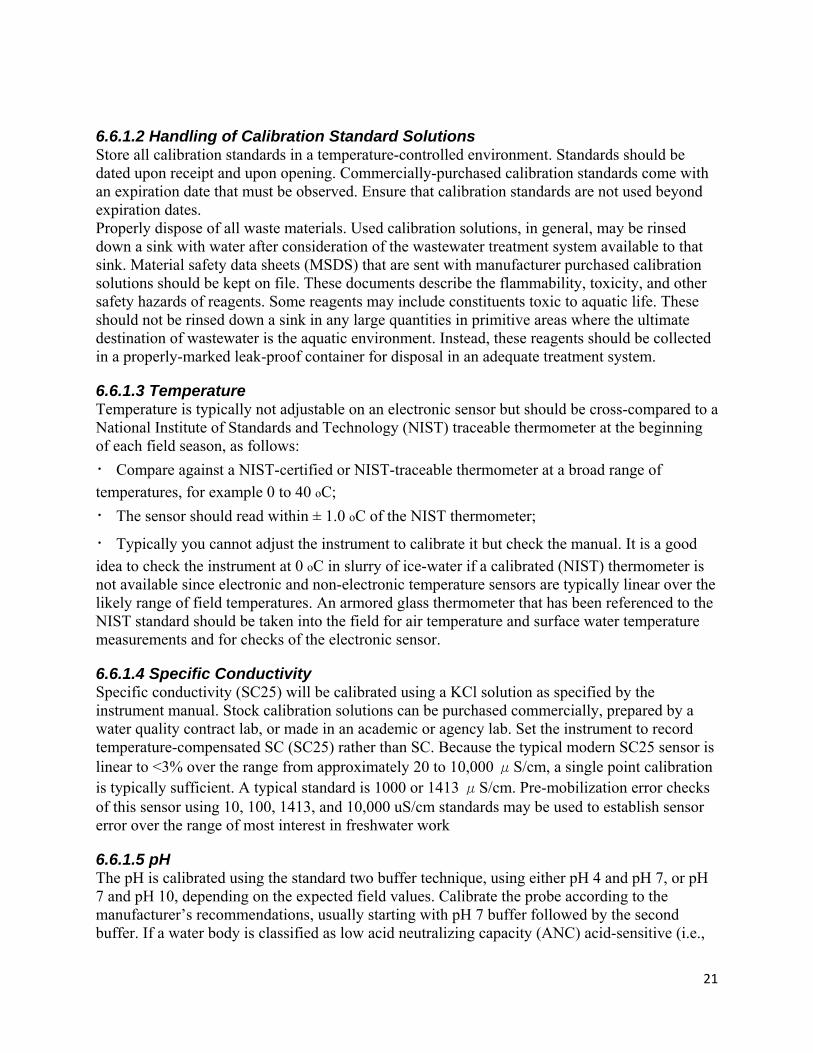
6.6.1.3 Temperature Temperature is typically not adjustable on an electronic sensor but should be cross-compared to a National Institute of Standards and Technology (NIST) traceable thermometer at the beginning of each field season, as follows:
・ Compare against a NIST-certified or NIST-traceable thermometer at a broad range of
temperatures, for example 0 to 40 oC;
・ The sensor should read within ± 1.0 oC of the NIST thermometer;
・ Typically you cannot adjust the instrument to calibrate it but check the manual. It is a good
idea to check the instrument at 0 oC in slurry of ice-water if a calibrated (NIST) thermometer is not available since electronic and non-electronic temperature sensors are typically linear over the likely range of field temperatures. An armored glass thermometer that has been referenced to the NIST standard should be taken into the field for air temperature and surface water temperature measurements and for checks of the electronic sensor.
6.6.1.4 Specific Conductivity Specific conductivity (SC25) will be calibrated using a KCl solution as specified by the instrument manual. Stock calibration solutions can be purchased commercially, prepared by a water quality contract lab, or made in an academic or agency lab. Set the instrument to record temperature-compensated SC (SC25) rather than SC. Because the typical modern SC25 sensor is linear to <3% over the range from approximately 20 to 10,000 μS/cm, a single point calibration is typically sufficient. A typical standard is 1000 or 1413 μS/cm. Pre-mobilization error checks of this sensor using 10, 100, 1413, and 10,000 uS/cm standards may be used to establish sensor error over the range of most interest in freshwater work
6.6.1.5 pH The pH is calibrated using the standard two buffer technique, using either pH 4 and pH 7, or pH 7 and pH 10, depending on the expected field values. Calibrate the probe according to the manufacturer’s recommendations, usually starting with pH 7 buffer followed by the second buffer. If a water body is classified as low acid neutralizing capacity (ANC) acid-sensitive (i.e.,
22
ANC approximately 100 ueq/L or lower), it should also be checked against a low ionic strength buffer (LISB) with pH approximately 4, as per protocols from the National Acid Precipitation Assessment Program (NAPAP 1990). A low ionic strength pH combination electrode may be necessary to acquire this extra level of sensitivity if stabilized pH measurements are not achieved with standard pH sensors. Prior to each round of sampling, check the calibration with a third standard with a pH value between those used for calibration.
6.6.1.6 Dissolved Oxygen Two types of dissolved oxygen (DO) sensors are typically utilized: Clark cell and optical. A Clark cell (membrane) sensor is air-calibrated, while an optical DO sensor is calibrated in 100% saturated tap water. For a Clark cell, it is assumed that the dry sensor will read 100% saturation in an enclosed airspace with enough water in the bottom of the container to saturate the air with water vapor. For optical DO sensors, the sensor window must be submerged in 100% DO saturated water, which is obtained by agitating tap water in a container for one minute and then decanting it into the calibration chamber until the DO sensor is completely covered with water. A Clark cell should be checked for bubbles under the surface of the membrane. If bubbles are observed, change the electrolyte solution and replace the membrane. An optical DO sensor’s surface should be observed to make certain that no air bubbles are clinging to it. The calibration chamber can be tapped gently to dislodge any bubbles. Temperature affects DO saturation, as does the air pressure, which varies with elevation and ambient weather. Both sensors require a known barometric pressure (BP), obtained by the multiprobe itself (if equipped with a BP sensor) or from another source. Acceptable sources for BP are from another instrument, such as a calibrated barometer, or a third-party source, such as the local weather bureau or airport. Typically, one can assume the barometric pressure to vary with elevation. As a result, the instrument should be re-calibrated at each site if the elevation has changed more than 50 feet.
6.6.1.7 Depth Use a second color to make wraps at 1
6.6.1.8 Post-Field Calibration Checks Post-field calibration checks must be performed after each use of the instrument and before any instrument maintenance. The sooner this procedure is performed, the more representative the results will be for assessing performance during the preceding field measurements. Calibration and post-calibration should be no more than 24 hours apart. When sampling daily, the second day’s calibration can serve as the first day’s post-field calibration check. Take the same care used in performing the initial calibration by rinsing the sensors and waiting for sensors to stabilize. After making measurements at the last station, fill the sampling cup with ambient water (not deionized or tap water). Repeat the initial calibration procedures performed before the sampling trip. Record post-field calibration values in the calibration logbook (generally on the same page with the initial calibration for that sampling trip). Deviation beyond the manufacturer’s specifications is cause for concern and should be addressed before the next sampling date.
Do not adjust the instrument (using calibration controls) during the post-calibration check.
The purpose of the post-calibration is to determine if the instrument has held calibration during the day of sampling. Compare the post-calibration values to the expected values for the
23
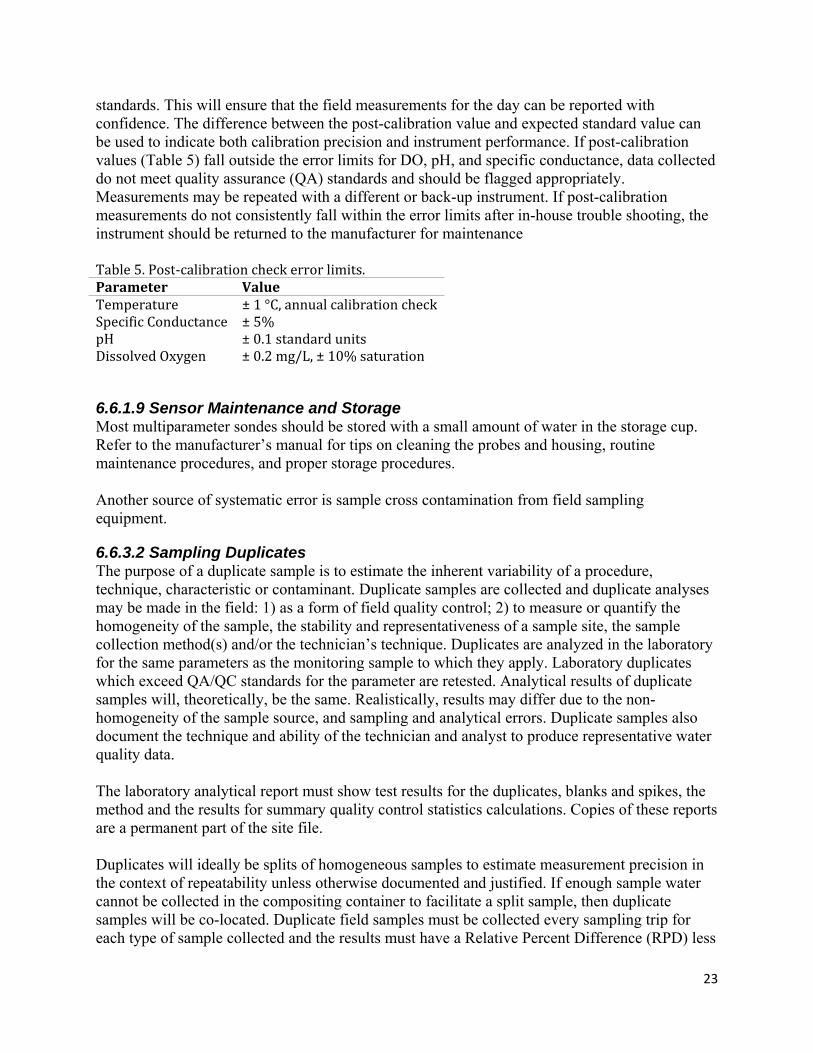
standards. This will ensure that the field measurements for the day can be reported with confidence. The difference between the post-calibration value and expected standard value can be used to indicate both calibration precision and instrument performance. If post-calibration values (Table 5) fall outside the error limits for DO, pH, and specific conductance, data collected do not meet quality assurance (QA) standards and should be flagged appropriately. Measurements may be repeated with a different or back-up instrument. If post-calibration measurements do not consistently fall within the error limits after in-house trouble shooting, the instrument should be returned to the manufacturer for maintenance Table5.Post‐calibrationcheckerrorlimits.Parameter ValueTemperature ±1°C,annualcalibrationcheckSpecificConductance ±5%pH ±0.1standardunitsDissolvedOxygen ±0.2mg/L,±10%saturation
6.6.1.9 Sensor Maintenance and Storage Most multiparameter sondes should be stored with a small amount of water in the storage cup. Refer to the manufacturer’s manual for tips on cleaning the probes and housing, routine maintenance procedures, and proper storage procedures. Another source of systematic error is sample cross contamination from field sampling equipment.
6.6.3.2 Sampling Duplicates The purpose of a duplicate sample is to estimate the inherent variability of a procedure, technique, characteristic or contaminant. Duplicate samples are collected and duplicate analyses may be made in the field: 1) as a form of field quality control; 2) to measure or quantify the homogeneity of the sample, the stability and representativeness of a sample site, the sample collection method(s) and/or the technician’s technique. Duplicates are analyzed in the laboratory for the same parameters as the monitoring sample to which they apply. Laboratory duplicates which exceed QA/QC standards for the parameter are retested. Analytical results of duplicate samples will, theoretically, be the same. Realistically, results may differ due to the non-homogeneity of the sample source, and sampling and analytical errors. Duplicate samples also document the technique and ability of the technician and analyst to produce representative water quality data. The laboratory analytical report must show test results for the duplicates, blanks and spikes, the method and the results for summary quality control statistics calculations. Copies of these reports are a permanent part of the site file. Duplicates will ideally be splits of homogeneous samples to estimate measurement precision in the context of repeatability unless otherwise documented and justified. If enough sample water cannot be collected in the compositing container to facilitate a split sample, then duplicate samples will be co-located. Duplicate field samples must be collected every sampling trip for each type of sample collected and the results must have a Relative Percent Difference (RPD) less
24
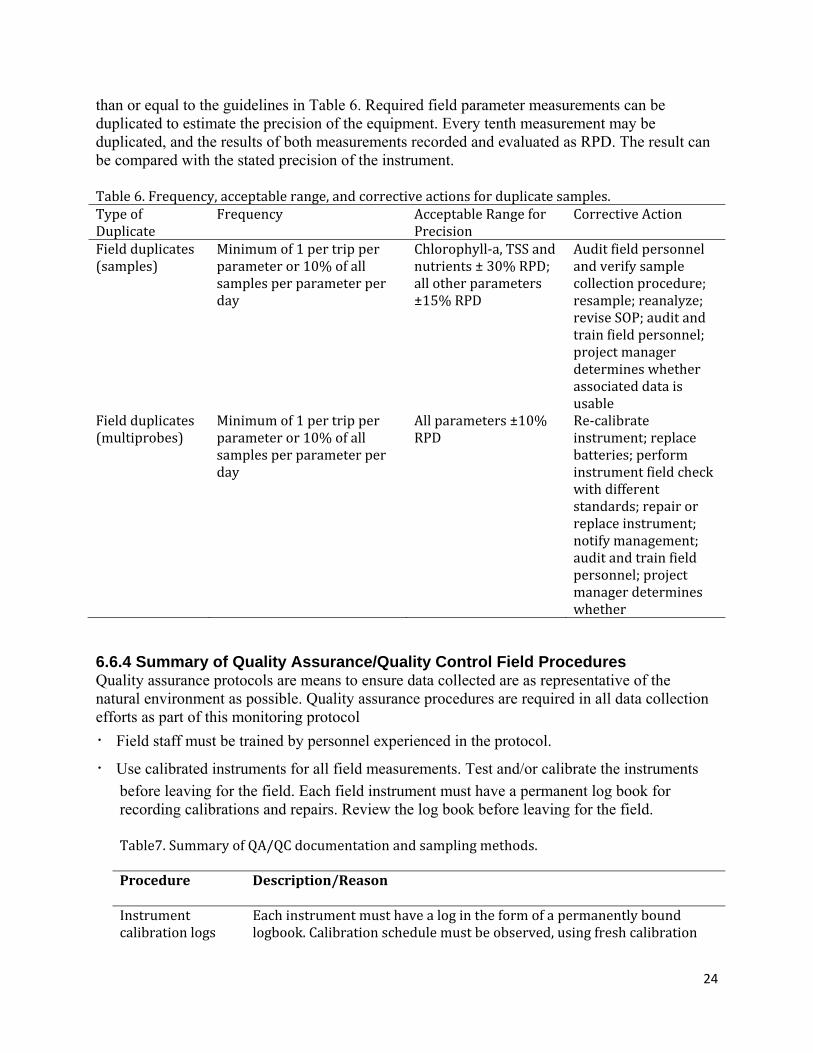
than or equal to the guidelines in Table 6. Required field parameter measurements can be duplicated to estimate the precision of the equipment. Every tenth measurement may be duplicated, and the results of both measurements recorded and evaluated as RPD. The result can be compared with the stated precision of the instrument. Table6.Frequency,acceptablerange,andcorrectiveactionsforduplicatesamples.TypeofDuplicate
Frequency AcceptableRangeforPrecision
CorrectiveAction
Fieldduplicates(samples)
Minimumof1per tripperparameteror10%ofallsamplesperparameterperday
Chlorophyll‐a,TSSandnutrients±30%RPD;allotherparameters±15%RPD
Auditfieldpersonnelandverifysamplecollectionprocedure;resample;reanalyze;reviseSOP;auditandtrainfieldpersonnel;projectmanagerdetermineswhetherassociateddataisusable
Fieldduplicates(multiprobes)
Minimumof1pertripperparameteror10%ofallsamplesperparameterperday
Allparameters±10%RPD
Re‐calibrateinstrument;replacebatteries;performinstrumentfieldcheckwithdifferentstandards;repairorreplaceinstrument;notifymanagement;auditandtrainfieldpersonnel;projectmanagerdetermineswhether
6.6.4 Summary of Quality Assurance/Quality Control Field Procedures Quality assurance protocols are means to ensure data collected are as representative of the natural environment as possible. Quality assurance procedures are required in all data collection efforts as part of this monitoring protocol
・ Field staff must be trained by personnel experienced in the protocol.
・ Use calibrated instruments for all field measurements. Test and/or calibrate the instruments
before leaving for the field. Each field instrument must have a permanent log book for recording calibrations and repairs. Review the log book before leaving for the field.
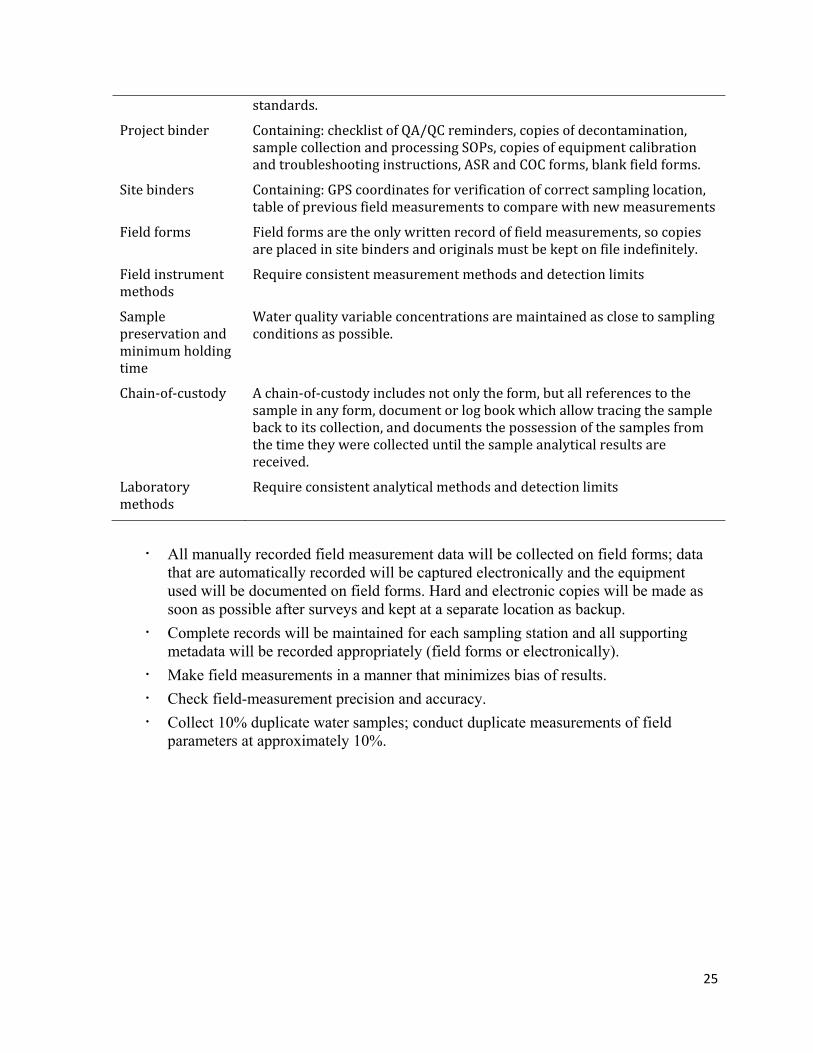
Table7.SummaryofQA/QCdocumentationandsamplingmethods.Procedure Description/Reason
Instrumentcalibrationlogs
Eachinstrumentmusthavealogintheformofapermanentlyboundlogbook.Calibrationschedulemustbeobserved,usingfreshcalibration
25
standards.
Projectbinder Containing:checklistofQA/QCreminders,copiesofdecontamination,samplecollectionandprocessingSOPs,copiesofequipmentcalibrationandtroubleshootinginstructions,ASRandCOCforms,blankfieldforms.
Sitebinders Containing:GPScoordinatesforverificationofcorrectsamplinglocation,tableofpreviousfieldmeasurementstocomparewithnewmeasurements
Fieldforms Fieldformsaretheonlywrittenrecordoffieldmeasurements,so copiesareplacedinsitebindersandoriginalsmustbekeptonfileindefinitely.
Fieldinstrumentmethods
Requireconsistentmeasurementmethods anddetectionlimits
Samplepreservationandminimumholdingtime
Waterqualityvariableconcentrationsaremaintainedasclosetosamplingconditionsaspossible.
Chain‐of‐custody Achain‐of‐custodyincludesnotonlytheform,butallreferencestothesampleinanyform,documentorlogbookwhichallowtracingthesamplebacktoitscollection,anddocumentsthepossessionofthesamplesfromthetimetheywerecollecteduntilthesampleanalyticalresultsarereceived.
Laboratorymethods
Requireconsistentanalyticalmethodsanddetectionlimits
・ All manually recorded field measurement data will be collected on field forms; data that are automatically recorded will be captured electronically and the equipment used will be documented on field forms. Hard and electronic copies will be made as soon as possible after surveys and kept at a separate location as backup.
・ Complete records will be maintained for each sampling station and all supporting metadata will be recorded appropriately (field forms or electronically).
・ Make field measurements in a manner that minimizes bias of results.
・ Check field-measurement precision and accuracy.
・ Collect 10% duplicate water samples; conduct duplicate measurements of field parameters at approximately 10%.
26
6.8 Literature Cited
APHA (American Public Health Associatio). 1998. Standard methods for the examination of water and wastewater. 20th ed. Clesceri, L. S., A. E. Greenberg, A. D. Eaton, editors. Washington, D.C. American Public Health Association.
Baker, J. R., D. V. Peck, and D. W. Sutton (editors). 1997. Environmental monitoring and assessment program (EMAP) surface waters: Field operations manual for lakes. EPA/620/R-97/001. U.S. Environmental Protection Agency, Washington D.C.. http://www.epa.gov/emap/html/pubs/docs/groupdocs/surfwatr/field/97fopsman.html.
Carlson, R. E., and J. Simpson. 1996. A coordinator’s guide to volunteer lake monitoring methods. North American Lake Management Society (www.nalms.org). (excerpt from http://dipin.kent.edu/Sampling_Procedures.htm)
Hoffman, R. L., T. J. Tyler, G. L. Larson, M. J. Adams, W.Wente, and S. Galvan. 2005. Sampling protocol for monitoring abiotic and biotic characteristics of mountain ponds and lakes. Chapter 2 of Book 2, Collection of Environmental Data, Section A, Water Analysis Techniques and Methods 2-A2. U.S. Department of the Interior, U.S. Geological Survey, Reston, Virginia.
Irwin, R. 2006. Draft Part B lite (Just the Basics) QA/QC review checklist for aquatic vital sign monitoring protocols and SOPs, 62 pp., National Park Service, Water Resources Division. Fort Collins, Colorado, distributed on Internet only at http://www.nature.nps.gov/water/Vital_Signs_Guidance/Guidance_Documents/part_b_lit e_05_2005.pdf.
Irwin, R. 2004. Vital signs long-term aquatic monitoring projects, planning process steps: Part B, issues to consider and then document in a detailed study plan that includes a quality assurance project plan (QAPP) and monitoring “protocols” (including standard operating procedures), January 2004 draft. Available from: http://science.nature.nps.gov/im/monitor/protocols/wqPartB.doc.
Magdalene, S., D. R. Engstrom, and J. Elias. 2007. Standard operating procedure #6, field measurements and water sample collection. in Magdalene, S., D.R. Engstrom, and J. Elias. 2007. Large rivers water quality monitoring protocol, Version 1.0. National Park Service, Great Lakes Network, Ashland, Wisconsin.
NAPAP (National Acid Precipitation Assessment Program). 1990. Acid deposition: State of science and technology, Volume II aquatic processes and effects. National Acid Precipitation Assessment Program Office of the Director, Washington, DC.
O’Ney, S. E. 2005. Standard operating procedure #5: Procedure for collection of required field parameters, Version 1.0. In: Regulatory water quality monitoring protocol, Version 1.0, Appendix E. Bozeman (MT): National Park Service, Greater Yellowstone Network.
Penoyer, P. 2003. Vital signs long-term aquatic monitoring projects: Part C, draft guidance on WRD required and other field parameter measurements, general monitoring methods and some design considerations in preparation of a detailed study plan. Aug. 6, 2003. Draft. Available from: http://science.nature.nps.gov/im/monitor/protocols/wqPartC.doc
27
Route, B., W. Bowerman, and K. Kozie. 2009. Protocol for monitoring environmental contaminants in bald eagles, Version 1.2: Great Lakes Inventory and Monitoring Network. Natural Resource Report NPS/GLKN/NRR—2009/092. National Park Service, Fort Collins, Colorado.
USGS. 2005. National field manual for the collection of water-quality data: U.S. Geological Survey Techniques of Water-Resources Investigations, book 9, chaps. A1-A9, http://pubs.water.usgs.gov/twri9A.
WOW. 2004. Water on the Web - Monitoring Minnesota lakes on the internet and training water science technicians for the future - a national on-line curriculum using advanced technologies and real-time data (http://waterontheweb.org). University of Minnesota Duluth.
28
Standard Operating Procedure #7: Processing Water Samples and Analytical Laboratory Requirements Version 1.1 In Water Quality Monitoring Protocol for Inland Lakes Prepared by Richard Axler and Elaine Ruzycki Center for Water and the Environment Natural Resources Research Institute University of Minnesota-Duluth 5013 Miller Trunk Highway Duluth, Minnesota 55811 And Joan Elias (contact author) National Park Service Great Lakes Inventory and Monitoring Network 2800 Lake Shore Drive East Ashland, Wisconsin 54559 [email protected] March 2010 Suggested citation: Axler, R., E. Ruzycki, and J.E. Elias. 2010. Standard operating procedure #7, Processing water samples and analytical laboratory requirements, Version 1.1. in Elias, J.E., R. Axler, and E. Ruzycki. 2008. Water quality monitoring protocol for inland lakes, Version 1.0. National Park Service, Great Lakes Network, Ashland, Wisconsin.
29
Acknowledgements Combinations of existing protocols were used to develop this standard operating procedure for handling and processing water samples prior to sending them to an analytical laboratory. The authors wish to acknowledge these sources (Hoffman et al. 2005, O’Ney 2005, USGS 2005, WOW 2004, Penoyer 2003, EPA 2001, and Baker et al. 1997) for the guidance they provided. Thanks also go to White Water Associates for providing examples of forms for analytical requests and chain of custody.
7.0 Introduction
This standard operating procedure (SOP) is designed to provide detailed instructions on the handling and processing of water samples prior to analysis by an analytical laboratory. Water chemistry will be performed by one or more analytical laboratories that have demonstrated the ability to measure analytes at detection levels adequate to meet our needs. Preferably, the laboratories will be state- or federally-certified for performing the above water chemistry analyses in natural waters, or an academic research laboratory that can demonstrate quality assurance and quality control (QA/QC) procedures consistent and current EPA procedures used as the basis for state certification of commercial environmental laboratories.
7.1 Summary of Analytical Methods
7.2 Sample Handling and Processing Procedures
The following general techniques will be observed throughout the procedures detailed in 7.2.1 through 7.2.4. 1. Keep all water samples cool and dark until processing is complete and samples are shipped to
the analytical laboratory. 2. Use only new, clean sample bottles supplied by the analytical laboratory or purchased pre-
cleaned from a supplier. 3. Rinse filtration equipment with deionized water (DIW) three times between samples. 4. Avoid touching the inside of sample bottles and filtering apparatus, tips of forceps, and filters
to prevent contamination of the samples. 5. When filtering samples in the field, use an enclosed filtering apparatus to minimize
contamination from airborne sources. 6. Wear disposable, powderless gloves when working with acids and other preservatives. 7. Filter samples in the order of anticipated phosphorus concentrations, from low to high. After
filtering a water sample that is expected to contain high nutrient concentrations, rinse the apparatus three times with 0.1N HCl followed by three times with DIW water before processing the next sample.
8. Prepare QA/QC samples in the same manner as regular samples, using water from the same sample collection container.
9. Rinse all reusable equipment with DIW immediately, before equipment dries. 10. Ensure all sample bottles are labeled correctly, completely, and legibly.

30
11. Check laboratory equipment and supplies list (Table 3) and ensure equipment is clean and ready for use and supplies are adequate. Table3.Laboratoryequipmentandsupplieslist.
Filtrationtowersandmanifold(4.7mm)plasticVacuumpumpwithpressuregaugeandextrafilteringflaskasawatertraptoprotectthepumpincaseofoverflow
Graduatedcylinders,plastic250WhatmanGF/Cfilters(4.7cmdiameter)0.45μmMilliporemembranefiltersFilterforcepswithbroadtipsAluminumfoilLabelingtape,permanentmarkersDeionizedwater(ASTMgrade1or2;1‐10megohm)FreezerPlasticstoragebagsSamplebottles(providedbyanalyticallaboratory)Insulatedicechest,ice,andicepacksWash(squirt)bottles–500mLKimwipes
The following sections detail the procedures to be followed when processing water samples for particular analysis.
7.2.1 Total Chlorophyll-a 1. Fit rinsed filtering device with a Whatman GF/C glass fiber filter using forceps, smooth side
down (curl is up). 2. Agitate water sample (always shake well to minimize subsampling error for solids). 3. Set pump vacuum to < 0.5 atmospheres (7.5 PSI or 380 mm Hg). If using a hand pump,
maintain pressure at or below 10 PSI. 4. Use a glass or plastic graduated cylinder to measure 100 - 1000 mLs of water sample. Filter
sample. If water is very turbid, filter small aliquots (100 mLs) to avoid clogging the filter. Sufficient volume has been filtered when a green, brown, or tan color is clearly visible on the filter and the flow decreases to a few drops/second.
5. Rinse graduated cylinder and filtering apparatus with DIW and pass through filter to include any algae that may have adhered to the sides of the cylinder.
6. Record volume filtered on data sheet (excluding DIW rinse). 7. Use forceps to fold filter into quarters with sample on the inside; do not touch filter with
fingers. 8. Wrap filter in foil; label foil with sample location, date and time sample was collected, and
volume filtered. Place foil in small, sealable baggie with standard laboratory label. 9. Refrigerate immediately and freeze as soon as possible. Place small baggies with foils
together in a large, sealable freezer bag. A third watertight container may be used for shipping to ensure that melt water in transport will not corrupt the samples.
31
7.2.2 Unfiltered (Raw) Samples 1. Rinse sample bottle provided by analytical laboratory 1x with sample water. 2. Fill sample bottle with sample water (fill to neck if sample will be frozen). 3. Refrigerate or freeze, as per laboratory instructions, until packaging for transport to analytical
laboratory.
7.2.3 Filtered Samples 1. Using clean forceps, place a 0.45μm Millipore cellulose membrane filter in the filtration
apparatus. Rinse with 100 mL DIW into a cleaned (0.1N HCl and DIW rinsed as per sample bottle cleaning) filtering flask (glass or plastic). Rinse flask with filtrate and discard filtrate.
2. Filter a small amount (~50 ml) of sample water; rinse filtering flask with filtrate and discard filtrate.
3. Filter enough of the sample to produce the required amount of filtrate to be tested. 4. Dispense the filtrate into separate bottles provided by the analytical laboratory as follows:
・ rinse bottle with small amount of filtrate (~10 ml) and discard; fill bottle to neck,
refrigerate or freeze as per laboratory instructions.
7.3 Shipping Procedures
1. Call FedEx or other courier service ahead of time to arrange pick-up. 2. Make large quantities of ice cubes and ice blocks (or buy ice) ahead of time. 3. Line cooler with large plastic garbage bag. 4. Place all total chlorophyll-a baggies containing aluminum foil wrappers in one large sealable
plastic bag. Place this baggie between 2 ice packs or bags of ice. It is critical that melt water does not soak the filters, so you may want to place large sealed bag of foil wrappers in a sealed plastic jar before surrounding with ice.
5. Use ice cubes, doubly bagged in plastic bags, to pack around samples; use other ice blocks (water bottles, soda bottles, etc.) as they will fit.
6. Include a temperature check bottle with the sample bottles in each cooler, if used by the contract analytical laboratory.
7. Complete the chain of custody (COC) form, keeping the ‘client copy’ for the project files. Seal the laboratory’s copies in a one-gallon plastic sealable bag and tape to the inside cover of the cooler. Prepare separate COC forms for each cooler. An example COC form is provided in Attachment B.
8. If the refrigerated samples are sent in the same insulated cooler with the frozen samples, protect them from freezing by wrapping them in newspaper, bubble wrap, etc.
9. Ship samples overnight so they are received the following day during a work-week, whenever possible. Contact the laboratory about Saturday shipment receipt availability before shipping samples on a Friday. Many laboratories do not have sample receipt staff on Saturday or charge extra for staff time.
10. Alert the contract laboratory when samples have been shipped via phone or e-mail. Be sure to get acknowledgement from the lab that they know the samples are en route. Ask the lab to let you know when the samples are received.
32
7.4 Quality Assurance/Quality Control
The most important aspects of quality control in the collection of water quality samples are: 1) Samples collected should represent the lake site at the time the samples are collected, such that the samples produce the quality of information necessary to meet the objectives of the survey; and 2) the integrity of the samples collected is not compromised by contamination, misidentification, or improper sample handling or preservation. To help meet these quality control aspects, the transport and tracking of the samples from the field to the analytical laboratory that performs the chemistry analyses is critical. Each set of samples should include a Chain of Custody Form (COC), and if the lab uses it, an Analytical Services Request (ASR) (see Appendix B for an example). To ensure correct processing of samples, the information recorded on the COC and ASR forms must correspond to each sample in the shipment. Check with individual analytical laboratory requirements for correct labeling codes and procedures. To prevent water damage to paperwork accompanying samples to the laboratory, place all paperwork inside a sealable plastic bag and tape the bag to the underside of the cooler lid. Keep a copy of the completed COC and ASR forms in the office binder.
7.6 Literature Cited
American Public Health Association (APHA). 1998. Standard methods for the examination of water and wastewater. 20th edition. L. S.Clesceri, A. E. Greenberg, and A. D. Eaton, editors. American Public Health Association, Washington, D.C.
Baker, J. R., D. V. Peck, and D. W. Sutton (editors). 1997. Environmental Monitoring and Assessment Program Surface Waters: Field Operations Manual for Lakes. EPA/620/R- 97/001. U.S. Environmental Protection Agency, Washington D.C. http://www.epa.gov/emap/html/pubs/docs/groupdocs/surfwatr/field/97fopsman.html
EPA (US Environmental Protection Agency). 2001. Guidance for preparing standard operating procedures (SOPs): EPA QA/G-6. Washington (DC): U.S. Environmental Protection Agency. Report nr EPA/240/B-01/004. 58 p. Available at: http://www.epa.gov/quality/qs-docs/g6-final.pdf
Hoffman, R. L., T. J. Tyler, G. L. Larson, M. J. Adams, W. Wente, and S. Galvan. 2005. Sampling protocol for monitoring abiotic and biotic characteristics of mountain ponds and lakes. Chapter 2 of Book 2, Collection of Environmental Data, Section A, Water Analysis Techniques and Methods 2-A2. U.S. Department of the Interior, U.S. Geological Survey, Reston, Virginia.
O’Ney, S. E. 2005. Standard operating procedure #5: Procedure for collection of required field parameters, Version 1.0. In: Regulatory water quality monitoring protocol, Version 1.0, Appendix E. National Park Service, Greater Yellowstone Network, Bozeman, Montana.
Penoyer, P. (National Park Service Water Resources Division). 2003. Part C: Vital signs longterm aquatic monitoring projects, draft guidance on WRD required and other field parameter measurements, general monitoring methods and some design considerations in
33
preparation of a detailed study plan, 2003 Aug 6 Draft. Available from: http://science.nature.nps.gov/im/monitor/protocols/wqPartC.doc
USGS (US Geological Survey. 2003. Evaluation of alkaline persulfate digestion as an alternative to Kjeldahl digestion for determination of total and dissolved nitrogen and phosphorus in water, by Charles J. Patton and Jennifer R. Kryskalla. U.S. Geological Survey Water- Resources Investigations Report 03-4174.
USGS (US Geological Survey). 2005. National field manual for the collection of water-quality data: U.S. Geological Survey Techniques of Water-Resources Investigations, book 9, chaps. A1-A9, http://pubs.water.usgs.gov/twri9A.
WOW. 2004. Water on the Web - Monitoring Minnesota lakes on the internet and training water science technicians for the future - A national on-line curriculum using advanced technologies and real-time data. (http://waterontheweb.org). University of Minnesota Duluth.
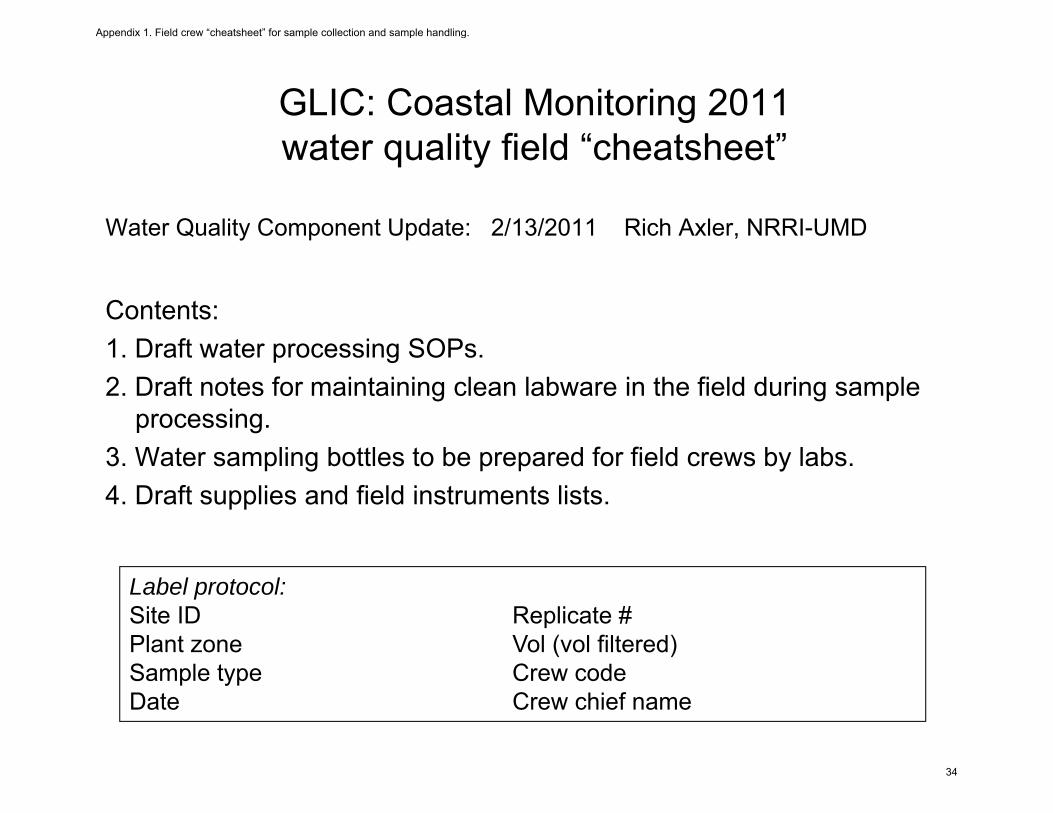
GLIC: Coastal Monitoring 2011 water quality field “cheatsheet”
Water Quality Component Update: 2/13/2011 Rich Axler, NRRI-UMD
Contents: 1. Draft water processing SOPs.2. Draft notes for maintaining clean labware in the field during sample
processing.3. Water sampling bottles to be prepared for field crews by labs. 4. Draft supplies and field instruments lists.
Label protocol: Site ID Replicate #Plant zone Vol (vol filtered)Sample type Crew codeDate Crew chief name
Appendix 1. Field crew “cheatsheet” for sample collection and sample handling.
34
Collecting water for lab/hotel processing
• Goal: collect 6 L surface water in a clean carboy (10 L) from EACH fish/bug vegetation zone (carboy is acid-washed polypropylene)
– Grab samples are collected with a 1 L acid-washed polyethylene bottle attached to a 1 m pole from the surface water.
– Grab samples are made from the boat or just upon entry to the zone, before ANY disturbance to the zone by sample crew members.
– First, collect 1 L water to rinse collection bottle and carboy thoroughly. REPEAT 3 times.
– Then collect 2 each 1 L grab samples from each fyke net (or bug D-net) location in the zone.
– Water is poured into the carboy through an acid-washed polyethylene funnel to which a 500 um screen is attached to remove any detritus.
– No sediment should be allowed into sampling containers. If sediment is disturbed, all containers with sediment should be emptied and thoroughly rinsed 3 times before starting over.
• Mix water in carboy thoroughly and dispense into an acid-washed 4L polyethylene cubitainer. Store in cooler on ice.
• Use remaining 2 L to determine turbidity tube water clarity (remix water before adding to T-tube.
35
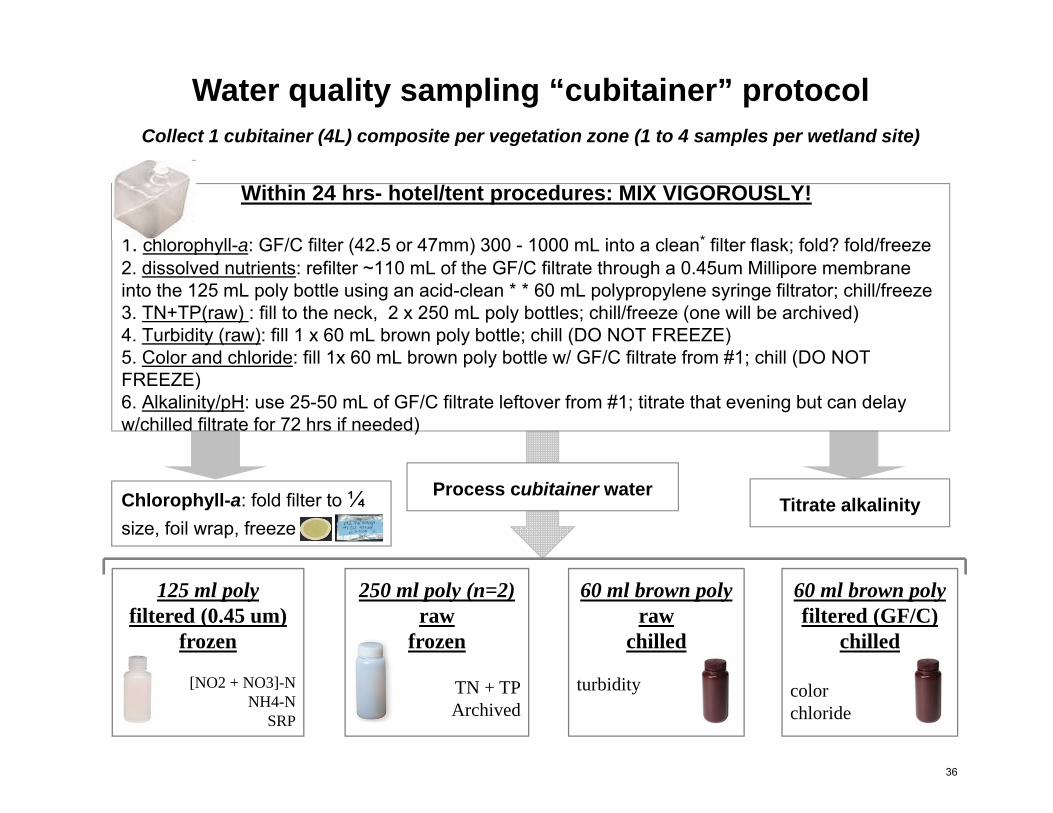
Within 24 hrs- hotel/tent procedures: MIX VIGOROUSLY!
1. chlorophyll-a: GF/C filter (42.5 or 47mm) 300 - 1000 mL into a clean* filter flask; fold? fold/freeze2. dissolved nutrients: refilter ~110 mL of the GF/C filtrate through a 0.45um Millipore membrane into the 125 mL poly bottle using an acid-clean * * 60 mL polypropylene syringe filtrator; chill/freeze3. TN+TP(raw) : fill to the neck, 2 x 250 mL poly bottles; chill/freeze (one will be archived)4. Turbidity (raw): fill 1 x 60 mL brown poly bottle; chill (DO NOT FREEZE)5. Color and chloride: fill 1x 60 mL brown poly bottle w/ GF/C filtrate from #1; chill (DO NOT FREEZE)6. Alkalinity/pH: use 25-50 mL of GF/C filtrate leftover from #1; titrate that evening but can delay w/chilled filtrate for 72 hrs if needed)
Water quality sampling “cubitainer” protocolCollect 1 cubitainer (4L) composite per vegetation zone (1 to 4 samples per wetland site)
250 ml poly (n=2)raw
frozen
TN + TPArchived
125 ml polyfiltered (0.45 um)
frozen
[NO2 + NO3]-NNH4-N
SRP
60 ml brown polyfiltered (GF/C)
chilled
colorchloride
60 ml brown polyraw
chilled
turbidity
Chlorophyll-a: fold filter to ¼size, foil wrap, freeze
Process cubitainer waterTitrate alkalinity
36
Notes
• Fill bottles only as far as the neck of the bottle, especially when freezing.
• Chlorophyll filters should be folded into quarters using forceps, wrapped in foil, labeled with lab tape (don’t forget volume filtered), and frozen. Store in waterproof bottle. Be aware that acids will degrade chlorophyll so don’t handle with fingers and be sure to extra rinse.
FILTER CLEANING PROCEDURES (assume pre-cleaned w/acid prior to start):• Large filtrator receiving flasks: rinse with DIW 3x, and shake out well before filtering water
for chlorophyll-a through GF/C glass fiber filters. Pre-rinse the GF/Cs with ~20 mL squirt of DI water and then discard this filtrate before filtering a measured amount of well-shaken sample water.
• Syringe filtrator apparatus + 0.45 um millipore filter for dissolved nutrients: – Only “push” water through filter – if you suck water, the filter may tear and you won’t know it; – First push a few mL of 0.1 N HCl through the filter; then remove syringe, load with ~10mL of DIW
and push this through the filter.– Remove syringe again to draw in GF/C filtrate, then pressure push it directly through filter
apparatus and into 125 mL pre-cleaned bottle. – Change filters and clean the apparatus between samples from different vegetation zones.
• Labs should prepare sets of pre-cleaned bottles in zip-lok bag packets: 2 x 250Ml, 1x 125mL, and 2 x 60mL brown plastic bottles.
• If necessary, clean new ones by rinsing with 0.1N HCl (~1% of full strength) followed by at least 3 DIW rinses.
37
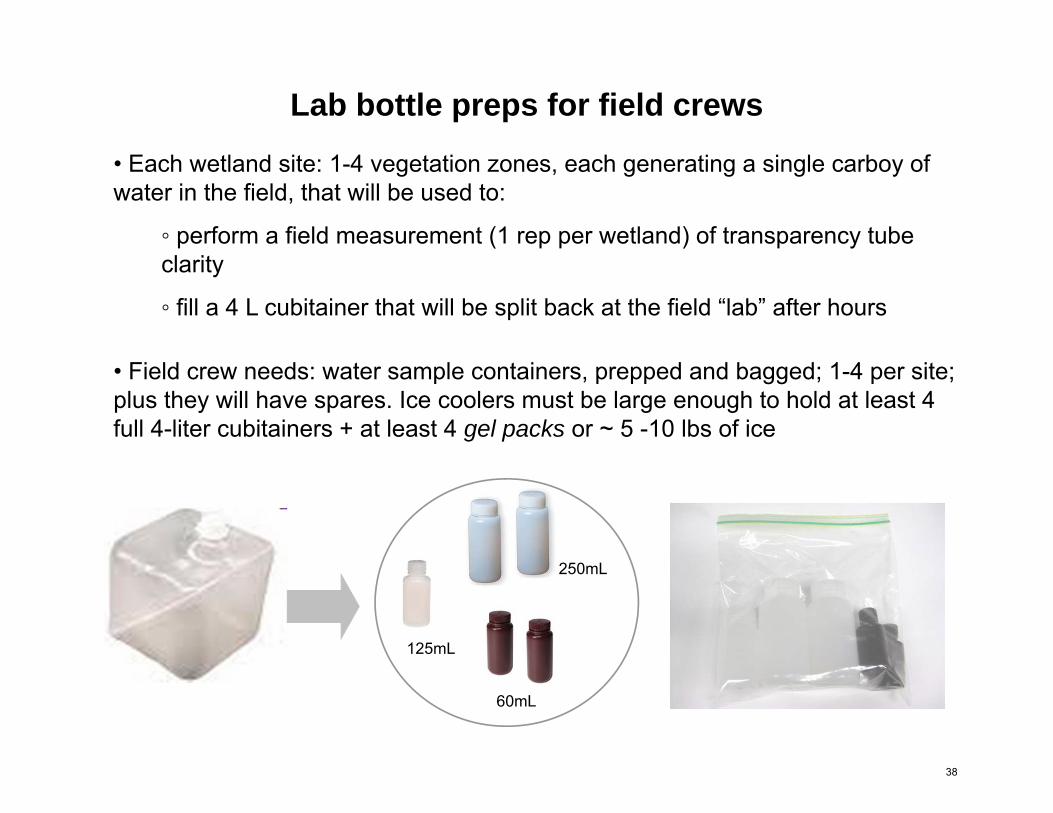
Lab bottle preps for field crews
• Each wetland site: 1-4 vegetation zones, each generating a single carboy of water in the field, that will be used to:
◦ perform a field measurement (1 rep per wetland) of transparency tube clarity
◦ fill a 4 L cubitainer that will be split back at the field “lab” after hours
• Field crew needs: water sample containers, prepped and bagged; 1-4 per site; plus they will have spares. Ice coolers must be large enough to hold at least 4 full 4-liter cubitainers + at least 4 gel packs or ~ 5 -10 lbs of ice
60mL
125mL
250mL
38
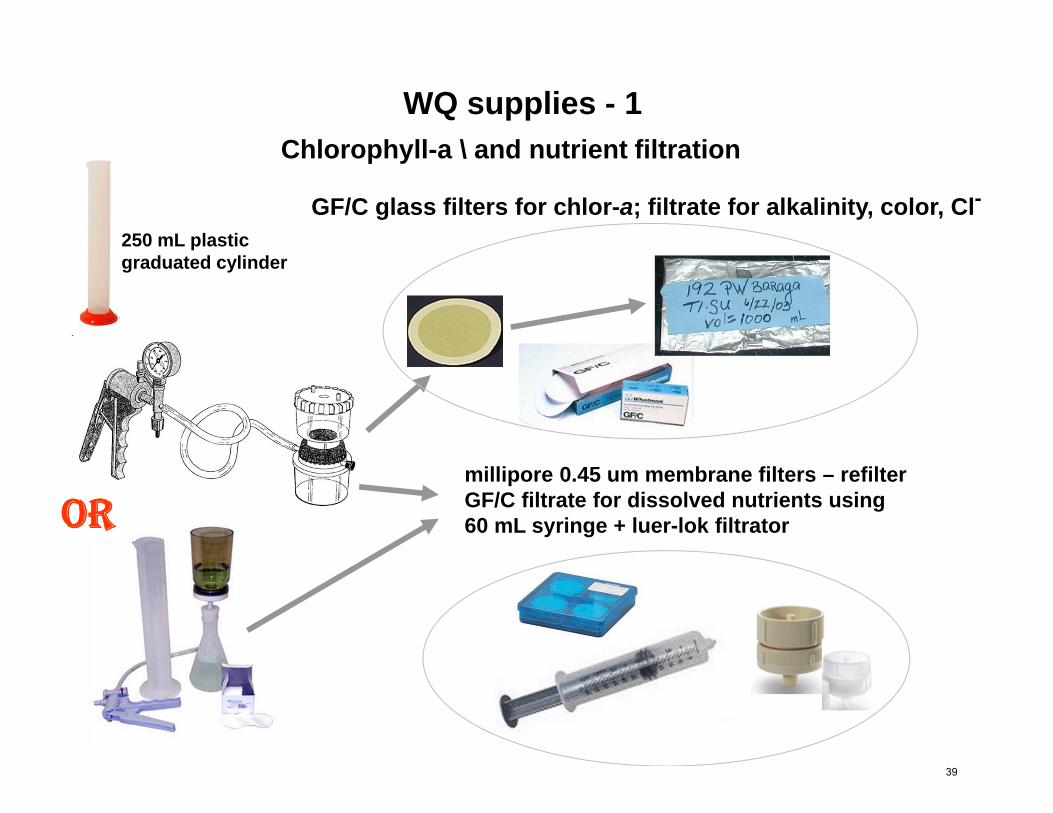
WQ supplies - 1Chlorophyll-a \ and nutrient filtration
OR
250 mL plastic graduated cylinder
GF/C glass filters for chlor-a; filtrate for alkalinity, color, Cl-
millipore 0.45 um membrane filters – refilter GF/C filtrate for dissolved nutrients using 60 mL syringe + luer-lok filtrator
39
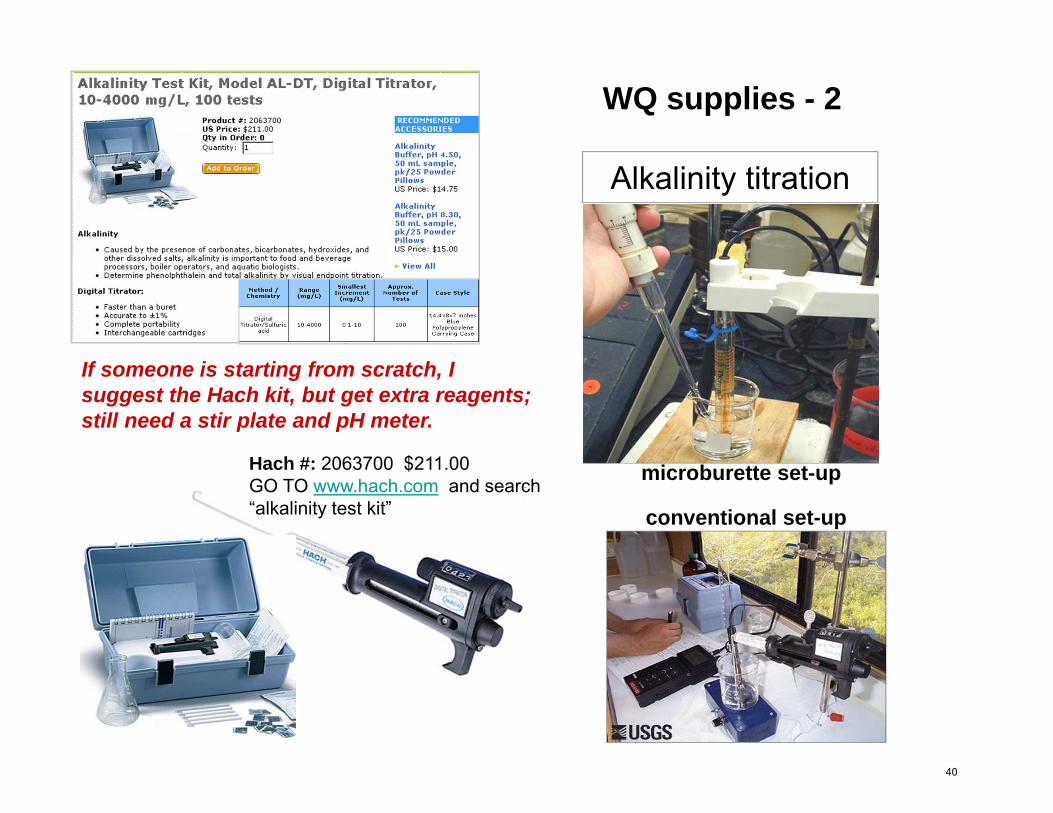
Alkalinity titration
conventional set-up
microburette set-upHach #: 2063700 $211.00GO TO www.hach.com and search “alkalinity test kit”
If someone is starting from scratch, I suggest the Hach kit, but get extra reagents; still need a stir plate and pH meter.
WQ supplies - 2
40
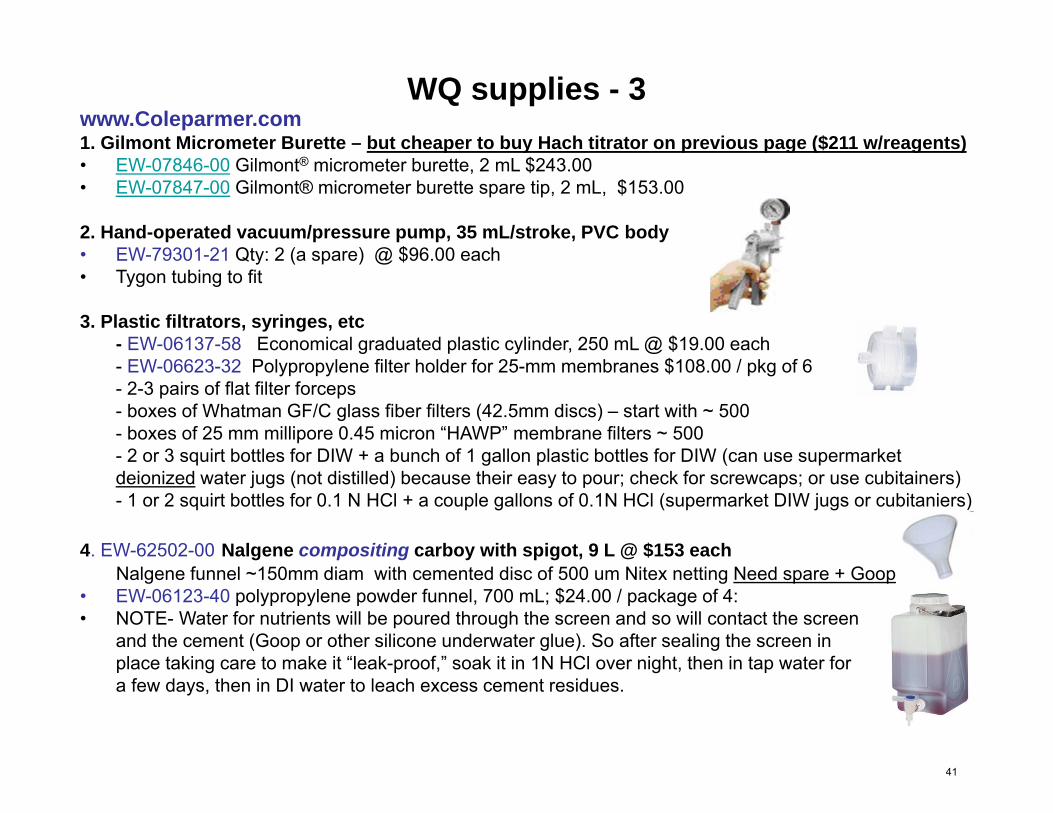
WQ supplies - 3www.Coleparmer.com1. Gilmont Micrometer Burette – but cheaper to buy Hach titrator on previous page ($211 w/reagents)• EW-07846-00 Gilmont® micrometer burette, 2 mL $243.00• EW-07847-00 Gilmont® micrometer burette spare tip, 2 mL, $153.00
2. Hand-operated vacuum/pressure pump, 35 mL/stroke, PVC body• EW-79301-21 Qty: 2 (a spare) @ $96.00 each• Tygon tubing to fit
3. Plastic filtrators, syringes, etc - EW-06137-58 Economical graduated plastic cylinder, 250 mL @ $19.00 each- EW-06623-32 Polypropylene filter holder for 25-mm membranes $108.00 / pkg of 6 - 2-3 pairs of flat filter forceps- boxes of Whatman GF/C glass fiber filters (42.5mm discs) – start with ~ 500- boxes of 25 mm millipore 0.45 micron “HAWP” membrane filters ~ 500- 2 or 3 squirt bottles for DIW + a bunch of 1 gallon plastic bottles for DIW (can use supermarket deionized water jugs (not distilled) because their easy to pour; check for screwcaps; or use cubitainers)- 1 or 2 squirt bottles for 0.1 N HCl + a couple gallons of 0.1N HCl (supermarket DIW jugs or cubitaniers)
4. EW-62502-00 Nalgene compositing carboy with spigot, 9 L @ $153 each Nalgene funnel ~150mm diam with cemented disc of 500 um Nitex netting Need spare + Goop
• EW-06123-40 polypropylene powder funnel, 700 mL; $24.00 / package of 4:• NOTE- Water for nutrients will be poured through the screen and so will contact the screen
and the cement (Goop or other silicone underwater glue). So after sealing the screen in place taking care to make it “leak-proof,” soak it in 1N HCl over night, then in tap water for a few days, then in DI water to leach excess cement residues.
41
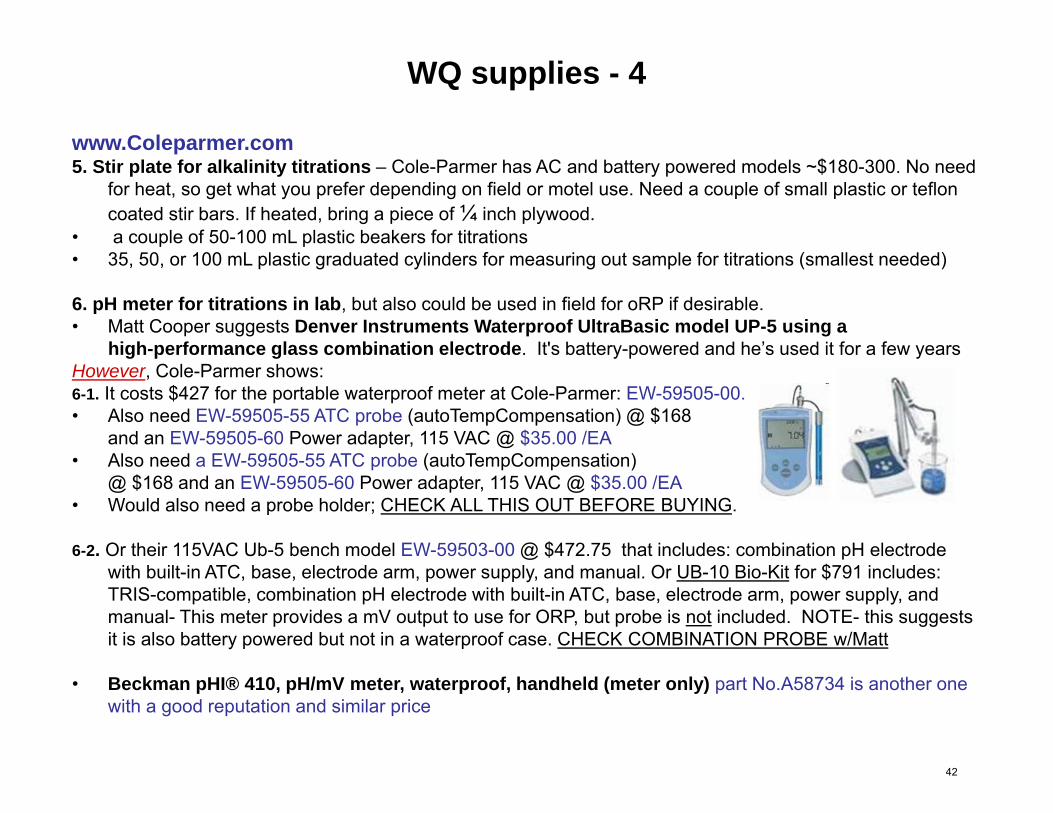
www.Coleparmer.com5. Stir plate for alkalinity titrations – Cole-Parmer has AC and battery powered models ~$180-300. No need
for heat, so get what you prefer depending on field or motel use. Need a couple of small plastic or teflon coated stir bars. If heated, bring a piece of ¼ inch plywood.
• a couple of 50-100 mL plastic beakers for titrations• 35, 50, or 100 mL plastic graduated cylinders for measuring out sample for titrations (smallest needed)
6. pH meter for titrations in lab, but also could be used in field for oRP if desirable. • Matt Cooper suggests Denver Instruments Waterproof UltraBasic model UP-5 using a
high-performance glass combination electrode. It's battery-powered and he’s used it for a few years However, Cole-Parmer shows:6-1. It costs $427 for the portable waterproof meter at Cole-Parmer: EW-59505-00.• Also need EW-59505-55 ATC probe (autoTempCompensation) @ $168
and an EW-59505-60 Power adapter, 115 VAC @ $35.00 /EA • Also need a EW-59505-55 ATC probe (autoTempCompensation)
@ $168 and an EW-59505-60 Power adapter, 115 VAC @ $35.00 /EA • Would also need a probe holder; CHECK ALL THIS OUT BEFORE BUYING.
6-2. Or their 115VAC Ub-5 bench model EW-59503-00 @ $472.75 that includes: combination pH electrode with built-in ATC, base, electrode arm, power supply, and manual. Or UB-10 Bio-Kit for $791 includes: TRIS-compatible, combination pH electrode with built-in ATC, base, electrode arm, power supply, and manual- This meter provides a mV output to use for ORP, but probe is not included. NOTE- this suggests it is also battery powered but not in a waterproof case. CHECK COMBINATION PROBE w/Matt
• Beckman pHI® 410, pH/mV meter, waterproof, handheld (meter only) part No.A58734 is another one with a good reputation and similar price
WQ supplies - 4
42
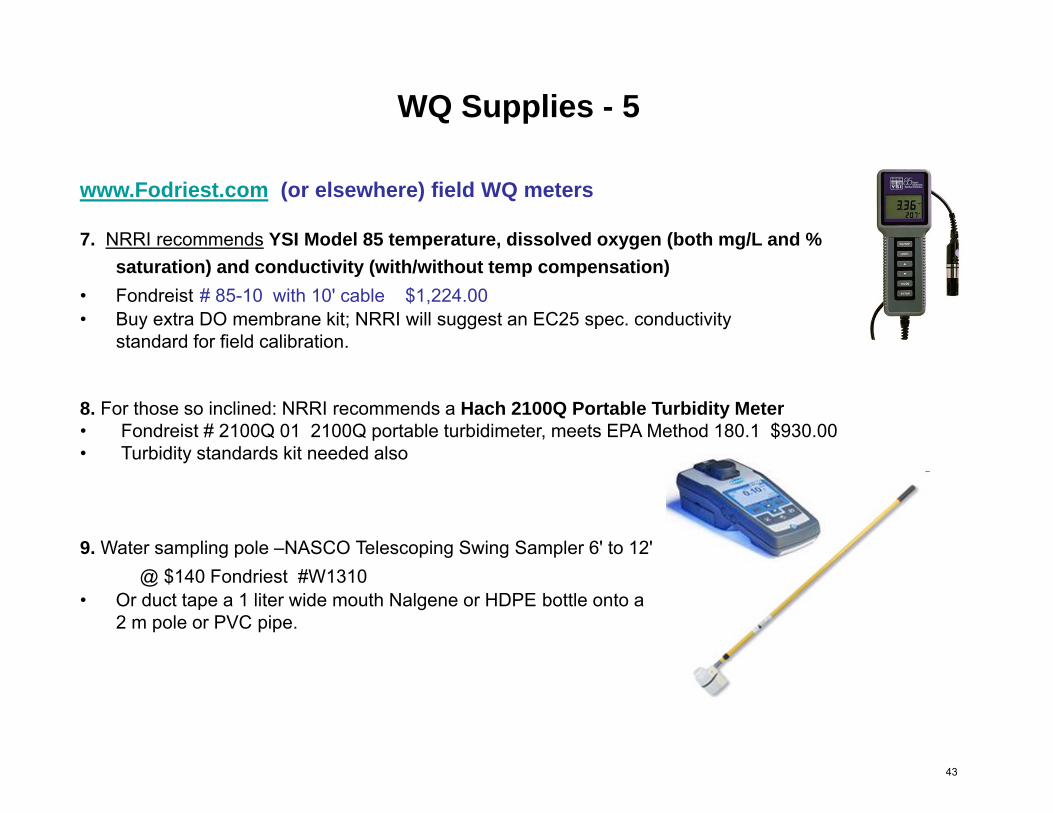
WQ Supplies - 5
www.Fodriest.com (or elsewhere) field WQ meters
7. NRRI recommends YSI Model 85 temperature, dissolved oxygen (both mg/L and %
saturation) and conductivity (with/without temp compensation)
• Fondreist # 85-10 with 10' cable $1,224.00• Buy extra DO membrane kit; NRRI will suggest an EC25 spec. conductivity
standard for field calibration.
8. For those so inclined: NRRI recommends a Hach 2100Q Portable Turbidity Meter • Fondreist # 2100Q 01 2100Q portable turbidimeter, meets EPA Method 180.1 $930.00• Turbidity standards kit needed also
9. Water sampling pole –NASCO Telescoping Swing Sampler 6' to 12'@ $140 Fondriest #W1310
• Or duct tape a 1 liter wide mouth Nalgene or HDPE bottle onto a 2 m pole or PVC pipe.
43