uk coastal monitoring and forecasting
TRANSCRIPT

UK Coastal Monitoring and Forecasting
2014 Annual Report for the UK National Tide Gauge Network

UKCMF Annual Tide Gauge Report 2014
UK Coastal Monitoring and Forecasting: Annual Report for 2014 for the UK National Tide Gauge Network
Contributors to the Annual Report Paul McGarrigle, BODC Editor Elizabeth Bradshaw, BODC BODC Sea Level Data Manager Les Bradley, NOC Instrument documentation and site information Geoff Hargreaves, NOC Tide Gauge Engineer Libby Macleod, BODC Tide Gauge Data Sets Colin Bell, NOC Tide Gauge Data Products Angela Hibbert, NOC Tide Gauge Data Products Richard Downer, BODC Web Development and Management Kevin Horsburgh, NOC Operational Tide-Surge Models Jane Williams, NOC Operational Tide-Surge Models Lesley Rickards, BODC/PSMSL Director of PSMSL Thanks also to all those involved in maintenance of the network, data retrieval, processing, quality control and delivery. Front cover: Creative Commons image courtesy of Tony Hammond (antonychammond) on Flickr (CC BY-NC-SA 2.0) All maps, unless stated otherwise, are based on Ordnance Survey material with the permission of Ordnance Survey on behalf of the Controller of Her Majesty's Stationery Office ©Crown copyright. Unauthorised reproduction infringes Crown copyright and may lead to prosecution or civil proceedings. NERC 100017897 2014
2
UKCMF Annual Tide Gauge Report 2014
Contents
Foreword 5
Tide Gauge Instruments 6
Data Processing 7
Calculating Statistics 10
UK Tide Gauge Network Map 11
UK Tide Gauge Data Completeness (%), January to December 2014 12
UK Tide Gauge Data Quality (%), January to March 2014 13
UK Tide Gauge Data Quality (%), April to June 2014 14
UK Tide Gauge Data Quality (%), July to September 2014 15
UK Tide Gauge Data Quality (%), October to December 2014 16
Requests to BODC for UKCMF Data in 2014, Data Downloads 17
Requests to BODC for UKCMF Data in 2014 by User Category 18
Aberdeen 19
Avonmouth Portbury 22
Bangor 25
Barmouth 28
Bournemouth 31
Cromer 34
Dover 37
Fishguard 40
Harwich 43
Heysham 46
Hinkley Point 49
Holyhead 52
Ilfracombe 55
Immingham 58
Port Erin (Isle of Man) 61
Port Ellen (Isle of Islay) 64
St Helier (Jersey) 67
Kinlochbervie 70
Leith 73
Lerwick 76
3
UKCMF Annual Tide Gauge Report 2014 Liverpool 79
Llandudno 82
Lowestoft 85
Milford Haven 88
Millport 91
Mumbles 94
Newhaven 97
Newlyn 100
Newport 103
North Shields 106
Plymouth Devonport 109
Portpatrick 112
Portrush 115
Portsmouth 118
Sheerness 121
St Mary’s (Isles of Scilly) 124
Stornoway 127
Tobermory 130
Ullapool 133
Weymouth 136
Whitby 139
Wick 142
Workington 145
4
UKCMF Annual Tide Gauge Report 2014
Foreword UK Coastal Monitoring and Forecasting (UKCMF) is a partnership between the Environment Agency, Scottish Environment Protection Agency, Natural Resources Wales and Rivers Agency Northern Ireland. Working in partnership, we define the standards and performance for coastal flood forecasting and monitoring for the UK. We use the same strategic coastal models and data sources as inputs to locally developed systems to provide the operational flood forecasting and monitoring service within each of our national boundaries. Central to UKCMF is the UK strategic Tide Gauge Network. This network consists of 43 strategically important tide gauges that continually record sea level around the UK coastline. The gauges primary use is in operational coastal flood forecasting but they also provide important data for a variety of other uses such as long-term sea level monitoring studies. The data from the network is Quality Controlled and archived by British Oceanographic Data Centre from where it is freely available (https://www.bodc.ac.uk/data/online_delivery/ntslf) BODC work with UKCMF ensuring that data from our strategic tide gauge network is checked and archived to a common internationally recognised standard and that the archive record is easily accessible for all those that want to use it. This annual report for 2014 explains the data management and quality control processes undertaken, gives details and maps of the location of each gauge, and statistics of the data at each site. The statistics include a monthly summary of the data completeness and quality throughout the year for each site. Also included is a summary of data downloads from the website for the entire UKCMF gauge network. I hope you find it both interesting and useful. Liz Anspoks Environment Agency Flood Detection and Forecasting Manager UKCMF Leadership Group Chair
5
UKCMF Annual Tide Gauge Report 2014
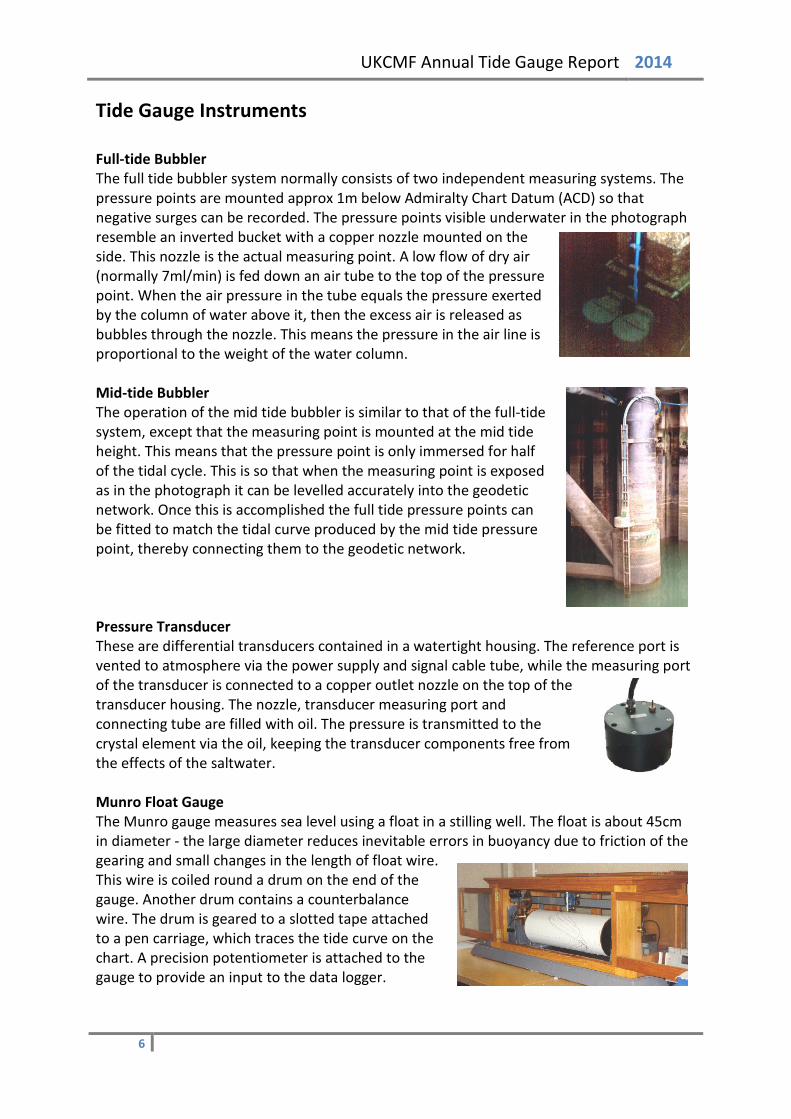
Tide Gauge Instruments Full-tide Bubbler The full tide bubbler system normally consists of two independent measuring systems. The pressure points are mounted approx 1m below Admiralty Chart Datum (ACD) so that negative surges can be recorded. The pressure points visible underwater in the photograph resemble an inverted bucket with a copper nozzle mounted on the side. This nozzle is the actual measuring point. A low flow of dry air (normally 7ml/min) is fed down an air tube to the top of the pressure point. When the air pressure in the tube equals the pressure exerted by the column of water above it, then the excess air is released as bubbles through the nozzle. This means the pressure in the air line is proportional to the weight of the water column. Mid-tide Bubbler The operation of the mid tide bubbler is similar to that of the full-tide system, except that the measuring point is mounted at the mid tide height. This means that the pressure point is only immersed for half of the tidal cycle. This is so that when the measuring point is exposed as in the photograph it can be levelled accurately into the geodetic network. Once this is accomplished the full tide pressure points can be fitted to match the tidal curve produced by the mid tide pressure point, thereby connecting them to the geodetic network. Pressure Transducer These are differential transducers contained in a watertight housing. The reference port is vented to atmosphere via the power supply and signal cable tube, while the measuring port of the transducer is connected to a copper outlet nozzle on the top of the transducer housing. The nozzle, transducer measuring port and connecting tube are filled with oil. The pressure is transmitted to the crystal element via the oil, keeping the transducer components free from the effects of the saltwater. Munro Float Gauge The Munro gauge measures sea level using a float in a stilling well. The float is about 45cm in diameter - the large diameter reduces inevitable errors in buoyancy due to friction of the gearing and small changes in the length of float wire. This wire is coiled round a drum on the end of the gauge. Another drum contains a counterbalance wire. The drum is geared to a slotted tape attached to a pen carriage, which traces the tide curve on the chart. A precision potentiometer is attached to the gauge to provide an input to the data logger.
6
UKCMF Annual Tide Gauge Report 2014
Data Tracking Done using Oracle, e.g. Time Series Inventory
Archiving Original Data Data arriving at BODC are
securely archived
Compiling Metadata Metadata describing the
data are inserted into Oracle tables
Data Restrictions Appropriate data access
restrictions are set up and documented
Documentation Comprehensive
documentation is produced describing data
Checking Files/metadata checked to ensure they conform
to strict standards
Reformatting Data are converted into a standard format (NetCDF)
Archiving Final Data Final versions of files archived by Database
Administrator
Screening Data are quality
controlled and flagged. Values are NOT altered
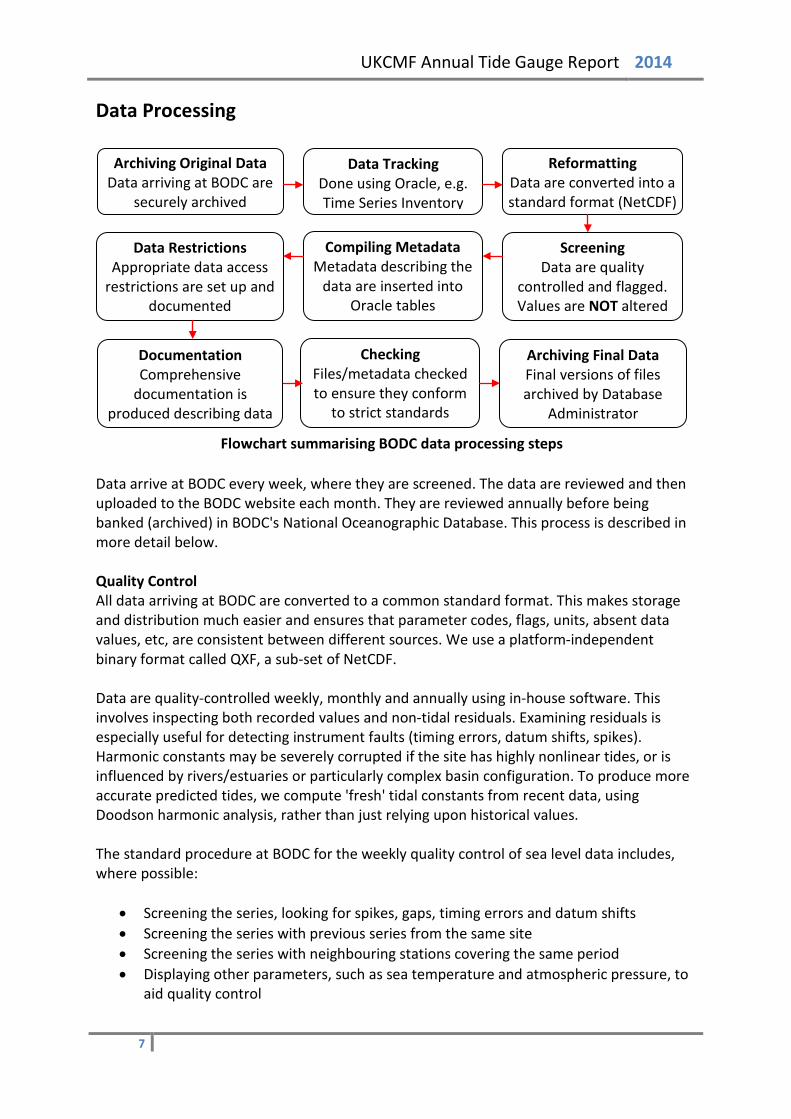
Flowchart summarising BODC data processing steps
Data Processing
Data arrive at BODC every week, where they are screened. The data are reviewed and then uploaded to the BODC website each month. They are reviewed annually before being banked (archived) in BODC's National Oceanographic Database. This process is described in more detail below. Quality Control All data arriving at BODC are converted to a common standard format. This makes storage and distribution much easier and ensures that parameter codes, flags, units, absent data values, etc, are consistent between different sources. We use a platform-independent binary format called QXF, a sub-set of NetCDF. Data are quality-controlled weekly, monthly and annually using in-house software. This involves inspecting both recorded values and non-tidal residuals. Examining residuals is especially useful for detecting instrument faults (timing errors, datum shifts, spikes). Harmonic constants may be severely corrupted if the site has highly nonlinear tides, or is influenced by rivers/estuaries or particularly complex basin configuration. To produce more accurate predicted tides, we compute 'fresh' tidal constants from recent data, using Doodson harmonic analysis, rather than just relying upon historical values. The standard procedure at BODC for the weekly quality control of sea level data includes, where possible:
• Screening the series, looking for spikes, gaps, timing errors and datum shifts • Screening the series with previous series from the same site • Screening the series with neighbouring stations covering the same period • Displaying other parameters, such as sea temperature and atmospheric pressure, to
aid quality control
7
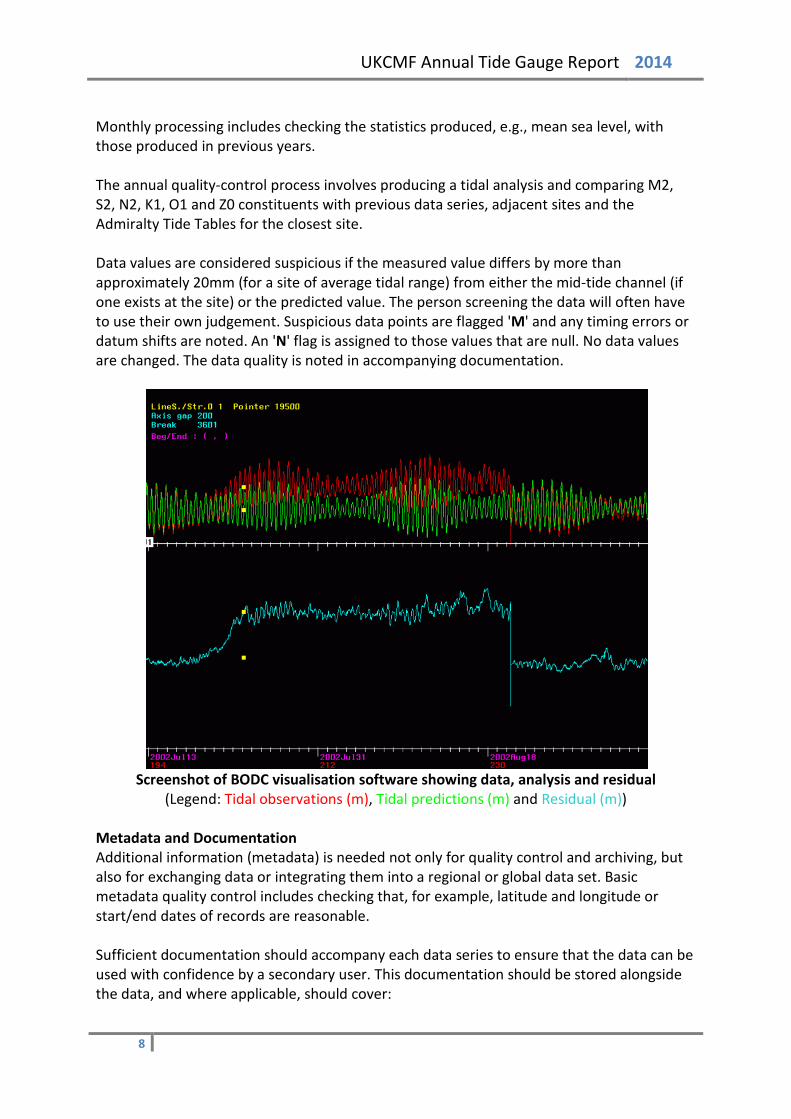
UKCMF Annual Tide Gauge Report 2014 Monthly processing includes checking the statistics produced, e.g., mean sea level, with those produced in previous years. The annual quality-control process involves producing a tidal analysis and comparing M2, S2, N2, K1, O1 and Z0 constituents with previous data series, adjacent sites and the Admiralty Tide Tables for the closest site. Data values are considered suspicious if the measured value differs by more than approximately 20mm (for a site of average tidal range) from either the mid-tide channel (if one exists at the site) or the predicted value. The person screening the data will often have to use their own judgement. Suspicious data points are flagged 'M' and any timing errors or datum shifts are noted. An 'N' flag is assigned to those values that are null. No data values are changed. The data quality is noted in accompanying documentation.
Screenshot of BODC visualisation software showing data, analysis and residual
(Legend: Tidal observations (m), Tidal predictions (m) and Residual (m)) Metadata and Documentation Additional information (metadata) is needed not only for quality control and archiving, but also for exchanging data or integrating them into a regional or global data set. Basic metadata quality control includes checking that, for example, latitude and longitude or start/end dates of records are reasonable. Sufficient documentation should accompany each data series to ensure that the data can be used with confidence by a secondary user. This documentation should be stored alongside the data, and where applicable, should cover:
8

UKCMF Annual Tide Gauge Report 2014 Site information
• Brief description of location of tide gauge peculiar characteristics of the tide gauge site (for example, complex local geography, seiching, silting of the harbour, river mouths) (including maps, photos)
• Description of tide gauge benchmarks, their history and method of determination (including maps, photos)
• Datum relationships - Measurements must be relative to a fixed and permanent local tide gauge bench mark (TGBM). This should be connected to auxiliary marks to guard against its movement or destruction. Connections between the TGBM and the gauge zero should be made to an accuracy of a few millimetres regularly (e.g. annually)
Data sampling and processing details
• Sampling scheme e.g. continuous recording, instantaneous, averaged • Interval between samples and duration of individual samples (raw data) • Nominal interval of processed data • Gaps in the data record • Timing and/or datum corrections applied • De-spiking/smoothing/interpolating methods and editing procedures
Instrument information
• Instrument description, manufacturer, model, principle of measurement, method of recording - refer to publication or briefly describe
• Instrument modifications and their effect on the data • Method and times of calibration, calibration factors • Frequency of cleaning, control of biological fouling • Operational history • Pertinent instrument characteristics; for example, for a conventional stilling well,
information should include well diameter, orifice depth below mean water level and orifice height above sea bed; for a bubbler gauge - tube length, tube diameter, orifice diameter, density value used to convert to elevation, acceleration due to gravity and the formula used to compensate for tube length.
Auditing and Banking The metadata and documentation are checked before banking. A Matlab script cross-references the data header files against the metadata to ensure no data-entry errors have been made. Another script checks the data files to make sure timing errors, out-of-range values and nulls have been dealt with. Datasets that have been completely processed are audited. A second data scientist completes a series of final checks. Any differences of opinion are highlighted and re-examined. Files are then archived and marked as 'banked'. Finally, monthly files are concatenated into yearly files and the yearly file metadata are banked in a database.
9
UKCMF Annual Tide Gauge Report 2014
Calculating Statistics Edserplo calculates four types of summary information
• a history of when the tide gauge has been in operation (“history”) • monthly extremes (“extremes”), relative to Ordnance Datum Newlyn (ODN) • monthly extreme surges (“surges”) • monthly and daily mean sea level (“MSL”) relative to ODN
Gaps greater than 4.1 hours in the primary channel are registered as gaps in the history. Extremes are the maximum and minimum calculated over all sampled data during the month. This excludes any interpolated data but may include rapidly sampled data. Extreme surges (residuals) are calculated in the same way from tidal residuals. Tidal residuals are defined to be the measured water level minus the predicted tide. The predictions derive from the database of tidal constants maintained by NOC’s Applications Group (as defined at the time of the calculation) for the ports of the UK and elsewhere. Mean Sea Level is calculated from a filter working on quarter-hourly values derived from one or more cubic splines applied to the raw data. The filter is a convolution of Vassie’s 03B filter, which converts 15-minute data to hourly values, and Doodson’s X0 filter. Splines are not applied across gaps as defined above. Short gaps can therefore lead to the loss of a day of output data (the half length of the filter is 91 and a day is 96 samples). Provided there are some daily (@12:00Z) values these are then averaged to provide the monthly value. The Permanent Service for Mean Sea Level (PSMSL) recommend refraining from computing a mean sea level value there isn't sufficient data available. Consequently, the monthly statistics given in this report do not feature a mean sea level value for any month where more than 15 days of data are missing (the values given for extremes and surges for these months should be treated with caution). Similarly, there is no yearly mean sea level figure given if more than two monthly mean values are missing and the statistics pages below reflect that. If there are 11 monthly means available, the annual mean is calculated from a weighted average of these (the weight for each month being the number of days for which readings exist). Data Completeness Monthly percentage values for data completeness are given for delayed mode data delivery, where data from the primary data channel are quality controlled weekly. Data Quality Monthly percentage values for data quality are given for the primary and secondary channels, which have been quality controlled to GLOSS delayed mode data standards (with discrepancies of over 20mm flagged, depending on site). For each month, a highlighted cell indicates the best performing channel. The primary channel is Channel 2 at all sites, apart from Hinkley and Leith where Channel 1 is the primary channel.
10
UKCMF Annual Tide Gauge Report 2014
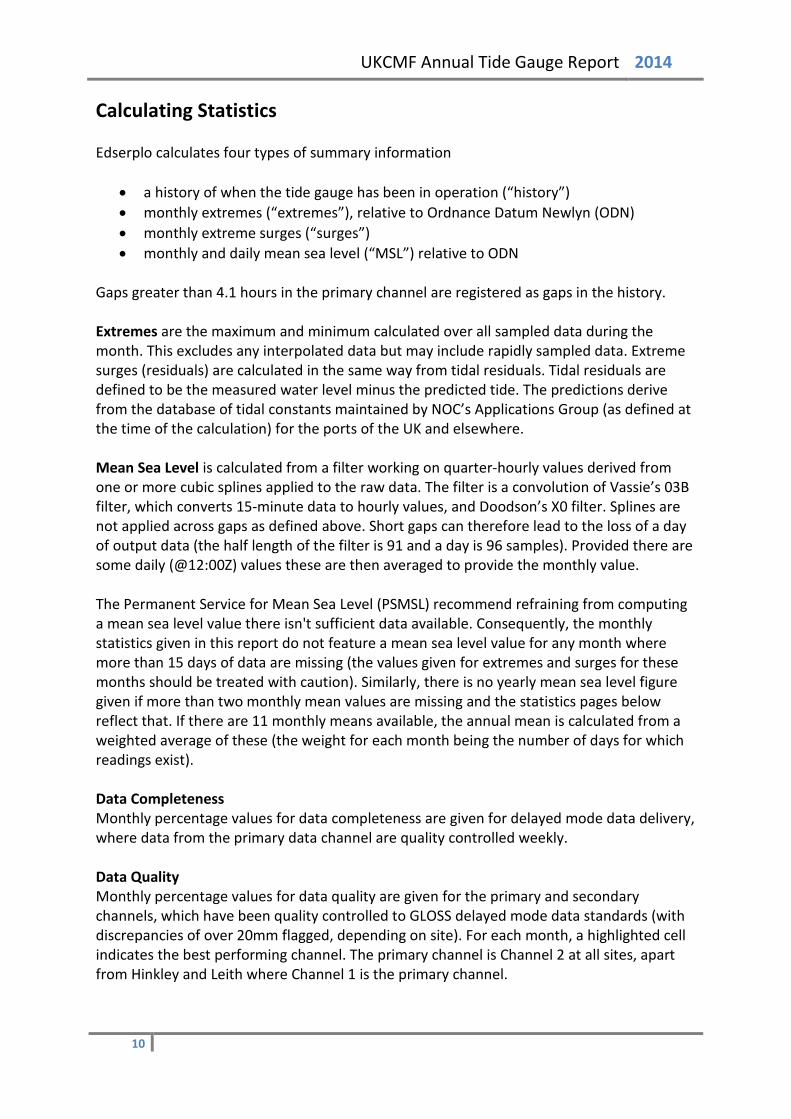
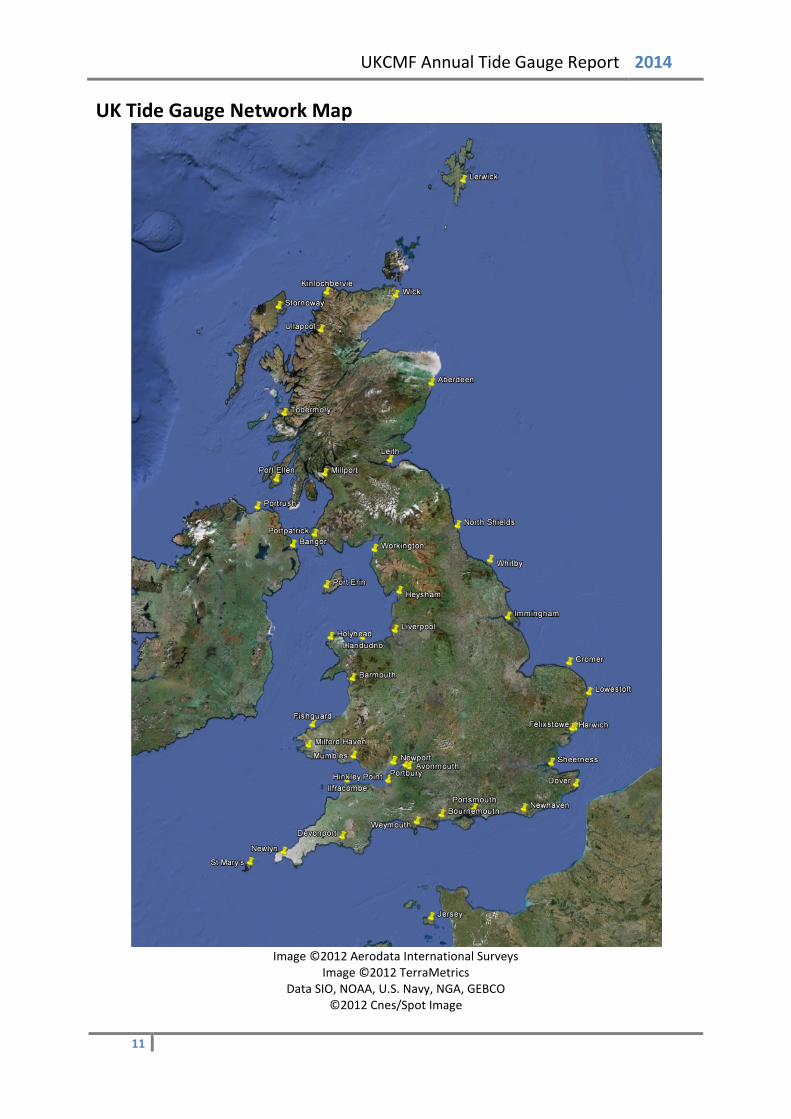
UK Tide Gauge Network Map
Image ©2012 Aerodata International Surveys
Image ©2012 TerraMetrics Data SIO, NOAA, U.S. Navy, NGA, GEBCO
©2012 Cnes/Spot Image
11
UKCMF Annual Tide Gauge Report 2014
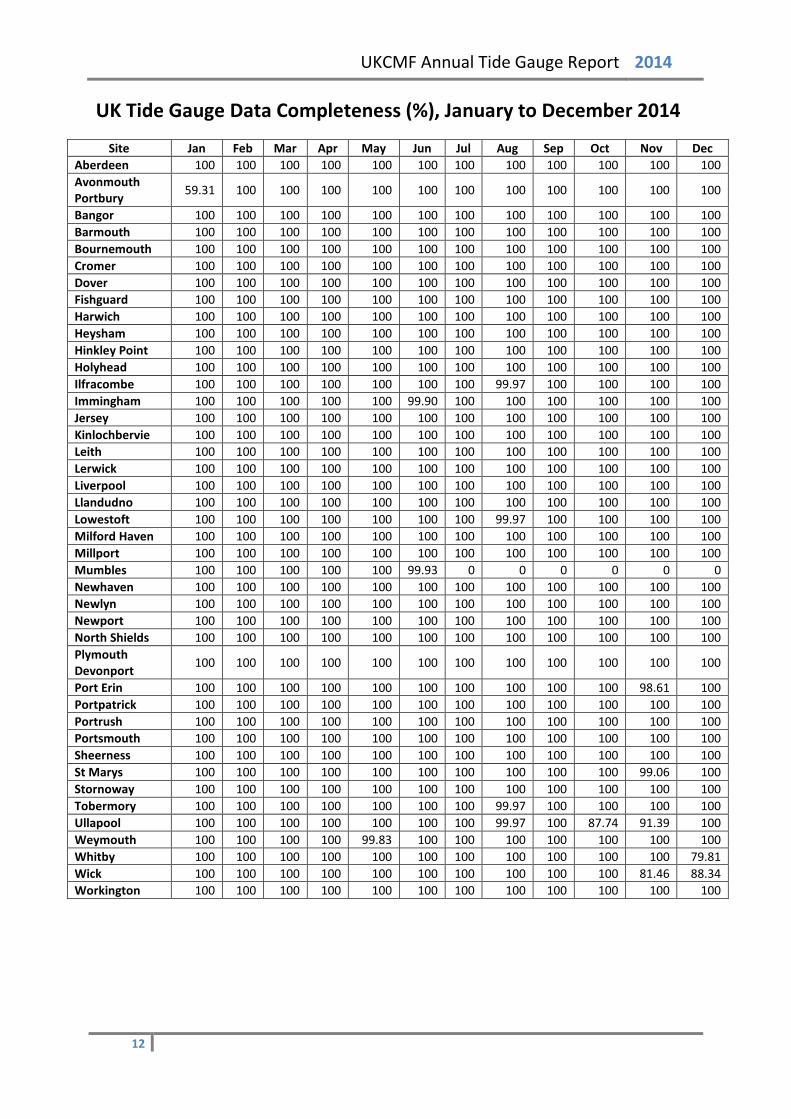
UK Tide Gauge Data Completeness (%), January to December 2014
Site Jan Feb Mar Apr May Jun Jul Aug Sep Oct Nov Dec Aberdeen 100 100 100 100 100 100 100 100 100 100 100 100 Avonmouth Portbury 59.31 100 100 100 100 100 100 100 100 100 100 100
Bangor 100 100 100 100 100 100 100 100 100 100 100 100 Barmouth 100 100 100 100 100 100 100 100 100 100 100 100 Bournemouth 100 100 100 100 100 100 100 100 100 100 100 100 Cromer 100 100 100 100 100 100 100 100 100 100 100 100 Dover 100 100 100 100 100 100 100 100 100 100 100 100 Fishguard 100 100 100 100 100 100 100 100 100 100 100 100 Harwich 100 100 100 100 100 100 100 100 100 100 100 100 Heysham 100 100 100 100 100 100 100 100 100 100 100 100 Hinkley Point 100 100 100 100 100 100 100 100 100 100 100 100 Holyhead 100 100 100 100 100 100 100 100 100 100 100 100 Ilfracombe 100 100 100 100 100 100 100 99.97 100 100 100 100 Immingham 100 100 100 100 100 99.90 100 100 100 100 100 100 Jersey 100 100 100 100 100 100 100 100 100 100 100 100 Kinlochbervie 100 100 100 100 100 100 100 100 100 100 100 100 Leith 100 100 100 100 100 100 100 100 100 100 100 100 Lerwick 100 100 100 100 100 100 100 100 100 100 100 100 Liverpool 100 100 100 100 100 100 100 100 100 100 100 100 Llandudno 100 100 100 100 100 100 100 100 100 100 100 100 Lowestoft 100 100 100 100 100 100 100 99.97 100 100 100 100 Milford Haven 100 100 100 100 100 100 100 100 100 100 100 100 Millport 100 100 100 100 100 100 100 100 100 100 100 100 Mumbles 100 100 100 100 100 99.93 0 0 0 0 0 0 Newhaven 100 100 100 100 100 100 100 100 100 100 100 100 Newlyn 100 100 100 100 100 100 100 100 100 100 100 100 Newport 100 100 100 100 100 100 100 100 100 100 100 100 North Shields 100 100 100 100 100 100 100 100 100 100 100 100 Plymouth Devonport 100 100 100 100 100 100 100 100 100 100 100 100
Port Erin 100 100 100 100 100 100 100 100 100 100 98.61 100 Portpatrick 100 100 100 100 100 100 100 100 100 100 100 100 Portrush 100 100 100 100 100 100 100 100 100 100 100 100 Portsmouth 100 100 100 100 100 100 100 100 100 100 100 100 Sheerness 100 100 100 100 100 100 100 100 100 100 100 100 St Marys 100 100 100 100 100 100 100 100 100 100 99.06 100 Stornoway 100 100 100 100 100 100 100 100 100 100 100 100 Tobermory 100 100 100 100 100 100 100 99.97 100 100 100 100 Ullapool 100 100 100 100 100 100 100 99.97 100 87.74 91.39 100 Weymouth 100 100 100 100 99.83 100 100 100 100 100 100 100 Whitby 100 100 100 100 100 100 100 100 100 100 100 79.81 Wick 100 100 100 100 100 100 100 100 100 100 81.46 88.34 Workington 100 100 100 100 100 100 100 100 100 100 100 100
12

UKCMF Annual Tide Gauge Report 2014
UK Tide Gauge Data Quality (%), January to March 2014
Site January February March Primary Secondary Primary Secondary Primary Secondary
Aberdeen 82.16 74.93 100 100 100 100 Avonmouth Portbury 83.74 91.33 99.89 99.89 100 100 Bangor 88.88 0 94.90 0 100 18.68 Barmouth 96.20 96.84 88.91 89.21 93.88 93.88 Bournemouth 0 0 0 0 0 0 Cromer 27.05 100 22.06 100 39.85 100 Dover 12.43 100 7.63 100 13.64 100 Fishguard 100 99.97 100 100 100 100 Harwich 16.30 100 16.82 100 67.84 100 Heysham 93.48 93.45 80.73 78.50 99.83 3.66 Hinkley Point 97.35 0 96.84 0 90.79 0 Holyhead 99.87 99.87 100 40.07 100 64.11 Ilfracombe 95.36 99.97 94.38 99.52 96.88 99.97 Immingham 81.72 30.31 96.39 25.63 100 5.68 Jersey 99.90 99.90 99.74 99.70 99.90 99.90 Kinlochbervie 100 100 88.91 100 100 100 Leith 100 100 99.96 100 100 100 Lerwick 100 100 100 100 99.93 99.93 Liverpool 75.84 5.85 99.78 4.91 98.99 25.27 Llandudno 100 100 100 100 100 100 Lowestoft 100 100 100 100 100 100 Milford Haven 58.87 100 80.92 98.40 98.82 91.77 Millport 100 100 100 100 99.90 99.90 Mumbles 96.61 96.61 92.75 91.74 100 100 Newhaven 100 100 99.26 99.78 100 100 Newlyn 100 100 80.92 74.85 100 87.40 Newport 88.14 15.09 79.69 0 38.78 65.39 North Shields 100 99.29 100 100 100 100 Plymouth Devonport 99.97 99.97 77.64 79.54 100 100 Port Erin 89.48 100 100 100 100 100 Portpatrick 0 84.04 0 100 0 96.81 Portrush 100 80.85 100 96.50 100 83.33 Portsmouth 99.93 99.93 100 100 100 100 Sheerness 0 21.34 0 8.97 0 0 St Marys 9.68 0 40.03 0.45 56.38 22.58 Stornoway 100 100 100 100 100 100 Tobermory 100 100 99.93 99.93 100 100 Ullapool 100 100 100 100 100 100 Weymouth 89.01 99.90 100 100 100 100 Whitby 99.33 99.40 99.29 99.29 98.69 98.69 Wick 84.21 86.76 100 100 100 100 Workington 99.83 99.83 100 96.32 100 96.27
M = No mid-tide, N/A = No output
13
UKCMF Annual Tide Gauge Report 2014
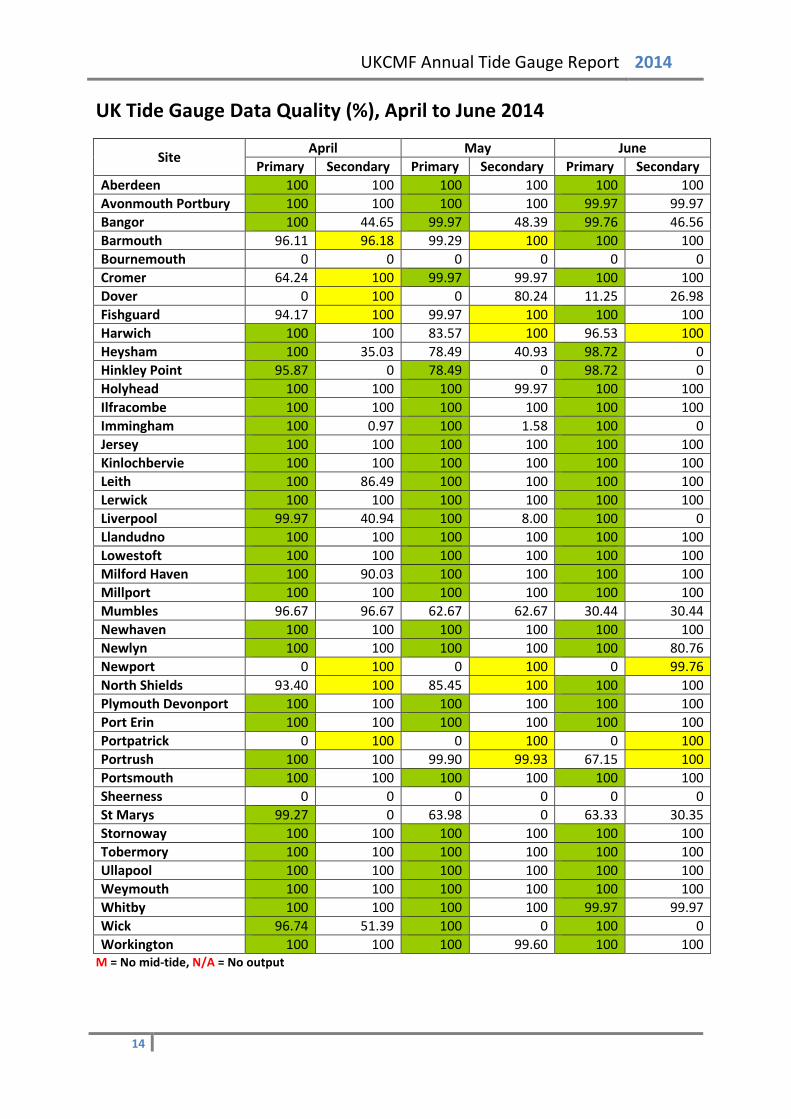
UK Tide Gauge Data Quality (%), April to June 2014
Site April May June Primary Secondary Primary Secondary Primary Secondary
Aberdeen 100 100 100 100 100 100 Avonmouth Portbury 100 100 100 100 99.97 99.97 Bangor 100 44.65 99.97 48.39 99.76 46.56 Barmouth 96.11 96.18 99.29 100 100 100 Bournemouth 0 0 0 0 0 0 Cromer 64.24 100 99.97 99.97 100 100 Dover 0 100 0 80.24 11.25 26.98 Fishguard 94.17 100 99.97 100 100 100 Harwich 100 100 83.57 100 96.53 100 Heysham 100 35.03 78.49 40.93 98.72 0 Hinkley Point 95.87 0 78.49 0 98.72 0 Holyhead 100 100 100 99.97 100 100 Ilfracombe 100 100 100 100 100 100 Immingham 100 0.97 100 1.58 100 0 Jersey 100 100 100 100 100 100 Kinlochbervie 100 100 100 100 100 100 Leith 100 86.49 100 100 100 100 Lerwick 100 100 100 100 100 100 Liverpool 99.97 40.94 100 8.00 100 0 Llandudno 100 100 100 100 100 100 Lowestoft 100 100 100 100 100 100 Milford Haven 100 90.03 100 100 100 100 Millport 100 100 100 100 100 100 Mumbles 96.67 96.67 62.67 62.67 30.44 30.44 Newhaven 100 100 100 100 100 100 Newlyn 100 100 100 100 100 80.76 Newport 0 100 0 100 0 99.76 North Shields 93.40 100 85.45 100 100 100 Plymouth Devonport 100 100 100 100 100 100 Port Erin 100 100 100 100 100 100 Portpatrick 0 100 0 100 0 100 Portrush 100 100 99.90 99.93 67.15 100 Portsmouth 100 100 100 100 100 100 Sheerness 0 0 0 0 0 0 St Marys 99.27 0 63.98 0 63.33 30.35 Stornoway 100 100 100 100 100 100 Tobermory 100 100 100 100 100 100 Ullapool 100 100 100 100 100 100 Weymouth 100 100 100 100 100 100 Whitby 100 100 100 100 99.97 99.97 Wick 96.74 51.39 100 0 100 0 Workington 100 100 100 99.60 100 100
M = No mid-tide, N/A = No output
14
UKCMF Annual Tide Gauge Report 2014
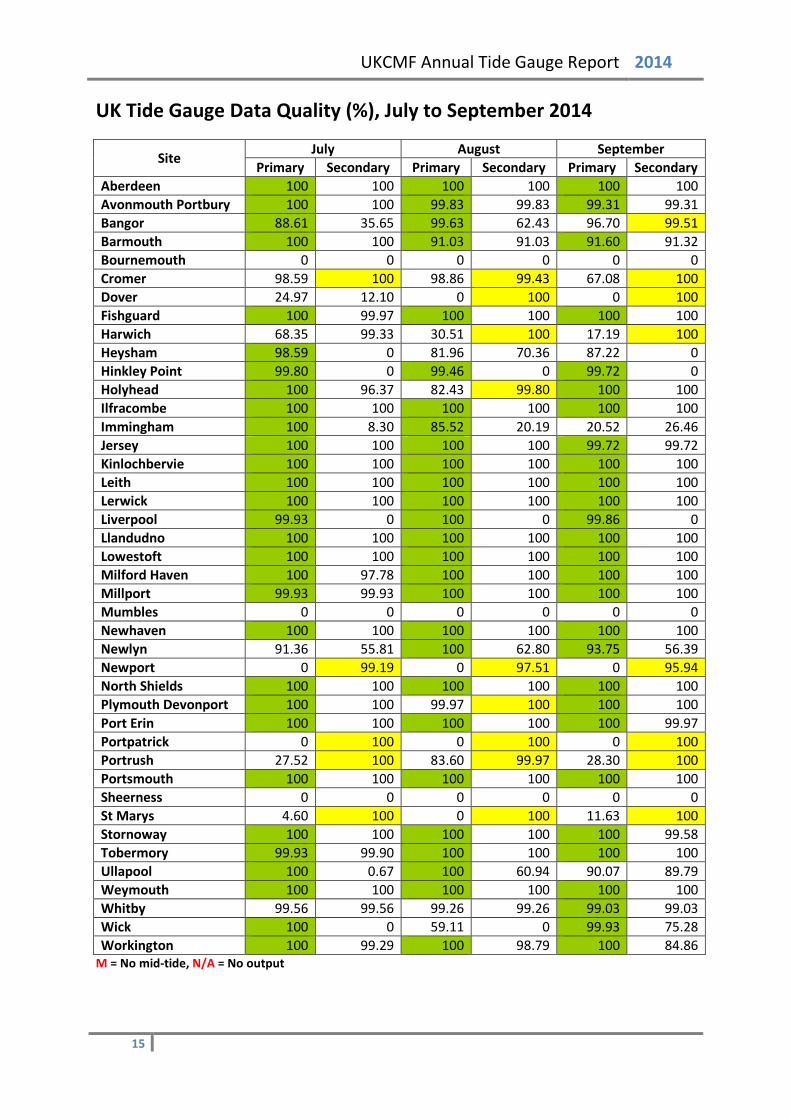
UK Tide Gauge Data Quality (%), July to September 2014
Site July August September Primary Secondary Primary Secondary Primary Secondary
Aberdeen 100 100 100 100 100 100 Avonmouth Portbury 100 100 99.83 99.83 99.31 99.31 Bangor 88.61 35.65 99.63 62.43 96.70 99.51 Barmouth 100 100 91.03 91.03 91.60 91.32 Bournemouth 0 0 0 0 0 0 Cromer 98.59 100 98.86 99.43 67.08 100 Dover 24.97 12.10 0 100 0 100 Fishguard 100 99.97 100 100 100 100 Harwich 68.35 99.33 30.51 100 17.19 100 Heysham 98.59 0 81.96 70.36 87.22 0 Hinkley Point 99.80 0 99.46 0 99.72 0 Holyhead 100 96.37 82.43 99.80 100 100 Ilfracombe 100 100 100 100 100 100 Immingham 100 8.30 85.52 20.19 20.52 26.46 Jersey 100 100 100 100 99.72 99.72 Kinlochbervie 100 100 100 100 100 100 Leith 100 100 100 100 100 100 Lerwick 100 100 100 100 100 100 Liverpool 99.93 0 100 0 99.86 0 Llandudno 100 100 100 100 100 100 Lowestoft 100 100 100 100 100 100 Milford Haven 100 97.78 100 100 100 100 Millport 99.93 99.93 100 100 100 100 Mumbles 0 0 0 0 0 0 Newhaven 100 100 100 100 100 100 Newlyn 91.36 55.81 100 62.80 93.75 56.39 Newport 0 99.19 0 97.51 0 95.94 North Shields 100 100 100 100 100 100 Plymouth Devonport 100 100 99.97 100 100 100 Port Erin 100 100 100 100 100 99.97 Portpatrick 0 100 0 100 0 100 Portrush 27.52 100 83.60 99.97 28.30 100 Portsmouth 100 100 100 100 100 100 Sheerness 0 0 0 0 0 0 St Marys 4.60 100 0 100 11.63 100 Stornoway 100 100 100 100 100 99.58 Tobermory 99.93 99.90 100 100 100 100 Ullapool 100 0.67 100 60.94 90.07 89.79 Weymouth 100 100 100 100 100 100 Whitby 99.56 99.56 99.26 99.26 99.03 99.03 Wick 100 0 59.11 0 99.93 75.28 Workington 100 99.29 100 98.79 100 84.86
M = No mid-tide, N/A = No output
15
UKCMF Annual Tide Gauge Report 2014
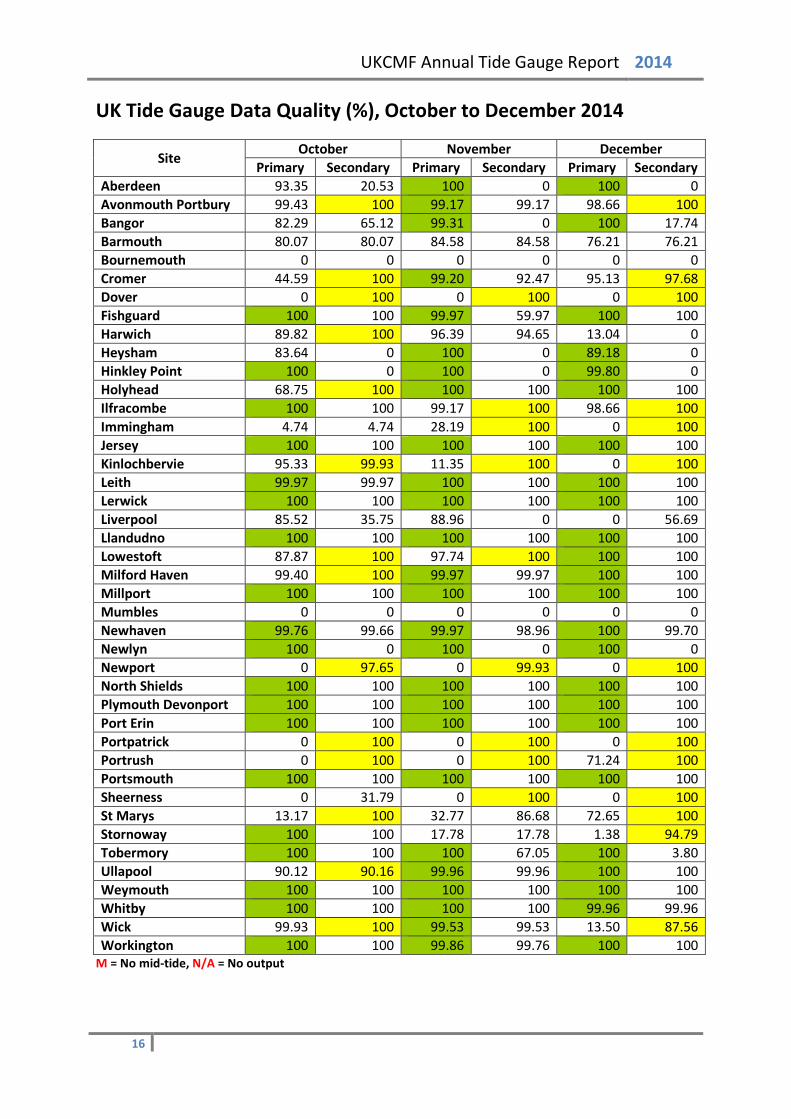
UK Tide Gauge Data Quality (%), October to December 2014
Site October November December Primary Secondary Primary Secondary Primary Secondary
Aberdeen 93.35 20.53 100 0 100 0 Avonmouth Portbury 99.43 100 99.17 99.17 98.66 100 Bangor 82.29 65.12 99.31 0 100 17.74 Barmouth 80.07 80.07 84.58 84.58 76.21 76.21 Bournemouth 0 0 0 0 0 0 Cromer 44.59 100 99.20 92.47 95.13 97.68 Dover 0 100 0 100 0 100 Fishguard 100 100 99.97 59.97 100 100 Harwich 89.82 100 96.39 94.65 13.04 0 Heysham 83.64 0 100 0 89.18 0 Hinkley Point 100 0 100 0 99.80 0 Holyhead 68.75 100 100 100 100 100 Ilfracombe 100 100 99.17 100 98.66 100 Immingham 4.74 4.74 28.19 100 0 100 Jersey 100 100 100 100 100 100 Kinlochbervie 95.33 99.93 11.35 100 0 100 Leith 99.97 99.97 100 100 100 100 Lerwick 100 100 100 100 100 100 Liverpool 85.52 35.75 88.96 0 0 56.69 Llandudno 100 100 100 100 100 100 Lowestoft 87.87 100 97.74 100 100 100 Milford Haven 99.40 100 99.97 99.97 100 100 Millport 100 100 100 100 100 100 Mumbles 0 0 0 0 0 0 Newhaven 99.76 99.66 99.97 98.96 100 99.70 Newlyn 100 0 100 0 100 0 Newport 0 97.65 0 99.93 0 100 North Shields 100 100 100 100 100 100 Plymouth Devonport 100 100 100 100 100 100 Port Erin 100 100 100 100 100 100 Portpatrick 0 100 0 100 0 100 Portrush 0 100 0 100 71.24 100 Portsmouth 100 100 100 100 100 100 Sheerness 0 31.79 0 100 0 100 St Marys 13.17 100 32.77 86.68 72.65 100 Stornoway 100 100 17.78 17.78 1.38 94.79 Tobermory 100 100 100 67.05 100 3.80 Ullapool 90.12 90.16 99.96 99.96 100 100 Weymouth 100 100 100 100 100 100 Whitby 100 100 100 100 99.96 99.96 Wick 99.93 100 99.53 99.53 13.50 87.56 Workington 100 100 99.86 99.76 100 100
M = No mid-tide, N/A = No output
16
UKCMF Annual Tide Gauge Report 2014
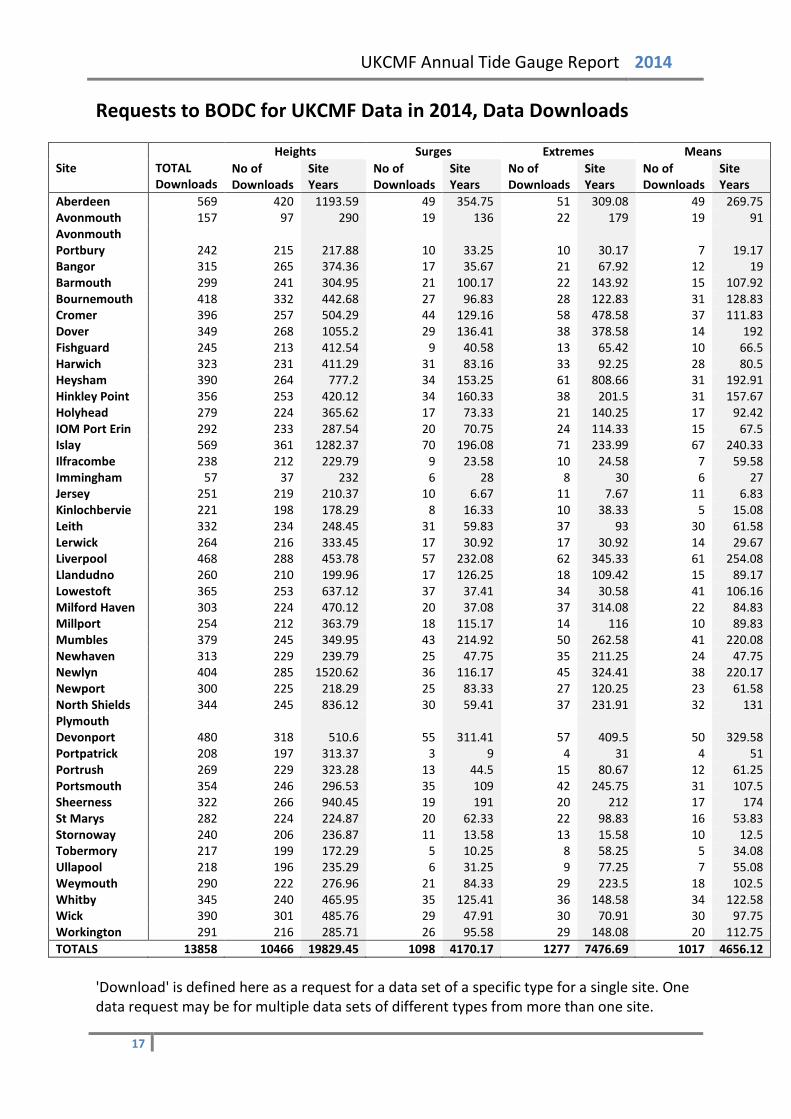
Requests to BODC for UKCMF Data in 2014, Data Downloads
Site TOTAL Downloads
Heights Surges Extremes Means No of Downloads
Site Years
No of Downloads
Site Years
No of Downloads
Site Years
No of Downloads
Site Years
Aberdeen 569 420 1193.59 49 354.75 51 309.08 49 269.75 Avonmouth 157 97 290 19 136 22 179 19 91 Avonmouth Portbury 242 215 217.88 10 33.25 10 30.17 7 19.17 Bangor 315 265 374.36 17 35.67 21 67.92 12 19 Barmouth 299 241 304.95 21 100.17 22 143.92 15 107.92 Bournemouth 418 332 442.68 27 96.83 28 122.83 31 128.83 Cromer 396 257 504.29 44 129.16 58 478.58 37 111.83 Dover 349 268 1055.2 29 136.41 38 378.58 14 192 Fishguard 245 213 412.54 9 40.58 13 65.42 10 66.5 Harwich 323 231 411.29 31 83.16 33 92.25 28 80.5 Heysham 390 264 777.2 34 153.25 61 808.66 31 192.91 Hinkley Point 356 253 420.12 34 160.33 38 201.5 31 157.67 Holyhead 279 224 365.62 17 73.33 21 140.25 17 92.42 IOM Port Erin 292 233 287.54 20 70.75 24 114.33 15 67.5 Islay 569 361 1282.37 70 196.08 71 233.99 67 240.33 Ilfracombe 238 212 229.79 9 23.58 10 24.58 7 59.58 Immingham 57 37 232 6 28 8 30 6 27 Jersey 251 219 210.37 10 6.67 11 7.67 11 6.83 Kinlochbervie 221 198 178.29 8 16.33 10 38.33 5 15.08 Leith 332 234 248.45 31 59.83 37 93 30 61.58 Lerwick 264 216 333.45 17 30.92 17 30.92 14 29.67 Liverpool 468 288 453.78 57 232.08 62 345.33 61 254.08 Llandudno 260 210 199.96 17 126.25 18 109.42 15 89.17 Lowestoft 365 253 637.12 37 37.41 34 30.58 41 106.16 Milford Haven 303 224 470.12 20 37.08 37 314.08 22 84.83 Millport 254 212 363.79 18 115.17 14 116 10 89.83 Mumbles 379 245 349.95 43 214.92 50 262.58 41 220.08 Newhaven 313 229 239.79 25 47.75 35 211.25 24 47.75 Newlyn 404 285 1520.62 36 116.17 45 324.41 38 220.17 Newport 300 225 218.29 25 83.33 27 120.25 23 61.58 North Shields 344 245 836.12 30 59.41 37 231.91 32 131 Plymouth Devonport 480 318 510.6 55 311.41 57 409.5 50 329.58 Portpatrick 208 197 313.37 3 9 4 31 4 51 Portrush 269 229 323.28 13 44.5 15 80.67 12 61.25 Portsmouth 354 246 296.53 35 109 42 245.75 31 107.5 Sheerness 322 266 940.45 19 191 20 212 17 174 St Marys 282 224 224.87 20 62.33 22 98.83 16 53.83 Stornoway 240 206 236.87 11 13.58 13 15.58 10 12.5 Tobermory 217 199 172.29 5 10.25 8 58.25 5 34.08 Ullapool 218 196 235.29 6 31.25 9 77.25 7 55.08 Weymouth 290 222 276.96 21 84.33 29 223.5 18 102.5 Whitby 345 240 465.95 35 125.41 36 148.58 34 122.58 Wick 390 301 485.76 29 47.91 30 70.91 30 97.75 Workington 291 216 285.71 26 95.58 29 148.08 20 112.75 TOTALS 13858 10466 19829.45 1098 4170.17 1277 7476.69 1017 4656.12
'Download' is defined here as a request for a data set of a specific type for a single site. One data request may be for multiple data sets of different types from more than one site.
17
UKCMF Annual Tide Gauge Report 2014
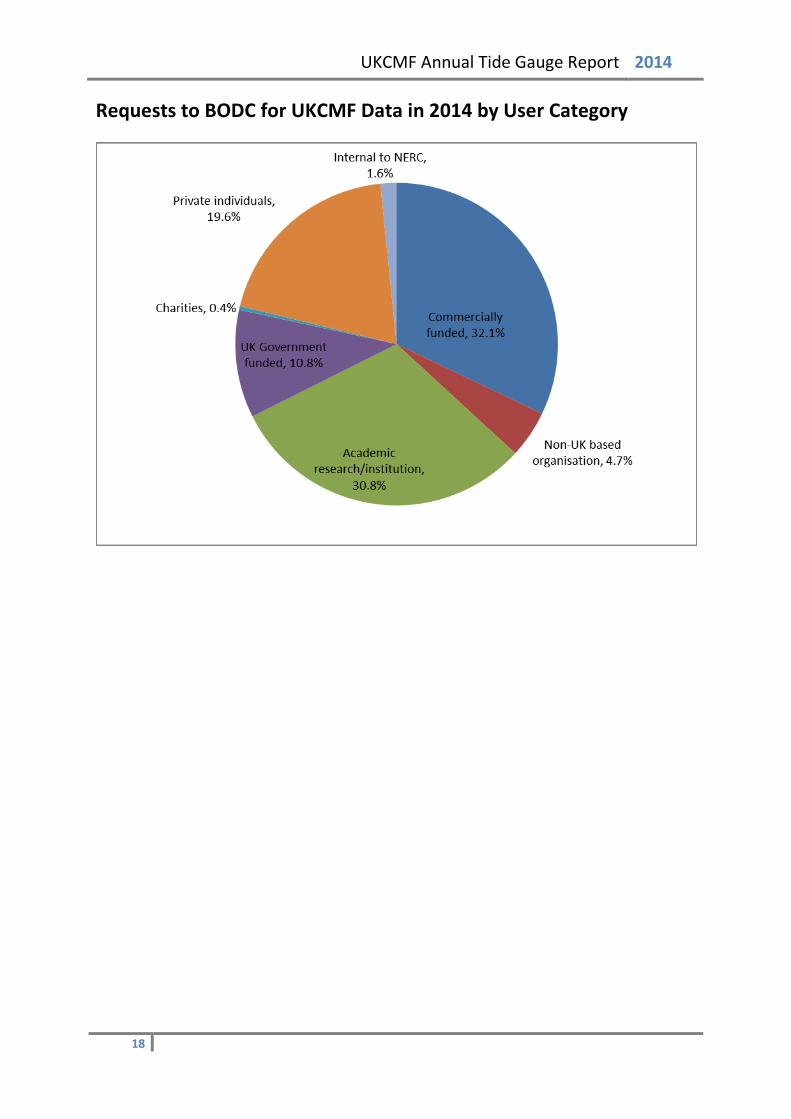
Requests to BODC for UKCMF Data in 2014 by User Category
18
UKCMF Annual Tide Gauge Report 2014
Aberdeen – Tide Gauge Information Latitude 57° 08' 38.5" N Longitude 02° 04' 38.5" W Grid Ref NJ 9525 0591 Instrument Data acquisition system with two full tide and a mid-tide bubbler gauge Location Tide Gauge Building Waterloo Quay
Measuring Points The South West corner of Telford Dock Datum The delayed-mode data are to Admiralty Chart Datum (ACD).
The statistics in this report are to Ordnance Datum Newlyn (ODN). Benchmark Grid Ref Description TGBM NJ 9525 0590 New bolt N side jetty Waterloo Quay Aux1 NJ 9572 0593 Building NW side York Place SE face E angle Aux2 NJ 9586 0571 Observatory Pocra Quay N face NW angle Aux3 NJ 9524 0600 Building NE side Waterloo Quay SW face S angle Benchmark Relationships TGZ = Admiralty Chart Datum (ACD) TGZ = 2.25m below Ordnance Datum Newlyn (ODN) TGZ = 6.318m below TGBM Levelling No levelling was carried out in 2014 Site visits 09/10/2014 (Day 282) Maintenance. Compressor change. Notes on Data Quality The site met the agreed target of being operational for at least 75% of each calendar month in 2014.
19
UKCMF Annual Tide Gauge Report 2014
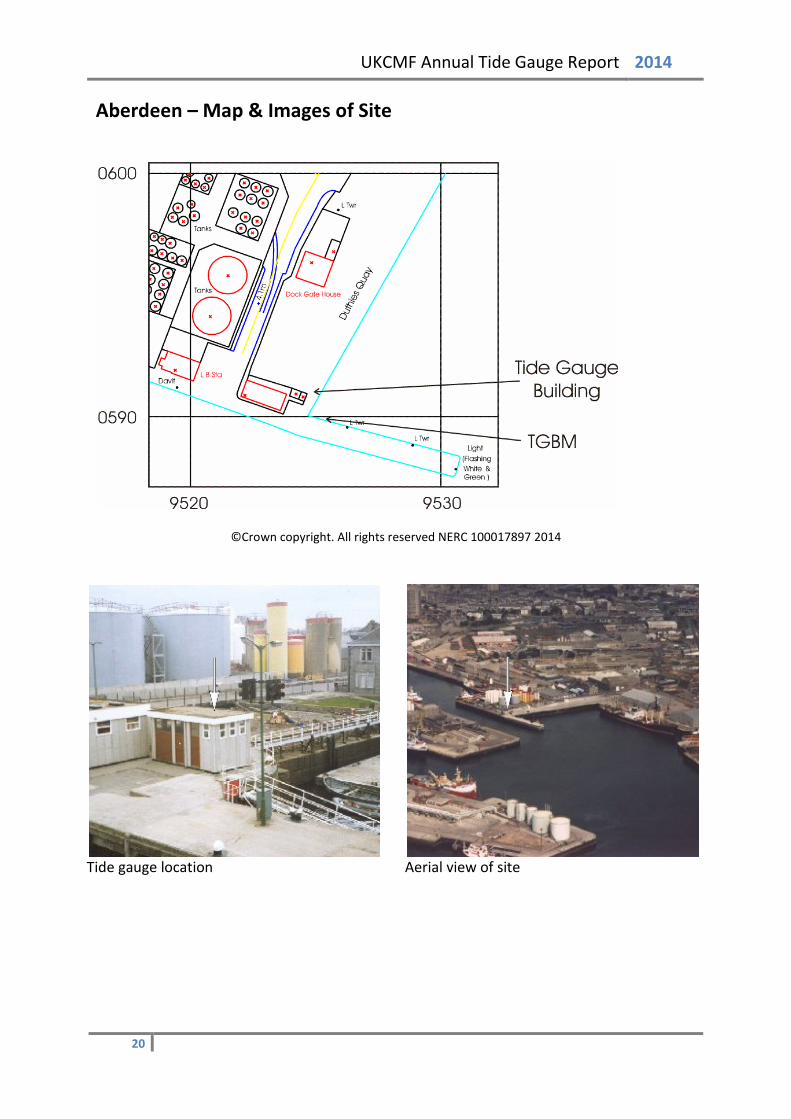
Aberdeen – Map & Images of Site
©Crown copyright. All rights reserved NERC 100017897 2014
Tide gauge location
Aerial view of site
20
UKCMF Annual Tide Gauge Report 2014
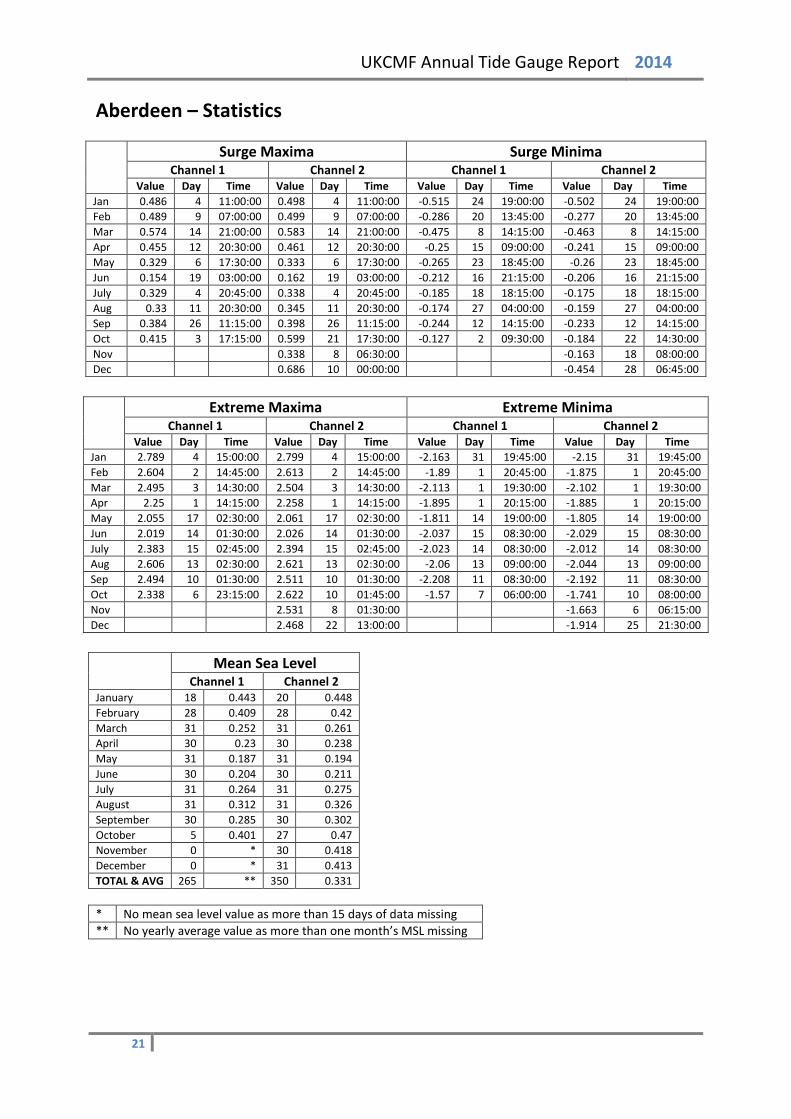
Aberdeen – Statistics
Surge Maxima Surge Minima
Channel 1 Channel 2 Channel 1 Channel 2 Value Day Time Value Day Time Value Day Time Value Day Time
Jan 0.486 4 11:00:00 0.498 4 11:00:00 -0.515 24 19:00:00 -0.502 24 19:00:00 Feb 0.489 9 07:00:00 0.499 9 07:00:00 -0.286 20 13:45:00 -0.277 20 13:45:00 Mar 0.574 14 21:00:00 0.583 14 21:00:00 -0.475 8 14:15:00 -0.463 8 14:15:00 Apr 0.455 12 20:30:00 0.461 12 20:30:00 -0.25 15 09:00:00 -0.241 15 09:00:00 May 0.329 6 17:30:00 0.333 6 17:30:00 -0.265 23 18:45:00 -0.26 23 18:45:00 Jun 0.154 19 03:00:00 0.162 19 03:00:00 -0.212 16 21:15:00 -0.206 16 21:15:00 July 0.329 4 20:45:00 0.338 4 20:45:00 -0.185 18 18:15:00 -0.175 18 18:15:00 Aug 0.33 11 20:30:00 0.345 11 20:30:00 -0.174 27 04:00:00 -0.159 27 04:00:00 Sep 0.384 26 11:15:00 0.398 26 11:15:00 -0.244 12 14:15:00 -0.233 12 14:15:00 Oct 0.415 3 17:15:00 0.599 21 17:30:00 -0.127 2 09:30:00 -0.184 22 14:30:00 Nov 0.338 8 06:30:00 -0.163 18 08:00:00 Dec 0.686 10 00:00:00 -0.454 28 06:45:00
Extreme Maxima Extreme Minima
Channel 1 Channel 2 Channel 1 Channel 2 Value Day Time Value Day Time Value Day Time Value Day Time
Jan 2.789 4 15:00:00 2.799 4 15:00:00 -2.163 31 19:45:00 -2.15 31 19:45:00 Feb 2.604 2 14:45:00 2.613 2 14:45:00 -1.89 1 20:45:00 -1.875 1 20:45:00 Mar 2.495 3 14:30:00 2.504 3 14:30:00 -2.113 1 19:30:00 -2.102 1 19:30:00 Apr 2.25 1 14:15:00 2.258 1 14:15:00 -1.895 1 20:15:00 -1.885 1 20:15:00 May 2.055 17 02:30:00 2.061 17 02:30:00 -1.811 14 19:00:00 -1.805 14 19:00:00 Jun 2.019 14 01:30:00 2.026 14 01:30:00 -2.037 15 08:30:00 -2.029 15 08:30:00 July 2.383 15 02:45:00 2.394 15 02:45:00 -2.023 14 08:30:00 -2.012 14 08:30:00 Aug 2.606 13 02:30:00 2.621 13 02:30:00 -2.06 13 09:00:00 -2.044 13 09:00:00 Sep 2.494 10 01:30:00 2.511 10 01:30:00 -2.208 11 08:30:00 -2.192 11 08:30:00 Oct 2.338 6 23:15:00 2.622 10 01:45:00 -1.57 7 06:00:00 -1.741 10 08:00:00 Nov 2.531 8 01:30:00 -1.663 6 06:15:00 Dec 2.468 22 13:00:00 -1.914 25 21:30:00
Mean Sea Level
Channel 1 Channel 2 January 18 0.443 20 0.448 February 28 0.409 28 0.42 March 31 0.252 31 0.261 April 30 0.23 30 0.238 May 31 0.187 31 0.194 June 30 0.204 30 0.211 July 31 0.264 31 0.275 August 31 0.312 31 0.326 September 30 0.285 30 0.302 October 5 0.401 27 0.47 November 0 * 30 0.418 December 0 * 31 0.413 TOTAL & AVG 265 ** 350 0.331 * No mean sea level value as more than 15 days of data missing ** No yearly average value as more than one month’s MSL missing
21
UKCMF Annual Tide Gauge Report 2014
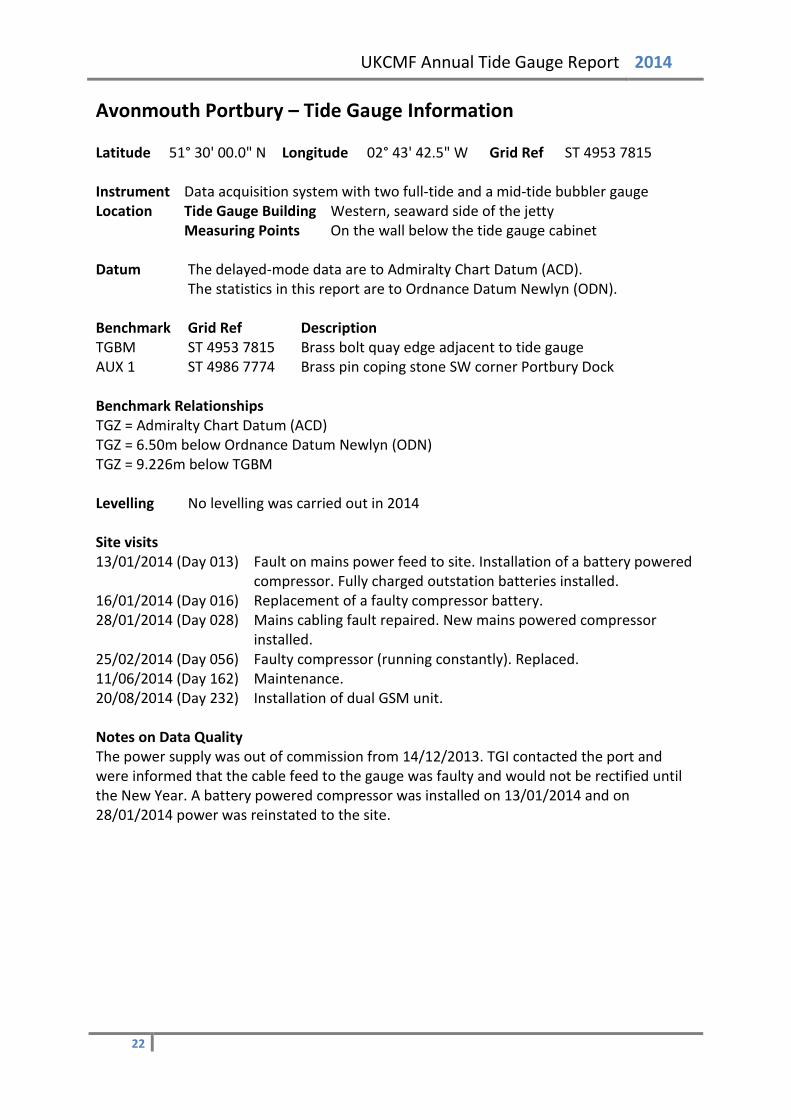
Avonmouth Portbury – Tide Gauge Information Latitude 51° 30' 00.0" N Longitude 02° 43' 42.5" W Grid Ref ST 4953 7815 Instrument Data acquisition system with two full-tide and a mid-tide bubbler gauge Location Tide Gauge Building Western, seaward side of the jetty
Measuring Points On the wall below the tide gauge cabinet Datum The delayed-mode data are to Admiralty Chart Datum (ACD).
The statistics in this report are to Ordnance Datum Newlyn (ODN). Benchmark Grid Ref Description TGBM ST 4953 7815 Brass bolt quay edge adjacent to tide gauge AUX 1 ST 4986 7774 Brass pin coping stone SW corner Portbury Dock Benchmark Relationships TGZ = Admiralty Chart Datum (ACD) TGZ = 6.50m below Ordnance Datum Newlyn (ODN) TGZ = 9.226m below TGBM Levelling No levelling was carried out in 2014 Site visits 13/01/2014 (Day 013) Fault on mains power feed to site. Installation of a battery powered
compressor. Fully charged outstation batteries installed. 16/01/2014 (Day 016) Replacement of a faulty compressor battery. 28/01/2014 (Day 028) Mains cabling fault repaired. New mains powered compressor
installed. 25/02/2014 (Day 056) Faulty compressor (running constantly). Replaced. 11/06/2014 (Day 162) Maintenance. 20/08/2014 (Day 232) Installation of dual GSM unit. Notes on Data Quality The power supply was out of commission from 14/12/2013. TGI contacted the port and were informed that the cable feed to the gauge was faulty and would not be rectified until the New Year. A battery powered compressor was installed on 13/01/2014 and on 28/01/2014 power was reinstated to the site.
22
UKCMF Annual Tide Gauge Report 2014
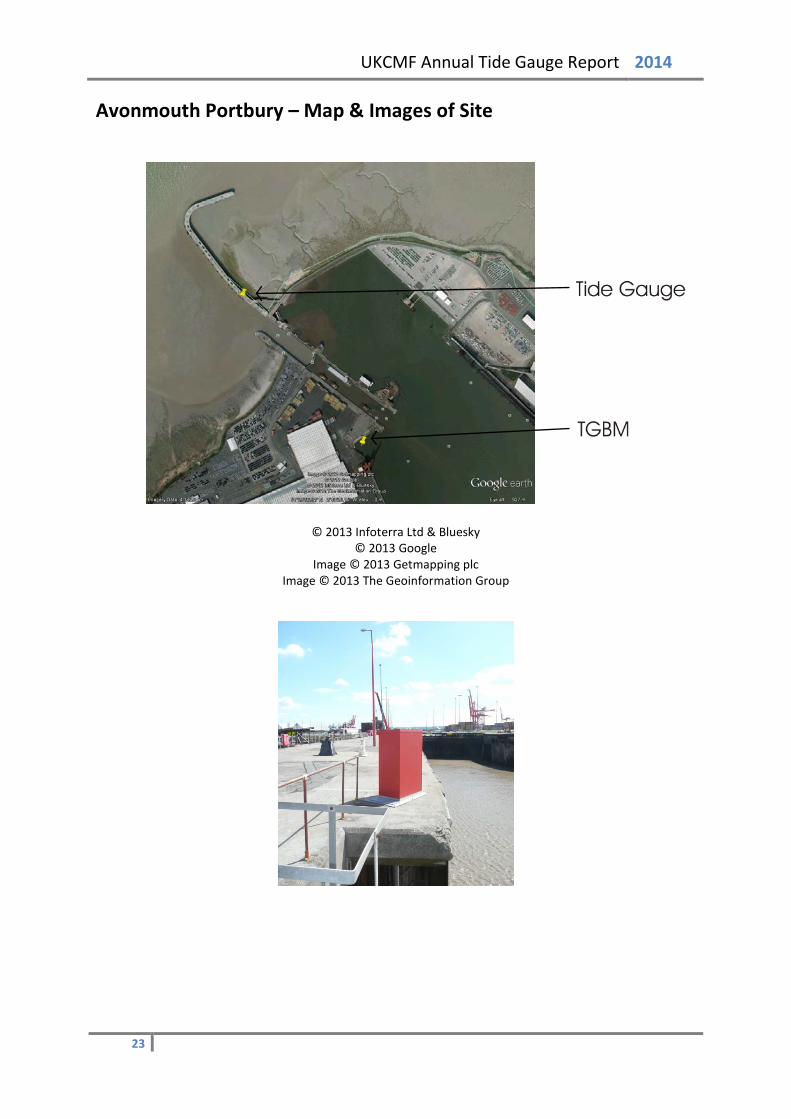
Avonmouth Portbury – Map & Images of Site
© 2013 Infoterra Ltd & Bluesky © 2013 Google
Image © 2013 Getmapping plc Image © 2013 The Geoinformation Group
23
UKCMF Annual Tide Gauge Report 2014
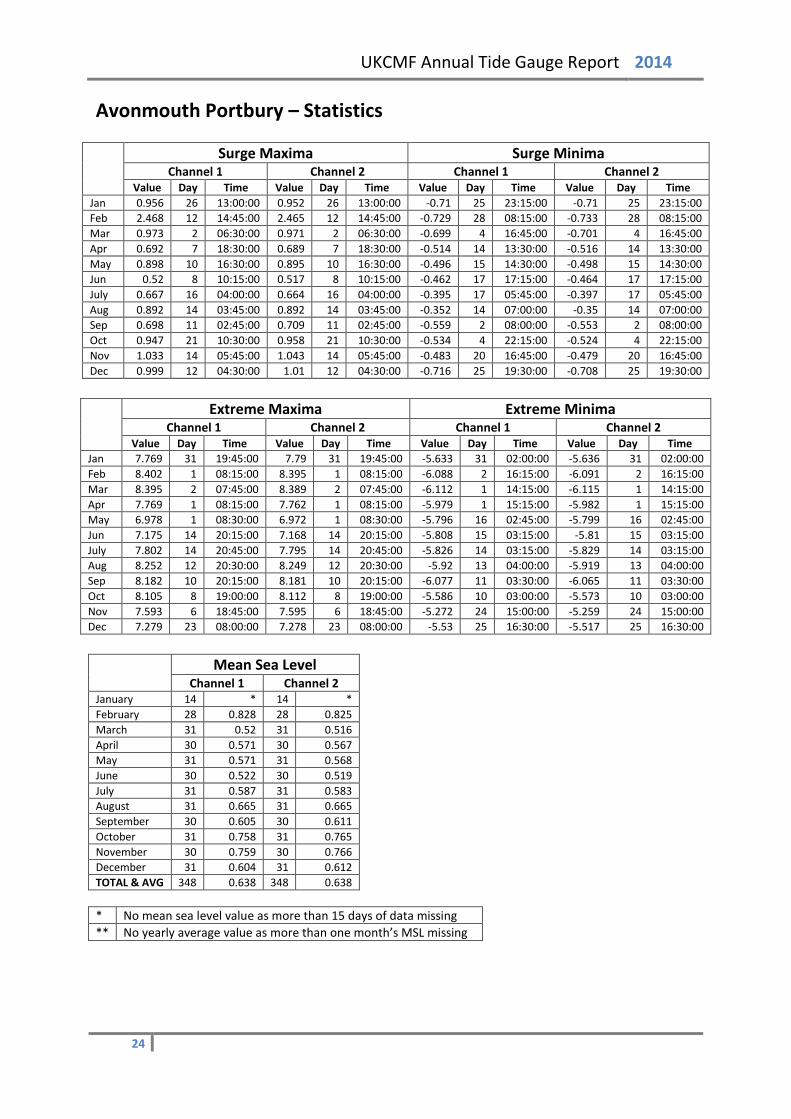
Avonmouth Portbury – Statistics
Surge Maxima Surge Minima
Channel 1 Channel 2 Channel 1 Channel 2 Value Day Time Value Day Time Value Day Time Value Day Time
Jan 0.956 26 13:00:00 0.952 26 13:00:00 -0.71 25 23:15:00 -0.71 25 23:15:00 Feb 2.468 12 14:45:00 2.465 12 14:45:00 -0.729 28 08:15:00 -0.733 28 08:15:00 Mar 0.973 2 06:30:00 0.971 2 06:30:00 -0.699 4 16:45:00 -0.701 4 16:45:00 Apr 0.692 7 18:30:00 0.689 7 18:30:00 -0.514 14 13:30:00 -0.516 14 13:30:00 May 0.898 10 16:30:00 0.895 10 16:30:00 -0.496 15 14:30:00 -0.498 15 14:30:00 Jun 0.52 8 10:15:00 0.517 8 10:15:00 -0.462 17 17:15:00 -0.464 17 17:15:00 July 0.667 16 04:00:00 0.664 16 04:00:00 -0.395 17 05:45:00 -0.397 17 05:45:00 Aug 0.892 14 03:45:00 0.892 14 03:45:00 -0.352 14 07:00:00 -0.35 14 07:00:00 Sep 0.698 11 02:45:00 0.709 11 02:45:00 -0.559 2 08:00:00 -0.553 2 08:00:00 Oct 0.947 21 10:30:00 0.958 21 10:30:00 -0.534 4 22:15:00 -0.524 4 22:15:00 Nov 1.033 14 05:45:00 1.043 14 05:45:00 -0.483 20 16:45:00 -0.479 20 16:45:00 Dec 0.999 12 04:30:00 1.01 12 04:30:00 -0.716 25 19:30:00 -0.708 25 19:30:00
Extreme Maxima Extreme Minima
Channel 1 Channel 2 Channel 1 Channel 2 Value Day Time Value Day Time Value Day Time Value Day Time
Jan 7.769 31 19:45:00 7.79 31 19:45:00 -5.633 31 02:00:00 -5.636 31 02:00:00 Feb 8.402 1 08:15:00 8.395 1 08:15:00 -6.088 2 16:15:00 -6.091 2 16:15:00 Mar 8.395 2 07:45:00 8.389 2 07:45:00 -6.112 1 14:15:00 -6.115 1 14:15:00 Apr 7.769 1 08:15:00 7.762 1 08:15:00 -5.979 1 15:15:00 -5.982 1 15:15:00 May 6.978 1 08:30:00 6.972 1 08:30:00 -5.796 16 02:45:00 -5.799 16 02:45:00 Jun 7.175 14 20:15:00 7.168 14 20:15:00 -5.808 15 03:15:00 -5.81 15 03:15:00 July 7.802 14 20:45:00 7.795 14 20:45:00 -5.826 14 03:15:00 -5.829 14 03:15:00 Aug 8.252 12 20:30:00 8.249 12 20:30:00 -5.92 13 04:00:00 -5.919 13 04:00:00 Sep 8.182 10 20:15:00 8.181 10 20:15:00 -6.077 11 03:30:00 -6.065 11 03:30:00 Oct 8.105 8 19:00:00 8.112 8 19:00:00 -5.586 10 03:00:00 -5.573 10 03:00:00 Nov 7.593 6 18:45:00 7.595 6 18:45:00 -5.272 24 15:00:00 -5.259 24 15:00:00 Dec 7.279 23 08:00:00 7.278 23 08:00:00 -5.53 25 16:30:00 -5.517 25 16:30:00
Mean Sea Level
Channel 1 Channel 2 January 14 * 14 * February 28 0.828 28 0.825 March 31 0.52 31 0.516 April 30 0.571 30 0.567 May 31 0.571 31 0.568 June 30 0.522 30 0.519 July 31 0.587 31 0.583 August 31 0.665 31 0.665 September 30 0.605 30 0.611 October 31 0.758 31 0.765 November 30 0.759 30 0.766 December 31 0.604 31 0.612 TOTAL & AVG 348 0.638 348 0.638 * No mean sea level value as more than 15 days of data missing ** No yearly average value as more than one month’s MSL missing
24
UKCMF Annual Tide Gauge Report 2014
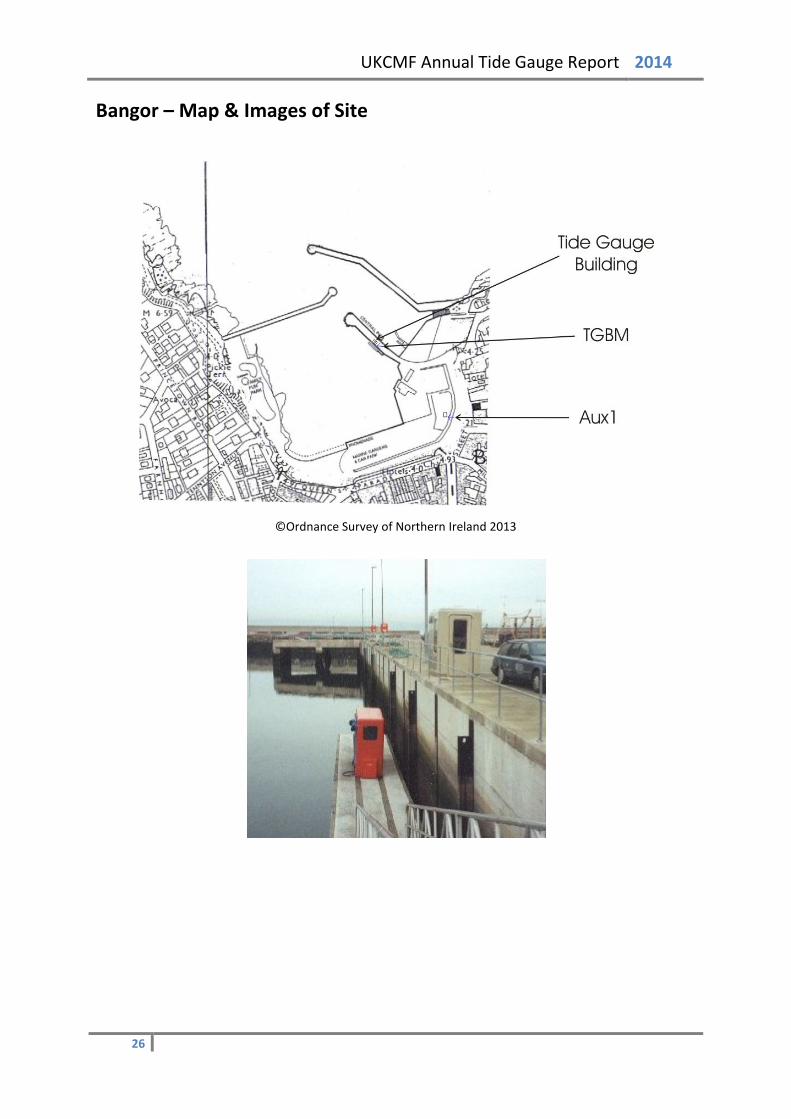
Bangor – Tide Gauge Information Latitude 54° 39' 53.1" N Longitude 05° 40' 10.1" W Grid Ref NW 6340 3620 Instrument Data acquisition system with two full-tide and a mid-tide bubbler gauge Location Tide Gauge Building Central Pier at Bangor Marina
Measuring Points The seaward side of the open pier, directly beneath the tide gauge building
Datum The delayed-mode data are to Admiralty Chart Datum (ACD).
The statistics in this report are to Ordnance Datum Belfast (ODB). Benchmark Grid Ref Description TGBM 5043 8212
(Sheet 115) S S Pin Tide gauge building Central Pier
Aux1 5038 8200 (Sheet 115)
Cut mark Clock tower
Benchmark Relationships TGZ = Admiralty Chart Datum (ACD) TGZ = 2.01m below Ordnance Datum Belfast (ODB) TGZ = 5.592m below TGBM Levelling No levelling was carried out in 2014 Site visits 14/05/2014 (Day 134) Maintenance. Compressor change. Clear blocking channel. 12/08/2014 (Day 224) Diving to clear blocking channel. Notes on Data Quality In July and August all channels were subject to blocking. TGI dived on site in August and cleared the blocking channel.
25
UKCMF Annual Tide Gauge Report 2014
Bangor – Map & Images of Site
©Ordnance Survey of Northern Ireland 2013
26
UKCMF Annual Tide Gauge Report 2014
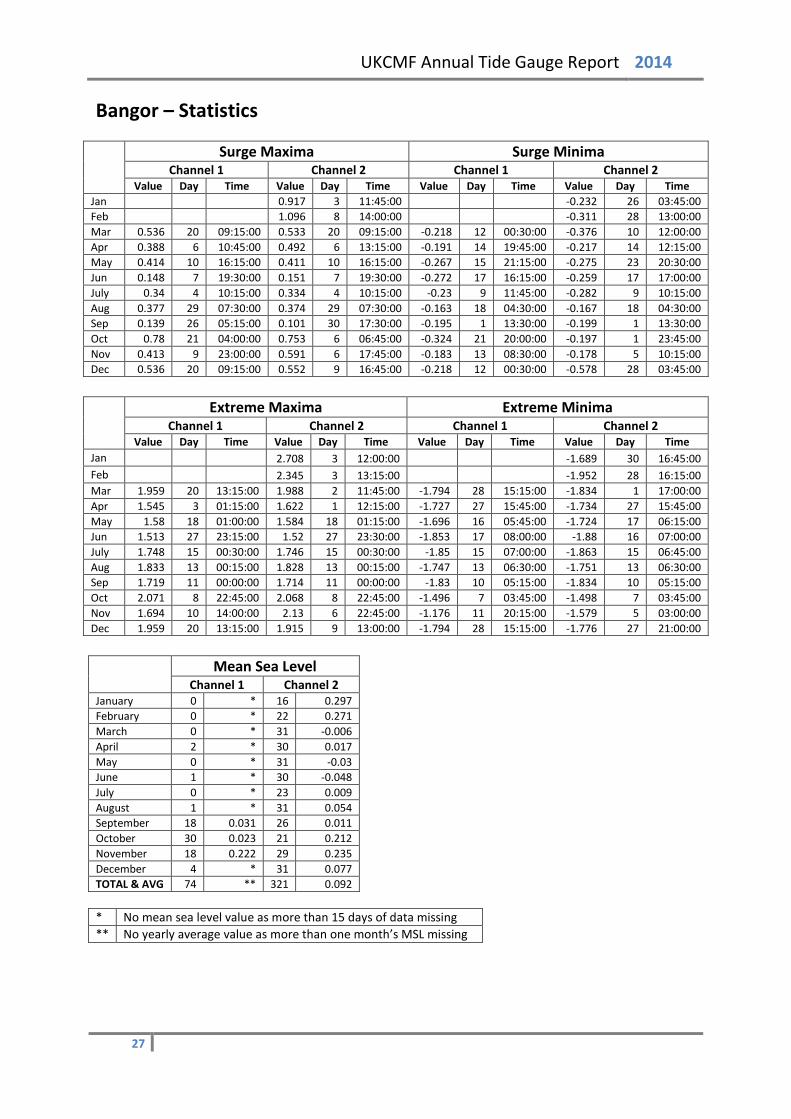
Bangor – Statistics
Surge Maxima Surge Minima
Channel 1 Channel 2 Channel 1 Channel 2 Value Day Time Value Day Time Value Day Time Value Day Time
Jan 0.917 3 11:45:00 -0.232 26 03:45:00 Feb 1.096 8 14:00:00 -0.311 28 13:00:00 Mar 0.536 20 09:15:00 0.533 20 09:15:00 -0.218 12 00:30:00 -0.376 10 12:00:00 Apr 0.388 6 10:45:00 0.492 6 13:15:00 -0.191 14 19:45:00 -0.217 14 12:15:00 May 0.414 10 16:15:00 0.411 10 16:15:00 -0.267 15 21:15:00 -0.275 23 20:30:00 Jun 0.148 7 19:30:00 0.151 7 19:30:00 -0.272 17 16:15:00 -0.259 17 17:00:00 July 0.34 4 10:15:00 0.334 4 10:15:00 -0.23 9 11:45:00 -0.282 9 10:15:00 Aug 0.377 29 07:30:00 0.374 29 07:30:00 -0.163 18 04:30:00 -0.167 18 04:30:00 Sep 0.139 26 05:15:00 0.101 30 17:30:00 -0.195 1 13:30:00 -0.199 1 13:30:00 Oct 0.78 21 04:00:00 0.753 6 06:45:00 -0.324 21 20:00:00 -0.197 1 23:45:00 Nov 0.413 9 23:00:00 0.591 6 17:45:00 -0.183 13 08:30:00 -0.178 5 10:15:00 Dec 0.536 20 09:15:00 0.552 9 16:45:00 -0.218 12 00:30:00 -0.578 28 03:45:00
Extreme Maxima Extreme Minima
Channel 1 Channel 2 Channel 1 Channel 2 Value Day Time Value Day Time Value Day Time Value Day Time
Jan 2.708 3 12:00:00 -1.689 30 16:45:00 Feb 2.345 3 13:15:00 -1.952 28 16:15:00 Mar 1.959 20 13:15:00 1.988 2 11:45:00 -1.794 28 15:15:00 -1.834 1 17:00:00 Apr 1.545 3 01:15:00 1.622 1 12:15:00 -1.727 27 15:45:00 -1.734 27 15:45:00 May 1.58 18 01:00:00 1.584 18 01:15:00 -1.696 16 05:45:00 -1.724 17 06:15:00 Jun 1.513 27 23:15:00 1.52 27 23:30:00 -1.853 17 08:00:00 -1.88 16 07:00:00 July 1.748 15 00:30:00 1.746 15 00:30:00 -1.85 15 07:00:00 -1.863 15 06:45:00 Aug 1.833 13 00:15:00 1.828 13 00:15:00 -1.747 13 06:30:00 -1.751 13 06:30:00 Sep 1.719 11 00:00:00 1.714 11 00:00:00 -1.83 10 05:15:00 -1.834 10 05:15:00 Oct 2.071 8 22:45:00 2.068 8 22:45:00 -1.496 7 03:45:00 -1.498 7 03:45:00 Nov 1.694 10 14:00:00 2.13 6 22:45:00 -1.176 11 20:15:00 -1.579 5 03:00:00 Dec 1.959 20 13:15:00 1.915 9 13:00:00 -1.794 28 15:15:00 -1.776 27 21:00:00
Mean Sea Level
Channel 1 Channel 2 January 0 * 16 0.297 February 0 * 22 0.271 March 0 * 31 -0.006 April 2 * 30 0.017 May 0 * 31 -0.03 June 1 * 30 -0.048 July 0 * 23 0.009 August 1 * 31 0.054 September 18 0.031 26 0.011 October 30 0.023 21 0.212 November 18 0.222 29 0.235 December 4 * 31 0.077 TOTAL & AVG 74 ** 321 0.092 * No mean sea level value as more than 15 days of data missing ** No yearly average value as more than one month’s MSL missing
27
UKCMF Annual Tide Gauge Report 2014
Barmouth – Tide Gauge Information Latitude 52° 43' 09.6" N Longitude 04° 02' 42.1" W Grid Ref SH 6197 1548 Instrument Data acquisition system with two full-tide and a mid-tide bubbler gauge Location Tide Gauge Building Toll booth on the north end of Barmouth railway bridge
Measuring Points Attached to the first leg of the railway bridge in the deep channel
Datum The delayed-mode data are to Admiralty Chart Datum (ACD).
The statistics in this report are to Ordnance Datum Newlyn (ODN). Benchmark Grid Ref Description TGBM SH 6197 1548 NBM rivet concrete 2.9M NE wall junction Aux 1 SH 6173 1558 Rivet step NE side of road NW entrance path Aux 2 SH 6186 1556 Rivet wall SE side road 17.6M E steps Aux 3 SH 6196 1550 Rivet step E side lifeboat station Benchmark Relationships TGZ = Admiralty Chart Datum (ACD) TGZ = 2.44m below ODN TGZ = 10.363m below TGBM Levelling No levelling was carried out in 2014 Site visits 12/11/2014 (Day 316) Maintenance. Compressor change. Notes on Data Quality In March, the full tide channels were low and lagging on some falling tides, particularly spring tides.
28

UKCMF Annual Tide Gauge Report 2014
Barmouth – Map & Images of Site
©Crown copyright. All rights reserved NERC 100017897 2014
29

UKCMF Annual Tide Gauge Report 2014
Barmouth – Statistics
Surge Maxima Surge Minima
Channel 1 Channel 2 Channel 1 Channel 2 Value Day Time Value Day Time Value Day Time Value Day Time
Jan 1.094 3 19:00:00 1.094 3 19:00:00 -0.44 26 00:30:00 -0.439 26 00:30:00 Feb 2.533 12 15:30:00 2.533 12 15:30:00 -0.53 28 09:15:00 -0.555 28 09:15:00 Mar 0.752 20 12:30:00 0.745 20 12:30:00 -0.38 16 11:30:00 -0.385 16 11:30:00 Apr 0.498 6 10:45:00 0.505 6 10:45:00 -0.3 14 11:45:00 -0.305 14 11:45:00 May 0.692 10 14:45:00 0.698 10 14:45:00 -0.3 15 23:45:00 -0.307 15 23:45:00 Jun 0.192 28 00:15:00 0.195 7 08:15:00 -0.264 17 14:00:00 -0.268 17 14:30:00 July 0.322 4 13:00:00 0.327 4 13:00:00 -0.297 9 06:15:00 -0.293 9 06:15:00 Aug 0.378 13 05:00:00 0.382 13 05:00:00 -0.193 26 16:00:00 -0.188 26 16:00:00 Sep 0.276 10 04:00:00 0.274 10 04:00:00 -0.267 2 06:30:00 -0.261 2 06:30:00 Oct 0.907 21 03:45:00 0.911 21 03:45:00 -0.355 21 18:30:00 -0.351 21 18:30:00 Nov 0.94 13 15:45:00 0.946 13 15:45:00 -0.232 17 17:45:00 -0.226 17 17:45:00 Dec 0.486 9 17:45:00 0.49 9 17:00:00 -0.558 28 01:30:00 -0.557 28 01:30:00
Extreme Maxima Extreme Minima
Channel 1 Channel 2 Channel 1 Channel 2 Value Day Time Value Day Time Value Day Time Value Day Time
Jan 3.924 3 09:15:00 3.92 3 09:15:00 -1.674 30 15:30:00 -1.672 30 15:30:00 Feb 3.686 3 10:30:00 3.687 3 10:30:00 -1.686 28 14:45:00 -1.701 28 15:15:00 Mar 3.542 2 08:45:00 3.547 2 08:45:00 -1.687 1 03:15:00 -1.702 28 13:45:00 Apr 3.034 1 09:15:00 3.04 1 09:15:00 -1.688 2 05:00:00 -1.702 2 05:00:00 May 2.636 1 09:30:00 2.643 1 09:30:00 -1.687 2 05:15:00 -1.701 15 03:30:00 Jun 2.712 15 22:00:00 2.718 15 22:00:00 -1.686 12 14:45:00 -1.701 15 05:00:00 July 3.237 14 21:45:00 3.243 14 21:45:00 -1.686 12 02:45:00 -1.701 13 04:00:00 Aug 3.432 12 21:30:00 3.438 12 21:30:00 -1.686 13 05:45:00 -1.7 13 17:30:00 Sep 3.304 10 21:15:00 3.311 10 21:15:00 -1.687 11 05:00:00 -1.701 8 02:30:00 Oct 3.524 8 20:00:00 3.528 8 20:00:00 -1.59 11 17:30:00 -1.586 11 17:30:00 Nov 3.132 7 20:15:00 3.134 7 20:15:00 -1.54 24 16:45:00 -1.535 24 16:45:00 Dec 3.052 23 08:45:00 3.055 23 08:45:00 -1.681 25 18:15:00 -1.678 25 18:15:00
Mean Sea Level
Channel 1 Channel 2 January 26 0.52 26 0.52 February 24 0.635 24 0.636 March 26 0.212 26 0.215 April 28 0.248 28 0.25 May 31 0.226 31 0.229 June 30 0.193 30 0.197 July 31 0.235 31 0.239 August 23 0.297 23 0.3 September 23 0.247 23 0.249 October 13 * 13 * November 14 * 14 * December 10 * 10 * TOTAL & AVG 279 ** 279 ** * No mean sea level value as more than 15 days of data missing ** No yearly average value as more than one month’s MSL missing
30
UKCMF Annual Tide Gauge Report 2014
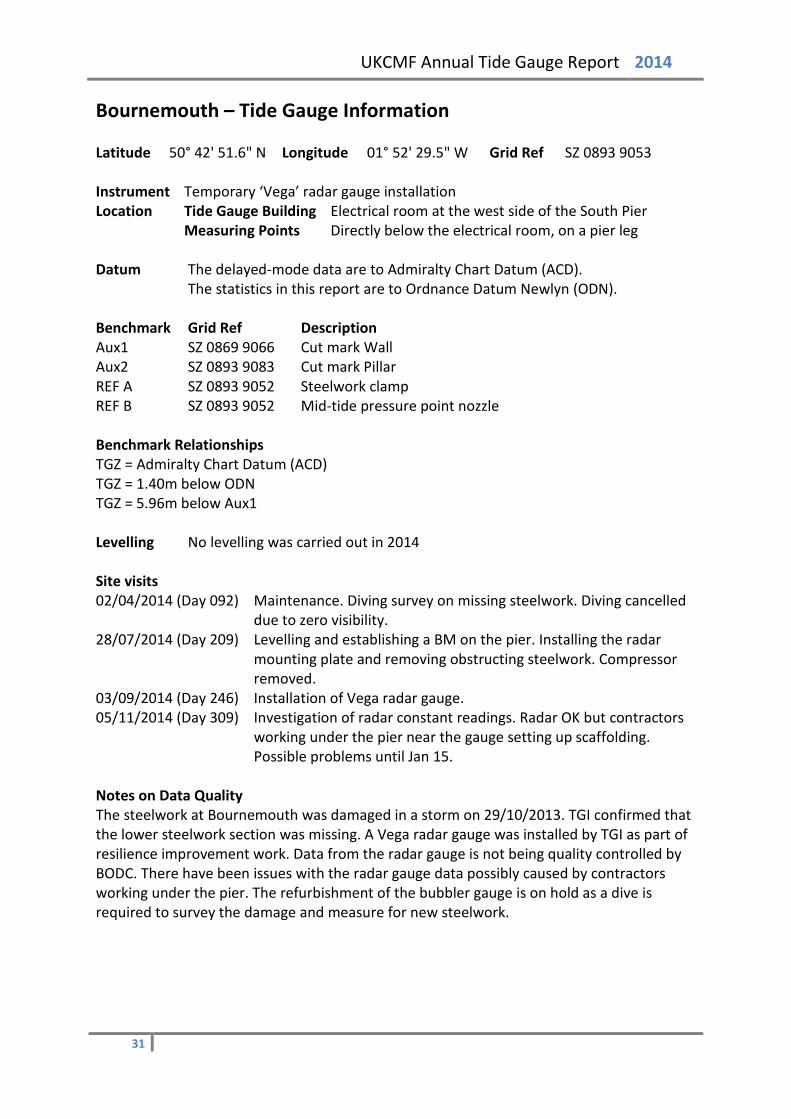
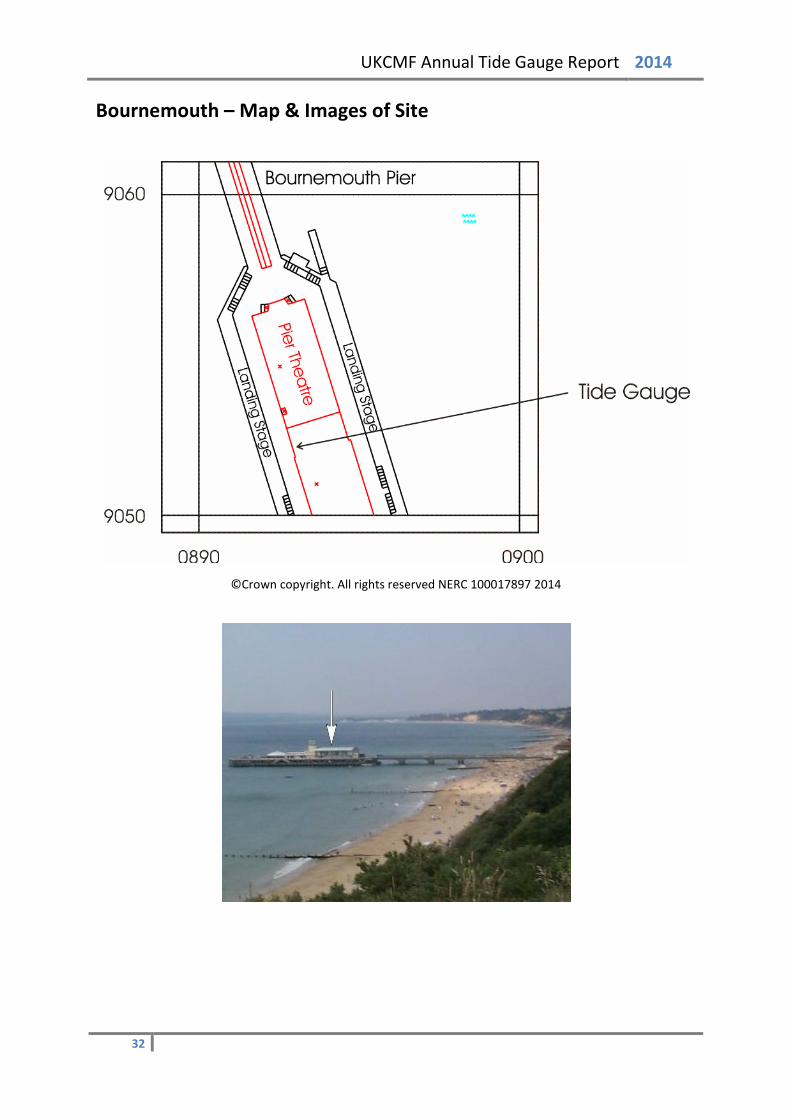
Bournemouth – Tide Gauge Information Latitude 50° 42' 51.6" N Longitude 01° 52' 29.5" W Grid Ref SZ 0893 9053 Instrument Temporary ‘Vega’ radar gauge installation Location Tide Gauge Building Electrical room at the west side of the South Pier
Measuring Points Directly below the electrical room, on a pier leg Datum The delayed-mode data are to Admiralty Chart Datum (ACD).
The statistics in this report are to Ordnance Datum Newlyn (ODN). Benchmark Grid Ref Description Aux1 SZ 0869 9066 Cut mark Wall Aux2 SZ 0893 9083 Cut mark Pillar REF A SZ 0893 9052 Steelwork clamp REF B SZ 0893 9052 Mid-tide pressure point nozzle Benchmark Relationships TGZ = Admiralty Chart Datum (ACD) TGZ = 1.40m below ODN TGZ = 5.96m below Aux1 Levelling No levelling was carried out in 2014 Site visits 02/04/2014 (Day 092) Maintenance. Diving survey on missing steelwork. Diving cancelled
due to zero visibility. 28/07/2014 (Day 209) Levelling and establishing a BM on the pier. Installing the radar
mounting plate and removing obstructing steelwork. Compressor removed.
03/09/2014 (Day 246) Installation of Vega radar gauge. 05/11/2014 (Day 309) Investigation of radar constant readings. Radar OK but contractors
working under the pier near the gauge setting up scaffolding. Possible problems until Jan 15.
Notes on Data Quality The steelwork at Bournemouth was damaged in a storm on 29/10/2013. TGI confirmed that the lower steelwork section was missing. A Vega radar gauge was installed by TGI as part of resilience improvement work. Data from the radar gauge is not being quality controlled by BODC. There have been issues with the radar gauge data possibly caused by contractors working under the pier. The refurbishment of the bubbler gauge is on hold as a dive is required to survey the damage and measure for new steelwork.
31
UKCMF Annual Tide Gauge Report 2014
Bournemouth – Map & Images of Site
©Crown copyright. All rights reserved NERC 100017897 2014
32
UKCMF Annual Tide Gauge Report 2014
Bournemouth – Statistics Neither the Primary nor Secondary channel were operational during 2014, so no statistics were produced.
33
UKCMF Annual Tide Gauge Report 2014
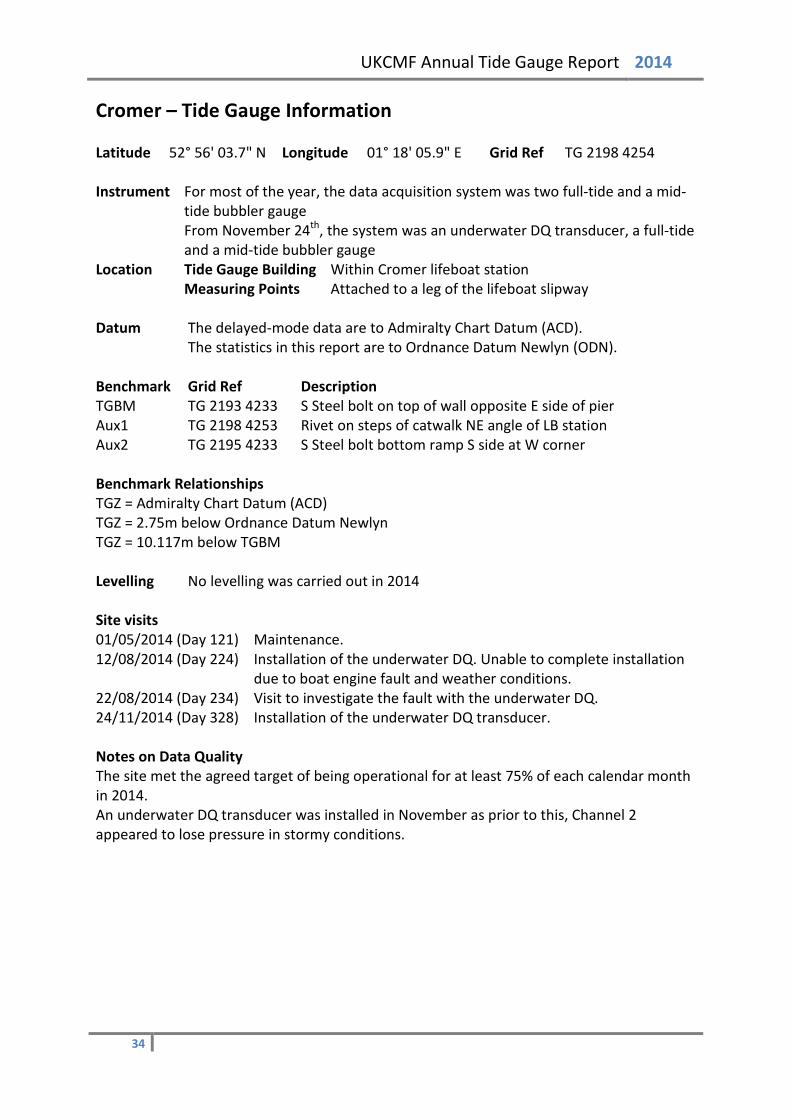
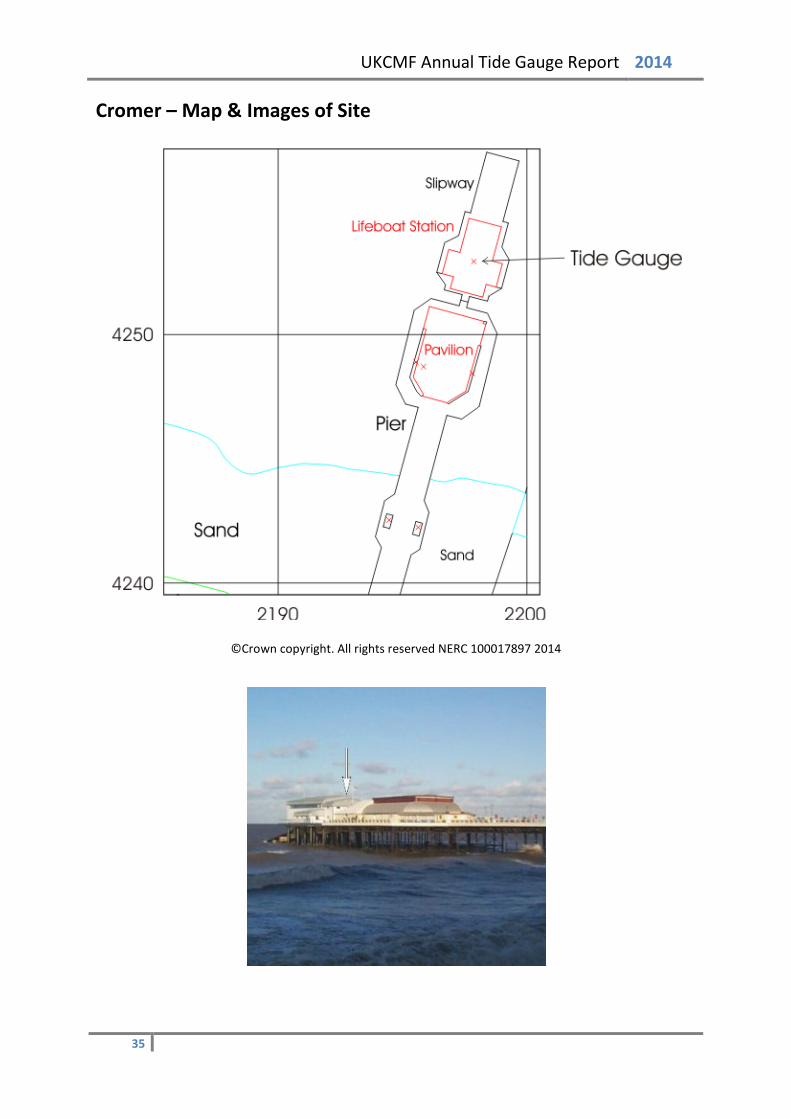
Cromer – Tide Gauge Information Latitude 52° 56' 03.7" N Longitude 01° 18' 05.9" E Grid Ref TG 2198 4254 Instrument For most of the year, the data acquisition system was two full-tide and a mid-
tide bubbler gauge From November 24th, the system was an underwater DQ transducer, a full-tide and a mid-tide bubbler gauge
Location Tide Gauge Building Within Cromer lifeboat station Measuring Points Attached to a leg of the lifeboat slipway
Datum The delayed-mode data are to Admiralty Chart Datum (ACD).
The statistics in this report are to Ordnance Datum Newlyn (ODN). Benchmark Grid Ref Description TGBM TG 2193 4233 S Steel bolt on top of wall opposite E side of pier Aux1 TG 2198 4253 Rivet on steps of catwalk NE angle of LB station Aux2 TG 2195 4233 S Steel bolt bottom ramp S side at W corner Benchmark Relationships TGZ = Admiralty Chart Datum (ACD) TGZ = 2.75m below Ordnance Datum Newlyn TGZ = 10.117m below TGBM Levelling No levelling was carried out in 2014 Site visits 01/05/2014 (Day 121) Maintenance. 12/08/2014 (Day 224) Installation of the underwater DQ. Unable to complete installation
due to boat engine fault and weather conditions. 22/08/2014 (Day 234) Visit to investigate the fault with the underwater DQ. 24/11/2014 (Day 328) Installation of the underwater DQ transducer. Notes on Data Quality The site met the agreed target of being operational for at least 75% of each calendar month in 2014. An underwater DQ transducer was installed in November as prior to this, Channel 2 appeared to lose pressure in stormy conditions.
34
UKCMF Annual Tide Gauge Report 2014
Cromer – Map & Images of Site
©Crown copyright. All rights reserved NERC 100017897 2014
35

UKCMF Annual Tide Gauge Report 2014
Cromer – Statistics
Surge Maxima Surge Minima
Channel 1 Channel 2 Channel 1 Channel 2 Value Day Time Value Day Time Value Day Time Value Day Time
Jan 0.582 25 22:00:00 0.555 4 17:45:00 -1.049 25 00:30:00 -0.806 3 16:45:00 Feb 0.483 21 07:15:00 0.483 28 02:30:00 -0.957 13 01:30:00 -0.601 5 18:00:00 Mar 1.3 15 02:30:00 0.458 9 14:45:00 -0.896 8 20:15:00 -0.707 8 14:45:00 Apr 0.667 18 03:15:00 0.675 18 03:15:00 -0.39 15 16:15:00 -0.381 15 16:15:00 May 0.33 6 21:30:00 0.339 6 23:00:00 -0.27 15 03:15:00 -0.267 15 03:15:00 Jun 0.36 19 09:00:00 0.375 19 09:00:00 -0.199 23 00:30:00 -0.179 23 00:30:00 July 0.451 9 10:45:00 0.463 9 10:45:00 -0.293 16 18:45:00 -0.277 16 18:45:00 Aug 0.382 18 07:15:00 0.407 18 07:15:00 -0.351 3 19:30:00 -0.331 3 19:30:00 Sep 0.695 26 16:15:00 0.244 24 20:15:00 -0.257 12 18:00:00 -0.245 11 17:15:00 Oct 1.752 22 00:15:00 0.741 21 14:00:00 -0.655 6 13:45:00 -0.473 18 11:15:00 Nov 0.37 15 16:45:00 0.379 15 16:45:00 -0.662 7 03:00:00 -0.648 7 03:00:00 Dec 1.343 10 05:30:00 1.341 10 05:30:00 -1.462 9 18:00:00 -1.452 9 18:00:00
Extreme Maxima Extreme Minima
Channel 1 Channel 2 Channel 1 Channel 2 Value Day Time Value Day Time Value Day Time Value Day Time
Jan 3.008 4 20:30:00 3.019 4 20:30:00 -2.611 6 04:30:00 -2.597 6 04:30:00 Feb 2.78 2 20:15:00 2.269 3 08:45:00 -3.11 1 02:00:00 -2.261 3 03:15:00 Mar 2.714 3 19:45:00 2.743 3 20:00:00 -2.609 3 02:30:00 -2.597 3 02:30:00 Apr 2.683 17 19:45:00 2.702 17 19:45:00 -2.266 16 01:30:00 -2.259 16 01:30:00 May 2.346 17 07:45:00 2.358 17 07:45:00 -2.155 15 01:00:00 -2.15 15 01:00:00 Jun 2.5 16 08:30:00 2.513 16 08:30:00 -2.144 15 14:45:00 -2.133 15 14:45:00 July 2.72 15 08:15:00 2.74 15 08:15:00 -2.354 16 16:15:00 -2.341 16 16:15:00 Aug 2.874 13 08:00:00 2.893 13 08:00:00 -2.379 12 14:15:00 -2.359 12 14:15:00 Sep 2.86 10 07:00:00 2.87 10 07:00:00 -2.346 10 14:00:00 -2.333 10 14:00:00 Oct 2.871 10 07:15:00 2.5 27 08:15:00 -2.241 9 13:45:00 -1.882 25 13:45:00 Nov 2.578 8 07:00:00 2.592 8 07:00:00 -2.332 7 01:00:00 -2.316 7 01:00:00 Dec 2.574 20 17:00:00 2.621 8 19:15:00 -2.205 9 15:00:00 -2.195 9 15:00:00
Mean Sea Level
Channel 1 Channel 2 January 31 0.096 7 * February 28 0.085 2 * March 31 0.142 3 * April 30 0.187 14 * May 31 0.151 31 0.162 June 30 0.188 30 0.204 July 31 0.244 29 0.246 August 30 0.25 28 0.266 September 30 0.274 17 0.244 October 31 0.314 12 * November 25 0.243 28 0.266 December 27 0.308 22 0.324 TOTAL & AVG 355 0.207 223 ** * No mean sea level value as more than 15 days of data missing ** No yearly average value as more than one month’s MSL missing
36
UKCMF Annual Tide Gauge Report 2014
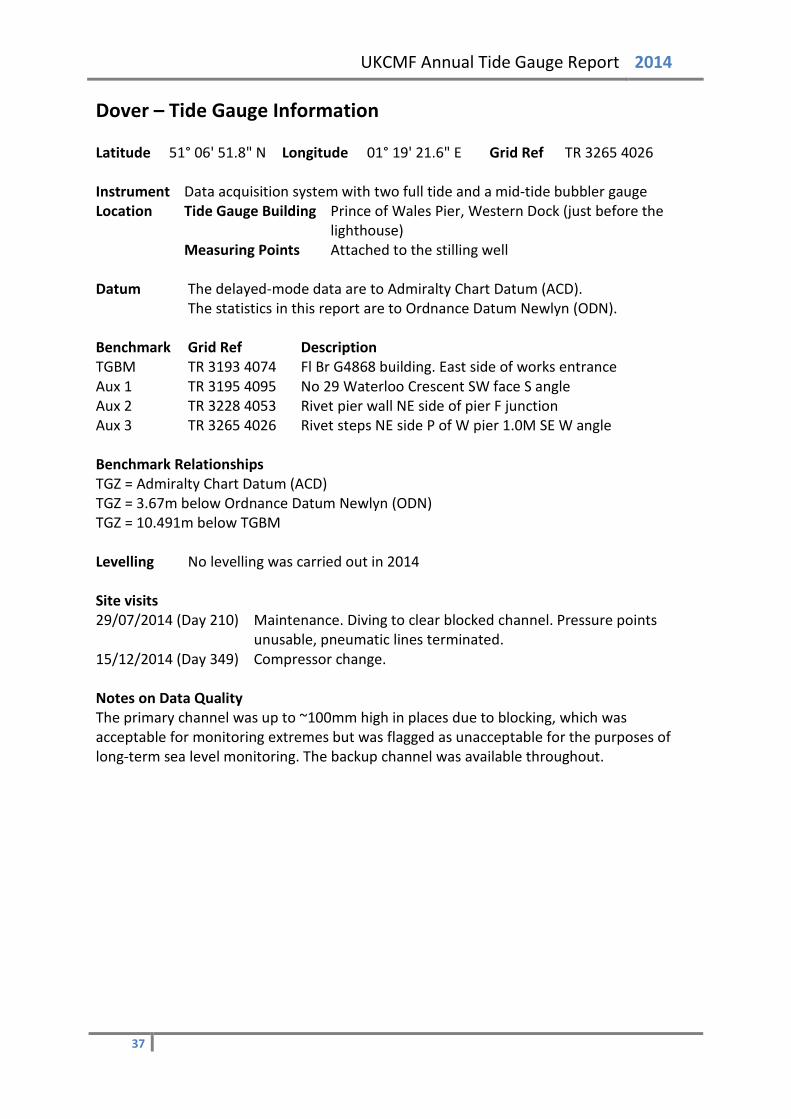
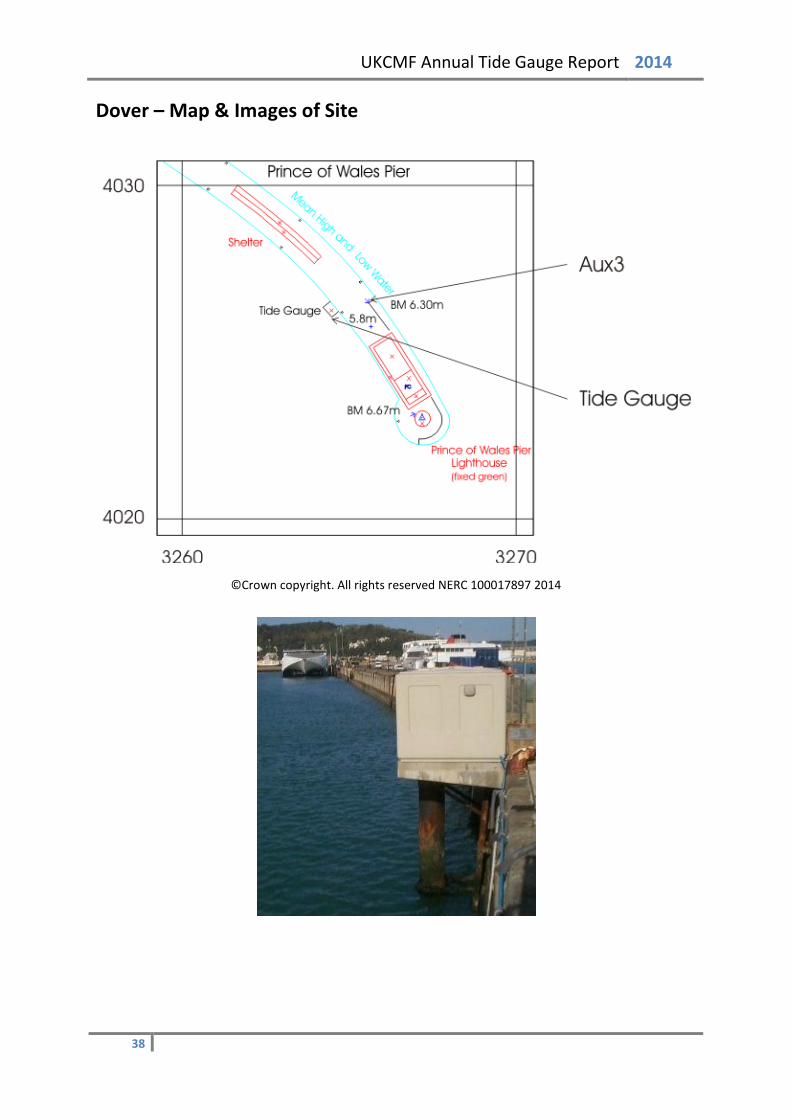
Dover – Tide Gauge Information Latitude 51° 06' 51.8" N Longitude 01° 19' 21.6" E Grid Ref TR 3265 4026 Instrument Data acquisition system with two full tide and a mid-tide bubbler gauge Location Tide Gauge Building Prince of Wales Pier, Western Dock (just before the
lighthouse) Measuring Points Attached to the stilling well
Datum The delayed-mode data are to Admiralty Chart Datum (ACD).
The statistics in this report are to Ordnance Datum Newlyn (ODN). Benchmark Grid Ref Description TGBM TR 3193 4074 Fl Br G4868 building. East side of works entrance Aux 1 TR 3195 4095 No 29 Waterloo Crescent SW face S angle Aux 2 TR 3228 4053 Rivet pier wall NE side of pier F junction Aux 3 TR 3265 4026 Rivet steps NE side P of W pier 1.0M SE W angle Benchmark Relationships TGZ = Admiralty Chart Datum (ACD) TGZ = 3.67m below Ordnance Datum Newlyn (ODN) TGZ = 10.491m below TGBM Levelling No levelling was carried out in 2014 Site visits 29/07/2014 (Day 210) Maintenance. Diving to clear blocked channel. Pressure points
unusable, pneumatic lines terminated. 15/12/2014 (Day 349) Compressor change. Notes on Data Quality The primary channel was up to ~100mm high in places due to blocking, which was acceptable for monitoring extremes but was flagged as unacceptable for the purposes of long-term sea level monitoring. The backup channel was available throughout.
37
UKCMF Annual Tide Gauge Report 2014
Dover – Map & Images of Site
©Crown copyright. All rights reserved NERC 100017897 2014
38
UKCMF Annual Tide Gauge Report 2014
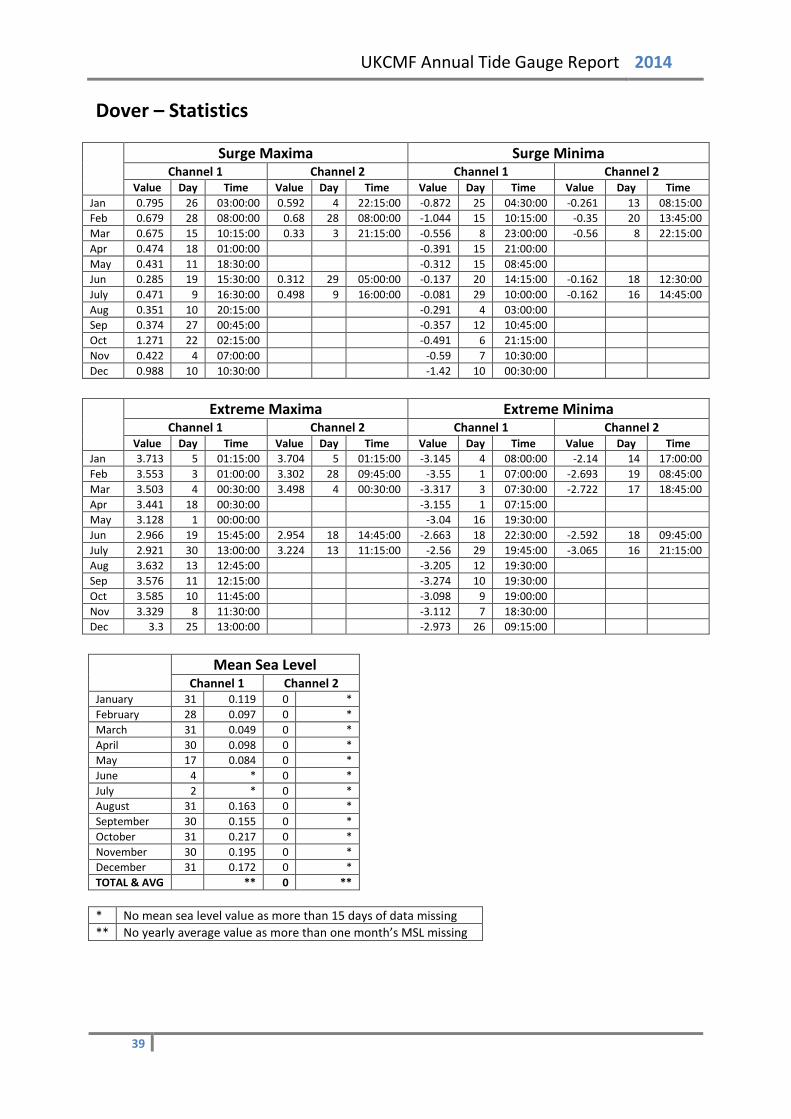
Dover – Statistics
Surge Maxima Surge Minima
Channel 1 Channel 2 Channel 1 Channel 2 Value Day Time Value Day Time Value Day Time Value Day Time
Jan 0.795 26 03:00:00 0.592 4 22:15:00 -0.872 25 04:30:00 -0.261 13 08:15:00 Feb 0.679 28 08:00:00 0.68 28 08:00:00 -1.044 15 10:15:00 -0.35 20 13:45:00 Mar 0.675 15 10:15:00 0.33 3 21:15:00 -0.556 8 23:00:00 -0.56 8 22:15:00 Apr 0.474 18 01:00:00 -0.391 15 21:00:00 May 0.431 11 18:30:00 -0.312 15 08:45:00 Jun 0.285 19 15:30:00 0.312 29 05:00:00 -0.137 20 14:15:00 -0.162 18 12:30:00 July 0.471 9 16:30:00 0.498 9 16:00:00 -0.081 29 10:00:00 -0.162 16 14:45:00 Aug 0.351 10 20:15:00 -0.291 4 03:00:00 Sep 0.374 27 00:45:00 -0.357 12 10:45:00 Oct 1.271 22 02:15:00 -0.491 6 21:15:00 Nov 0.422 4 07:00:00 -0.59 7 10:30:00 Dec 0.988 10 10:30:00 -1.42 10 00:30:00
Extreme Maxima Extreme Minima
Channel 1 Channel 2 Channel 1 Channel 2 Value Day Time Value Day Time Value Day Time Value Day Time
Jan 3.713 5 01:15:00 3.704 5 01:15:00 -3.145 4 08:00:00 -2.14 14 17:00:00 Feb 3.553 3 01:00:00 3.302 28 09:45:00 -3.55 1 07:00:00 -2.693 19 08:45:00 Mar 3.503 4 00:30:00 3.498 4 00:30:00 -3.317 3 07:30:00 -2.722 17 18:45:00 Apr 3.441 18 00:30:00 -3.155 1 07:15:00 May 3.128 1 00:00:00 -3.04 16 19:30:00 Jun 2.966 19 15:45:00 2.954 18 14:45:00 -2.663 18 22:30:00 -2.592 18 09:45:00 July 2.921 30 13:00:00 3.224 13 11:15:00 -2.56 29 19:45:00 -3.065 16 21:15:00 Aug 3.632 13 12:45:00 -3.205 12 19:30:00 Sep 3.576 11 12:15:00 -3.274 10 19:30:00 Oct 3.585 10 11:45:00 -3.098 9 19:00:00 Nov 3.329 8 11:30:00 -3.112 7 18:30:00 Dec 3.3 25 13:00:00 -2.973 26 09:15:00
Mean Sea Level
Channel 1 Channel 2 January 31 0.119 0 * February 28 0.097 0 * March 31 0.049 0 * April 30 0.098 0 * May 17 0.084 0 * June 4 * 0 * July 2 * 0 * August 31 0.163 0 * September 30 0.155 0 * October 31 0.217 0 * November 30 0.195 0 * December 31 0.172 0 * TOTAL & AVG ** 0 ** * No mean sea level value as more than 15 days of data missing ** No yearly average value as more than one month’s MSL missing
39
UKCMF Annual Tide Gauge Report 2014
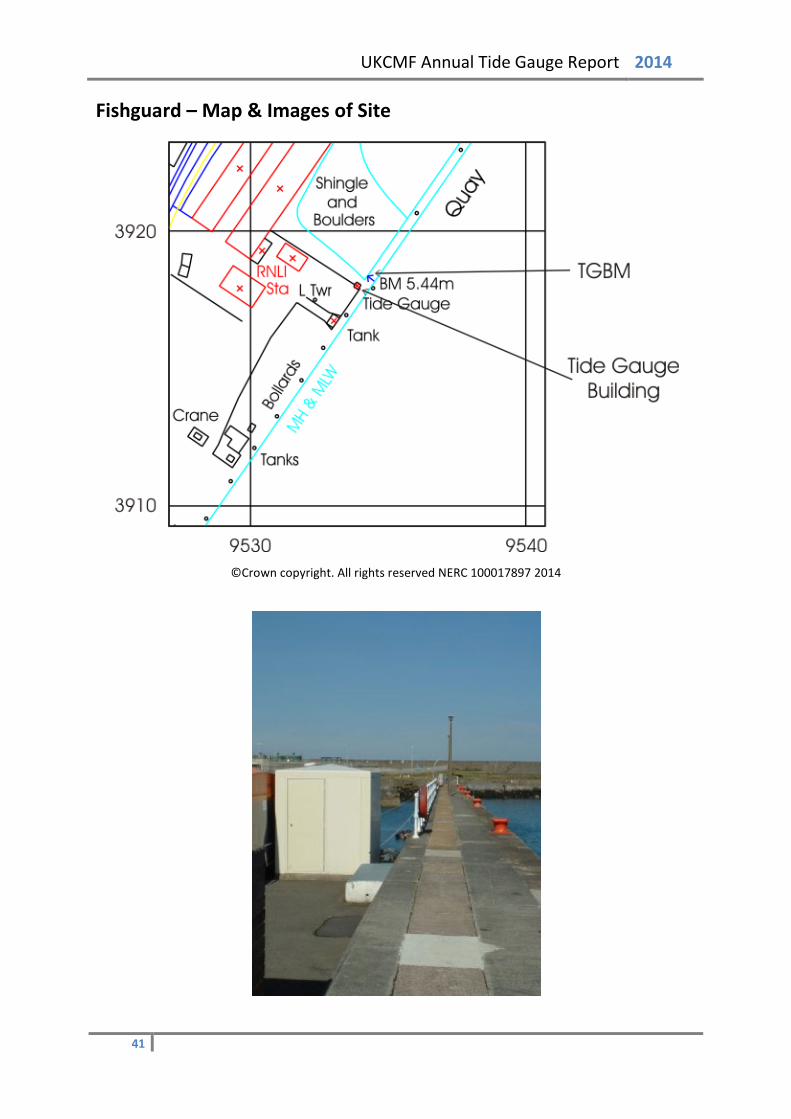
Fishguard – Tide Gauge Information Latitude 52° 00' 47.6" N Longitude 04° 59' 01.5" W Grid Ref SM 9534 3918 Instrument Data acquisition system with two full tide and a mid-tide bubbler gauge Location Tide Gauge Building On Fishguard Quay, adjacent to the RNLI station
Measuring Points Approximately 10m from the end of the quay Datum The delayed-mode data are to Admiralty Chart Datum (ACD).
The statistics in this report are to Ordnance Datum Newlyn (ODN). Benchmark Grid Ref Description TGBM SM 9534 3918 OSBM bolt on quay 3.6M NE end of railings (1987) Aux1 SM 9513 3874 OS bolt con base railings 6.4M NW angle TG hut Aux2 SM 9489 3849 Rivet step top of Goodwick Quay Aux3 SM 9455 3820 Fl Br 11518 building SW side railway bridge SE Face Benchmark Relationships TGZ = Admiralty Chart Datum (ACD) TGZ = 2.44m below ODN TGZ = 7.88m below TGBM Levelling No levelling was carried out in 2014 Site visits 06/11/2014 (Day 310) Maintenance. Compressor change. Notes on Data Quality The site met the agreed target of being operational for at least 75% of each calendar month in 2014.
40
UKCMF Annual Tide Gauge Report 2014
Fishguard – Map & Images of Site
©Crown copyright. All rights reserved NERC 100017897 2014
41

UKCMF Annual Tide Gauge Report 2014
Fishguard – Statistics
Surge Maxima Surge Minima
Channel 1 Channel 2 Channel 1 Channel 2 Value Day Time Value Day Time Value Day Time Value Day Time
Jan 0.752 3 14:45:00 0.752 3 14:45:00 -0.316 25 22:45:00 -0.316 25 22:45:00 Feb 1.405 12 14:00:00 1.403 12 14:00:00 -0.337 28 08:45:00 -0.336 28 08:45:00 Mar 0.484 2 15:00:00 0.486 2 15:00:00 -0.221 10 16:15:00 -0.222 25 18:00:00 Apr 0.45 25 23:45:00 0.47 26 00:15:00 -0.159 14 10:30:00 -0.078 13 03:00:00 May 0.385 10 10:15:00 0.385 10 10:15:00 -0.211 15 13:30:00 -0.203 15 13:30:00 Jun 0.229 27 17:30:00 0.25 27 17:30:00 -0.162 15 11:15:00 -0.151 15 11:15:00 July 0.293 4 11:45:00 0.305 4 12:15:00 -0.147 9 10:30:00 -0.135 9 10:30:00 Aug 0.299 10 02:00:00 0.32 10 02:00:00 -0.079 15 21:45:00 -0.05 15 21:45:00 Sep 0.213 17 21:15:00 0.233 17 21:15:00 -0.143 2 06:15:00 -0.133 2 06:15:00 Oct 0.579 21 03:45:00 0.577 21 03:45:00 -0.302 21 22:15:00 -0.292 21 16:45:00 Nov 0.393 6 14:15:00 0.635 14 03:15:00 -0.072 23 06:45:00 -0.086 23 06:45:00 Dec 0.421 12 00:30:00 0.402 12 00:30:00 -0.349 27 01:30:00 -0.373 27 01:30:00
Extreme Maxima Extreme Minima
Channel 1 Channel 2 Channel 1 Channel 2 Value Day Time Value Day Time Value Day Time Value Day Time
Jan 3.368 3 08:00:00 3.365 3 08:00:00 -1.635 30 13:15:00 -1.638 30 13:15:00 Feb 3.362 3 09:30:00 3.362 3 09:30:00 -2.066 28 13:00:00 -2.063 28 13:00:00 Mar 3.229 2 07:45:00 3.227 2 07:45:00 -2.064 3 15:15:00 -2.067 3 15:15:00 Apr 2.783 1 08:15:00 2.783 2 08:45:00 -1.816 1 02:30:00 -1.815 1 02:30:00 May 2.431 1 08:30:00 2.442 1 08:30:00 -1.827 17 03:15:00 -1.82 16 02:15:00 Jun 2.48 15 21:00:00 2.492 15 21:00:00 -1.866 16 03:45:00 -1.85 16 03:45:00 July 2.902 14 20:45:00 2.924 14 20:45:00 -1.986 15 03:30:00 -1.964 15 03:30:00 Aug 3.087 12 20:30:00 3.1 12 20:30:00 -2.008 13 03:15:00 -1.991 13 03:15:00 Sep 3.023 10 20:00:00 3.044 10 20:15:00 -2.059 10 02:00:00 -2.049 10 02:00:00 Oct 3.198 8 19:00:00 3.209 8 19:00:00 -1.688 10 02:30:00 -1.68 10 02:30:00 Nov 2.672 6 06:15:00 3.084 6 18:45:00 -1.469 24 14:45:00 -1.491 24 14:45:00 Dec 2.678 23 07:45:00 2.648 23 07:45:00 -1.761 25 16:00:00 -1.773 25 16:00:00
Mean Sea Level
Channel 1 Channel 2 January 31 0.516 31 0.517 February 28 0.548 28 0.546 March 31 0.262 31 0.262 April 30 0.319 26 0.342 May 31 0.279 31 0.289 June 30 0.269 30 0.284 July 31 0.298 31 0.319 August 31 0.343 31 0.359 September 30 0.326 30 0.34 October 31 0.466 31 0.475 November 16 0.48 30 0.541 December 31 0.31 31 0.293 TOTAL & AVG 351 0.368 361 0.381 * No mean sea level value as more than 15 days of data missing ** No yearly average value as more than one month’s MSL missing
42
UKCMF Annual Tide Gauge Report 2014
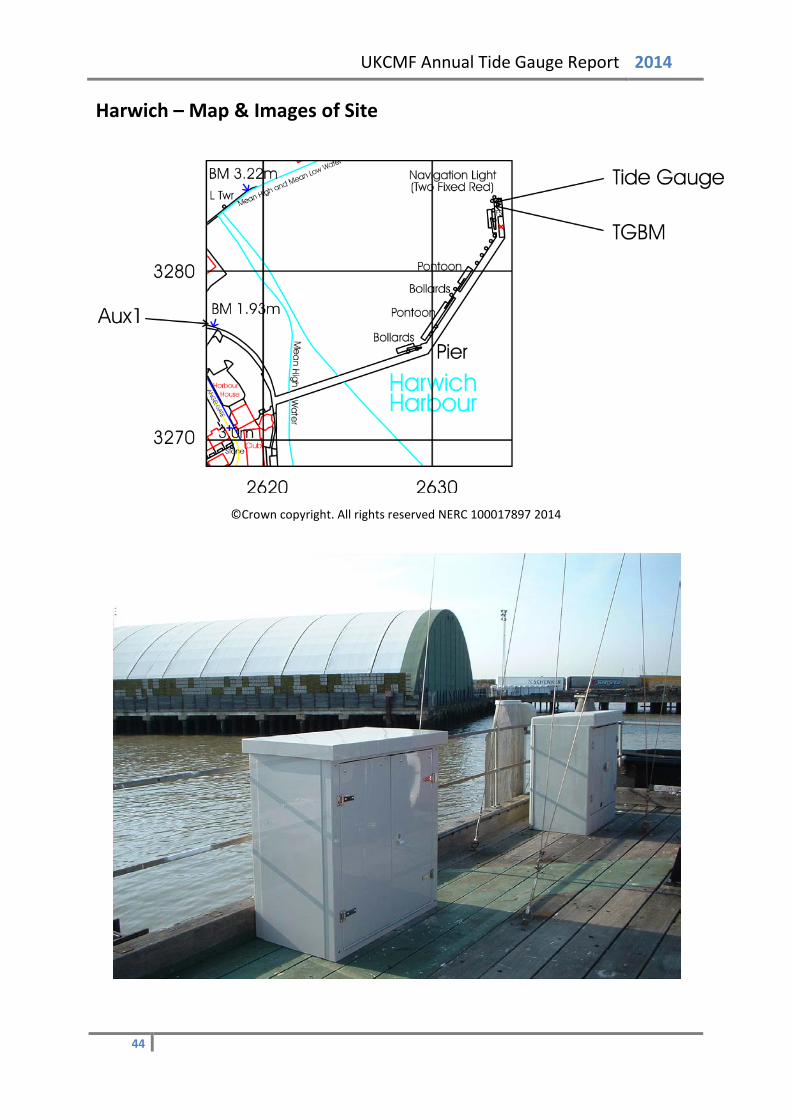
Harwich – Tide Gauge Information Latitude 51° 56' 52.8" N Longitude 01° 17' 31.7" E Grid Ref TM 2634 3284 Instrument Data acquisition system with two full tide and a mid-tide bubbler gauge Location Tide Gauge Building Seaward end of Harwich Haven Authority jetty
Measuring Points On the jetty, directly below the tide gauge cabinet Datum The delayed-mode data are to Admiralty Chart Datum (ACD).
The statistics in this report are to Ordnance Datum Newlyn (ODN). Benchmark Grid Ref Description TGBM TM 2634 3284 Bolt at base of flag staff Aux1 TM 2617 3277 Cut mark quay edge Aux2 TM 2608 3271 Cut mark NW face of Bank building Aux3 TM 2610 3258 Cut mark N side of entrance St Nicholas’s church Benchmark Relationships TGZ = Admiralty Chart Datum (ACD) TGZ = 2.02m below ODN TGZ = 6.17m below TGBM Levelling No levelling was carried out in 2014 Site visits No site visits were carried out in 2014 Notes on Data Quality Towards the end of the year Channel 2 was blocking and Channel 1 was reading 150-200mm high due to restricted flow.
43
UKCMF Annual Tide Gauge Report 2014
Harwich – Map & Images of Site
©Crown copyright. All rights reserved NERC 100017897 2014
44
UKCMF Annual Tide Gauge Report 2014
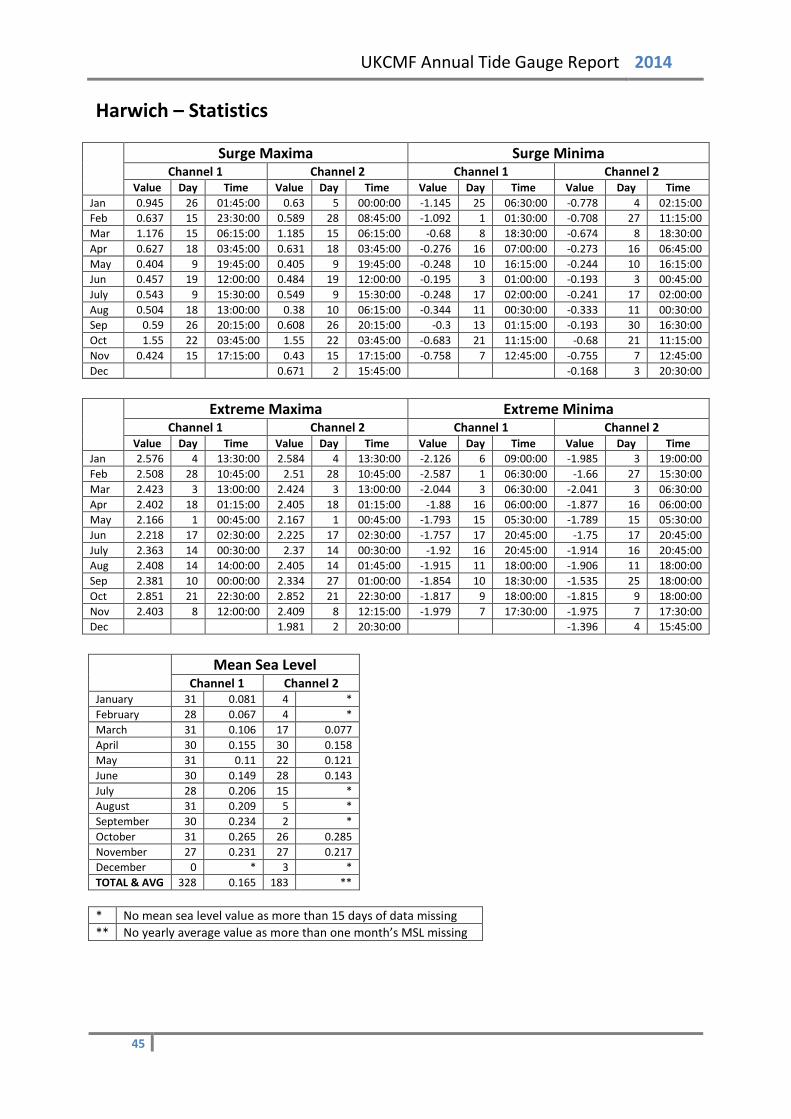
Harwich – Statistics
Surge Maxima Surge Minima
Channel 1 Channel 2 Channel 1 Channel 2 Value Day Time Value Day Time Value Day Time Value Day Time
Jan 0.945 26 01:45:00 0.63 5 00:00:00 -1.145 25 06:30:00 -0.778 4 02:15:00 Feb 0.637 15 23:30:00 0.589 28 08:45:00 -1.092 1 01:30:00 -0.708 27 11:15:00 Mar 1.176 15 06:15:00 1.185 15 06:15:00 -0.68 8 18:30:00 -0.674 8 18:30:00 Apr 0.627 18 03:45:00 0.631 18 03:45:00 -0.276 16 07:00:00 -0.273 16 06:45:00 May 0.404 9 19:45:00 0.405 9 19:45:00 -0.248 10 16:15:00 -0.244 10 16:15:00 Jun 0.457 19 12:00:00 0.484 19 12:00:00 -0.195 3 01:00:00 -0.193 3 00:45:00 July 0.543 9 15:30:00 0.549 9 15:30:00 -0.248 17 02:00:00 -0.241 17 02:00:00 Aug 0.504 18 13:00:00 0.38 10 06:15:00 -0.344 11 00:30:00 -0.333 11 00:30:00 Sep 0.59 26 20:15:00 0.608 26 20:15:00 -0.3 13 01:15:00 -0.193 30 16:30:00 Oct 1.55 22 03:45:00 1.55 22 03:45:00 -0.683 21 11:15:00 -0.68 21 11:15:00 Nov 0.424 15 17:15:00 0.43 15 17:15:00 -0.758 7 12:45:00 -0.755 7 12:45:00 Dec 0.671 2 15:45:00 -0.168 3 20:30:00
Extreme Maxima Extreme Minima
Channel 1 Channel 2 Channel 1 Channel 2 Value Day Time Value Day Time Value Day Time Value Day Time
Jan 2.576 4 13:30:00 2.584 4 13:30:00 -2.126 6 09:00:00 -1.985 3 19:00:00 Feb 2.508 28 10:45:00 2.51 28 10:45:00 -2.587 1 06:30:00 -1.66 27 15:30:00 Mar 2.423 3 13:00:00 2.424 3 13:00:00 -2.044 3 06:30:00 -2.041 3 06:30:00 Apr 2.402 18 01:15:00 2.405 18 01:15:00 -1.88 16 06:00:00 -1.877 16 06:00:00 May 2.166 1 00:45:00 2.167 1 00:45:00 -1.793 15 05:30:00 -1.789 15 05:30:00 Jun 2.218 17 02:30:00 2.225 17 02:30:00 -1.757 17 20:45:00 -1.75 17 20:45:00 July 2.363 14 00:30:00 2.37 14 00:30:00 -1.92 16 20:45:00 -1.914 16 20:45:00 Aug 2.408 14 14:00:00 2.405 14 01:45:00 -1.915 11 18:00:00 -1.906 11 18:00:00 Sep 2.381 10 00:00:00 2.334 27 01:00:00 -1.854 10 18:30:00 -1.535 25 18:00:00 Oct 2.851 21 22:30:00 2.852 21 22:30:00 -1.817 9 18:00:00 -1.815 9 18:00:00 Nov 2.403 8 12:00:00 2.409 8 12:15:00 -1.979 7 17:30:00 -1.975 7 17:30:00 Dec 1.981 2 20:30:00 -1.396 4 15:45:00
Mean Sea Level
Channel 1 Channel 2 January 31 0.081 4 * February 28 0.067 4 * March 31 0.106 17 0.077 April 30 0.155 30 0.158 May 31 0.11 22 0.121 June 30 0.149 28 0.143 July 28 0.206 15 * August 31 0.209 5 * September 30 0.234 2 * October 31 0.265 26 0.285 November 27 0.231 27 0.217 December 0 * 3 * TOTAL & AVG 328 0.165 183 ** * No mean sea level value as more than 15 days of data missing ** No yearly average value as more than one month’s MSL missing
45
UKCMF Annual Tide Gauge Report 2014
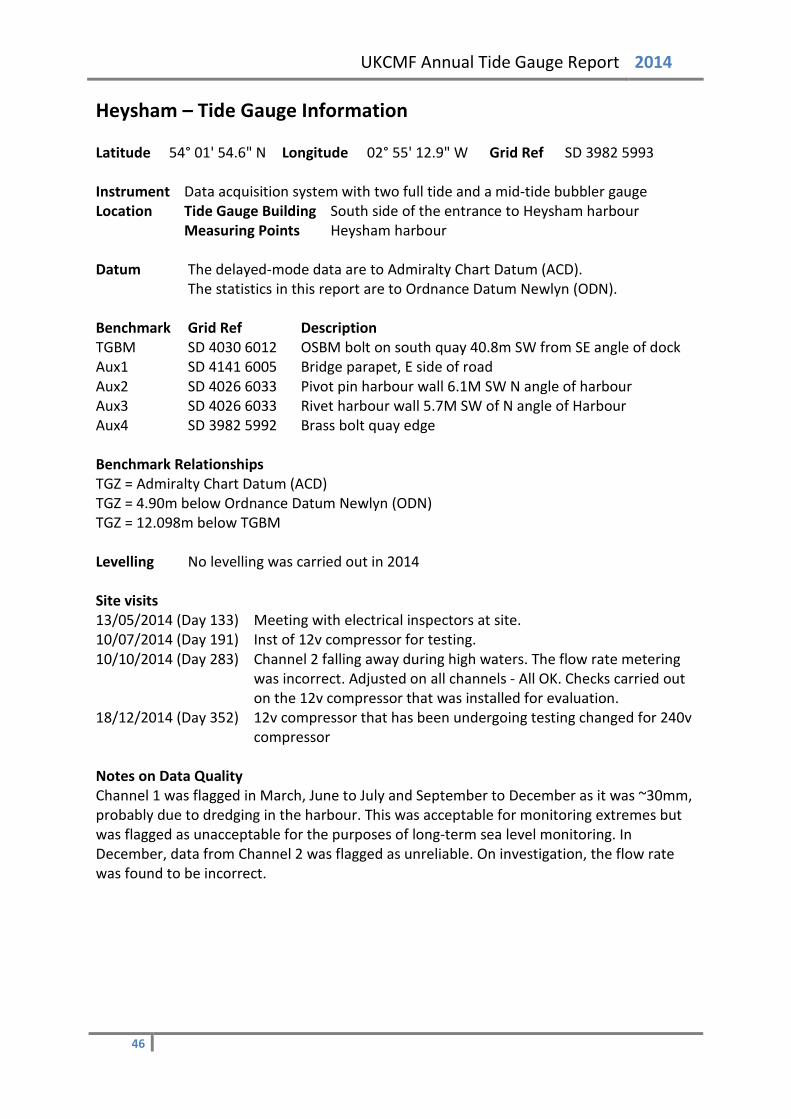
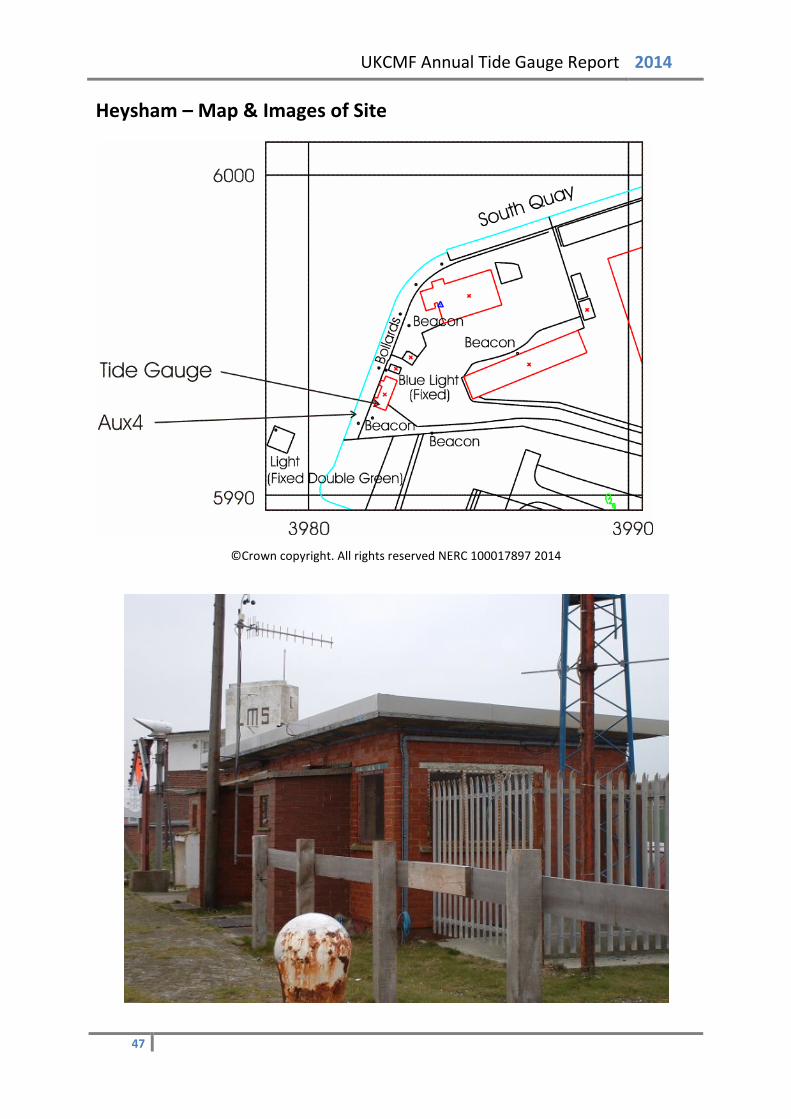
Heysham – Tide Gauge Information Latitude 54° 01' 54.6" N Longitude 02° 55' 12.9" W Grid Ref SD 3982 5993 Instrument Data acquisition system with two full tide and a mid-tide bubbler gauge Location Tide Gauge Building South side of the entrance to Heysham harbour
Measuring Points Heysham harbour Datum The delayed-mode data are to Admiralty Chart Datum (ACD).
The statistics in this report are to Ordnance Datum Newlyn (ODN). Benchmark Grid Ref Description TGBM SD 4030 6012 OSBM bolt on south quay 40.8m SW from SE angle of dock Aux1 SD 4141 6005 Bridge parapet, E side of road Aux2 SD 4026 6033 Pivot pin harbour wall 6.1M SW N angle of harbour Aux3 SD 4026 6033 Rivet harbour wall 5.7M SW of N angle of Harbour Aux4 SD 3982 5992 Brass bolt quay edge Benchmark Relationships TGZ = Admiralty Chart Datum (ACD) TGZ = 4.90m below Ordnance Datum Newlyn (ODN) TGZ = 12.098m below TGBM Levelling No levelling was carried out in 2014 Site visits 13/05/2014 (Day 133) Meeting with electrical inspectors at site. 10/07/2014 (Day 191) Inst of 12v compressor for testing. 10/10/2014 (Day 283) Channel 2 falling away during high waters. The flow rate metering
was incorrect. Adjusted on all channels - All OK. Checks carried out on the 12v compressor that was installed for evaluation.
18/12/2014 (Day 352) 12v compressor that has been undergoing testing changed for 240v compressor
Notes on Data Quality Channel 1 was flagged in March, June to July and September to December as it was ~30mm, probably due to dredging in the harbour. This was acceptable for monitoring extremes but was flagged as unacceptable for the purposes of long-term sea level monitoring. In December, data from Channel 2 was flagged as unreliable. On investigation, the flow rate was found to be incorrect.
46
UKCMF Annual Tide Gauge Report 2014
Heysham – Map & Images of Site
©Crown copyright. All rights reserved NERC 100017897 2014
47
UKCMF Annual Tide Gauge Report 2014
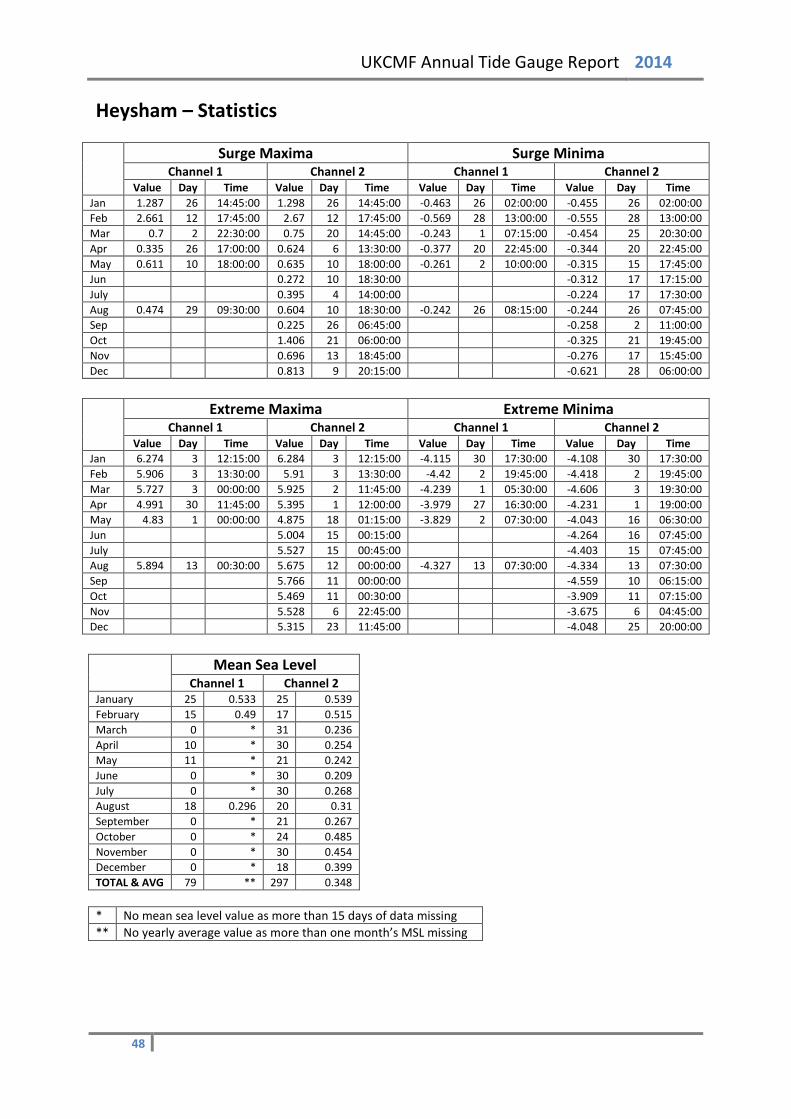
Heysham – Statistics
Surge Maxima Surge Minima
Channel 1 Channel 2 Channel 1 Channel 2 Value Day Time Value Day Time Value Day Time Value Day Time
Jan 1.287 26 14:45:00 1.298 26 14:45:00 -0.463 26 02:00:00 -0.455 26 02:00:00 Feb 2.661 12 17:45:00 2.67 12 17:45:00 -0.569 28 13:00:00 -0.555 28 13:00:00 Mar 0.7 2 22:30:00 0.75 20 14:45:00 -0.243 1 07:15:00 -0.454 25 20:30:00 Apr 0.335 26 17:00:00 0.624 6 13:30:00 -0.377 20 22:45:00 -0.344 20 22:45:00 May 0.611 10 18:00:00 0.635 10 18:00:00 -0.261 2 10:00:00 -0.315 15 17:45:00 Jun 0.272 10 18:30:00 -0.312 17 17:15:00 July 0.395 4 14:00:00 -0.224 17 17:30:00 Aug 0.474 29 09:30:00 0.604 10 18:30:00 -0.242 26 08:15:00 -0.244 26 07:45:00 Sep 0.225 26 06:45:00 -0.258 2 11:00:00 Oct 1.406 21 06:00:00 -0.325 21 19:45:00 Nov 0.696 13 18:45:00 -0.276 17 15:45:00 Dec 0.813 9 20:15:00 -0.621 28 06:00:00
Extreme Maxima Extreme Minima
Channel 1 Channel 2 Channel 1 Channel 2 Value Day Time Value Day Time Value Day Time Value Day Time
Jan 6.274 3 12:15:00 6.284 3 12:15:00 -4.115 30 17:30:00 -4.108 30 17:30:00 Feb 5.906 3 13:30:00 5.91 3 13:30:00 -4.42 2 19:45:00 -4.418 2 19:45:00 Mar 5.727 3 00:00:00 5.925 2 11:45:00 -4.239 1 05:30:00 -4.606 3 19:30:00 Apr 4.991 30 11:45:00 5.395 1 12:00:00 -3.979 27 16:30:00 -4.231 1 19:00:00 May 4.83 1 00:00:00 4.875 18 01:15:00 -3.829 2 07:30:00 -4.043 16 06:30:00 Jun 5.004 15 00:15:00 -4.264 16 07:45:00 July 5.527 15 00:45:00 -4.403 15 07:45:00 Aug 5.894 13 00:30:00 5.675 12 00:00:00 -4.327 13 07:30:00 -4.334 13 07:30:00 Sep 5.766 11 00:00:00 -4.559 10 06:15:00 Oct 5.469 11 00:30:00 -3.909 11 07:15:00 Nov 5.528 6 22:45:00 -3.675 6 04:45:00 Dec 5.315 23 11:45:00 -4.048 25 20:00:00
Mean Sea Level
Channel 1 Channel 2 January 25 0.533 25 0.539 February 15 0.49 17 0.515 March 0 * 31 0.236 April 10 * 30 0.254 May 11 * 21 0.242 June 0 * 30 0.209 July 0 * 30 0.268 August 18 0.296 20 0.31 September 0 * 21 0.267 October 0 * 24 0.485 November 0 * 30 0.454 December 0 * 18 0.399 TOTAL & AVG 79 ** 297 0.348 * No mean sea level value as more than 15 days of data missing ** No yearly average value as more than one month’s MSL missing
48
UKCMF Annual Tide Gauge Report 2014
Hinkley Point – Tide Gauge Information Latitude 51° 12' 38.2” N Longitude 03° 07' 52.8" W Grid Ref ST 2107 4632 Instrument Dataring system with dual underwater pressure transducers Location Tide Gauge Building Hinkley Point “A” power station
Measuring Points Underwater vented chambers suspended from a steel pole attached to a water intake tower (400m offshore)
Datum The delayed-mode data are to Admiralty Chart Datum (ACD).
The statistics in this report are to Ordnance Datum Newlyn (ODN). Benchmark Grid Ref Description TGBM ST 2104 4634 Bolt on wall 0.962m NE of SE corner of steps Aux1 ST 2078 4626 Rivet on sea wall 41.28m SW of corner of outfall Aux2 ST 2094 4631 Bolt on sea wall 31.245m SW of end of railings Aux3 ST 2123 4634 Bolt sea defence wall Benchmark Relationships TGZ = Admiralty Chart Datum (ACD) TGZ = 5.80m below Ordnance Datum Newlyn (ODN) TGZ = 14.639m below TGBM Levelling No levelling was carried out in 2014 Site visits 12/03/2014 (Day 071) Maintenance. Meeting with Doug Brown (HP) to discuss Caisson
access. 12/06/2014 (Day 163) Maintenance. Access to the caisson was planned but this was
cancelled by HP due to a fire service strike. Notes on Data Quality Channel 2 has been flagged throughout, due to the sensor being fouled up. In December Channel 1 was flagged on low waters. This is possibly due to turbulence in stormy weather.
49

UKCMF Annual Tide Gauge Report 2014
Hinkley Point – Map & Images of Site
©Crown copyright. All rights reserved NERC 100017897 2014
50
UKCMF Annual Tide Gauge Report 2014
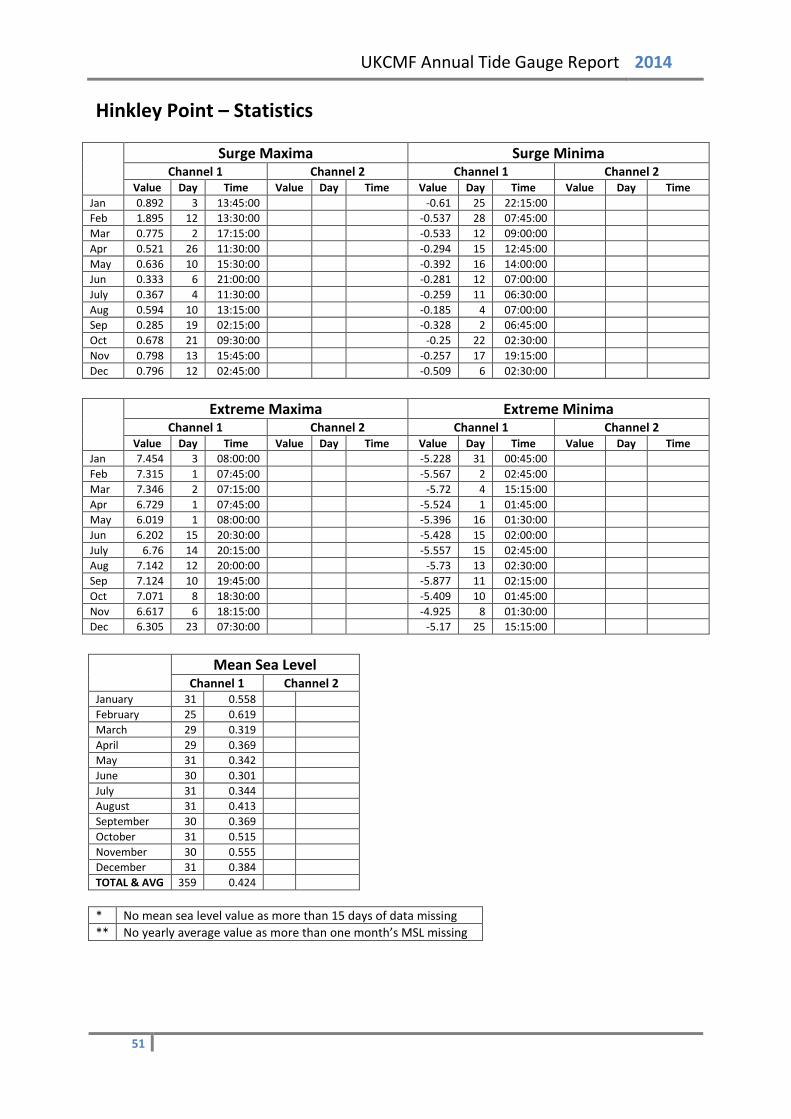
Hinkley Point – Statistics
Surge Maxima Surge Minima
Channel 1 Channel 2 Channel 1 Channel 2 Value Day Time Value Day Time Value Day Time Value Day Time
Jan 0.892 3 13:45:00 -0.61 25 22:15:00 Feb 1.895 12 13:30:00 -0.537 28 07:45:00 Mar 0.775 2 17:15:00 -0.533 12 09:00:00 Apr 0.521 26 11:30:00 -0.294 15 12:45:00 May 0.636 10 15:30:00 -0.392 16 14:00:00 Jun 0.333 6 21:00:00 -0.281 12 07:00:00 July 0.367 4 11:30:00 -0.259 11 06:30:00 Aug 0.594 10 13:15:00 -0.185 4 07:00:00 Sep 0.285 19 02:15:00 -0.328 2 06:45:00 Oct 0.678 21 09:30:00 -0.25 22 02:30:00 Nov 0.798 13 15:45:00 -0.257 17 19:15:00 Dec 0.796 12 02:45:00 -0.509 6 02:30:00
Extreme Maxima Extreme Minima
Channel 1 Channel 2 Channel 1 Channel 2 Value Day Time Value Day Time Value Day Time Value Day Time
Jan 7.454 3 08:00:00 -5.228 31 00:45:00 Feb 7.315 1 07:45:00 -5.567 2 02:45:00 Mar 7.346 2 07:15:00 -5.72 4 15:15:00 Apr 6.729 1 07:45:00 -5.524 1 01:45:00 May 6.019 1 08:00:00 -5.396 16 01:30:00 Jun 6.202 15 20:30:00 -5.428 15 02:00:00 July 6.76 14 20:15:00 -5.557 15 02:45:00 Aug 7.142 12 20:00:00 -5.73 13 02:30:00 Sep 7.124 10 19:45:00 -5.877 11 02:15:00 Oct 7.071 8 18:30:00 -5.409 10 01:45:00 Nov 6.617 6 18:15:00 -4.925 8 01:30:00 Dec 6.305 23 07:30:00 -5.17 25 15:15:00
Mean Sea Level
Channel 1 Channel 2 January 31 0.558 February 25 0.619 March 29 0.319 April 29 0.369 May 31 0.342 June 30 0.301 July 31 0.344 August 31 0.413 September 30 0.369 October 31 0.515 November 30 0.555 December 31 0.384 TOTAL & AVG 359 0.424 * No mean sea level value as more than 15 days of data missing ** No yearly average value as more than one month’s MSL missing
51
UKCMF Annual Tide Gauge Report 2014
Holyhead – Tide Gauge Information Latitude 53° 18' 50.2" N Longitude 04° 37' 13.6" W Grid Ref SH 2553 8287 Instrument Data acquisition system with a full-tide and a mid-tide bubbler gauge, with a
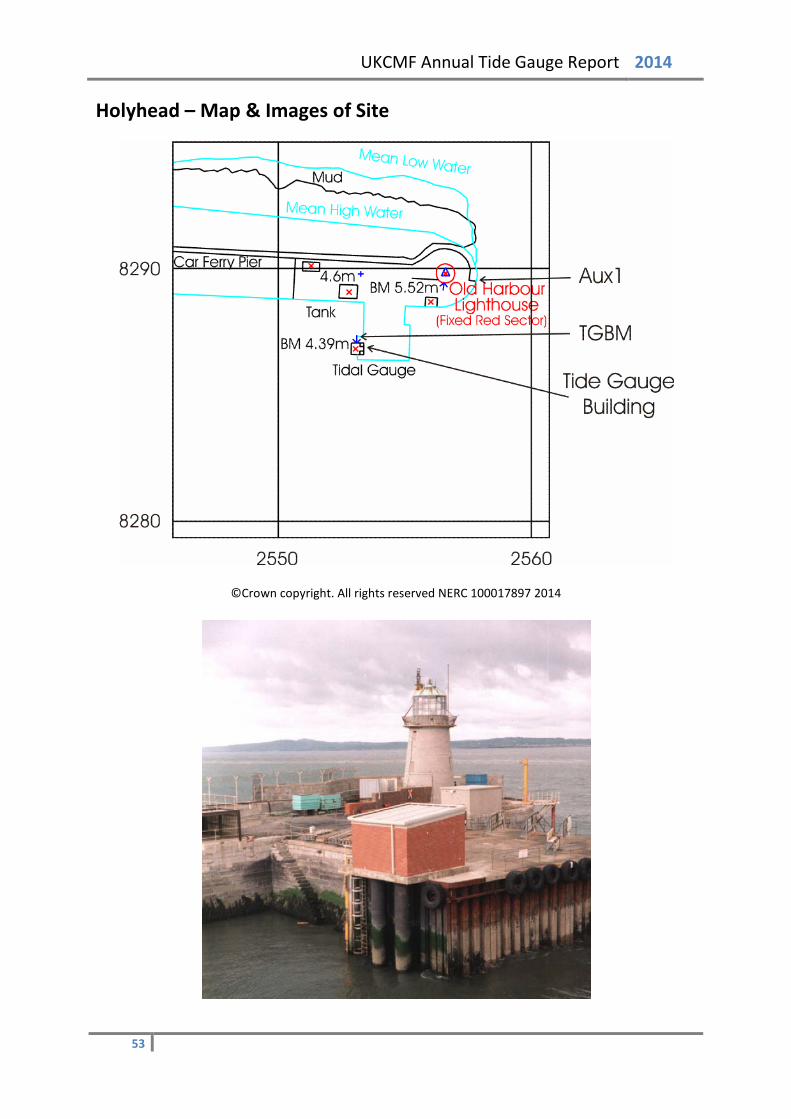
back-up Munro float gauge Location Tide Gauge Building Salt Island jetty, close to the old harbour lighthouse
Measuring Points As above Datum The delayed-mode data are to Admiralty Chart Datum (ACD).
The statistics in this report are to Ordnance Datum Newlyn (ODN). Benchmark Grid Ref Description TGBM SH 2553 8287 Bolt on concrete foundation, north side of tide gauge
building Aux1 SH 2556 8289 Cut mark lighthouse Aux3 SH 2506 8292 Bolt Salt Island bridge Benchmark Relationships TGZ = Admiralty Chart Datum (ACD) TGZ = 3.05m below Ordnance Datum Newlyn (ODN) TGZ = 7.436m below TGBM Levelling No levelling was carried out in 2014 Site visits 14/01/2014 (Day 014) Changing the Vega Radar integration period and testing. 07/03/2014 (Day 066) Changing the Vega Radar integration period and testing. 24/04/2014 (Day 114) Site visit with Paul Swinburne to view condition of building and view
the test site in general - bubbler, float and radar gauges. 06/07/2014 (Day 187) Installation of Bournemouth radar for testing. 18/08/2014 (Day 230) Visit to resolve problem with channel 2. Radar removed from
channel 1 and float gauge reinstated. 12/10/2014 (Day 285) Bubbler channel blocked - cleared OK. Float gauge serviced. Notes on Data Quality The site met the agreed target of being operational for at least 75% of each calendar month in 2014.
52
UKCMF Annual Tide Gauge Report 2014
Holyhead – Map & Images of Site
©Crown copyright. All rights reserved NERC 100017897 2014
53

UKCMF Annual Tide Gauge Report 2014
Holyhead – Statistics
Surge Maxima Surge Minima
Channel 1 Channel 2 Channel 1 Channel 2 Value Day Time Value Day Time Value Day Time Value Day Time
Jan 0.852 26 13:30:00 0.869 26 13:30:00 -0.335 26 01:15:00 -0.308 26 01:00:00 Feb 1.134 8 12:15:00 1.479 12 15:00:00 -0.085 2 06:45:00 -0.43 28 11:45:00 Mar 0.576 20 13:30:00 0.568 20 13:15:00 -0.351 25 22:15:00 -0.362 25 22:15:00 Apr 0.421 6 15:30:00 0.423 6 11:00:00 -0.235 14 06:00:00 -0.24 14 14:15:00 May 0.441 10 15:15:00 0.454 10 15:15:00 -0.275 15 16:45:00 -0.267 15 16:45:00 Jun 0.194 27 13:45:00 0.18 27 13:45:00 -0.251 17 16:45:00 -0.257 17 16:45:00 July 0.259 4 15:15:00 0.249 4 15:15:00 -0.245 9 11:45:00 -0.239 9 11:45:00 Aug 0.291 10 05:00:00 0.309 10 05:00:00 -0.108 15 13:45:00 -0.116 24 00:15:00 Sep 0.161 17 23:00:00 0.138 17 22:15:00 -0.176 1 10:45:00 -0.182 1 10:30:00 Oct 0.785 21 05:00:00 0.78 21 05:00:00 -0.369 21 20:45:00 -0.376 21 20:45:00 Nov 0.582 14 05:30:00 0.563 14 05:30:00 -0.147 23 11:15:00 -0.153 5 10:15:00 Dec 0.536 9 18:30:00 0.526 9 18:45:00 -0.466 28 04:45:00 -0.484 28 04:45:00
Extreme Maxima Extreme Minima
Channel 1 Channel 2 Channel 1 Channel 2 Value Day Time Value Day Time Value Day Time Value Day Time
Jan 3.66 3 11:00:00 3.689 3 11:00:00 -2.541 30 16:00:00 -2.537 30 16:00:00 Feb 3.543 3 12:45:00 3.555 3 12:30:00 -2.845 2 18:15:00 -2.946 28 15:30:00 Mar 3.04 31 10:30:00 3.376 2 10:45:00 -2.725 30 16:00:00 -3.002 3 17:45:00 Apr 2.97 1 11:15:00 2.964 1 11:15:00 -2.638 1 05:00:00 -2.63 1 05:00:00 May 2.68 18 00:15:00 2.674 18 00:15:00 -2.629 17 05:45:00 -2.627 17 05:45:00 Jun 2.72 14 23:15:00 2.704 14 23:15:00 -2.746 16 06:15:00 -2.75 16 06:15:00 July 3.125 14 23:45:00 3.122 14 23:45:00 -2.886 15 06:00:00 -2.875 15 06:00:00 Aug 3.295 12 23:30:00 3.305 12 23:30:00 -2.873 13 05:45:00 -2.765 12 05:00:00 Sep 3.225 10 23:15:00 3.224 10 23:15:00 -2.924 10 04:45:00 -2.925 10 04:30:00 Oct 3.485 8 22:00:00 2.975 6 20:30:00 -2.508 10 05:00:00 -2.06 24 04:00:00 Nov 3.341 6 21:45:00 3.344 6 21:45:00 -2.241 24 17:15:00 -2.251 24 17:15:00 Dec 2.956 23 10:45:00 2.961 23 10:45:00 -2.589 25 18:45:00 -2.615 25 18:30:00
Mean Sea Level
Channel 1 Channel 2 January 31 0.446 31 0.455 February 10 * 28 0.495 March 10 * 31 0.165 April 30 0.203 30 0.206 May 31 0.171 31 0.173 June 30 0.168 30 0.161 July 28 0.194 31 0.202 August 31 0.264 23 0.286 September 30 0.24 30 0.227 October 31 0.426 18 0.454 November 30 0.453 30 0.443 December 31 0.256 31 0.247 TOTAL & AVG 323 ** 344 0.293 * No mean sea level value as more than 15 days of data missing ** No yearly average value as more than one month’s MSL missing
54
UKCMF Annual Tide Gauge Report 2014
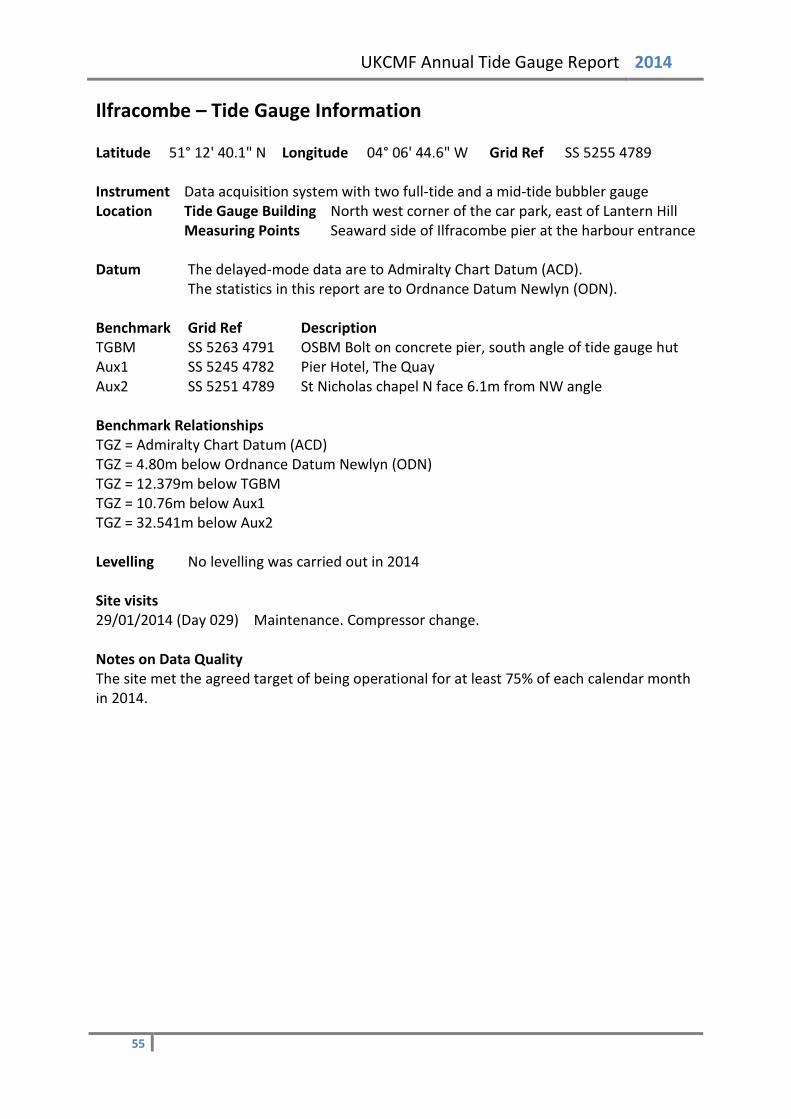
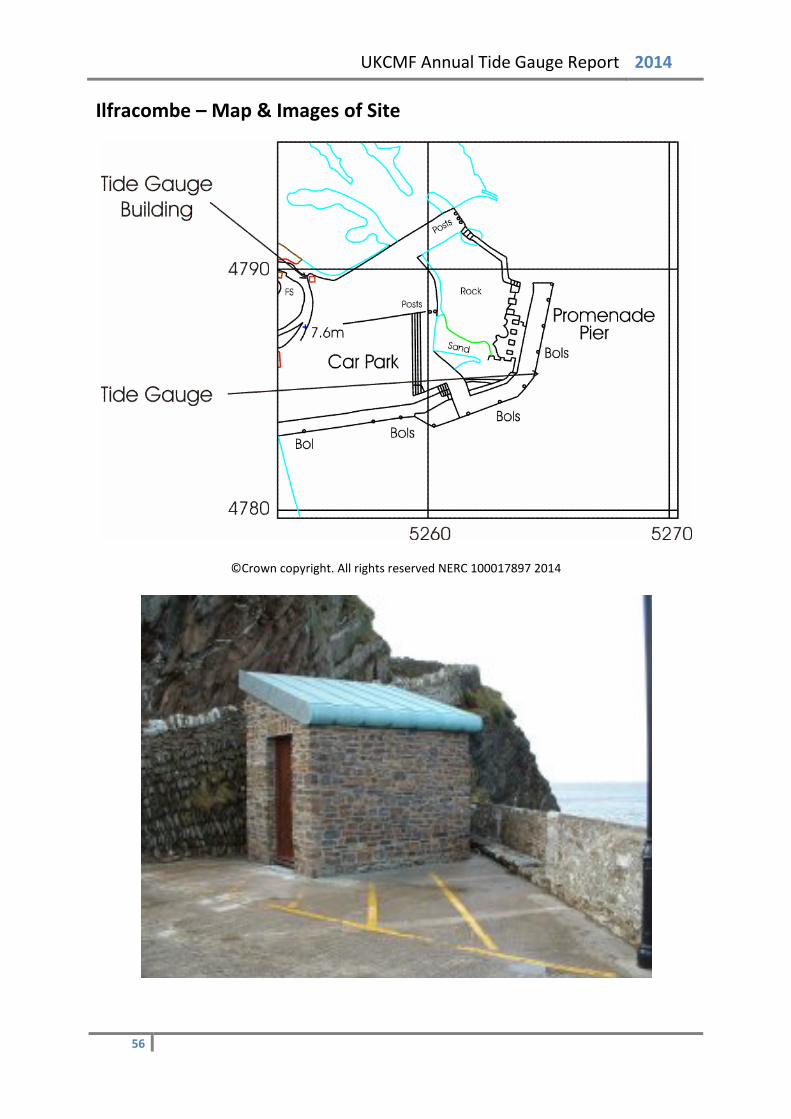
Ilfracombe – Tide Gauge Information Latitude 51° 12' 40.1" N Longitude 04° 06' 44.6" W Grid Ref SS 5255 4789 Instrument Data acquisition system with two full-tide and a mid-tide bubbler gauge Location Tide Gauge Building North west corner of the car park, east of Lantern Hill
Measuring Points Seaward side of Ilfracombe pier at the harbour entrance Datum The delayed-mode data are to Admiralty Chart Datum (ACD).
The statistics in this report are to Ordnance Datum Newlyn (ODN). Benchmark Grid Ref Description TGBM SS 5263 4791 OSBM Bolt on concrete pier, south angle of tide gauge hut Aux1 SS 5245 4782 Pier Hotel, The Quay Aux2 SS 5251 4789 St Nicholas chapel N face 6.1m from NW angle Benchmark Relationships TGZ = Admiralty Chart Datum (ACD) TGZ = 4.80m below Ordnance Datum Newlyn (ODN) TGZ = 12.379m below TGBM TGZ = 10.76m below Aux1 TGZ = 32.541m below Aux2 Levelling No levelling was carried out in 2014 Site visits 29/01/2014 (Day 029) Maintenance. Compressor change. Notes on Data Quality The site met the agreed target of being operational for at least 75% of each calendar month in 2014.
55
UKCMF Annual Tide Gauge Report 2014
Ilfracombe – Map & Images of Site
©Crown copyright. All rights reserved NERC 100017897 2014
56

UKCMF Annual Tide Gauge Report 2014
Ilfracombe – Statistics
Surge Maxima Surge Minima
Channel 1 Channel 2 Channel 1 Channel 2 Value Day Time Value Day Time Value Day Time Value Day Time
Jan 0.825 1 10:30:00 0.832 1 10:30:00 -0.444 25 21:15:00 -0.433 25 21:00:00 Feb 1.452 12 14:15:00 1.462 12 14:15:00 -0.339 28 07:00:00 -0.328 28 07:00:00 Mar 0.631 2 15:30:00 0.641 2 15:30:00 -0.281 3 17:15:00 -0.229 16 11:00:00 Apr 0.514 26 11:00:00 0.526 26 11:00:00 -0.209 14 10:30:00 -0.196 14 10:30:00 May 0.469 10 13:00:00 0.482 10 13:00:00 -0.241 16 12:00:00 -0.229 16 12:00:00 Jun 0.268 27 19:15:00 0.28 27 19:15:00 -0.177 17 13:00:00 -0.165 17 13:00:00 July 0.305 5 00:30:00 0.318 5 00:30:00 -0.133 9 05:15:00 -0.12 9 05:15:00 Aug 0.346 10 01:00:00 0.363 10 01:00:00 -0.069 24 05:45:00 -0.058 23 18:30:00 Sep 0.24 17 21:15:00 0.252 17 21:15:00 -0.164 2 05:45:00 -0.151 2 05:45:00 Oct 0.535 17 19:15:00 0.546 17 19:15:00 -0.278 21 15:45:00 -0.282 21 15:45:00 Nov 0.726 13 14:15:00 0.738 14 03:00:00 -0.097 20 07:45:00 -0.087 23 16:45:00 Dec 0.718 12 02:15:00 0.73 12 02:15:00 -0.328 6 01:00:00 -0.32 6 02:00:00
Extreme Maxima Extreme Minima
Channel 1 Channel 2 Channel 1 Channel 2 Value Day Time Value Day Time Value Day Time Value Day Time
Jan 5.698 3 07:00:00 5.698 3 07:00:00 -4.271 4 01:30:00 -4.026 30 23:45:00 Feb 5.599 3 08:15:00 5.602 3 08:15:00 -4.66 2 13:45:00 -4.287 28 23:30:00 Mar 5.615 2 06:30:00 5.621 2 06:30:00 -4.6 3 13:15:00 -4.553 1 11:45:00 Apr 5.068 1 06:45:00 5.073 1 06:45:00 -4.346 1 12:45:00 -4.33 1 12:45:00 May 4.506 1 07:00:00 4.513 1 07:00:00 -4.183 16 00:15:00 -4.171 16 00:15:00 Jun 4.652 15 19:45:00 4.657 15 19:45:00 -4.217 15 00:45:00 -4.207 15 01:00:00 July 5.126 14 19:30:00 5.131 14 19:30:00 -4.399 15 01:30:00 -4.385 15 01:30:00 Aug 5.434 12 19:15:00 5.437 12 19:15:00 -4.579 13 01:15:00 -4.577 13 01:15:00 Sep 5.422 10 19:00:00 5.426 10 19:00:00 -4.622 11 01:00:00 -4.614 11 01:00:00 Oct 5.441 8 17:45:00 5.446 8 17:45:00 -4.219 10 00:30:00 -4.206 10 00:30:00 Nov 5.116 6 17:30:00 5.12 6 17:30:00 -3.836 8 00:15:00 -3.834 8 00:15:00 Dec 4.724 23 06:30:00 4.725 23 06:30:00 -4.057 25 14:15:00 -4.044 25 14:15:00
Mean Sea Level
Channel 1 Channel 2 January 31 0.408 25 0.38 February 28 0.435 23 0.48 March 31 0.137 27 0.14 April 30 0.202 30 0.214 May 31 0.177 31 0.188 June 30 0.165 30 0.176 July 31 0.192 31 0.204 August 31 0.249 31 0.26 September 30 0.232 30 0.244 October 31 0.365 31 0.377 November 30 0.428 28 0.436 December 31 0.199 29 0.202 TOTAL & AVG 365 0.266 346 0.275 * No mean sea level value as more than 15 days of data missing ** No yearly average value as more than one month’s MSL missing
57
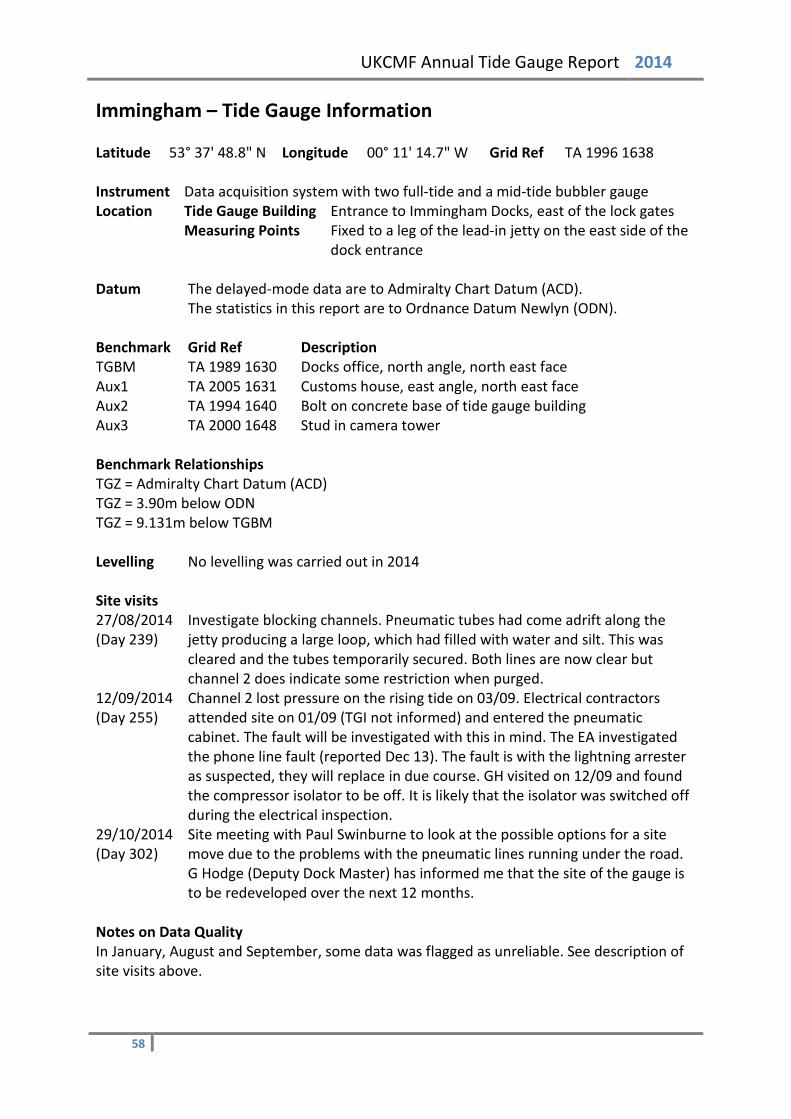
UKCMF Annual Tide Gauge Report 2014
Immingham – Tide Gauge Information Latitude 53° 37' 48.8" N Longitude 00° 11' 14.7" W Grid Ref TA 1996 1638 Instrument Data acquisition system with two full-tide and a mid-tide bubbler gauge Location Tide Gauge Building Entrance to Immingham Docks, east of the lock gates
Measuring Points Fixed to a leg of the lead-in jetty on the east side of the dock entrance
Datum The delayed-mode data are to Admiralty Chart Datum (ACD).
The statistics in this report are to Ordnance Datum Newlyn (ODN). Benchmark Grid Ref Description TGBM TA 1989 1630 Docks office, north angle, north east face Aux1 TA 2005 1631 Customs house, east angle, north east face Aux2 TA 1994 1640 Bolt on concrete base of tide gauge building Aux3 TA 2000 1648 Stud in camera tower Benchmark Relationships TGZ = Admiralty Chart Datum (ACD) TGZ = 3.90m below ODN TGZ = 9.131m below TGBM Levelling No levelling was carried out in 2014 Site visits 27/08/2014 (Day 239)
Investigate blocking channels. Pneumatic tubes had come adrift along the jetty producing a large loop, which had filled with water and silt. This was cleared and the tubes temporarily secured. Both lines are now clear but channel 2 does indicate some restriction when purged.
12/09/2014 (Day 255)
Channel 2 lost pressure on the rising tide on 03/09. Electrical contractors attended site on 01/09 (TGI not informed) and entered the pneumatic cabinet. The fault will be investigated with this in mind. The EA investigated the phone line fault (reported Dec 13). The fault is with the lightning arrester as suspected, they will replace in due course. GH visited on 12/09 and found the compressor isolator to be off. It is likely that the isolator was switched off during the electrical inspection.
29/10/2014 (Day 302)
Site meeting with Paul Swinburne to look at the possible options for a site move due to the problems with the pneumatic lines running under the road. G Hodge (Deputy Dock Master) has informed me that the site of the gauge is to be redeveloped over the next 12 months.
Notes on Data Quality In January, August and September, some data was flagged as unreliable. See description of site visits above.
58
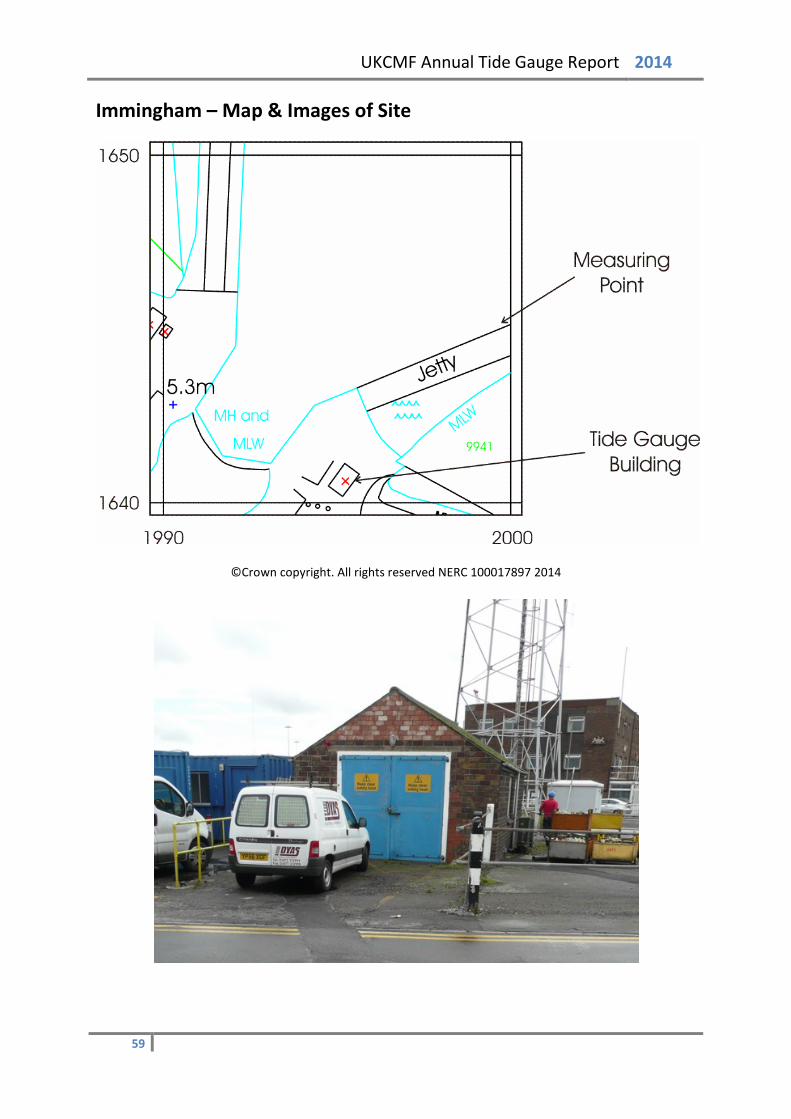
UKCMF Annual Tide Gauge Report 2014
Immingham – Map & Images of Site
©Crown copyright. All rights reserved NERC 100017897 2014
59
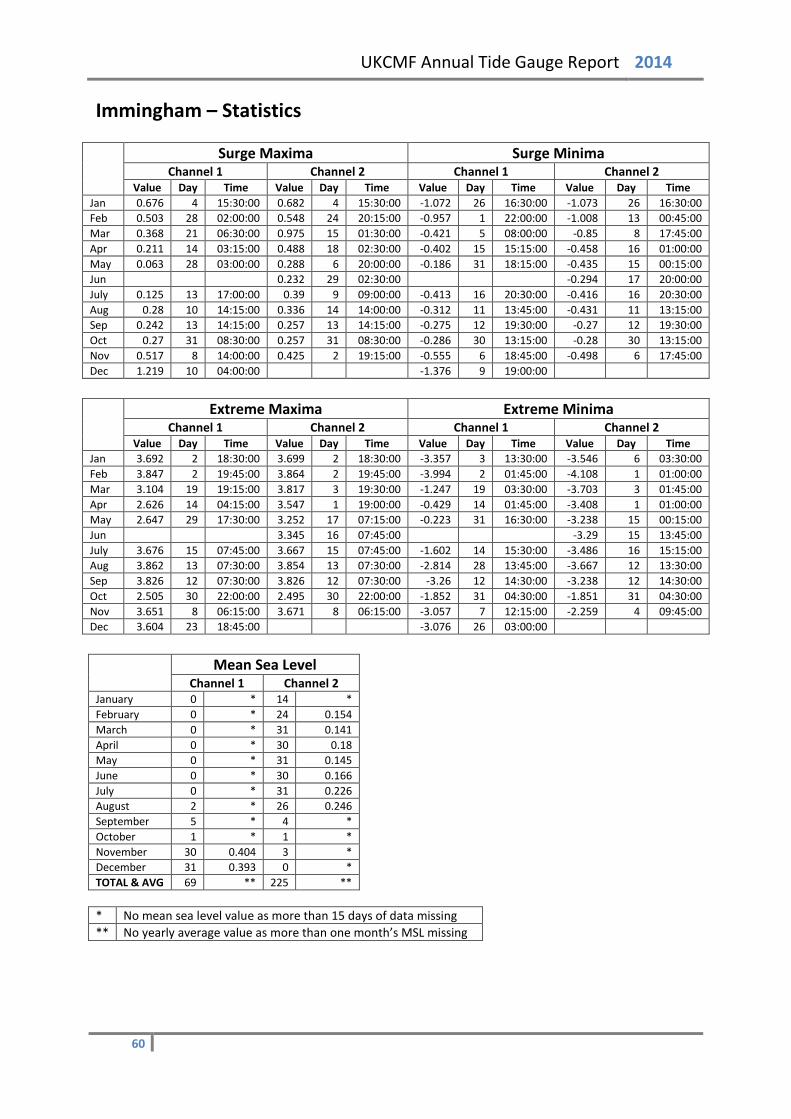
UKCMF Annual Tide Gauge Report 2014
Immingham – Statistics
Surge Maxima Surge Minima
Channel 1 Channel 2 Channel 1 Channel 2 Value Day Time Value Day Time Value Day Time Value Day Time
Jan 0.676 4 15:30:00 0.682 4 15:30:00 -1.072 26 16:30:00 -1.073 26 16:30:00 Feb 0.503 28 02:00:00 0.548 24 20:15:00 -0.957 1 22:00:00 -1.008 13 00:45:00 Mar 0.368 21 06:30:00 0.975 15 01:30:00 -0.421 5 08:00:00 -0.85 8 17:45:00 Apr 0.211 14 03:15:00 0.488 18 02:30:00 -0.402 15 15:15:00 -0.458 16 01:00:00 May 0.063 28 03:00:00 0.288 6 20:00:00 -0.186 31 18:15:00 -0.435 15 00:15:00 Jun 0.232 29 02:30:00 -0.294 17 20:00:00 July 0.125 13 17:00:00 0.39 9 09:00:00 -0.413 16 20:30:00 -0.416 16 20:30:00 Aug 0.28 10 14:15:00 0.336 14 14:00:00 -0.312 11 13:45:00 -0.431 11 13:15:00 Sep 0.242 13 14:15:00 0.257 13 14:15:00 -0.275 12 19:30:00 -0.27 12 19:30:00 Oct 0.27 31 08:30:00 0.257 31 08:30:00 -0.286 30 13:15:00 -0.28 30 13:15:00 Nov 0.517 8 14:00:00 0.425 2 19:15:00 -0.555 6 18:45:00 -0.498 6 17:45:00 Dec 1.219 10 04:00:00 -1.376 9 19:00:00
Extreme Maxima Extreme Minima
Channel 1 Channel 2 Channel 1 Channel 2 Value Day Time Value Day Time Value Day Time Value Day Time
Jan 3.692 2 18:30:00 3.699 2 18:30:00 -3.357 3 13:30:00 -3.546 6 03:30:00 Feb 3.847 2 19:45:00 3.864 2 19:45:00 -3.994 2 01:45:00 -4.108 1 01:00:00 Mar 3.104 19 19:15:00 3.817 3 19:30:00 -1.247 19 03:30:00 -3.703 3 01:45:00 Apr 2.626 14 04:15:00 3.547 1 19:00:00 -0.429 14 01:45:00 -3.408 1 01:00:00 May 2.647 29 17:30:00 3.252 17 07:15:00 -0.223 31 16:30:00 -3.238 15 00:15:00 Jun 3.345 16 07:45:00 -3.29 15 13:45:00 July 3.676 15 07:45:00 3.667 15 07:45:00 -1.602 14 15:30:00 -3.486 16 15:15:00 Aug 3.862 13 07:30:00 3.854 13 07:30:00 -2.814 28 13:45:00 -3.667 12 13:30:00 Sep 3.826 12 07:30:00 3.826 12 07:30:00 -3.26 12 14:30:00 -3.238 12 14:30:00 Oct 2.505 30 22:00:00 2.495 30 22:00:00 -1.852 31 04:30:00 -1.851 31 04:30:00 Nov 3.651 8 06:15:00 3.671 8 06:15:00 -3.057 7 12:15:00 -2.259 4 09:45:00 Dec 3.604 23 18:45:00 -3.076 26 03:00:00
Mean Sea Level
Channel 1 Channel 2 January 0 * 14 * February 0 * 24 0.154 March 0 * 31 0.141 April 0 * 30 0.18 May 0 * 31 0.145 June 0 * 30 0.166 July 0 * 31 0.226 August 2 * 26 0.246 September 5 * 4 * October 1 * 1 * November 30 0.404 3 * December 31 0.393 0 * TOTAL & AVG 69 ** 225 ** * No mean sea level value as more than 15 days of data missing ** No yearly average value as more than one month’s MSL missing
60
UKCMF Annual Tide Gauge Report 2014
Port Erin (Isle of Man) – Tide Gauge Information Latitude 54° 05' 07.4" N Longitude 04° 46' 05.0" W Grid Ref SC 1904 6904 Instrument Data acquisition system with two full-tide and a mid-tide bubbler gauge Location Tide Gauge Building Port Erin lifeboat station
Measuring Points Close to the end of the lifeboat slipway (the mid-tide pressure point is attached to a concrete leg of the boathouse)
Datum The delayed-mode data are to Admiralty Chart Datum (ACD).
The statistics in this report are to Ordnance Datum Local (ODL). Benchmark Grid Ref Description TGBM SC 1904 6901 Bolt SE corner of the RNLI boathouse Aux 2 Bolt on seawall NW of Marine labs Aux 3 SC 1928 6903 Bolt base of light tower Raglan pier Benchmark Relationships TGZ = Admiralty Chart Datum (ACD) TGZ = 2.75m below Ordnance Datum Local (ODL) TGZ = 9.288m below TGBM Levelling No levelling was carried out in 2014 Site visits No site visits were carried out in 2014 Notes on Data Quality The site met the agreed target of being operational for at least 75% of each calendar month in 2014.
61
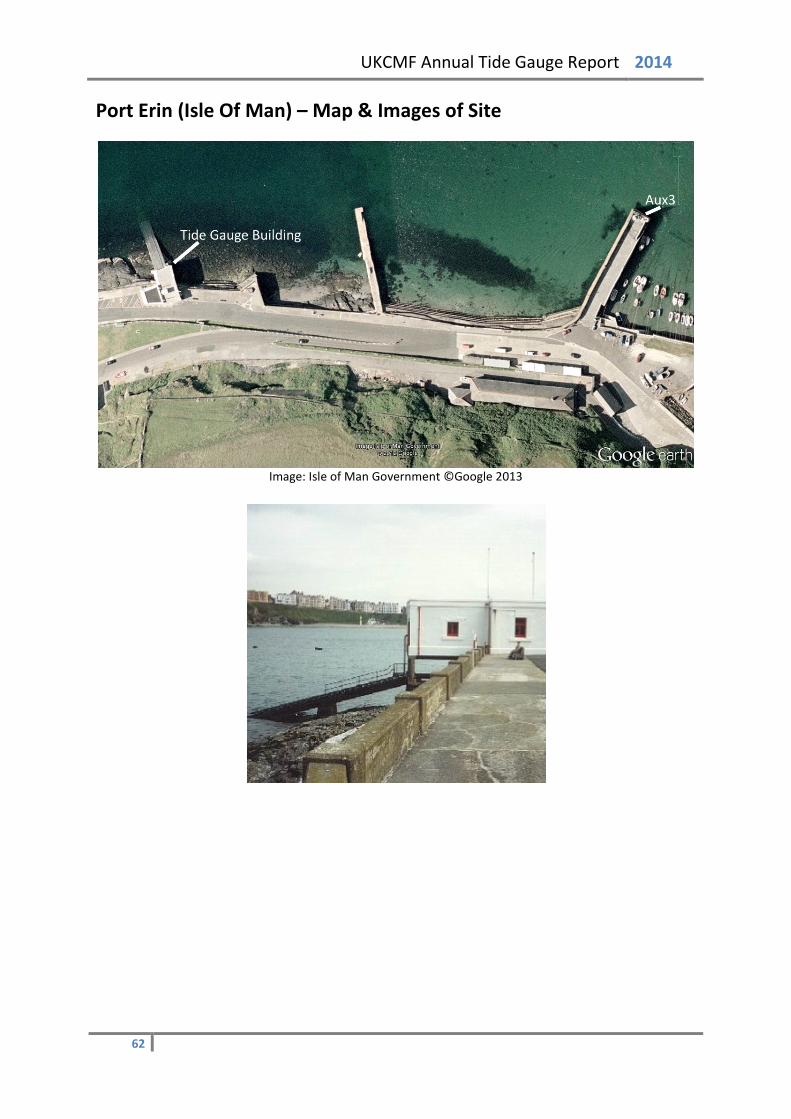
UKCMF Annual Tide Gauge Report 2014
Port Erin (Isle Of Man) – Map & Images of Site
Image: Isle of Man Government ©Google 2013
62

UKCMF Annual Tide Gauge Report 2014
Port Erin (Isle Of Man) – Statistics
Surge Maxima Surge Minima
Channel 1 Channel 2 Channel 1 Channel 2 Value Day Time Value Day Time Value Day Time Value Day Time
Jan 0.906 3 16:00:00 0.921 3 16:00:00 -0.272 26 02:30:00 -0.206 24 00:30:00 Feb 1.28 12 16:15:00 1.294 12 16:15:00 -0.38 28 13:00:00 -0.373 28 13:00:00 Mar 0.567 20 11:30:00 0.579 20 11:30:00 -0.379 25 22:15:00 -0.362 25 22:00:00 Apr 0.517 6 14:00:00 0.536 6 14:00:00 -0.189 14 15:45:00 -0.181 14 15:45:00 May 0.453 10 16:00:00 0.458 10 16:00:00 -0.228 15 19:30:00 -0.224 15 19:30:00 Jun 0.185 10 19:00:00 0.187 10 19:00:00 -0.24 17 17:00:00 -0.236 17 17:00:00 July 0.299 4 09:45:00 0.304 4 09:45:00 -0.222 9 10:00:00 -0.217 9 10:00:00 Aug 0.338 29 08:15:00 0.34 29 08:15:00 -0.108 15 14:30:00 -0.106 15 14:30:00 Sep 0.132 17 23:15:00 0.136 17 23:15:00 -0.178 1 12:45:00 -0.175 1 12:45:00 Oct 0.785 21 06:30:00 0.787 21 06:30:00 -0.371 21 21:00:00 -0.369 21 21:00:00 Nov 0.597 6 17:15:00 0.6 6 17:15:00 -0.136 5 11:00:00 -0.132 5 11:00:00 Dec 0.573 9 17:45:00 0.576 9 17:45:00 -0.492 28 03:45:00 -0.485 28 03:45:00
Extreme Maxima Extreme Minima
Channel 1 Channel 2 Channel 1 Channel 2 Value Day Time Value Day Time Value Day Time Value Day Time
Jan 3.856 3 12:30:00 3.869 3 12:30:00 -2.526 30 16:45:00 -2.506 30 16:45:00 Feb 3.602 1 12:15:00 3.615 1 12:15:00 -2.874 28 16:30:00 -2.866 28 16:30:00 Mar 3.33 2 11:45:00 3.333 2 11:45:00 -2.87 3 18:45:00 -2.859 3 18:45:00 Apr 2.86 1 12:00:00 2.879 1 12:00:00 -2.583 1 18:15:00 -2.567 1 18:15:00 May 2.638 18 01:15:00 2.643 18 01:15:00 -2.612 17 06:45:00 -2.607 17 06:45:00 Jun 2.604 16 01:00:00 2.608 16 01:00:00 -2.755 16 07:15:00 -2.752 16 07:15:00 July 3.003 15 00:45:00 3.008 15 00:45:00 -2.824 15 07:00:00 -2.82 15 07:00:00 Aug 3.186 13 00:30:00 3.189 13 00:30:00 -2.779 13 06:45:00 -2.775 13 06:45:00 Sep 3.082 11 00:00:00 3.087 11 00:00:00 -2.858 10 05:45:00 -2.854 10 05:45:00 Oct 3.387 8 23:00:00 3.389 8 23:00:00 -2.455 10 06:00:00 -2.452 10 06:00:00 Nov 3.319 6 22:45:00 3.319 6 22:45:00 -2.296 5 03:30:00 -2.295 5 03:30:00 Dec 2.953 23 12:00:00 2.959 23 12:00:00 -2.605 25 19:45:00 -2.599 25 19:45:00
Mean Sea Level
Channel 1 Channel 2 January 31 0.41 24 0.48 February 28 0.454 28 0.469 March 31 0.122 31 0.134 April 30 0.143 30 0.153 May 31 0.104 31 0.108 June 30 0.086 30 0.089 July 31 0.134 31 0.139 August 31 0.194 31 0.198 September 30 0.152 30 0.156 October 31 0.359 31 0.362 November 28 0.392 28 0.394 December 31 0.2 31 0.205 TOTAL & AVG 363 0.229 356 0.241 * No mean sea level value as more than 15 days of data missing ** No yearly average value as more than one month’s MSL missing
63
UKCMF Annual Tide Gauge Report 2014
Port Ellen (Isle of Islay) – Tide Gauge Information Latitude 55° 37' 39.3" N Longitude 06° 11' 23.7" W Grid Ref NR 3636 4508 Instrument Data acquisition system with two full-tide bubbler gauges. Decommissioned
February 2011. Location Tide Gauge Building Caledonian MacBrayne storeroom next to Port Ellen
ferry terminal Measuring Points South west of the ferry terminal offices
Datum The delayed-mode data are to Admiralty Chart Datum (ACD).
The statistics in this report are to Ordnance Datum Newlyn (ODN). Benchmark Grid Ref Description TGBM NR 3635 4507 Bolt SE side Booking Office Aux1 NR 3642 4515 Rivet angle wall NW side entrance to pier Aux2 NR 3651 4526 Police Station SE side of road SW face W angle Aux3 NR 3635 4521 Sea Farm C gable NW face W angle Benchmark Relationships TGZ = Admiralty Chart Datum (ACD) TGZ = 0.19m below Ordnance Datum Newlyn (ODN) TGZ = 2.839m below TGBM Levelling No levelling was carried out in 2014 Site visits 03/03/2014 (Day 062) Site survey and sealing of the service ducts. 12/11/2014 (Day 316) Survey of site. Old TG steelwork brought back to NOC. Notes on Data Quality No data as gauge was removed from network due to harbour redevelopment on 08/02/2011. Work on a replacement installation has commenced and is ongoing.
64
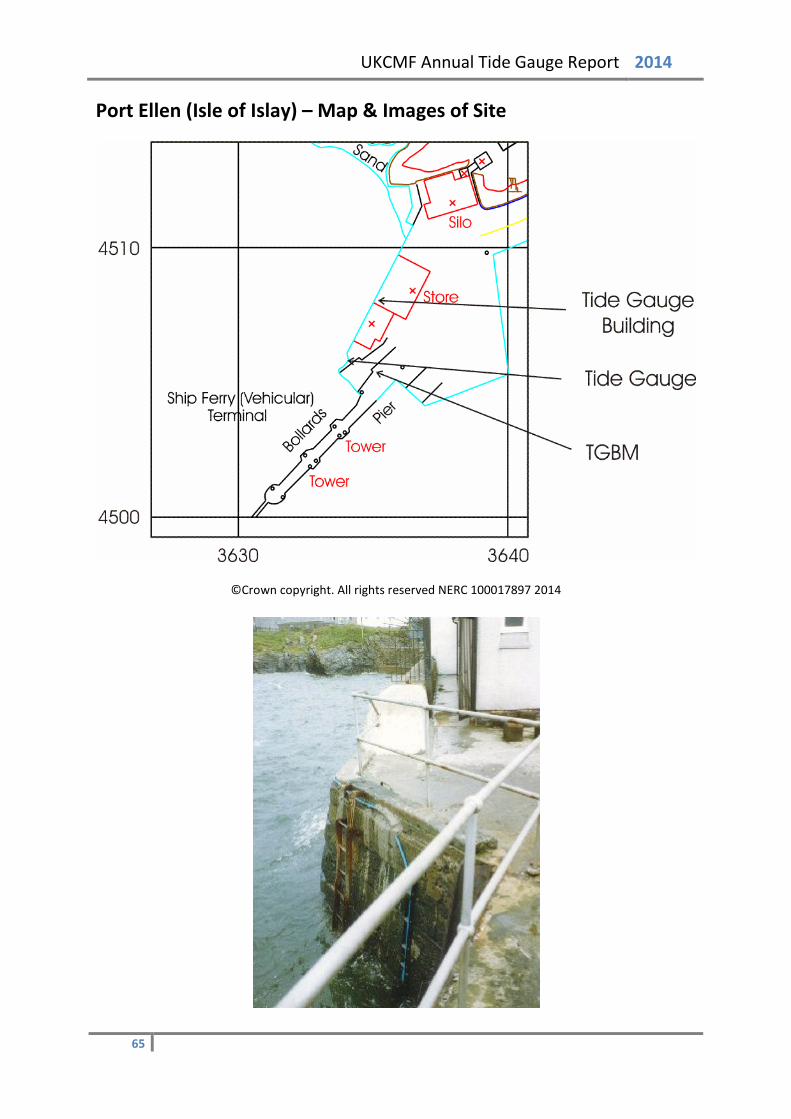
UKCMF Annual Tide Gauge Report 2014
Port Ellen (Isle of Islay) – Map & Images of Site
©Crown copyright. All rights reserved NERC 100017897 2014
65
UKCMF Annual Tide Gauge Report 2014
Port Ellen (Isle of Islay) – Statistics The gauge wasn't operational during 2014, so no statistics were produced.
66
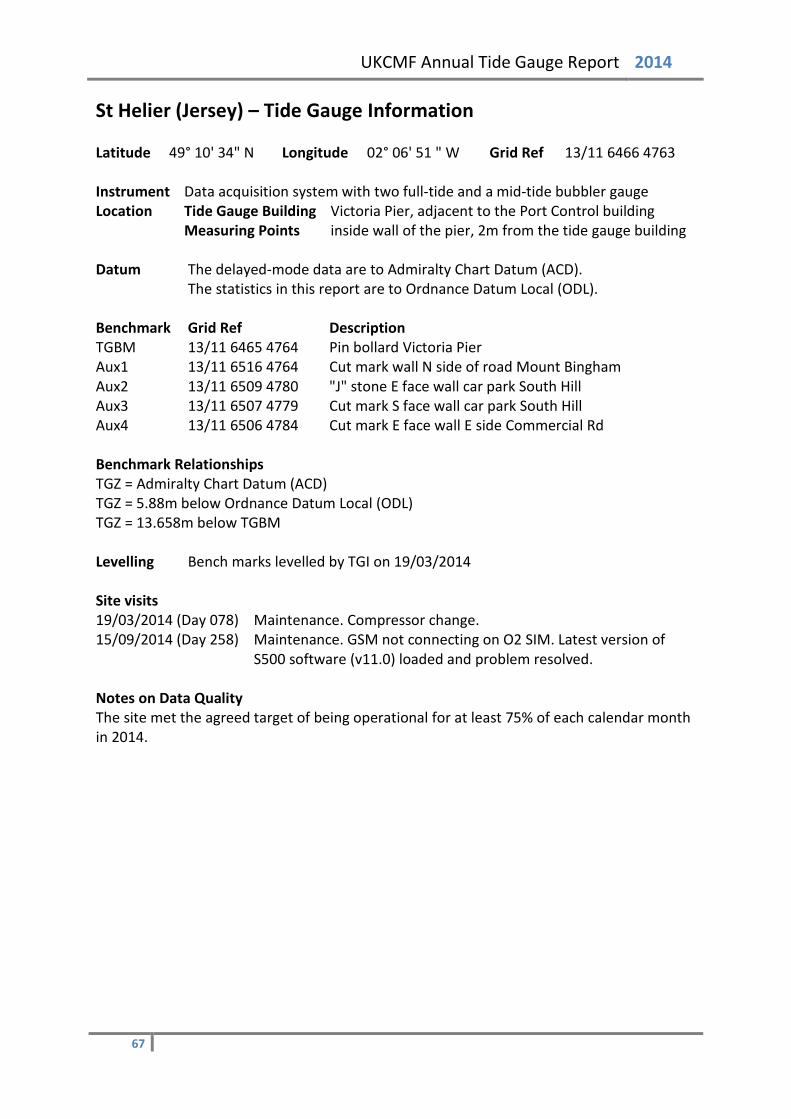
UKCMF Annual Tide Gauge Report 2014
St Helier (Jersey) – Tide Gauge Information Latitude 49° 10' 34" N Longitude 02° 06' 51 " W Grid Ref 13/11 6466 4763 Instrument Data acquisition system with two full-tide and a mid-tide bubbler gauge Location Tide Gauge Building Victoria Pier, adjacent to the Port Control building
Measuring Points inside wall of the pier, 2m from the tide gauge building Datum The delayed-mode data are to Admiralty Chart Datum (ACD).
The statistics in this report are to Ordnance Datum Local (ODL). Benchmark Grid Ref Description TGBM 13/11 6465 4764 Pin bollard Victoria Pier Aux1 13/11 6516 4764 Cut mark wall N side of road Mount Bingham Aux2 13/11 6509 4780 "J" stone E face wall car park South Hill Aux3 13/11 6507 4779 Cut mark S face wall car park South Hill Aux4 13/11 6506 4784 Cut mark E face wall E side Commercial Rd Benchmark Relationships TGZ = Admiralty Chart Datum (ACD) TGZ = 5.88m below Ordnance Datum Local (ODL) TGZ = 13.658m below TGBM Levelling Bench marks levelled by TGI on 19/03/2014 Site visits 19/03/2014 (Day 078) Maintenance. Compressor change. 15/09/2014 (Day 258) Maintenance. GSM not connecting on O2 SIM. Latest version of
S500 software (v11.0) loaded and problem resolved. Notes on Data Quality The site met the agreed target of being operational for at least 75% of each calendar month in 2014.
67
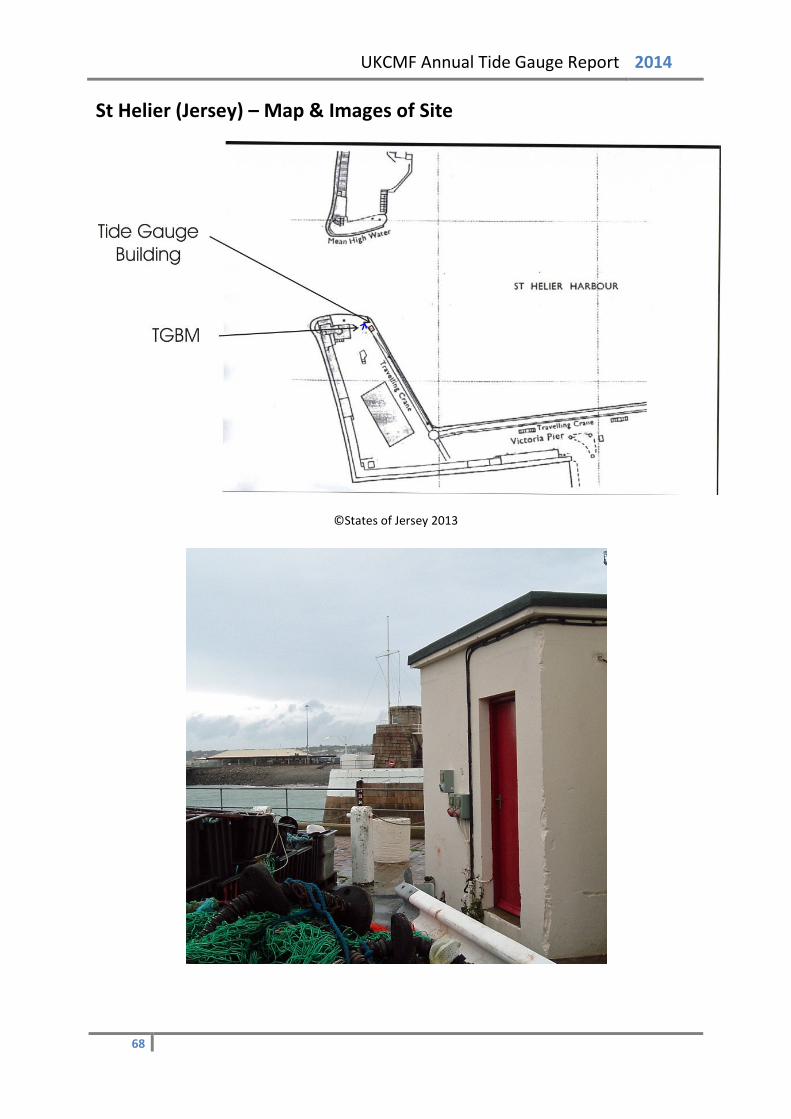
UKCMF Annual Tide Gauge Report 2014
St Helier (Jersey) – Map & Images of Site
©States of Jersey 2013
68

UKCMF Annual Tide Gauge Report 2014
St Helier (Jersey) – Statistics
Surge Maxima Surge Minima
Channel 1 Channel 2 Channel 1 Channel 2 Value Day Time Value Day Time Value Day Time Value Day Time
Jan 0.752 3 13:00:00 0.753 3 13:00:00 -0.232 24 18:15:00 -0.235 24 18:15:00 Feb 1.205 14 22:30:00 1.194 14 22:30:00 -0.274 2 18:15:00 -0.287 2 18:15:00 Mar 0.542 2 20:30:00 0.534 2 20:30:00 -0.337 11 08:30:00 -0.341 11 08:30:00 Apr 0.477 26 09:15:00 0.47 26 09:15:00 -0.286 16 02:15:00 -0.292 16 02:15:00 May 0.387 10 13:00:00 0.379 10 13:00:00 -0.363 17 05:15:00 -0.37 17 05:15:00 Jun 0.305 28 10:00:00 0.303 28 10:00:00 -0.357 17 06:30:00 -0.361 17 06:30:00 July 0.32 18 02:30:00 0.316 18 02:30:00 -0.326 17 07:15:00 -0.327 17 07:15:00 Aug 0.585 10 10:30:00 0.578 10 10:30:00 -0.266 16 07:30:00 -0.264 15 07:15:00 Sep 0.266 19 01:00:00 0.261 19 01:00:00 -0.389 12 06:30:00 -0.389 12 06:15:00 Oct 0.525 21 09:15:00 0.523 21 09:15:00 -0.275 22 14:45:00 -0.276 22 14:45:00 Nov 0.656 14 05:15:00 0.658 14 05:15:00 -0.261 24 17:00:00 -0.257 24 17:00:00 Dec 0.456 12 02:30:00 0.45 12 02:30:00 -0.501 28 20:30:00 -0.514 28 20:30:00
Extreme Maxima Extreme Minima
Channel 1 Channel 2 Channel 1 Channel 2 Value Day Time Value Day Time Value Day Time Value Day Time
Jan 6.07 3 08:00:00 6.066 3 08:00:00 -5.048 31 13:15:00 -5.053 31 13:15:00 Feb 6.104 3 09:00:00 6.099 3 09:00:00 -5.484 2 15:00:00 -5.489 2 15:00:00 Mar 6.467 3 07:45:00 6.456 3 07:45:00 -5.316 2 14:00:00 -5.323 2 14:00:00 Apr 5.87 1 07:15:00 5.862 1 07:15:00 -5.151 1 01:45:00 -5.158 1 01:45:00 May 5.162 16 19:30:00 5.156 16 19:30:00 -4.953 17 02:30:00 -4.958 17 02:30:00 Jun 5.375 15 20:15:00 5.371 15 20:15:00 -5.007 16 03:00:00 -5.01 16 03:00:00 July 5.833 14 20:00:00 5.83 14 20:00:00 -5.248 15 02:45:00 -5.251 15 02:45:00 Aug 6.238 12 19:45:00 6.233 12 19:45:00 -5.413 13 02:45:00 -5.413 13 02:45:00 Sep 6.212 10 19:30:00 6.21 10 19:30:00 -5.587 11 02:15:00 -5.588 11 02:15:00 Oct 6.143 9 19:00:00 6.132 9 19:00:00 -5.104 10 01:45:00 -5.107 10 01:45:00 Nov 5.902 7 06:15:00 5.897 7 06:15:00 -4.566 8 01:15:00 -4.562 8 01:15:00 Dec 5.517 24 07:45:00 5.499 24 07:45:00 -4.836 24 14:30:00 -4.848 24 14:30:00
Mean Sea Level
Channel 1 Channel 2 January 31 0.377 31 0.372 February 28 0.396 28 0.388 March 31 0.116 31 0.109 April 30 0.175 30 0.168 May 31 0.164 31 0.158 June 30 0.145 30 0.141 July 31 0.173 31 0.17 August 31 0.222 31 0.22 September 30 0.195 30 0.192 October 31 0.304 31 0.303 November 30 0.405 30 0.407 December 31 0.169 31 0.164 TOTAL & AVG 365 0.237 365 0.233 * No mean sea level value as more than 15 days of data missing ** No yearly average value as more than one month’s MSL missing
69
UKCMF Annual Tide Gauge Report 2014
Kinlochbervie – Tide Gauge Information Latitude 58° 27' 23.8" N Longitude 05° 03' 01.3" W Grid Ref NC 2213 5608 Instrument Data acquisition system with two full-tide and a mid-tide bubbler gauge Location Tide Gauge Building In the ice plant, on the pier
Measuring Points On a leg of the jetty beneath the ice plant Datum The delayed-mode data are to Admiralty Chart Datum (ACD).
The statistics in this report are to Ordnance Datum Newlyn (ODN). Benchmark Grid Ref Description TGBM NC 2206 5613 Bolt S side harbour 19.5M SE angle of building Aux1 NC 2210 5612 Rivet iceplant 7.45M from S angle of building Aux2 NC 2210 5614 Rivet inside iceplant 3.5M E door Aux3 NC 2203 5626 Rivet 12.3M SE N angle of building Aux4 NC 2213 5621 Rivet 2.5M NW inside corner NE steps Benchmark Relationships TGZ = Admiralty Chart Datum (ACD) TGZ = 2.50m below Ordnance Datum Newlyn (ODN) TGZ = 7.213m below TGBM Levelling No levelling was carried out in 2014 Site visits 08/10/2014 (Day 281) Maintenance. Compressor change. Notes on Data Quality The site met the agreed target of being operational for at least 75% of each calendar month in 2014.
70
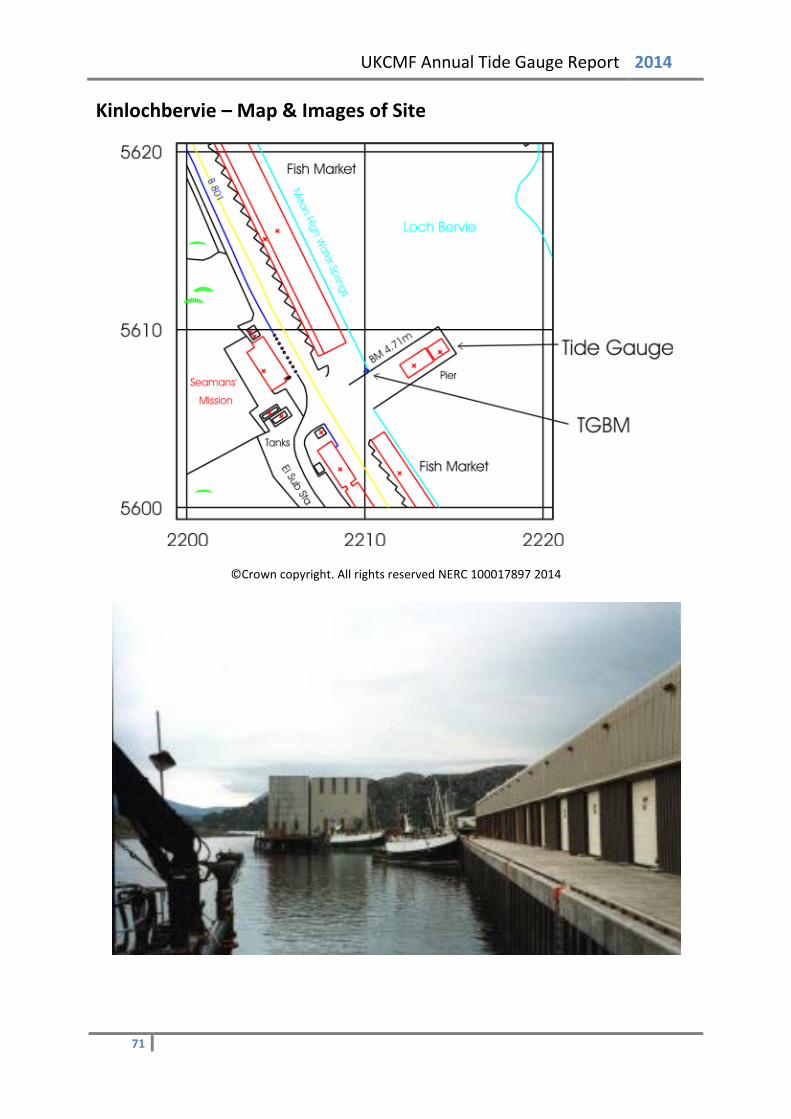
UKCMF Annual Tide Gauge Report 2014
Kinlochbervie – Map & Images of Site
©Crown copyright. All rights reserved NERC 100017897 2014
71
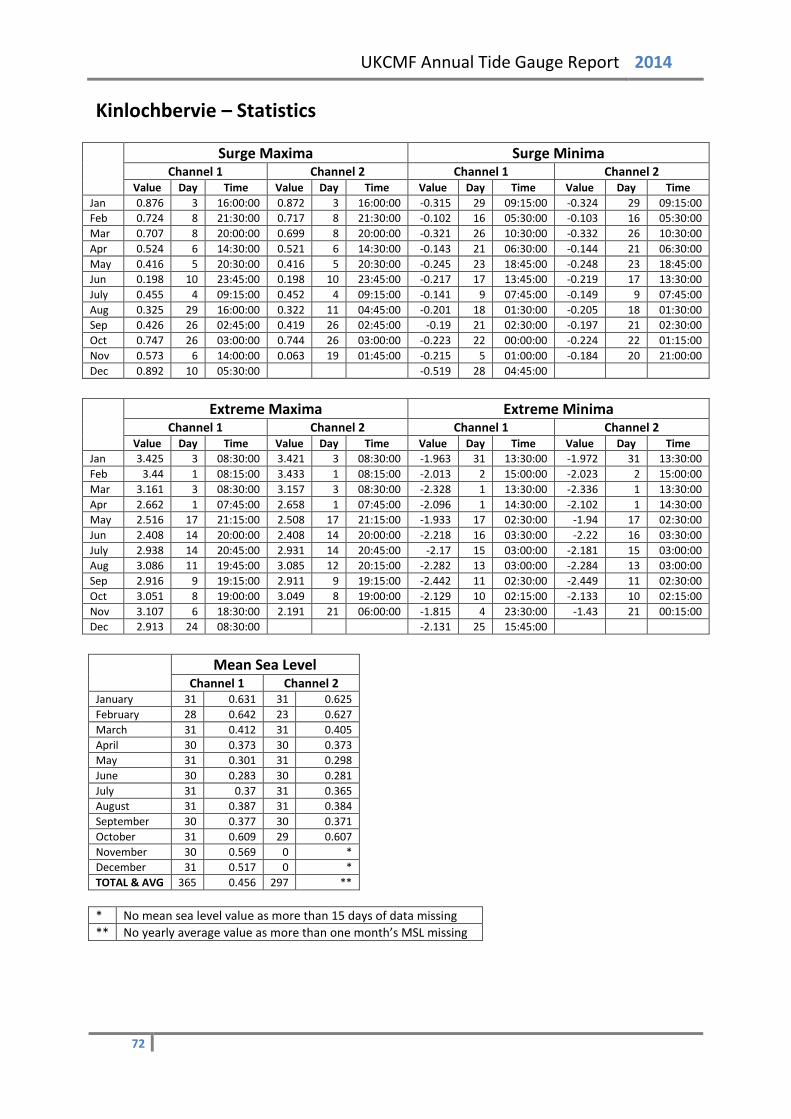
UKCMF Annual Tide Gauge Report 2014
Kinlochbervie – Statistics
Surge Maxima Surge Minima
Channel 1 Channel 2 Channel 1 Channel 2 Value Day Time Value Day Time Value Day Time Value Day Time
Jan 0.876 3 16:00:00 0.872 3 16:00:00 -0.315 29 09:15:00 -0.324 29 09:15:00 Feb 0.724 8 21:30:00 0.717 8 21:30:00 -0.102 16 05:30:00 -0.103 16 05:30:00 Mar 0.707 8 20:00:00 0.699 8 20:00:00 -0.321 26 10:30:00 -0.332 26 10:30:00 Apr 0.524 6 14:30:00 0.521 6 14:30:00 -0.143 21 06:30:00 -0.144 21 06:30:00 May 0.416 5 20:30:00 0.416 5 20:30:00 -0.245 23 18:45:00 -0.248 23 18:45:00 Jun 0.198 10 23:45:00 0.198 10 23:45:00 -0.217 17 13:45:00 -0.219 17 13:30:00 July 0.455 4 09:15:00 0.452 4 09:15:00 -0.141 9 07:45:00 -0.149 9 07:45:00 Aug 0.325 29 16:00:00 0.322 11 04:45:00 -0.201 18 01:30:00 -0.205 18 01:30:00 Sep 0.426 26 02:45:00 0.419 26 02:45:00 -0.19 21 02:30:00 -0.197 21 02:30:00 Oct 0.747 26 03:00:00 0.744 26 03:00:00 -0.223 22 00:00:00 -0.224 22 01:15:00 Nov 0.573 6 14:00:00 0.063 19 01:45:00 -0.215 5 01:00:00 -0.184 20 21:00:00 Dec 0.892 10 05:30:00 -0.519 28 04:45:00
Extreme Maxima Extreme Minima
Channel 1 Channel 2 Channel 1 Channel 2 Value Day Time Value Day Time Value Day Time Value Day Time
Jan 3.425 3 08:30:00 3.421 3 08:30:00 -1.963 31 13:30:00 -1.972 31 13:30:00 Feb 3.44 1 08:15:00 3.433 1 08:15:00 -2.013 2 15:00:00 -2.023 2 15:00:00 Mar 3.161 3 08:30:00 3.157 3 08:30:00 -2.328 1 13:30:00 -2.336 1 13:30:00 Apr 2.662 1 07:45:00 2.658 1 07:45:00 -2.096 1 14:30:00 -2.102 1 14:30:00 May 2.516 17 21:15:00 2.508 17 21:15:00 -1.933 17 02:30:00 -1.94 17 02:30:00 Jun 2.408 14 20:00:00 2.408 14 20:00:00 -2.218 16 03:30:00 -2.22 16 03:30:00 July 2.938 14 20:45:00 2.931 14 20:45:00 -2.17 15 03:00:00 -2.181 15 03:00:00 Aug 3.086 11 19:45:00 3.085 12 20:15:00 -2.282 13 03:00:00 -2.284 13 03:00:00 Sep 2.916 9 19:15:00 2.911 9 19:15:00 -2.442 11 02:30:00 -2.449 11 02:30:00 Oct 3.051 8 19:00:00 3.049 8 19:00:00 -2.129 10 02:15:00 -2.133 10 02:15:00 Nov 3.107 6 18:30:00 2.191 21 06:00:00 -1.815 4 23:30:00 -1.43 21 00:15:00 Dec 2.913 24 08:30:00 -2.131 25 15:45:00
Mean Sea Level
Channel 1 Channel 2 January 31 0.631 31 0.625 February 28 0.642 23 0.627 March 31 0.412 31 0.405 April 30 0.373 30 0.373 May 31 0.301 31 0.298 June 30 0.283 30 0.281 July 31 0.37 31 0.365 August 31 0.387 31 0.384 September 30 0.377 30 0.371 October 31 0.609 29 0.607 November 30 0.569 0 * December 31 0.517 0 * TOTAL & AVG 365 0.456 297 ** * No mean sea level value as more than 15 days of data missing ** No yearly average value as more than one month’s MSL missing
72
UKCMF Annual Tide Gauge Report 2014
Leith – Tide Gauge Information Latitude 55° 59' 23.4"N Longitude 03° 10' 54.1"W Grid Ref NT 2638 7806 Instrument Data acquisition system with two full-tide and a mid-tide bubbler gauge Location Tide Gauge Building Lead-in jetty, east of the entrance to Leith docks
Measuring Points As above Datum The delayed-mode data are to Admiralty Chart Datum (ACD).
The statistics in this report are to Ordnance Datum Newlyn (ODN). Benchmark Grid Ref Description TGBM NT 2643 7797 OSBM Bolt SE end of TG pier 0.9m N angle of pier Aux1 NT 2648 7797 Rivet on top step SW side of road 1.6m S angle of building Aux2 NT 2653 7789 Rivet top step SW side of road 11.9M W angle of building Benchmark Relationships TGZ = Admiralty Chart Datum (ACD) TGZ = 2.90m below Ordnance Datum Newlyn (ODN) TGZ = 7.84mm below TGBM Levelling No levelling was carried out in 2014 Site visits 10/10/2014 (Day 283) Maintenance. Compressor change. Notes on Data Quality The site met the agreed target of being operational for at least 75% of each calendar month in 2014.
73
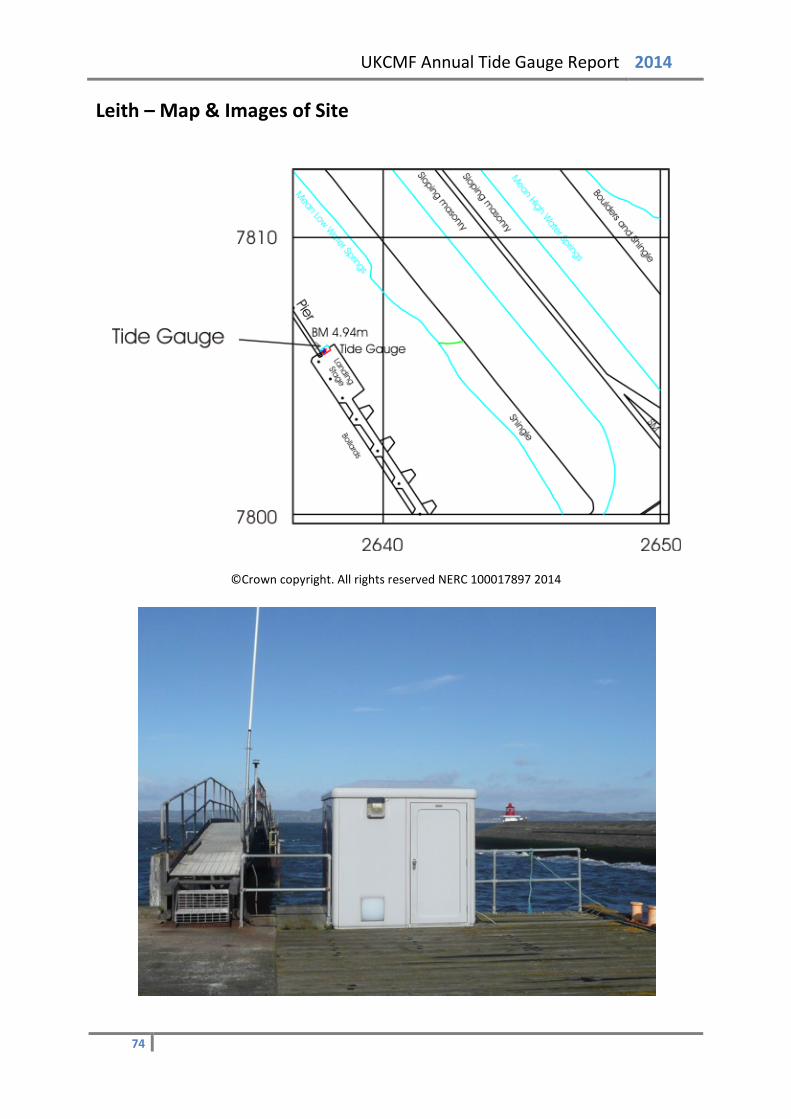
UKCMF Annual Tide Gauge Report 2014
Leith – Map & Images of Site
©Crown copyright. All rights reserved NERC 100017897 2014
74

UKCMF Annual Tide Gauge Report 2014
Leith – Statistics
Surge Maxima Surge Minima
Channel 1 Channel 2 Channel 1 Channel 2 Value Day Time Value Day Time Value Day Time Value Day Time
Jan 0.707 4 11:45:00 0.71 4 11:45:00 -0.61 26 18:00:00 -0.607 26 18:00:00 Feb 0.613 12 15:15:00 0.617 12 15:15:00 -0.469 13 03:30:00 -0.463 13 03:30:00 Mar 0.879 14 22:30:00 0.883 14 22:30:00 -0.687 8 15:00:00 -0.684 8 15:00:00 Apr 0.484 12 21:30:00 0.489 12 21:30:00 -0.259 15 11:45:00 -0.137 9 06:00:00 May 0.413 11 11:15:00 0.415 11 11:15:00 -0.276 14 18:15:00 -0.273 14 18:15:00 Jun 0.288 19 04:00:00 0.29 19 04:00:00 -0.178 17 12:45:00 -0.174 17 12:45:00 July 0.41 4 21:45:00 0.412 4 21:45:00 -0.181 20 07:30:00 -0.178 20 07:30:00 Aug 0.435 9 21:30:00 0.437 9 21:30:00 -0.276 11 09:00:00 -0.27 11 09:00:00 Sep 0.404 26 13:00:00 0.406 26 13:00:00 -0.222 13 16:45:00 -0.221 13 16:45:00 Oct 0.755 21 19:15:00 0.755 21 19:15:00 -0.315 22 15:30:00 -0.315 22 15:30:00 Nov 0.475 8 07:15:00 0.479 8 07:15:00 -0.194 14 17:30:00 -0.19 14 17:30:00 Dec 0.858 10 01:00:00 0.864 10 01:00:00 -0.736 9 15:15:00 -0.732 9 15:15:00
Extreme Maxima Extreme Minima
Channel 1 Channel 2 Channel 1 Channel 2 Value Day Time Value Day Time Value Day Time Value Day Time
Jan 3.623 4 16:15:00 3.628 4 16:15:00 -2.944 31 21:15:00 -2.94 31 21:15:00 Feb 3.298 1 15:30:00 3.302 1 15:30:00 -2.92 1 22:00:00 -2.914 1 22:00:00 Mar 3.298 2 15:15:00 3.3 2 15:15:00 -2.761 1 21:00:00 -2.758 1 21:00:00 Apr 3.016 1 15:30:00 3.019 1 15:30:00 -2.458 1 21:45:00 -2.456 1 21:45:00 May 2.718 1 03:45:00 2.72 1 03:45:00 -2.359 16 09:30:00 -2.357 16 09:30:00 Jun 2.763 15 03:45:00 2.765 14 03:00:00 -2.596 15 10:00:00 -2.593 15 10:00:00 July 3.097 14 03:15:00 3.1 14 03:15:00 -2.665 14 09:45:00 -2.662 14 09:45:00 Aug 3.4 13 04:00:00 3.402 13 04:00:00 -2.909 11 08:45:00 -2.905 11 08:45:00 Sep 3.283 10 02:45:00 3.285 10 02:45:00 -2.86 11 10:00:00 -2.857 11 10:00:00 Oct 3.418 9 02:15:00 3.421 9 02:15:00 -2.439 8 08:00:00 -2.436 8 08:00:00 Nov 3.154 8 02:45:00 3.157 8 02:45:00 -2.253 6 07:45:00 -2.25 6 07:45:00 Dec 3.146 23 15:00:00 3.149 23 15:00:00 -2.436 25 23:15:00 -2.434 25 23:15:00
Mean Sea Level
Channel 1 Channel 2 January 31 0.356 31 0.359 February 28 0.393 28 0.396 March 31 0.254 31 0.257 April 30 0.271 24 0.273 May 31 0.241 31 0.243 June 30 0.252 30 0.254 July 31 0.298 31 0.3 August 31 0.322 31 0.325 September 30 0.321 30 0.323 October 31 0.452 31 0.454 November 30 0.432 30 0.435 December 31 0.361 31 0.364 TOTAL & AVG 365 0.329 359 0.332 * No mean sea level value as more than 15 days of data missing ** No yearly average value as more than one month’s MSL missing
75
UKCMF Annual Tide Gauge Report 2014
Lerwick – Tide Gauge Information Latitude 60° 09' 14.5" N Longitude 01° 08' 25.1" W Grid Ref HU 4783 4137 Instrument Data acquisition system with two full-tide and a mid-tide bubbler gauge Location Tide Gauge Building Inner wall at breakwater entrance to the small boat
harbour, south of Victoria Pier Measuring Points As above
Datum The delayed-mode data are to Admiralty Chart Datum (ACD).
The statistics in this report are to Ordnance Datum Local (ODL). Benchmark Grid Ref Description TGBM HU 4783 4129 OSBM bolt on breakwater wall Aux1 HU 4784 4125 Queen’s Hotel 7.5m SW face south angle Aux2 HU 4777 4110 Lerwick Parish Church North face NW angle Benchmark Relationships TGZ = Admiralty Chart Datum (ACD) TGZ = 1.22m below Ordnance Datum Local (ODL) TGZ = 4.57m below TGBM Levelling No levelling was carried out in 2014 Site visits 31/03/2014 (Day 090) Maintenance. Compressor change. Notes on Data Quality The lower quality index for February to December is due to a feature of the near real time quality control algorithm. The algorithm requires two hours of data either side of high water, which, due to the position of the mid tide at Lerwick, is not always available, giving an erroneous impression of the data quality. The algorithm is being refined to perform better at these sites. The data inspected in delayed mode reveal no issues.
76
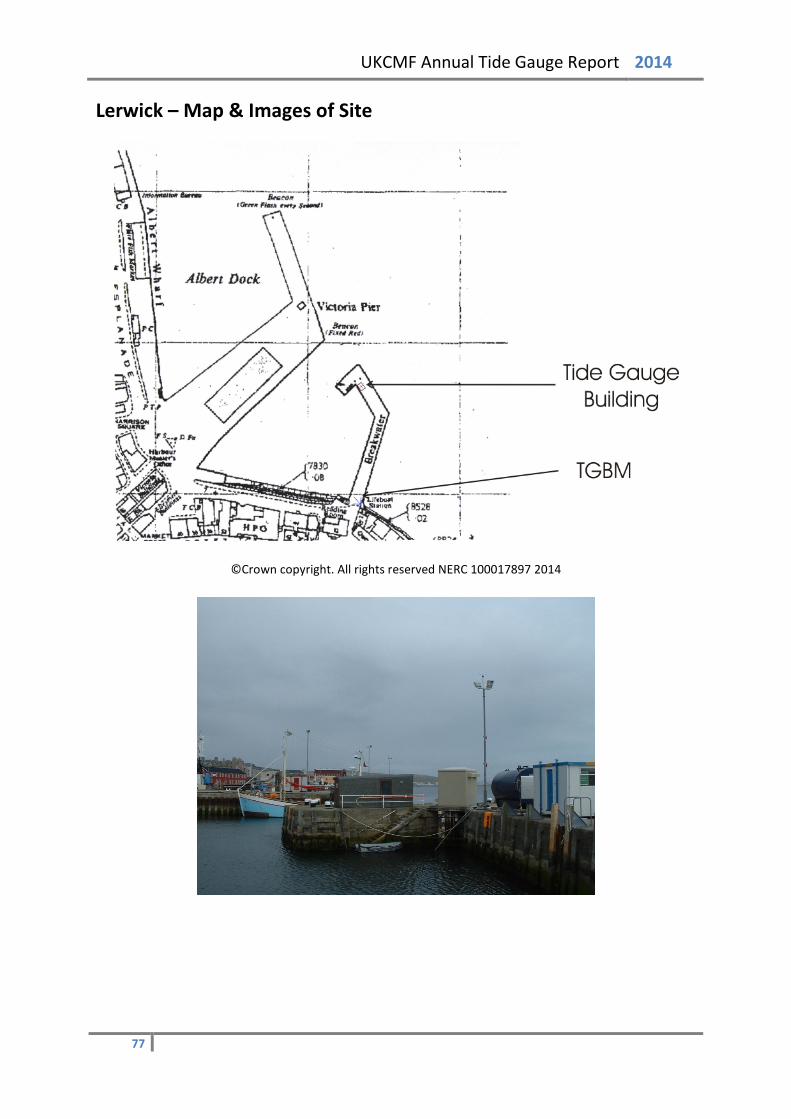
UKCMF Annual Tide Gauge Report 2014
Lerwick – Map & Images of Site
©Crown copyright. All rights reserved NERC 100017897 2014
77

UKCMF Annual Tide Gauge Report 2014
Lerwick – Statistics
Surge Maxima Surge Minima
Channel 1 Channel 2 Channel 1 Channel 2 Value Day Time Value Day Time Value Day Time Value Day Time
Jan 0.444 7 07:15:00 0.453 7 07:15:00 -0.265 29 01:30:00 -0.256 29 01:30:00 Feb 0.438 9 08:45:00 0.447 9 08:45:00 -0.111 19 10:30:00 -0.101 19 10:30:00 Mar 0.498 21 03:30:00 0.508 21 03:30:00 -0.303 28 18:15:00 -0.295 28 18:15:00 Apr 0.392 12 16:30:00 0.4 12 16:30:00 -0.132 22 21:15:00 -0.123 22 21:15:00 May 0.32 6 17:30:00 0.329 6 17:30:00 -0.217 22 07:00:00 -0.209 23 15:00:00 Jun 0.138 10 16:30:00 0.146 10 16:30:00 -0.201 17 18:30:00 -0.192 17 18:30:00 July 0.366 4 16:30:00 0.375 4 16:30:00 -0.144 25 10:15:00 -0.135 25 10:15:00 Aug 0.294 9 22:00:00 0.303 9 22:00:00 -0.125 27 01:45:00 -0.116 27 01:45:00 Sep 0.281 26 15:15:00 0.29 26 15:15:00 -0.206 13 14:00:00 -0.198 13 14:00:00 Oct 0.437 21 08:45:00 0.445 21 08:45:00 -0.121 14 08:15:00 -0.113 14 08:15:00 Nov 0.345 2 03:45:00 0.355 2 03:45:00 -0.16 19 23:00:00 -0.152 19 23:00:00 Dec 0.579 10 18:15:00 0.588 10 18:15:00 -0.339 28 16:00:00 -0.331 28 16:00:00
Extreme Maxima Extreme Minima
Channel 1 Channel 2 Channel 1 Channel 2 Value Day Time Value Day Time Value Day Time Value Day Time
Jan 1.589 4 12:45:00 1.596 4 12:45:00 -1.01 30 16:30:00 -1.001 30 16:30:00 Feb 1.448 2 12:45:00 1.454 2 12:45:00 -0.928 2 19:00:00 -0.919 2 19:00:00 Mar 1.264 2 11:15:00 1.273 2 11:15:00 -1.252 29 16:00:00 -1.244 29 16:00:00 Apr 1.029 17 12:15:00 1.037 17 12:15:00 -1.022 1 18:00:00 -1.014 1 18:00:00 May 0.954 18 00:45:00 0.961 18 00:45:00 -0.988 2 06:30:00 -0.979 2 06:30:00 Jun 0.907 13 23:15:00 0.914 13 23:15:00 -1.152 16 06:45:00 -1.143 16 06:45:00 July 1.223 15 00:00:00 1.232 15 00:00:00 -1.057 16 07:30:00 -1.048 16 07:30:00 Aug 1.421 11 23:15:00 1.429 11 23:15:00 -1.014 13 06:15:00 -1.004 13 06:15:00 Sep 1.193 9 23:15:00 1.202 9 23:15:00 -1.138 11 06:00:00 -1.129 11 06:00:00 Oct 1.394 26 12:15:00 1.401 26 12:15:00 -0.809 7 03:30:00 -0.801 7 03:30:00 Nov 1.293 7 11:15:00 1.3 7 11:15:00 -0.782 5 03:15:00 -0.773 5 03:15:00 Dec 1.354 10 13:00:00 1.364 10 13:00:00 -1.043 25 19:30:00 -1.034 25 19:30:00
Mean Sea Level
Channel 1 Channel 2 January 31 0.205 31 0.214 February 28 0.252 28 0.26 March 31 0.074 31 0.083 April 30 0.024 30 0.032 May 31 -0.02 31 -0.012 June 30 -0.008 30 0.001 July 31 0.069 31 0.078 August 31 0.114 31 0.123 September 30 0.085 30 0.093 October 31 0.267 31 0.275 November 30 0.213 30 0.222 December 31 0.236 31 0.244 TOTAL & AVG 365 0.126 365 0.134 * No mean sea level value as more than 15 days of data missing ** No yearly average value as more than one month’s MSL missing
78
UKCMF Annual Tide Gauge Report 2014
Liverpool – Tide Gauge Information Latitude 53° 26' 58.9" N Longitude 03° 01' 04.8" W Grid Ref SJ 3249 9525 Instrument Data acquisition system with two full-tide and a mid-tide bubbler gauge Location Tide Gauge Building In the old Lock Keeper’s office at the entrance to
Gladstone Dock Measuring Points Seaward side of Gladstone Dock
Datum The delayed-mode data are to Admiralty Chart Datum (ACD).
The statistics in this report are to Ordnance Datum Newlyn (ODN). Benchmark Grid Ref Description TGBM SJ 3249 9525 NBM rivet NE face E angle base of building Aux1 SJ 3250 9523 Rivet E side of quay above hinge SW dock gate Aux2 SJ 3244 9538 Building wall E face SE angle Aux3 SJ 3294 9558 Rivet concrete adjacent to building No 335 Benchmark Relationships TGZ = Admiralty Chart Datum (ACD) TGZ = 4.93m below Ordnance Datum Newlyn (ODN) TGZ = 14.475m below TGBM Levelling Bench marks levelled by TGI on 23/01/2014 and 21/05/2014 Site visits 23/01/2014 (Day 023) Maintenance. 06/03/2014 (Day 065) Site meeting with Warrington EA. 25/03/2014 (Day 084) Meeting with Warrington EA - calibration of the EA transducer. 03-11/04/2014 (Day 093-101)
Site refurbishment work, painting interior of new building
23/04/2014 (Day 113) Visit with Paul Swinburne to view site problems and refurbishment. 21/05/2014 (Day 141) Installation of outstation and pneumatic panel. 02/07/2014 (Day 183) Maintenance. Inst of 12v compressor for testing. 18/07/2014 (Day 199) Attended site with engineer to assess routing of pneumatic tubes. 05/08/2014 (Day 217) Meeting with EA electrician to survey site for electrical installation. 21/08/2014 (Day 233) Meeting with an EA electrician tendering for the installation work. 25/09/2014 (Day 268) Installation of ducts for the pneumatic tubes. Additional Aux2
bench mark installed due to wind wall being demolished. 05/11/2014 (Day 309) Installation of tube protectors. 28/11/2014 (Day 332) Meeting with electricians during electrical installation. Reported
spurious data. Pressure point silting - cleared OK. Notes on Data Quality The pier is subsiding. From 2013, Channel 2 was ~60mm low on falling tides - acceptable for monitoring extremes but unacceptable for the purposes of long-term sea level monitoring. The lower pressure point may be silting up due to the port works in the area.
79
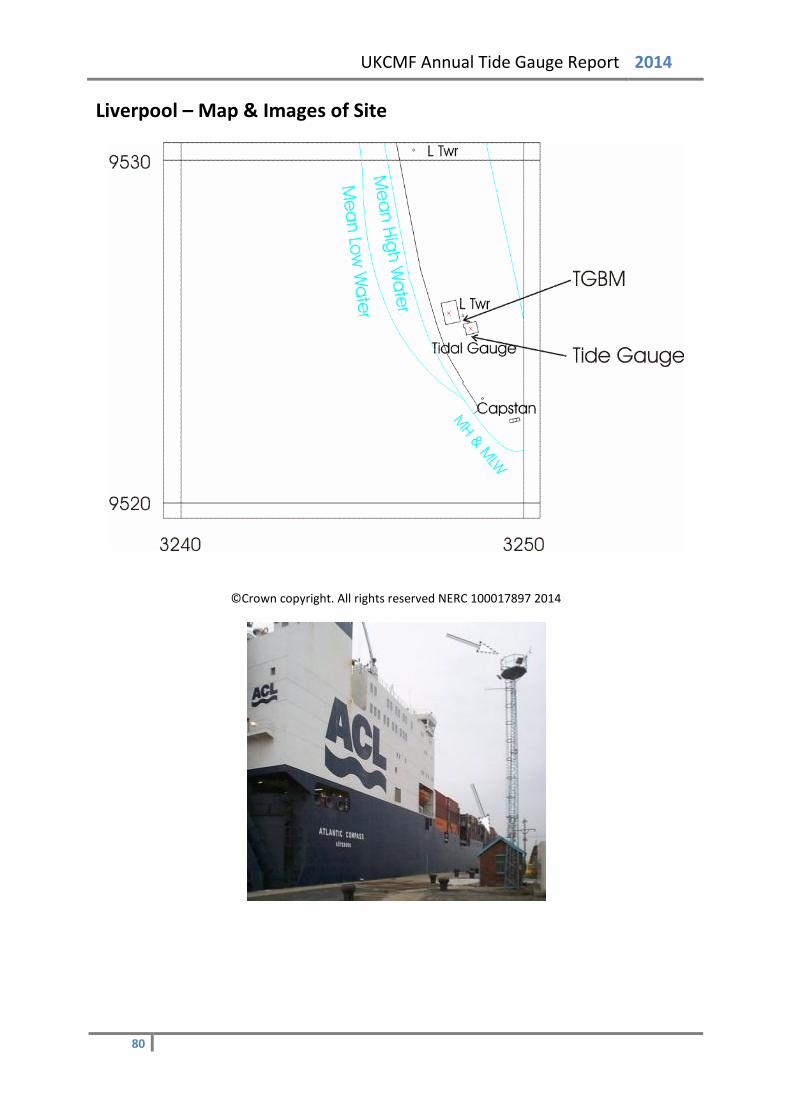
UKCMF Annual Tide Gauge Report 2014
Liverpool – Map & Images of Site
©Crown copyright. All rights reserved NERC 100017897 2014
80
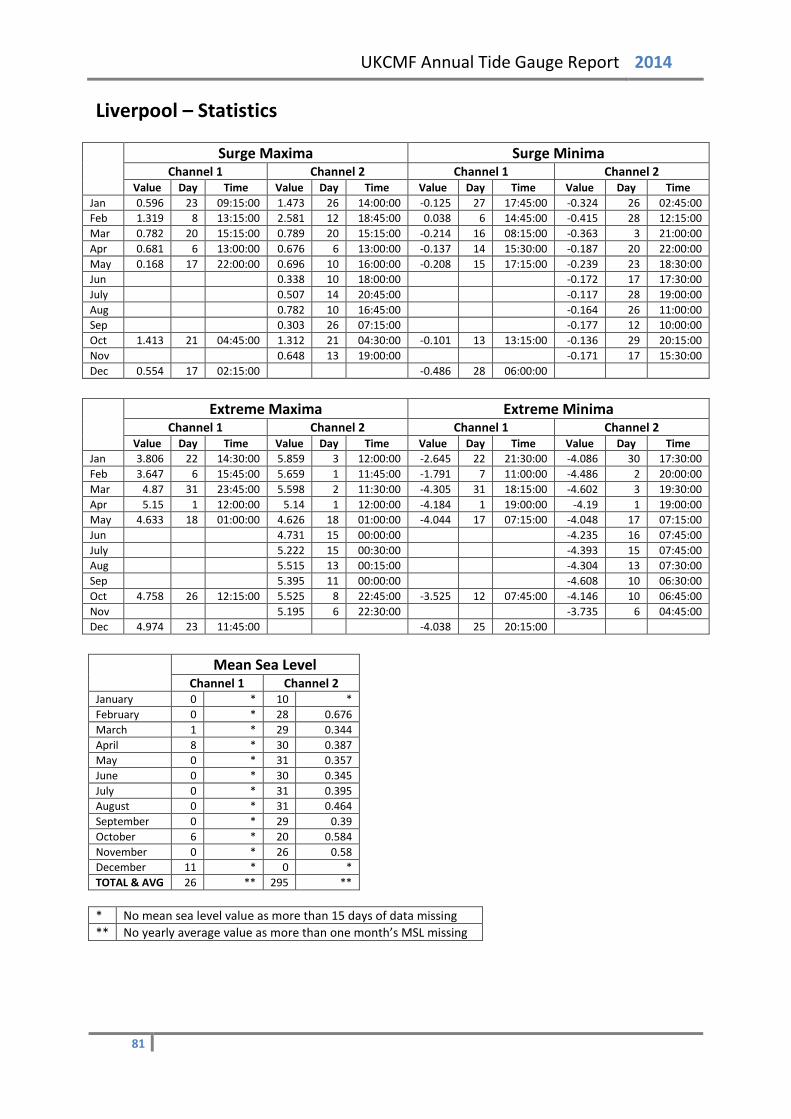
UKCMF Annual Tide Gauge Report 2014
Liverpool – Statistics
Surge Maxima Surge Minima
Channel 1 Channel 2 Channel 1 Channel 2 Value Day Time Value Day Time Value Day Time Value Day Time
Jan 0.596 23 09:15:00 1.473 26 14:00:00 -0.125 27 17:45:00 -0.324 26 02:45:00 Feb 1.319 8 13:15:00 2.581 12 18:45:00 0.038 6 14:45:00 -0.415 28 12:15:00 Mar 0.782 20 15:15:00 0.789 20 15:15:00 -0.214 16 08:15:00 -0.363 3 21:00:00 Apr 0.681 6 13:00:00 0.676 6 13:00:00 -0.137 14 15:30:00 -0.187 20 22:00:00 May 0.168 17 22:00:00 0.696 10 16:00:00 -0.208 15 17:15:00 -0.239 23 18:30:00 Jun 0.338 10 18:00:00 -0.172 17 17:30:00 July 0.507 14 20:45:00 -0.117 28 19:00:00 Aug 0.782 10 16:45:00 -0.164 26 11:00:00 Sep 0.303 26 07:15:00 -0.177 12 10:00:00 Oct 1.413 21 04:45:00 1.312 21 04:30:00 -0.101 13 13:15:00 -0.136 29 20:15:00 Nov 0.648 13 19:00:00 -0.171 17 15:30:00 Dec 0.554 17 02:15:00 -0.486 28 06:00:00
Extreme Maxima Extreme Minima
Channel 1 Channel 2 Channel 1 Channel 2 Value Day Time Value Day Time Value Day Time Value Day Time
Jan 3.806 22 14:30:00 5.859 3 12:00:00 -2.645 22 21:30:00 -4.086 30 17:30:00 Feb 3.647 6 15:45:00 5.659 1 11:45:00 -1.791 7 11:00:00 -4.486 2 20:00:00 Mar 4.87 31 23:45:00 5.598 2 11:30:00 -4.305 31 18:15:00 -4.602 3 19:30:00 Apr 5.15 1 12:00:00 5.14 1 12:00:00 -4.184 1 19:00:00 -4.19 1 19:00:00 May 4.633 18 01:00:00 4.626 18 01:00:00 -4.044 17 07:15:00 -4.048 17 07:15:00 Jun 4.731 15 00:00:00 -4.235 16 07:45:00 July 5.222 15 00:30:00 -4.393 15 07:45:00 Aug 5.515 13 00:15:00 -4.304 13 07:30:00 Sep 5.395 11 00:00:00 -4.608 10 06:30:00 Oct 4.758 26 12:15:00 5.525 8 22:45:00 -3.525 12 07:45:00 -4.146 10 06:45:00 Nov 5.195 6 22:30:00 -3.735 6 04:45:00 Dec 4.974 23 11:45:00 -4.038 25 20:15:00
Mean Sea Level
Channel 1 Channel 2 January 0 * 10 * February 0 * 28 0.676 March 1 * 29 0.344 April 8 * 30 0.387 May 0 * 31 0.357 June 0 * 30 0.345 July 0 * 31 0.395 August 0 * 31 0.464 September 0 * 29 0.39 October 6 * 20 0.584 November 0 * 26 0.58 December 11 * 0 * TOTAL & AVG 26 ** 295 ** * No mean sea level value as more than 15 days of data missing ** No yearly average value as more than one month’s MSL missing
81

UKCMF Annual Tide Gauge Report 2014
Llandudno – Tide Gauge Information Latitude 53° 19' 54.0" N Longitude 03° 49' 30.8" W Grid Ref SH 7855 8319 Instrument Data acquisition system with two full-tide and a mid-tide bubbler gauge Location Tide Gauge Building A sub-platform under the pavilion at the end of
Llandudno pier Measuring Points A leg of the pier below the tide gauge building
Datum The delayed-mode data are to Admiralty Chart Datum (ACD).
The statistics in this report are to Ordnance Datum Newlyn (ODN). Benchmark Grid Ref Description TGBM SH 7834 8292 Rivet stone butt gate entrance Aux1 SH 7827 8255 OSBM bolt concrete step SE side of slipway Aux2 SH 7840 8243 OSBM bolt bottom concrete step Aux3 SH 7864 8229 OSBM bolt concrete ramp 6.5M NW C slipway Benchmark Relationships TGZ = Admiralty Chart Datum (ACD) TGZ = 3.85m below Ordnance Datum Newlyn (ODN) TGZ = 12.558m below TGBM Levelling No levelling was carried out in 2014 Site visits No site visits were carried out in 2014 Notes on Data Quality The site met the agreed target of being operational for at least 75% of each calendar month in 2014.
82
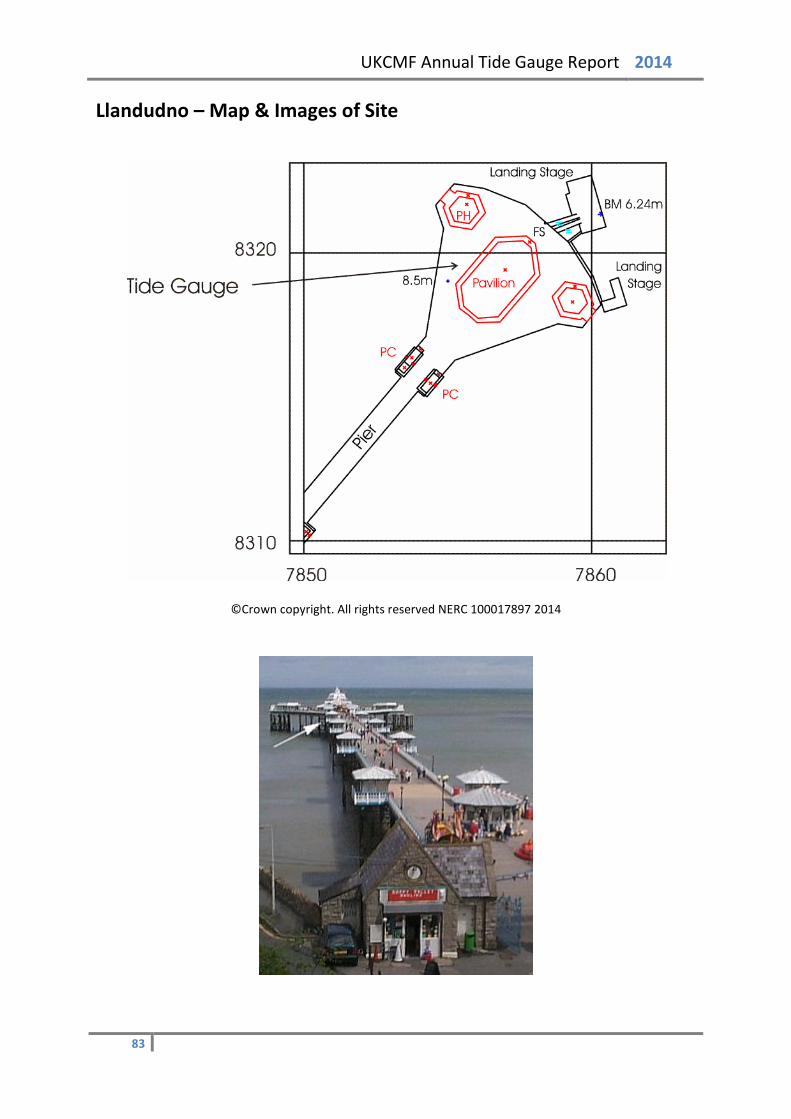
UKCMF Annual Tide Gauge Report 2014
Llandudno – Map & Images of Site
©Crown copyright. All rights reserved NERC 100017897 2014
83

UKCMF Annual Tide Gauge Report 2014
Llandudno – Statistics
Surge Maxima Surge Minima
Channel 1 Channel 2 Channel 1 Channel 2 Value Day Time Value Day Time Value Day Time Value Day Time
Jan 1.051 26 13:30:00 1.061 26 13:30:00 -0.38 26 01:15:00 -0.371 26 01:15:00 Feb 1.623 12 17:45:00 1.633 12 17:45:00 -0.453 28 12:00:00 -0.443 28 12:00:00 Mar 0.608 20 14:15:00 0.619 20 14:15:00 -0.37 25 21:30:00 -0.361 25 21:30:00 Apr 0.503 6 11:45:00 0.511 6 11:45:00 -0.262 14 15:45:00 -0.251 14 15:45:00 May 0.463 10 15:15:00 0.473 10 15:15:00 -0.323 23 19:15:00 -0.291 23 17:30:00 Jun 0.207 7 15:45:00 0.215 7 15:45:00 -0.252 17 17:30:00 -0.246 17 17:30:00 July 0.293 4 16:00:00 0.299 4 16:00:00 -0.27 9 10:15:00 -0.257 9 10:15:00 Aug 0.331 29 08:15:00 0.341 29 08:15:00 -0.208 26 09:15:00 -0.186 26 10:00:00 Sep 0.132 24 03:00:00 0.141 24 03:00:00 -0.206 2 01:45:00 -0.198 2 01:45:00 Oct 1.062 21 05:45:00 1.079 21 05:45:00 -0.591 21 20:15:00 -0.578 21 20:15:00 Nov 0.554 13 18:45:00 0.564 13 18:45:00 -0.266 17 14:45:00 -0.248 17 14:45:00 Dec 0.68 9 20:30:00 0.689 9 20:30:00 -0.598 2 08:00:00 -0.577 2 08:00:00
Extreme Maxima Extreme Minima
Channel 1 Channel 2 Channel 1 Channel 2 Value Day Time Value Day Time Value Day Time Value Day Time
Jan 5.07 3 12:00:00 5.081 3 12:00:00 -3.623 30 16:45:00 -3.614 30 16:45:00 Feb 4.881 3 13:00:00 4.891 3 13:00:00 -3.991 2 19:00:00 -3.982 2 19:00:00 Mar 4.803 2 11:15:00 4.811 2 11:15:00 -4.144 3 18:45:00 -4.135 3 18:45:00 Apr 4.317 1 11:30:00 4.326 1 11:30:00 -3.743 1 18:15:00 -3.735 1 18:15:00 May 3.896 18 00:30:00 3.912 18 00:30:00 -3.662 17 06:30:00 -3.654 17 06:30:00 Jun 3.977 14 23:30:00 3.984 14 23:30:00 -3.811 16 07:15:00 -3.801 16 07:15:00 July 4.434 15 00:15:00 4.441 15 00:15:00 -3.994 15 07:00:00 -3.983 15 07:00:00 Aug 4.677 13 00:00:00 4.685 13 00:00:00 -3.963 13 06:45:00 -3.953 13 06:45:00 Sep 4.614 10 23:30:00 4.621 10 23:30:00 -4.073 10 05:30:00 -4.066 10 05:30:00 Oct 4.789 8 22:30:00 4.797 8 22:30:00 -3.669 10 05:45:00 -3.66 10 05:45:00 Nov 4.547 6 22:15:00 4.557 6 22:15:00 -3.331 5 03:15:00 -3.314 5 03:15:00 Dec 4.18 23 11:15:00 4.191 23 11:15:00 -3.703 25 19:30:00 -3.691 25 19:30:00
Mean Sea Level
Channel 1 Channel 2 January 31 0.443 31 0.452 February 28 0.481 28 0.49 March 31 0.161 31 0.171 April 30 0.197 30 0.206 May 31 0.163 31 0.172 June 30 0.152 30 0.16 July 31 0.199 31 0.207 August 31 0.243 31 0.252 September 30 0.215 30 0.223 October 31 0.394 31 0.404 November 30 0.409 30 0.418 December 31 0.227 31 0.238 TOTAL & AVG 365 0.274 365 0.283 * No mean sea level value as more than 15 days of data missing ** No yearly average value as more than one month’s MSL missing
84
UKCMF Annual Tide Gauge Report 2014
Lowestoft – Tide Gauge Information Latitude 52° 28' 23.2" N Longitude 01° 45' 00.4" E Grid Ref TM 5478 9274 Instrument Data acquisition system with two full-tide and a mid-tide bubbler gauge Location Tide Gauge Building East of the Harbour Master's office
Measuring Points On the quay wall, east of the tide gauge building Datum The delayed-mode data are to Admiralty Chart Datum (ACD).
The statistics in this report are to Ordnance Datum Newlyn (ODN). Benchmark Grid Ref Description TGBM TM 5482 9273 Bolt on quay wall S side of pier Aux1 TM 5477 9272 Bolt on concrete jetty at SW corner of TG building Aux2 TM 5478 9274 CM Harbour Masters Office SE angle S face Benchmark Relationships TGZ = Admiralty Chart Datum (ACD) TGZ = 1.50m below Ordnance Datum Newlyn (ODN) TGZ = 4.483m below TGBM Levelling No levelling was carried out in 2014 Site visits 02/05/2014 (Day 122) Maintenance. 23/11/2014 (Day 327) Maintenance. Notes on Data Quality The site met the agreed target of being operational for at least 75% of each calendar month in 2014.
85
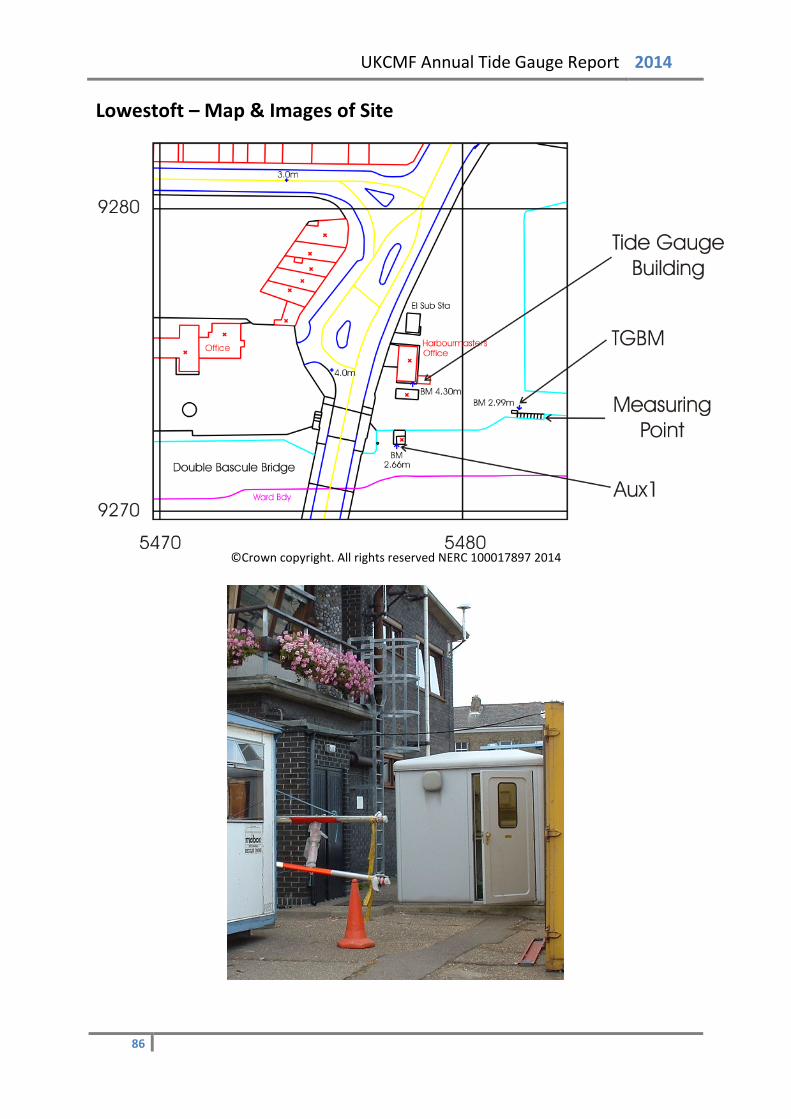
UKCMF Annual Tide Gauge Report 2014
Lowestoft – Map & Images of Site
©Crown copyright. All rights reserved NERC 100017897 2014
86

UKCMF Annual Tide Gauge Report 2014
Lowestoft – Statistics
Surge Maxima Surge Minima
Channel 1 Channel 2 Channel 1 Channel 2 Value Day Time Value Day Time Value Day Time Value Day Time
Jan 0.782 25 23:15:00 0.804 25 23:15:00 -1.03 25 03:45:00 -1.018 25 03:45:00 Feb 0.43 7 12:15:00 0.457 7 12:15:00 -0.896 1 01:30:00 -0.88 1 02:15:00 Mar 1.022 15 04:00:00 1.044 15 04:00:00 -0.734 8 20:30:00 -0.723 8 20:30:00 Apr 0.574 18 04:30:00 0.597 18 04:30:00 -0.321 16 05:15:00 -0.302 16 05:15:00 May 0.314 11 17:15:00 0.333 11 17:15:00 -0.277 15 06:30:00 -0.257 15 06:30:00 Jun 0.355 19 10:15:00 0.379 19 10:15:00 -0.178 12 17:30:00 -0.15 12 17:30:00 July 0.41 9 12:00:00 0.425 9 12:00:00 -0.258 16 19:45:00 -0.237 16 20:00:00 Aug 0.397 18 11:00:00 0.419 18 11:00:00 -0.288 3 23:45:00 -0.271 3 23:45:00 Sep 0.575 26 18:45:00 0.59 26 18:30:00 -0.215 25 12:00:00 -0.202 25 12:00:00 Oct 1.717 22 01:30:00 1.738 22 01:30:00 -0.458 6 18:15:00 -0.437 6 16:00:00 Nov 0.326 15 18:45:00 0.338 15 18:45:00 -0.513 7 04:30:00 -0.508 7 09:15:00 Dec 0.986 10 07:30:00 0.992 10 07:30:00 -1.276 9 22:45:00 -1.259 9 22:45:00
Extreme Maxima Extreme Minima
Channel 1 Channel 2 Channel 1 Channel 2 Value Day Time Value Day Time Value Day Time Value Day Time
Jan 1.601 4 23:30:00 1.619 4 23:30:00 -1.622 6 07:00:00 -1.622 6 07:00:00 Feb 1.345 2 23:00:00 1.361 2 23:00:00 -1.997 1 04:30:00 -1.983 1 04:30:00 Mar 1.436 15 08:15:00 1.455 15 08:15:00 -1.455 3 04:45:00 -1.447 3 04:45:00 Apr 1.46 17 22:45:00 1.484 17 22:45:00 -1.246 16 04:15:00 -1.227 16 04:15:00 May 1.05 17 10:45:00 1.08 17 10:45:00 -1.148 15 03:30:00 -1.129 15 03:30:00 Jun 1.351 19 14:00:00 1.37 19 14:00:00 -1.173 17 19:00:00 -1.155 17 19:00:00 July 1.364 15 11:15:00 1.384 15 11:15:00 -1.351 16 18:45:00 -1.339 16 18:45:00 Aug 1.484 14 11:45:00 1.498 14 11:30:00 -1.285 11 16:15:00 -1.262 11 16:15:00 Sep 1.415 26 22:30:00 1.424 26 22:30:00 -1.232 10 16:30:00 -1.22 10 16:30:00 Oct 1.997 21 20:30:00 2.015 21 20:30:00 -1.251 6 13:45:00 -1.237 6 13:45:00 Nov 1.357 8 09:45:00 1.372 8 09:45:00 -1.339 7 15:45:00 -1.324 7 15:45:00 Dec 1.632 10 11:00:00 1.637 10 11:00:00 -1.303 9 17:45:00 -1.275 9 17:45:00
Mean Sea Level
Channel 1 Channel 2 January 31 0.064 31 0.081 February 28 0.063 28 0.08 March 31 0.105 31 0.124 April 30 0.151 30 0.173 May 31 0.107 31 0.128 June 30 0.151 30 0.17 July 31 0.206 31 0.224 August 31 0.214 31 0.232 September 30 0.23 30 0.245 October 31 0.269 18 0.275 November 30 0.202 27 0.212 December 31 0.278 31 0.29 TOTAL & AVG 365 0.170 349 0.186 * No mean sea level value as more than 15 days of data missing ** No yearly average value as more than one month’s MSL missing
87
UKCMF Annual Tide Gauge Report 2014
Milford Haven – Tide Gauge Information Latitude 51° 42' 26.6" N Longitude 05° 03' 05.5" W Grid Ref SM 8925 0537 Instrument Data acquisition system with two full-tide and a mid-tide bubbler gauge Location Tide Gauge Building Store room at the shore end of Milford Haven Port
Authority jetty Measuring Points Seaward end of the jetty
Datum The delayed-mode data are to Admiralty Chart Datum (ACD).
The statistics in this report are to Ordnance Datum Newlyn (ODN). Benchmark Grid Ref Description TGBM SM 8921 0536 OSBM Bolt on wall W side of entrance to jetty Aux1 SM 8918 0541 Fl Br G4977 office buildings. SW face NW angle. Aux2 SM 9001 0601 OSBM bolt wall Victoria Road Benchmark Relationships TGZ = Admiralty Chart Datum (ACD) TGZ = 3.71m below Ordnance Datum Newlyn (ODN) TGZ = 16.734m below TGBM Levelling No levelling was carried out in 2014 Site visits 07/11/2014 (Day 311) Maintenance. Compressor change. Notes on Data Quality The site met the agreed target of being operational for at least 75% of each calendar month in 2014.
88
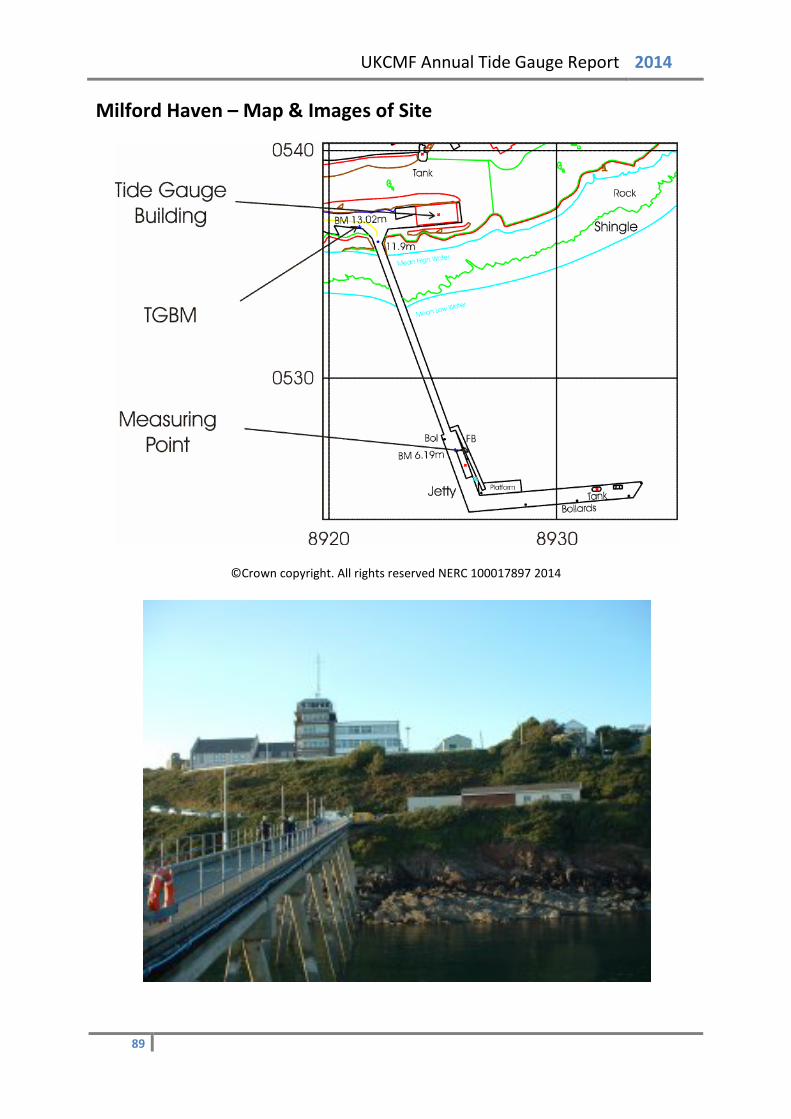
UKCMF Annual Tide Gauge Report 2014
Milford Haven – Map & Images of Site
©Crown copyright. All rights reserved NERC 100017897 2014
89
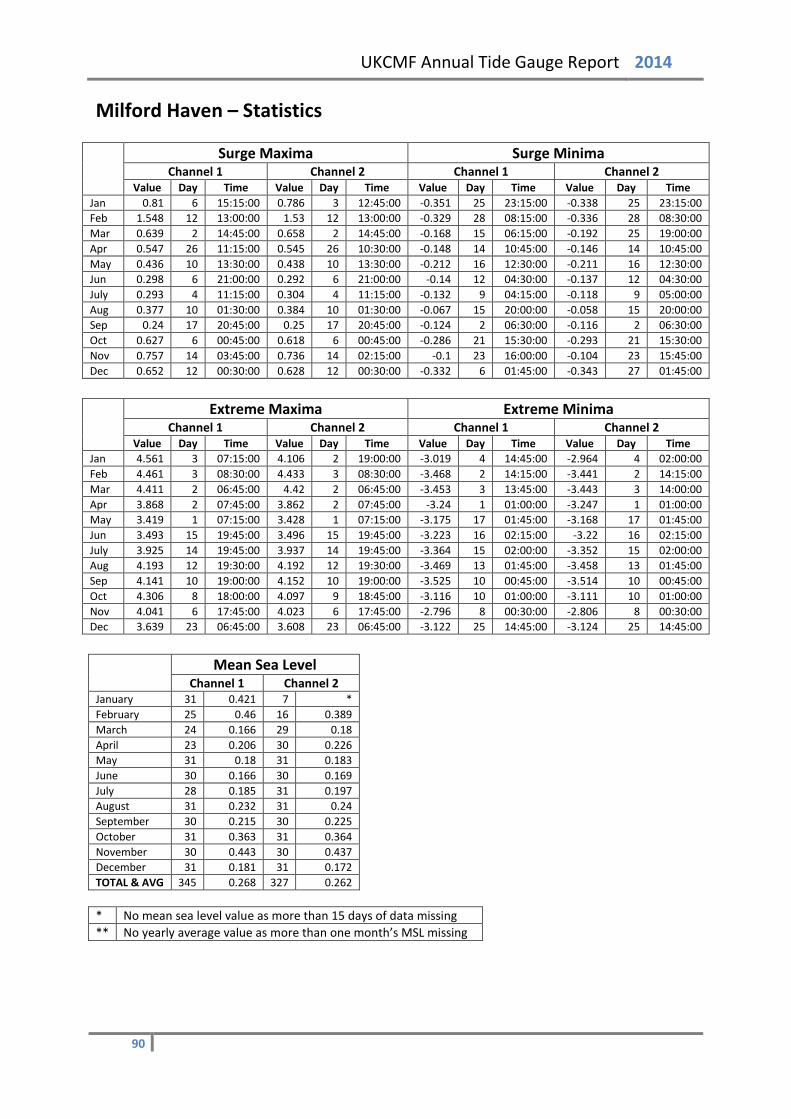
UKCMF Annual Tide Gauge Report 2014
Milford Haven – Statistics
Surge Maxima Surge Minima
Channel 1 Channel 2 Channel 1 Channel 2 Value Day Time Value Day Time Value Day Time Value Day Time
Jan 0.81 6 15:15:00 0.786 3 12:45:00 -0.351 25 23:15:00 -0.338 25 23:15:00 Feb 1.548 12 13:00:00 1.53 12 13:00:00 -0.329 28 08:15:00 -0.336 28 08:30:00 Mar 0.639 2 14:45:00 0.658 2 14:45:00 -0.168 15 06:15:00 -0.192 25 19:00:00 Apr 0.547 26 11:15:00 0.545 26 10:30:00 -0.148 14 10:45:00 -0.146 14 10:45:00 May 0.436 10 13:30:00 0.438 10 13:30:00 -0.212 16 12:30:00 -0.211 16 12:30:00 Jun 0.298 6 21:00:00 0.292 6 21:00:00 -0.14 12 04:30:00 -0.137 12 04:30:00 July 0.293 4 11:15:00 0.304 4 11:15:00 -0.132 9 04:15:00 -0.118 9 05:00:00 Aug 0.377 10 01:30:00 0.384 10 01:30:00 -0.067 15 20:00:00 -0.058 15 20:00:00 Sep 0.24 17 20:45:00 0.25 17 20:45:00 -0.124 2 06:30:00 -0.116 2 06:30:00 Oct 0.627 6 00:45:00 0.618 6 00:45:00 -0.286 21 15:30:00 -0.293 21 15:30:00 Nov 0.757 14 03:45:00 0.736 14 02:15:00 -0.1 23 16:00:00 -0.104 23 15:45:00 Dec 0.652 12 00:30:00 0.628 12 00:30:00 -0.332 6 01:45:00 -0.343 27 01:45:00
Extreme Maxima Extreme Minima
Channel 1 Channel 2 Channel 1 Channel 2 Value Day Time Value Day Time Value Day Time Value Day Time
Jan 4.561 3 07:15:00 4.106 2 19:00:00 -3.019 4 14:45:00 -2.964 4 02:00:00 Feb 4.461 3 08:30:00 4.433 3 08:30:00 -3.468 2 14:15:00 -3.441 2 14:15:00 Mar 4.411 2 06:45:00 4.42 2 06:45:00 -3.453 3 13:45:00 -3.443 3 14:00:00 Apr 3.868 2 07:45:00 3.862 2 07:45:00 -3.24 1 01:00:00 -3.247 1 01:00:00 May 3.419 1 07:15:00 3.428 1 07:15:00 -3.175 17 01:45:00 -3.168 17 01:45:00 Jun 3.493 15 19:45:00 3.496 15 19:45:00 -3.223 16 02:15:00 -3.22 16 02:15:00 July 3.925 14 19:45:00 3.937 14 19:45:00 -3.364 15 02:00:00 -3.352 15 02:00:00 Aug 4.193 12 19:30:00 4.192 12 19:30:00 -3.469 13 01:45:00 -3.458 13 01:45:00 Sep 4.141 10 19:00:00 4.152 10 19:00:00 -3.525 10 00:45:00 -3.514 10 00:45:00 Oct 4.306 8 18:00:00 4.097 9 18:45:00 -3.116 10 01:00:00 -3.111 10 01:00:00 Nov 4.041 6 17:45:00 4.023 6 17:45:00 -2.796 8 00:30:00 -2.806 8 00:30:00 Dec 3.639 23 06:45:00 3.608 23 06:45:00 -3.122 25 14:45:00 -3.124 25 14:45:00
Mean Sea Level
Channel 1 Channel 2 January 31 0.421 7 * February 25 0.46 16 0.389 March 24 0.166 29 0.18 April 23 0.206 30 0.226 May 31 0.18 31 0.183 June 30 0.166 30 0.169 July 28 0.185 31 0.197 August 31 0.232 31 0.24 September 30 0.215 30 0.225 October 31 0.363 31 0.364 November 30 0.443 30 0.437 December 31 0.181 31 0.172 TOTAL & AVG 345 0.268 327 0.262 * No mean sea level value as more than 15 days of data missing ** No yearly average value as more than one month’s MSL missing
90
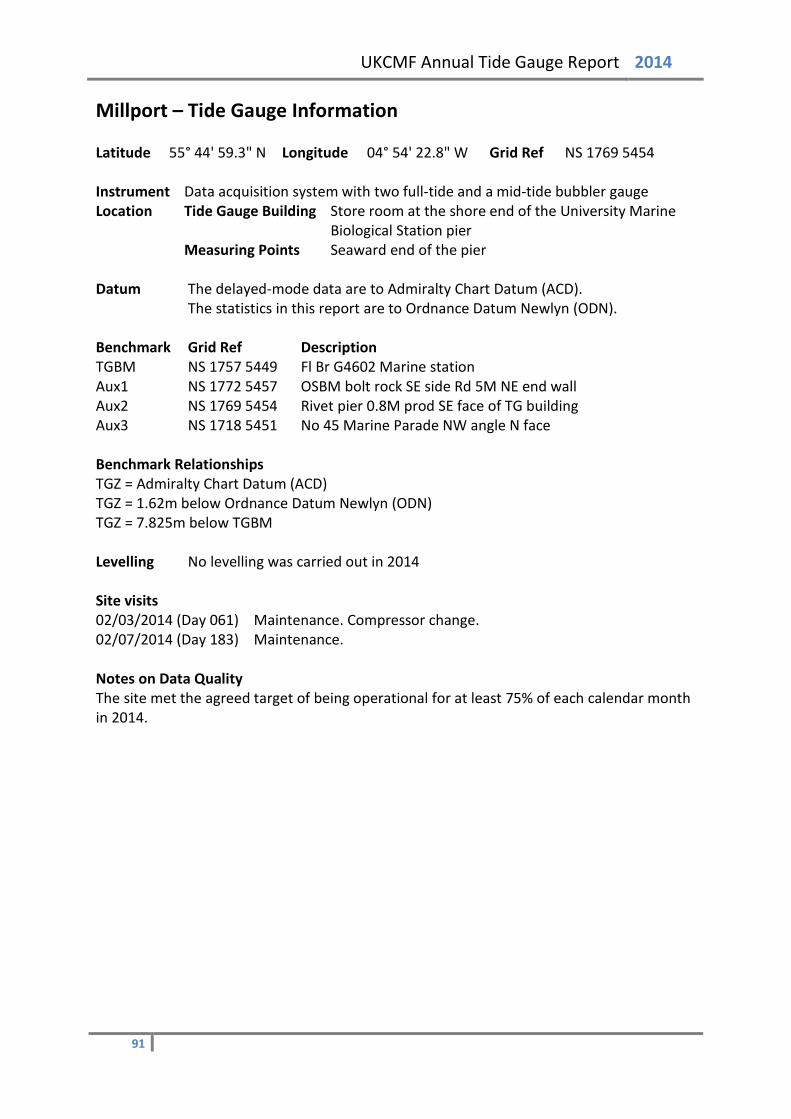
UKCMF Annual Tide Gauge Report 2014
Millport – Tide Gauge Information Latitude 55° 44' 59.3" N Longitude 04° 54' 22.8" W Grid Ref NS 1769 5454 Instrument Data acquisition system with two full-tide and a mid-tide bubbler gauge Location Tide Gauge Building Store room at the shore end of the University Marine
Biological Station pier Measuring Points Seaward end of the pier
Datum The delayed-mode data are to Admiralty Chart Datum (ACD).
The statistics in this report are to Ordnance Datum Newlyn (ODN). Benchmark Grid Ref Description TGBM NS 1757 5449 Fl Br G4602 Marine station Aux1 NS 1772 5457 OSBM bolt rock SE side Rd 5M NE end wall Aux2 NS 1769 5454 Rivet pier 0.8M prod SE face of TG building Aux3 NS 1718 5451 No 45 Marine Parade NW angle N face Benchmark Relationships TGZ = Admiralty Chart Datum (ACD) TGZ = 1.62m below Ordnance Datum Newlyn (ODN) TGZ = 7.825m below TGBM Levelling No levelling was carried out in 2014 Site visits 02/03/2014 (Day 061) Maintenance. Compressor change. 02/07/2014 (Day 183) Maintenance. Notes on Data Quality The site met the agreed target of being operational for at least 75% of each calendar month in 2014.
91
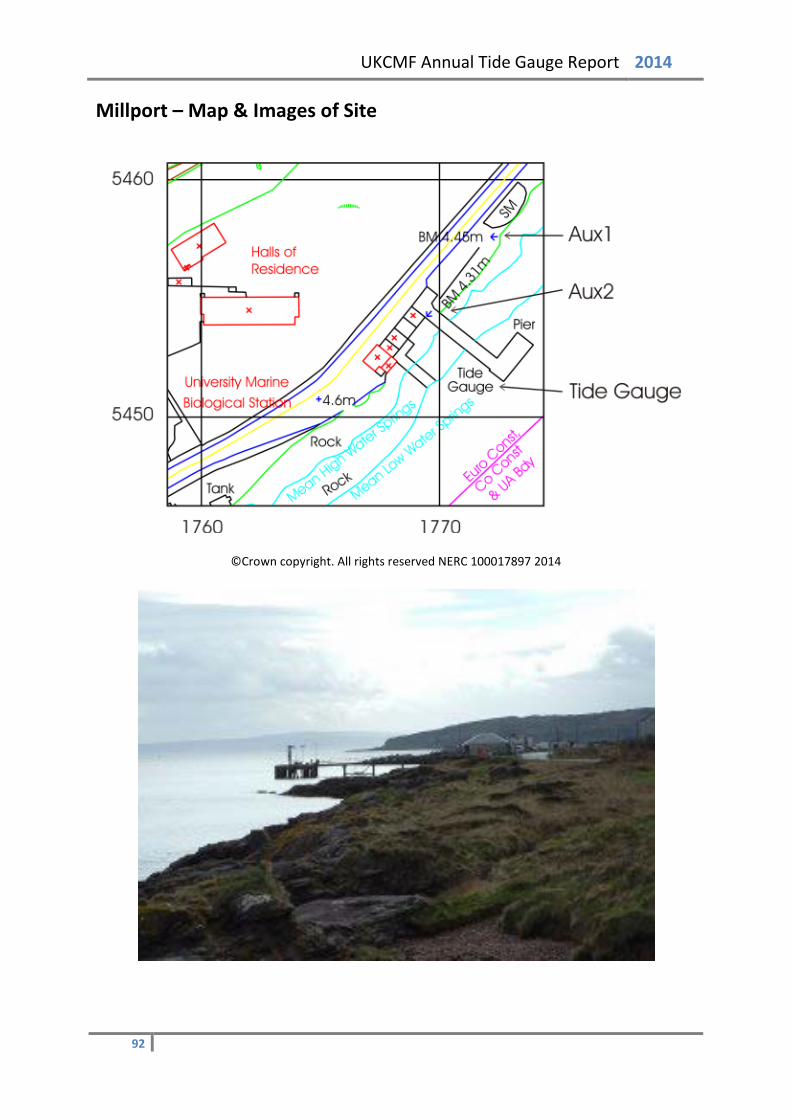
UKCMF Annual Tide Gauge Report 2014
Millport – Map & Images of Site
©Crown copyright. All rights reserved NERC 100017897 2014
92

UKCMF Annual Tide Gauge Report 2014
Millport – Statistics
Surge Maxima Surge Minima
Channel 1 Channel 2 Channel 1 Channel 2 Value Day Time Value Day Time Value Day Time Value Day Time
Jan 1.327 3 11:30:00 1.323 3 11:30:00 -0.274 26 03:45:00 -0.275 26 03:45:00 Feb 1.401 8 12:15:00 1.399 8 12:15:00 -0.338 28 12:00:00 -0.339 28 12:00:00 Mar 0.749 20 06:30:00 0.741 20 06:30:00 -0.368 25 23:00:00 -0.369 25 23:00:00 Apr 0.634 6 13:30:00 0.632 6 13:30:00 -0.287 14 11:30:00 -0.29 14 11:30:00 May 0.495 10 17:45:00 0.491 10 17:45:00 -0.285 23 20:45:00 -0.288 23 20:45:00 Jun 0.217 7 19:45:00 0.213 7 19:45:00 -0.225 15 14:00:00 -0.229 15 14:00:00 July 0.461 4 09:15:00 0.456 4 09:15:00 -0.277 9 10:30:00 -0.281 9 10:30:00 Aug 0.487 29 06:15:00 0.483 29 06:15:00 -0.238 18 06:15:00 -0.243 18 06:15:00 Sep 0.163 26 04:30:00 0.156 26 04:30:00 -0.219 1 13:15:00 -0.224 1 13:15:00 Oct 1.154 6 06:30:00 1.147 6 06:30:00 -0.443 21 19:45:00 -0.45 21 19:45:00 Nov 0.684 6 18:45:00 0.675 6 18:45:00 -0.206 21 00:00:00 -0.218 21 00:00:00 Dec 0.638 9 16:45:00 0.623 9 16:45:00 -0.607 28 04:45:00 -0.621 28 04:45:00
Extreme Maxima Extreme Minima
Channel 1 Channel 2 Channel 1 Channel 2 Value Day Time Value Day Time Value Day Time Value Day Time
Jan 3.187 3 13:15:00 3.183 3 13:15:00 -1.478 30 17:30:00 -1.479 30 17:30:00 Feb 2.828 3 14:30:00 2.825 3 14:30:00 -1.718 28 17:00:00 -1.719 28 17:00:00 Mar 2.399 20 14:45:00 2.391 20 14:45:00 -1.653 28 16:00:00 -1.654 28 16:00:00 Apr 1.952 5 03:30:00 1.951 5 03:30:00 -1.52 27 16:30:00 -1.523 27 16:30:00 May 1.954 18 02:15:00 1.949 18 02:15:00 -1.488 16 06:30:00 -1.492 16 06:30:00 Jun 1.84 2 02:45:00 1.836 2 02:45:00 -1.718 16 07:45:00 -1.723 16 07:45:00 July 2.069 16 02:45:00 2.065 16 02:45:00 -1.692 15 07:30:00 -1.695 15 07:30:00 Aug 2.167 13 01:45:00 2.162 13 01:45:00 -1.584 14 08:00:00 -1.59 14 08:00:00 Sep 2.017 11 01:30:00 2.012 11 01:30:00 -1.675 10 06:00:00 -1.68 10 06:00:00 Oct 2.32 9 00:15:00 2.312 9 00:15:00 -1.289 7 04:15:00 -1.295 7 04:15:00 Nov 2.565 7 00:00:00 2.558 7 00:00:00 -1.377 5 04:00:00 -1.383 5 04:00:00 Dec 2.496 9 13:45:00 2.486 9 13:45:00 -1.559 27 22:00:00 -1.574 27 22:00:00
Mean Sea Level
Channel 1 Channel 2 January 31 0.664 31 0.663 February 28 0.729 28 0.728 March 31 0.363 31 0.361 April 30 0.354 30 0.351 May 31 0.31 31 0.306 June 30 0.279 30 0.274 July 31 0.336 31 0.332 August 31 0.396 31 0.391 September 30 0.344 30 0.339 October 31 0.593 31 0.587 November 30 0.595 30 0.585 December 31 0.455 31 0.44 TOTAL & AVG 365 0.452 365 0.446 * No mean sea level value as more than 15 days of data missing ** No yearly average value as more than one month’s MSL missing
93
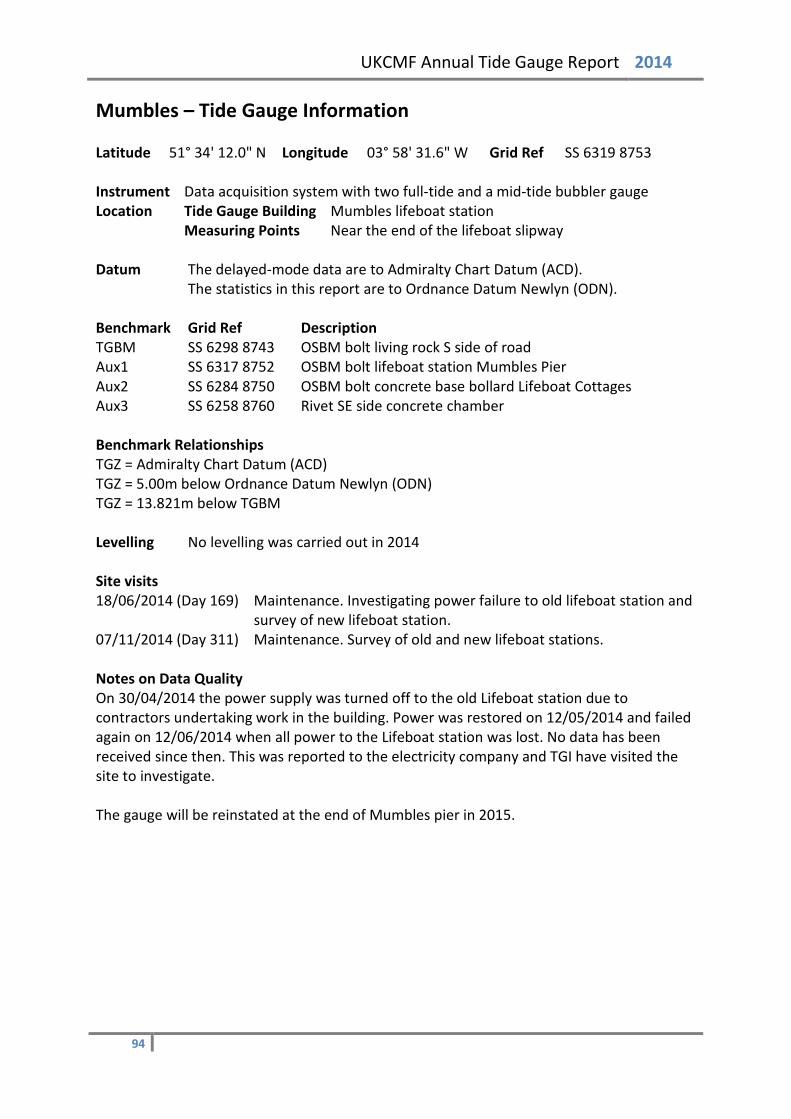
UKCMF Annual Tide Gauge Report 2014
Mumbles – Tide Gauge Information Latitude 51° 34' 12.0" N Longitude 03° 58' 31.6" W Grid Ref SS 6319 8753 Instrument Data acquisition system with two full-tide and a mid-tide bubbler gauge Location Tide Gauge Building Mumbles lifeboat station
Measuring Points Near the end of the lifeboat slipway Datum The delayed-mode data are to Admiralty Chart Datum (ACD).
The statistics in this report are to Ordnance Datum Newlyn (ODN). Benchmark Grid Ref Description TGBM SS 6298 8743 OSBM bolt living rock S side of road Aux1 SS 6317 8752 OSBM bolt lifeboat station Mumbles Pier Aux2 SS 6284 8750 OSBM bolt concrete base bollard Lifeboat Cottages Aux3 SS 6258 8760 Rivet SE side concrete chamber Benchmark Relationships TGZ = Admiralty Chart Datum (ACD) TGZ = 5.00m below Ordnance Datum Newlyn (ODN) TGZ = 13.821m below TGBM Levelling No levelling was carried out in 2014 Site visits 18/06/2014 (Day 169) Maintenance. Investigating power failure to old lifeboat station and
survey of new lifeboat station. 07/11/2014 (Day 311) Maintenance. Survey of old and new lifeboat stations. Notes on Data Quality On 30/04/2014 the power supply was turned off to the old Lifeboat station due to contractors undertaking work in the building. Power was restored on 12/05/2014 and failed again on 12/06/2014 when all power to the Lifeboat station was lost. No data has been received since then. This was reported to the electricity company and TGI have visited the site to investigate. The gauge will be reinstated at the end of Mumbles pier in 2015.
94
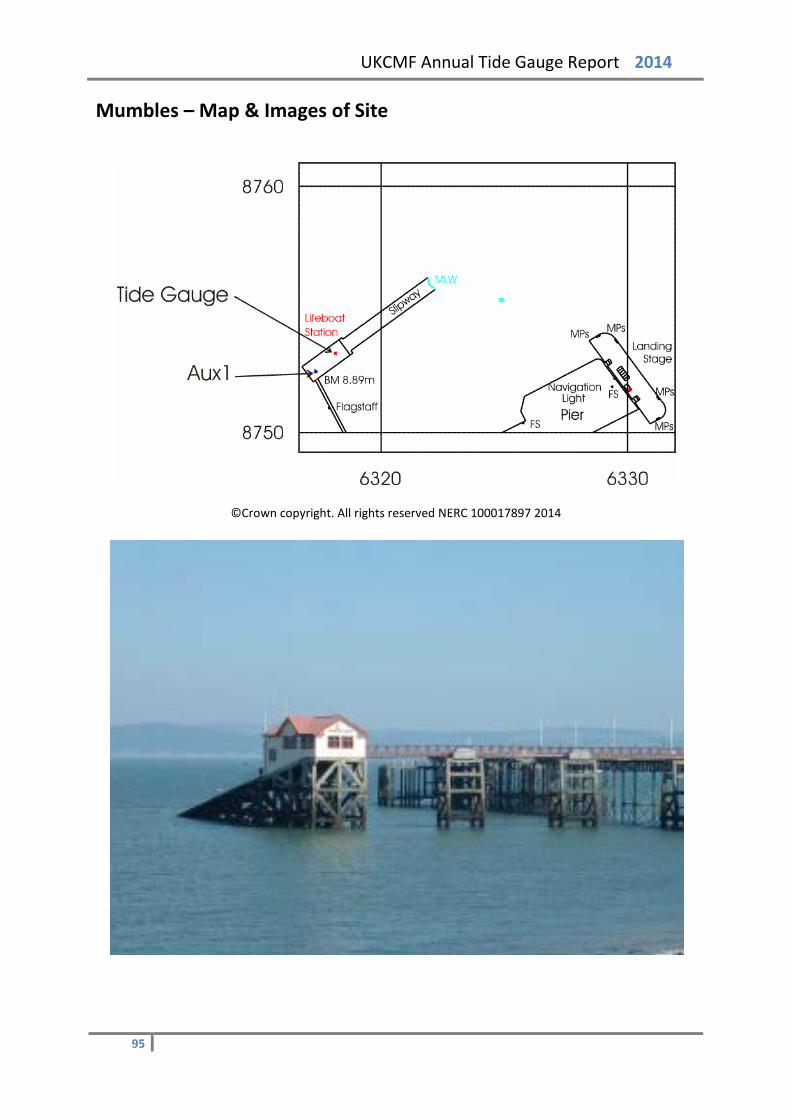
UKCMF Annual Tide Gauge Report 2014
Mumbles – Map & Images of Site
©Crown copyright. All rights reserved NERC 100017897 2014
95
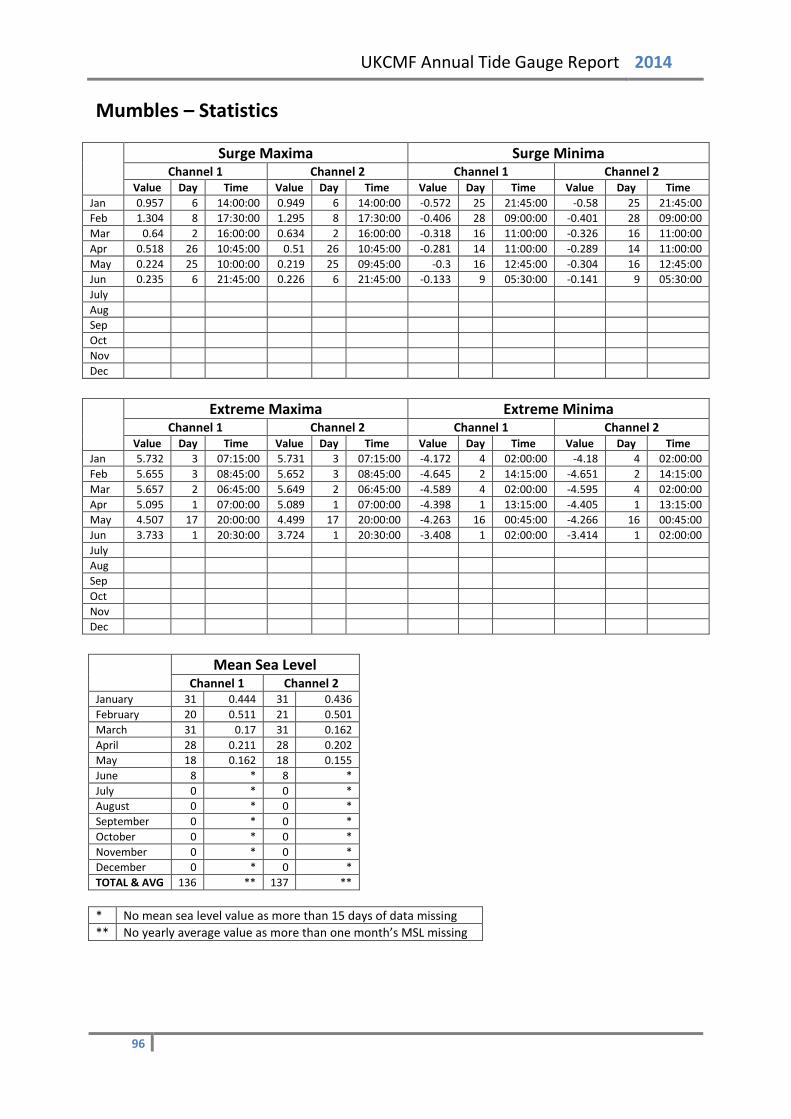
UKCMF Annual Tide Gauge Report 2014
Mumbles – Statistics
Surge Maxima Surge Minima
Channel 1 Channel 2 Channel 1 Channel 2 Value Day Time Value Day Time Value Day Time Value Day Time
Jan 0.957 6 14:00:00 0.949 6 14:00:00 -0.572 25 21:45:00 -0.58 25 21:45:00 Feb 1.304 8 17:30:00 1.295 8 17:30:00 -0.406 28 09:00:00 -0.401 28 09:00:00 Mar 0.64 2 16:00:00 0.634 2 16:00:00 -0.318 16 11:00:00 -0.326 16 11:00:00 Apr 0.518 26 10:45:00 0.51 26 10:45:00 -0.281 14 11:00:00 -0.289 14 11:00:00 May 0.224 25 10:00:00 0.219 25 09:45:00 -0.3 16 12:45:00 -0.304 16 12:45:00 Jun 0.235 6 21:45:00 0.226 6 21:45:00 -0.133 9 05:30:00 -0.141 9 05:30:00 July Aug Sep Oct Nov Dec
Extreme Maxima Extreme Minima
Channel 1 Channel 2 Channel 1 Channel 2 Value Day Time Value Day Time Value Day Time Value Day Time
Jan 5.732 3 07:15:00 5.731 3 07:15:00 -4.172 4 02:00:00 -4.18 4 02:00:00 Feb 5.655 3 08:45:00 5.652 3 08:45:00 -4.645 2 14:15:00 -4.651 2 14:15:00 Mar 5.657 2 06:45:00 5.649 2 06:45:00 -4.589 4 02:00:00 -4.595 4 02:00:00 Apr 5.095 1 07:00:00 5.089 1 07:00:00 -4.398 1 13:15:00 -4.405 1 13:15:00 May 4.507 17 20:00:00 4.499 17 20:00:00 -4.263 16 00:45:00 -4.266 16 00:45:00 Jun 3.733 1 20:30:00 3.724 1 20:30:00 -3.408 1 02:00:00 -3.414 1 02:00:00 July Aug Sep Oct Nov Dec
Mean Sea Level
Channel 1 Channel 2 January 31 0.444 31 0.436 February 20 0.511 21 0.501 March 31 0.17 31 0.162 April 28 0.211 28 0.202 May 18 0.162 18 0.155 June 8 * 8 * July 0 * 0 * August 0 * 0 * September 0 * 0 * October 0 * 0 * November 0 * 0 * December 0 * 0 * TOTAL & AVG 136 ** 137 ** * No mean sea level value as more than 15 days of data missing ** No yearly average value as more than one month’s MSL missing
96
UKCMF Annual Tide Gauge Report 2014
Newhaven – Tide Gauge Information Latitude 50° 46' 54.4" N Longitude 00° 03' 25.3" E Grid Ref TQ 4511 0004 Instrument Data acquisition system with two full-tide bubbler gauges Location Tide Gauge Building Within the Port Control building on West Pier
Measuring Points On the pier wall, south east of the Port Control building Datum The delayed-mode data are to Admiralty Chart Datum (ACD).
The statistics in this report are to Ordnance Datum Newlyn (ODN). Benchmark Grid Ref Description TGBM TQ 4510 0003 Bolt concrete 7.4M SW of SW angle of tower Aux1 TQ 4495 0001 OSBM bolt concrete sea wall 154.3M SW of tower Aux2 TQ 4503 0008 Steel ball Gun mount Benchmark Relationships TGZ = Admiralty Chart Datum (ACD) TGZ = 3.52m below Ordnance Datum Newlyn (ODN) TGZ = 8.783m below TGBM Levelling No levelling was carried out in 2014 Site visits No site visits were carried out in 2014 Notes on Data Quality The site met the agreed target of being operational for at least 75% of each calendar month in 2014.
97
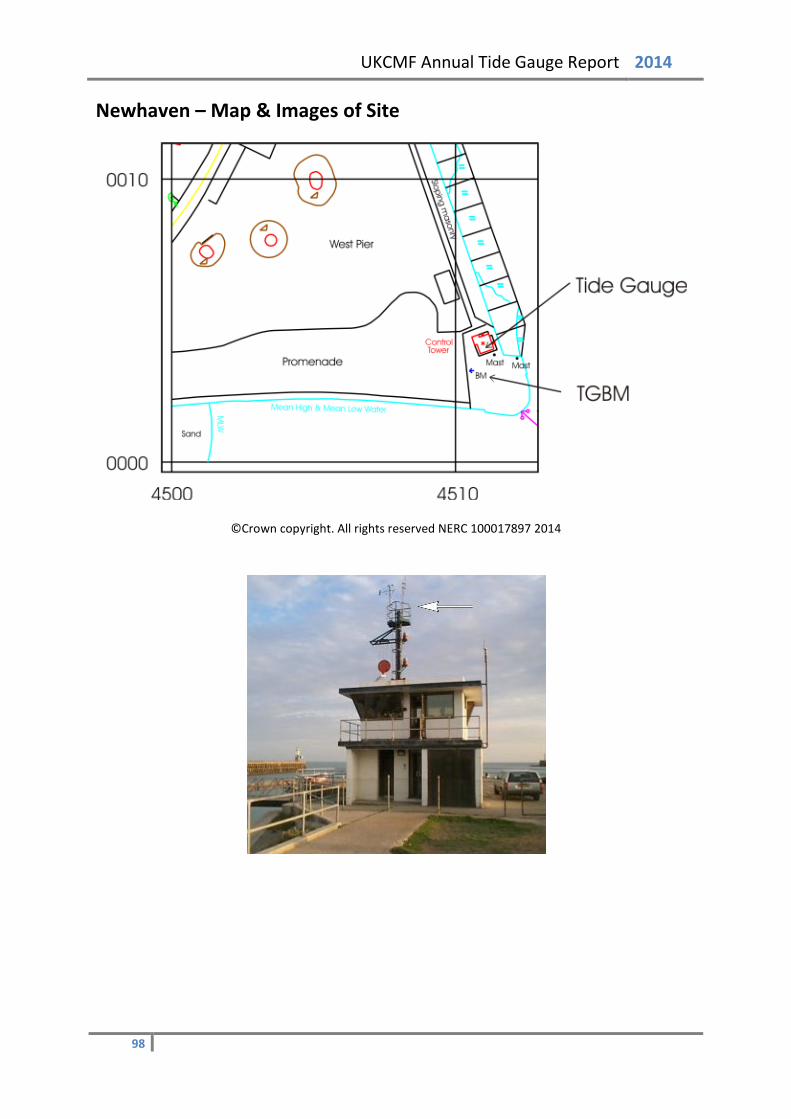
UKCMF Annual Tide Gauge Report 2014
Newhaven – Map & Images of Site
©Crown copyright. All rights reserved NERC 100017897 2014
98

UKCMF Annual Tide Gauge Report 2014
Newhaven – Statistics
Surge Maxima Surge Minima
Channel 1 Channel 2 Channel 1 Channel 2 Value Day Time Value Day Time Value Day Time Value Day Time
Jan 0.609 3 18:15:00 0.621 3 16:00:00 -0.436 25 05:45:00 -0.423 25 05:45:00 Feb 1.017 14 21:00:00 1.024 14 21:00:00 -0.492 15 11:15:00 -0.481 6 03:00:00 Mar 0.394 15 10:45:00 0.405 15 10:45:00 -0.436 8 22:45:00 -0.423 8 22:45:00 Apr 0.337 7 15:00:00 0.347 7 15:30:00 -0.289 16 06:15:00 -0.278 16 06:15:00 May 0.343 10 06:15:00 0.348 10 06:15:00 -0.299 15 09:15:00 -0.292 15 09:15:00 Jun 0.218 27 14:00:00 0.226 19 21:45:00 -0.241 17 12:00:00 -0.226 17 12:00:00 July 0.314 5 05:45:00 0.321 5 05:45:00 -0.229 16 12:00:00 -0.223 16 12:00:00 Aug 0.446 10 13:30:00 0.455 10 13:30:00 -0.192 16 13:00:00 -0.179 16 13:00:00 Sep 0.201 27 01:15:00 0.215 27 01:15:00 -0.251 12 11:00:00 -0.238 12 11:00:00 Oct 0.757 22 03:00:00 0.768 22 03:00:00 -0.248 22 20:30:00 -0.238 22 20:30:00 Nov 0.517 3 04:45:00 0.522 3 04:45:00 -0.142 25 10:15:00 -0.135 25 10:15:00 Dec 0.55 10 11:30:00 0.559 10 11:30:00 -0.588 10 01:00:00 -0.578 10 01:00:00
Extreme Maxima Extreme Minima
Channel 1 Channel 2 Channel 1 Channel 2 Value Day Time Value Day Time Value Day Time Value Day Time
Jan 3.813 5 01:45:00 3.828 5 01:45:00 -2.952 30 17:00:00 -2.942 30 17:00:00 Feb 3.713 3 01:15:00 3.729 3 01:15:00 -3.265 2 07:00:00 -3.26 2 07:00:00 Mar 3.785 3 00:00:00 3.795 3 00:00:00 -3.108 1 17:30:00 -3.101 1 17:30:00 Apr 3.563 1 00:00:00 3.574 1 00:00:00 -3.063 1 06:15:00 -3.052 1 06:15:00 May 3.326 1 00:00:00 3.338 1 00:00:00 -3.048 16 06:15:00 -3.039 16 06:15:00 Jun 3.282 15 00:00:00 3.292 15 00:00:00 -3.043 15 06:45:00 -3.034 15 06:45:00 July 3.523 14 12:30:00 3.53 14 12:30:00 -3.157 15 07:15:00 -3.145 15 07:15:00 Aug 3.757 13 13:00:00 3.766 13 13:00:00 -3.148 12 06:15:00 -3.138 12 06:15:00 Sep 3.653 11 12:30:00 3.664 11 12:30:00 -3.211 11 06:45:00 -3.204 11 06:45:00 Oct 3.837 9 11:30:00 3.851 9 11:30:00 -2.965 10 06:15:00 -2.953 10 06:15:00 Nov 3.663 8 11:45:00 3.672 8 11:45:00 -2.831 7 17:30:00 -2.821 7 17:30:00 Dec 3.408 25 13:15:00 3.42 25 13:15:00 -2.895 25 19:45:00 -2.887 25 19:45:00
Mean Sea Level
Channel 1 Channel 2 January 31 0.256 31 0.268 February 28 0.27 26 0.274 March 31 0.091 31 0.101 April 30 0.136 30 0.147 May 31 0.113 31 0.123 June 30 0.111 30 0.12 July 31 0.159 31 0.168 August 31 0.196 31 0.205 September 30 0.171 30 0.18 October 31 0.265 31 0.275 November 28 0.298 30 0.309 December 31 0.178 31 0.188 TOTAL & AVG 363 0.187 363 0.197 * No mean sea level value as more than 15 days of data missing ** No yearly average value as more than one month’s MSL missing
99
UKCMF Annual Tide Gauge Report 2014
Newlyn – Tide Gauge Information Latitude 50° 06' 10.8" N Longitude 05° 32' 34.2" W Grid Ref SW 4676 2856 Instrument Data acquisition system with a full-tide and mid-tide bubbler gauge and a
back-up potentiometer attached to a Munro float gauge Location Tide Gauge Building Tidal Observatory at the end of South Pier, next to the
lighthouse Measuring Points Seaward side of the pier, behind the lighthouse
Datum The delayed-mode data are to Admiralty Chart Datum (ACD).
The statistics in this report are to Ordnance Datum Newlyn (ODN). Benchmark Grid Ref Description TGBM SW 4677 2856 Brass bolt in the floor of the recorder hut. Aux1 SW 4673 2851 Flush Bracket 1565 on wall S pier NW face 17.8m SW Aux2 SW 4659 2841 F Bracket 1520 wall SE side of S Pier Rd NW face Benchmark Relationships TGZ = Admiralty Chart Datum (ACD) TGZ = 3.05m below Ordnance Datum Newlyn (ODN) TGZ = 7.801m below TGBM Levelling No levelling was carried out in 2014 Site visits 30/09/2014 (Day 273) Report of power failure and at the same time the float gauge
started recording a height of 5.5m. A fault on the main pier power cable caused earthing points to become live via standing water, the surge tracked down the float wire causing it to rupture at a weak point on the float. The gauge spun out of control causing damage to the mechanism. The gauge will need to be completely refurbished.
Notes on Data Quality The site met the agreed target of being operational for at least 75% of each calendar month in 2014.
100
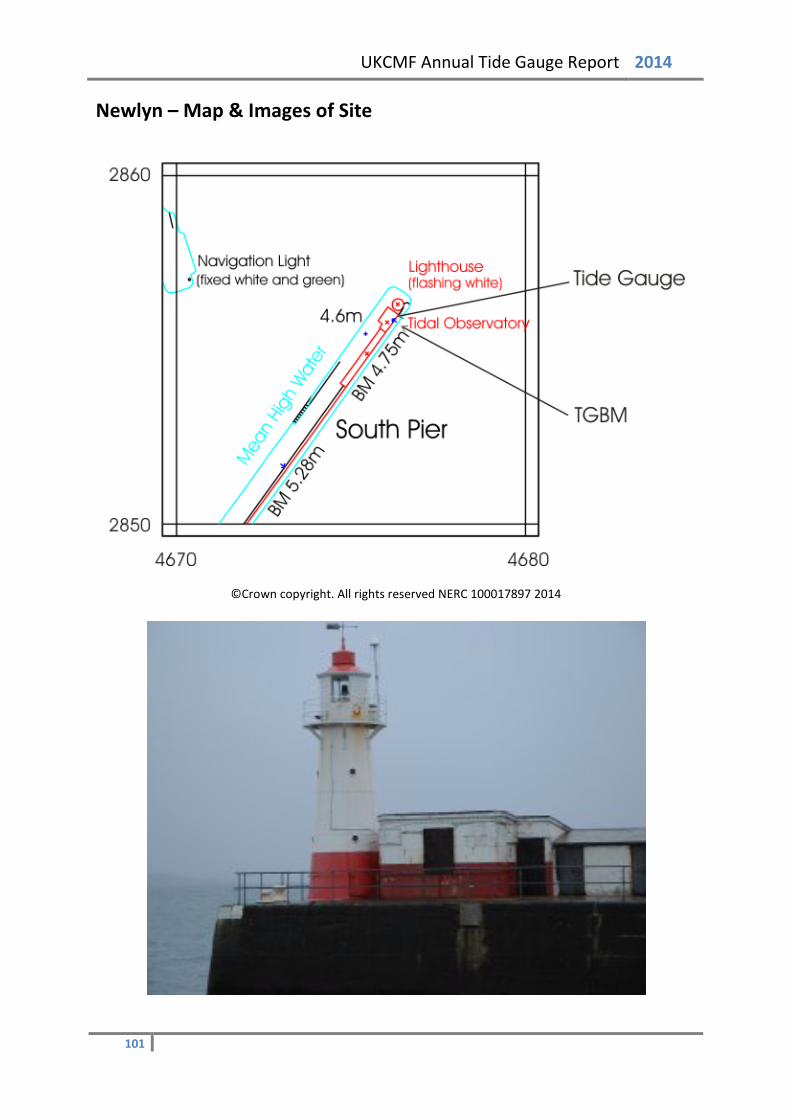
UKCMF Annual Tide Gauge Report 2014
Newlyn – Map & Images of Site
©Crown copyright. All rights reserved NERC 100017897 2014
101

UKCMF Annual Tide Gauge Report 2014
Newlyn – Statistics
Surge Maxima Surge Minima
Channel 1 Channel 2 Channel 1 Channel 2 Value Day Time Value Day Time Value Day Time Value Day Time
Jan 0.511 1 08:15:00 0.503 1 07:30:00 -0.293 25 16:00:00 -0.289 25 16:00:00 Feb 0.837 5 02:45:00 0.961 14 17:00:00 -0.194 9 10:45:00 -0.172 28 16:30:00 Mar 0.426 2 11:45:00 0.456 2 14:00:00 -0.255 15 00:30:00 -0.235 15 00:30:00 Apr 0.462 25 21:30:00 0.48 25 21:30:00 -0.138 14 06:30:00 -0.131 14 08:45:00 May 0.279 22 02:45:00 0.286 22 02:45:00 -0.243 15 14:15:00 -0.214 15 14:15:00 Jun 0.261 27 07:15:00 0.274 27 07:15:00 -0.185 12 03:00:00 -0.156 12 03:00:00 July 0.303 18 02:00:00 0.261 4 22:15:00 -0.114 9 01:00:00 -0.107 9 06:15:00 Aug 0.264 10 06:30:00 0.352 10 01:45:00 -0.08 11 04:15:00 -0.089 16 18:00:00 Sep 0.281 17 17:15:00 0.288 17 17:15:00 -0.063 1 14:15:00 -0.108 1 19:00:00 Oct 0.422 17 18:30:00 -0.248 21 16:15:00 Nov 0.642 14 00:30:00 -0.08 23 14:00:00 Dec 0.207 12 00:00:00 -0.376 10 06:00:00
Extreme Maxima Extreme Minima
Channel 1 Channel 2 Channel 1 Channel 2 Value Day Time Value Day Time Value Day Time Value Day Time
Jan 3.237 3 06:00:00 3.267 3 06:00:00 -2.376 3 13:00:00 -2.425 3 13:00:00 Feb 3.347 3 07:00:00 3.388 3 07:00:00 -2.729 2 13:15:00 -2.725 2 13:00:00 Mar 2.885 31 04:45:00 3.259 2 05:00:00 -2.768 4 00:45:00 -2.76 4 00:45:00 Apr 2.887 2 06:15:00 2.915 2 06:15:00 -2.486 1 00:00:00 -2.483 1 00:00:00 May 2.509 1 05:45:00 2.533 1 05:45:00 -2.487 17 00:30:00 -2.481 17 00:30:00 Jun 2.427 28 17:30:00 2.611 15 18:15:00 -2.473 15 00:15:00 -2.476 16 01:00:00 July 2.778 13 17:15:00 2.914 14 18:00:00 -2.575 15 01:00:00 -2.563 15 01:00:00 Aug 2.925 11 17:00:00 3.09 12 17:45:00 -2.64 13 00:45:00 -2.631 13 00:45:00 Sep 3.014 9 16:45:00 3.109 10 17:30:00 -2.642 9 23:30:00 -2.626 9 23:30:00 Oct 3.196 8 16:15:00 -2.371 9 23:45:00 Nov 3.031 6 16:00:00 -2.191 7 23:30:00 Dec 2.698 24 05:45:00 -2.422 25 13:45:00
Mean Sea Level
Channel 1 Channel 2 January 31 0.337 31 0.348 February 10 * 15 0.325 March 21 0.112 31 0.141 April 30 0.193 30 0.208 May 31 0.141 31 0.157 June 12 * 30 0.172 July 0 * 27 0.186 August 2 * 31 0.222 September 3 * 27 0.25 October 0 * 31 0.322 November 0 * 30 0.425 December 0 * 31 0.134 TOTAL & AVG 140 ** 345 0.241 * No mean sea level value as more than 15 days of data missing ** No yearly average value as more than one month’s MSL missing
102
UKCMF Annual Tide Gauge Report 2014
Newport – Tide Gauge Information Latitude 51° 33' 00.0" N Longitude 02° 59' 14.8" W Grid Ref ST 3163 8392 Instrument Data acquisition system with two full-tide and a mid-tide bubbler gauge Location Tide Gauge Building West side of the entrance to Newport Docks
Measuring Points Attached to the dock wall on the west side of the dock entrance, close to the lock gates
Datum The delayed-mode data are to Admiralty Chart Datum (ACD).
The statistics in this report are to Ordnance Datum Newlyn (ODN). Benchmark Grid Ref Description TGBM ST 3163 8392 Brass bolt adjacent to TG building Aux1 ST 3160 8414 Pin in quay west side of South Lock Aux2 ST 3160 8426 Pin in quay east side of South Lock Aux3 ST 3147 8427 Pin in quay south west corner of South Dock Benchmark Relationships TGZ = Admiralty Chart Datum (ACD) TGZ = 5.81m below Ordnance Datum Newlyn (ODN) TGZ = 14.525m below TGBM Levelling No levelling was carried out in 2014 Site visits 18/06/2014 (Day 169) Maintenance. Compressor change. Notes on Data Quality Channel 2 was ~40mm high and flagged, which was acceptable for monitoring extremes but was flagged as unacceptable for the purposes of long-term sea level monitoring. The backup channel was available throughout. The site met the agreed target of being operational for at least 75% of each calendar month in 2014.
103

UKCMF Annual Tide Gauge Report 2014
Newport – Map & Images of Site
©Crown copyright. All rights reserved NERC 100017897 2014
104
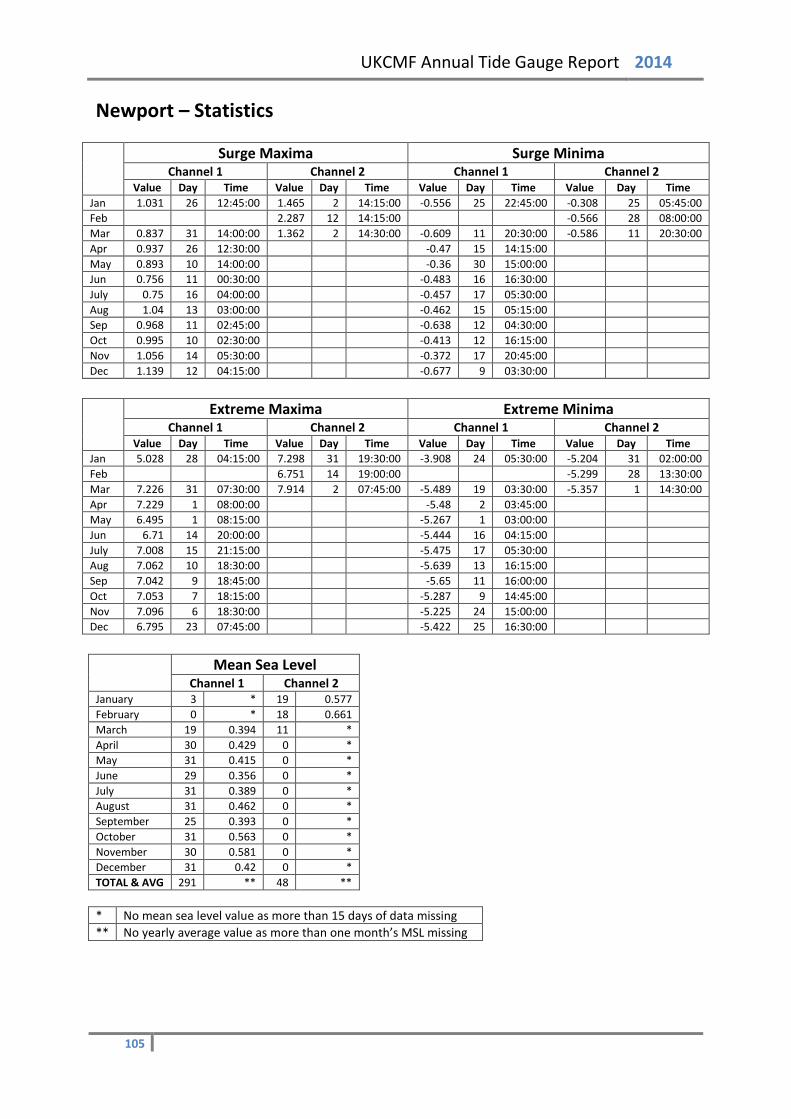
UKCMF Annual Tide Gauge Report 2014
Newport – Statistics
Surge Maxima Surge Minima
Channel 1 Channel 2 Channel 1 Channel 2 Value Day Time Value Day Time Value Day Time Value Day Time
Jan 1.031 26 12:45:00 1.465 2 14:15:00 -0.556 25 22:45:00 -0.308 25 05:45:00 Feb 2.287 12 14:15:00 -0.566 28 08:00:00 Mar 0.837 31 14:00:00 1.362 2 14:30:00 -0.609 11 20:30:00 -0.586 11 20:30:00 Apr 0.937 26 12:30:00 -0.47 15 14:15:00 May 0.893 10 14:00:00 -0.36 30 15:00:00 Jun 0.756 11 00:30:00 -0.483 16 16:30:00 July 0.75 16 04:00:00 -0.457 17 05:30:00 Aug 1.04 13 03:00:00 -0.462 15 05:15:00 Sep 0.968 11 02:45:00 -0.638 12 04:30:00 Oct 0.995 10 02:30:00 -0.413 12 16:15:00 Nov 1.056 14 05:30:00 -0.372 17 20:45:00 Dec 1.139 12 04:15:00 -0.677 9 03:30:00
Extreme Maxima Extreme Minima
Channel 1 Channel 2 Channel 1 Channel 2 Value Day Time Value Day Time Value Day Time Value Day Time
Jan 5.028 28 04:15:00 7.298 31 19:30:00 -3.908 24 05:30:00 -5.204 31 02:00:00 Feb 6.751 14 19:00:00 -5.299 28 13:30:00 Mar 7.226 31 07:30:00 7.914 2 07:45:00 -5.489 19 03:30:00 -5.357 1 14:30:00 Apr 7.229 1 08:00:00 -5.48 2 03:45:00 May 6.495 1 08:15:00 -5.267 1 03:00:00 Jun 6.71 14 20:00:00 -5.444 16 04:15:00 July 7.008 15 21:15:00 -5.475 17 05:30:00 Aug 7.062 10 18:30:00 -5.639 13 16:15:00 Sep 7.042 9 18:45:00 -5.65 11 16:00:00 Oct 7.053 7 18:15:00 -5.287 9 14:45:00 Nov 7.096 6 18:30:00 -5.225 24 15:00:00 Dec 6.795 23 07:45:00 -5.422 25 16:30:00
Mean Sea Level
Channel 1 Channel 2 January 3 * 19 0.577 February 0 * 18 0.661 March 19 0.394 11 * April 30 0.429 0 * May 31 0.415 0 * June 29 0.356 0 * July 31 0.389 0 * August 31 0.462 0 * September 25 0.393 0 * October 31 0.563 0 * November 30 0.581 0 * December 31 0.42 0 * TOTAL & AVG 291 ** 48 ** * No mean sea level value as more than 15 days of data missing ** No yearly average value as more than one month’s MSL missing
105
UKCMF Annual Tide Gauge Report 2014
North Shields – Tide Gauge Information Latitude 55° 00' 26.8" N Longitude 01° 26' 23.2" W Grid Ref NZ 3592 6823 Instrument Data acquisition system with two full-tide and a mid-tide bubbler gauge Location Tide Gauge Building North side of the River Tyne, close to the Port of Tyne
Authority offices Measuring Points As above
Datum The delayed-mode data are to Admiralty Chart Datum (ACD).
The statistics in this report are to Ordnance Datum Newlyn (ODN). Benchmark Grid Ref Description TGBM NZ 3592 6823 Bolt adjacent to tide gauge building Aux1 NZ 3626 6842 PA Bolt low lighthouse W face SW angle Aux2 NZ 3630 6895 PA Bolt butt N side railway Benchmark Relationships TGZ = Admiralty Chart Datum (ACD) TGZ = 2.60m below Ordnance Datum Newlyn (ODN) TGZ = 6.754m below TGBM Levelling No levelling was carried out in 2014 Site visits 15/05/2014 (Day 135) Maintenance. Meeting with electrical inspectors at site. Notes on Data Quality The site met the agreed target of being operational for at least 75% of each calendar month in 2014.
106
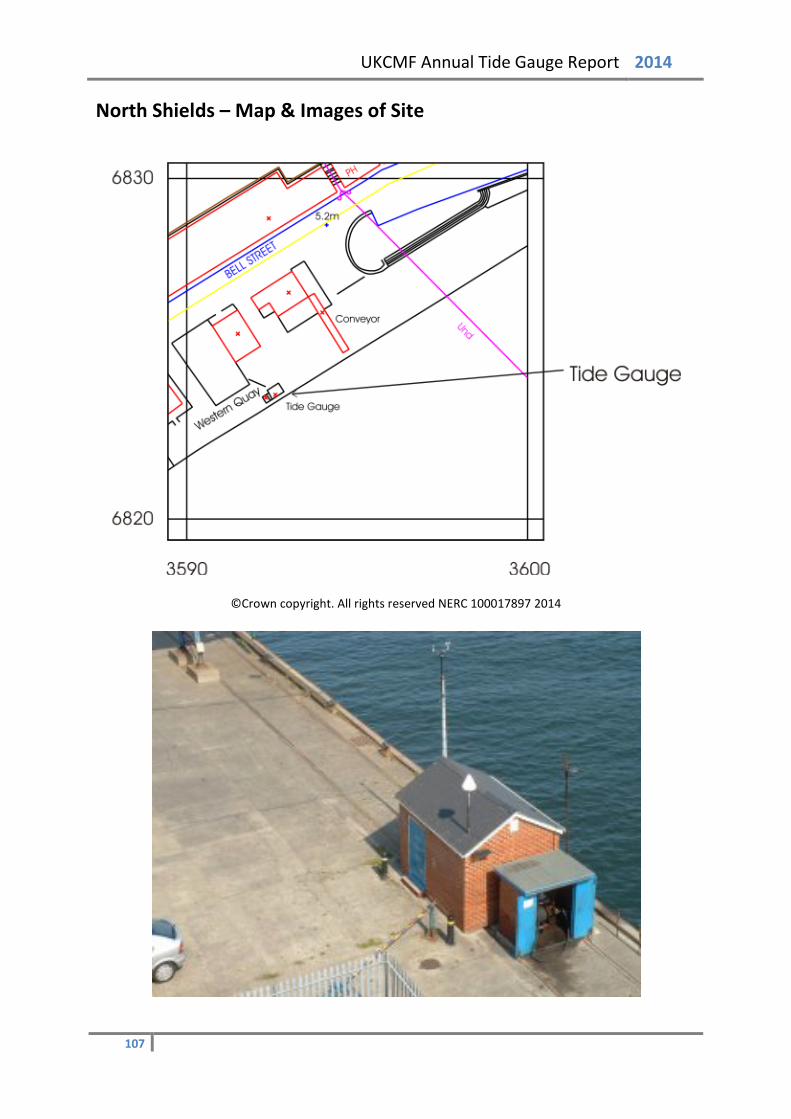
UKCMF Annual Tide Gauge Report 2014
North Shields – Map & Images of Site
©Crown copyright. All rights reserved NERC 100017897 2014
107

UKCMF Annual Tide Gauge Report 2014
North Shields – Statistics
Surge Maxima Surge Minima
Channel 1 Channel 2 Channel 1 Channel 2 Value Day Time Value Day Time Value Day Time Value Day Time
Jan 0.58 4 13:30:00 0.573 4 13:30:00 -0.731 24 21:00:00 -0.739 24 21:00:00 Feb 0.449 24 06:45:00 0.44 24 06:45:00 -0.604 13 00:00:00 -0.611 13 00:00:00 Mar 0.817 14 23:30:00 0.806 14 23:30:00 -0.611 8 15:30:00 -0.621 8 15:30:00 Apr 0.483 12 23:15:00 0.474 12 23:15:00 -0.24 15 19:15:00 -0.236 15 20:15:00 May 0.354 6 19:45:00 0.319 11 12:15:00 -0.234 14 19:15:00 -0.235 14 19:15:00 Jun 0.263 19 05:30:00 0.263 19 06:00:00 -0.153 17 09:00:00 -0.15 17 09:00:00 July 0.331 5 01:45:00 0.331 5 01:45:00 -0.143 16 17:15:00 -0.142 16 17:15:00 Aug 0.368 9 22:00:00 0.369 9 22:00:00 -0.244 3 18:30:00 -0.243 3 18:30:00 Sep 0.475 26 12:00:00 0.478 26 12:00:00 -0.194 13 17:30:00 -0.193 13 17:30:00 Oct 0.929 21 18:45:00 0.931 21 18:45:00 -0.276 22 16:30:00 -0.275 22 16:30:00 Nov 0.33 2 19:00:00 0.333 2 19:00:00 -0.316 6 17:15:00 -0.313 6 17:15:00 Dec 0.731 10 02:30:00 0.734 10 02:30:00 -0.805 9 16:15:00 -0.802 9 16:15:00
Extreme Maxima Extreme Minima
Channel 1 Channel 2 Channel 1 Channel 2 Value Day Time Value Day Time Value Day Time Value Day Time
Jan 3.32 4 17:15:00 3.315 4 17:15:00 -2.755 31 22:15:00 -2.762 31 22:15:00 Feb 3.086 2 17:00:00 3.079 2 17:00:00 -2.678 1 23:00:00 -2.683 1 23:00:00 Mar 3.028 2 16:00:00 3.02 2 16:00:00 -2.46 1 22:00:00 -2.469 1 22:00:00 Apr 2.818 1 16:30:00 2.809 1 16:30:00 -2.159 15 21:45:00 -2.159 15 22:00:00 May 2.574 17 04:45:00 2.565 17 04:45:00 -2.083 14 21:30:00 -2.089 14 21:30:00 Jun 2.606 16 05:15:00 2.608 16 05:15:00 -2.232 15 11:00:00 -2.232 15 11:00:00 July 2.915 15 05:00:00 2.917 15 05:00:00 -2.357 16 12:30:00 -2.355 16 12:30:00 Aug 3.13 13 04:30:00 3.132 13 04:30:00 -2.465 12 10:30:00 -2.462 12 10:30:00 Sep 3.08 10 03:30:00 3.082 10 03:30:00 -2.514 11 11:00:00 -2.511 11 11:00:00 Oct 3.177 10 04:00:00 3.179 10 04:00:00 -2.152 9 09:45:00 -2.15 9 09:45:00 Nov 2.922 8 03:45:00 2.925 8 03:45:00 -2.063 6 09:00:00 -2.059 6 09:00:00 Dec 2.935 23 16:00:00 2.939 23 16:00:00 -2.182 26 00:15:00 -2.179 26 00:15:00
Mean Sea Level
Channel 1 Channel 2 January 29 0.391 31 0.373 February 28 0.42 28 0.412 March 31 0.334 31 0.325 April 30 0.341 26 0.331 May 31 0.309 24 0.274 June 30 0.322 30 0.32 July 31 0.364 31 0.366 August 31 0.394 31 0.396 September 30 0.388 30 0.39 October 31 0.507 31 0.509 November 30 0.459 30 0.462 December 31 0.459 31 0.463 TOTAL & AVG 363 0.391 354 0.385 * No mean sea level value as more than 15 days of data missing ** No yearly average value as more than one month’s MSL missing
108
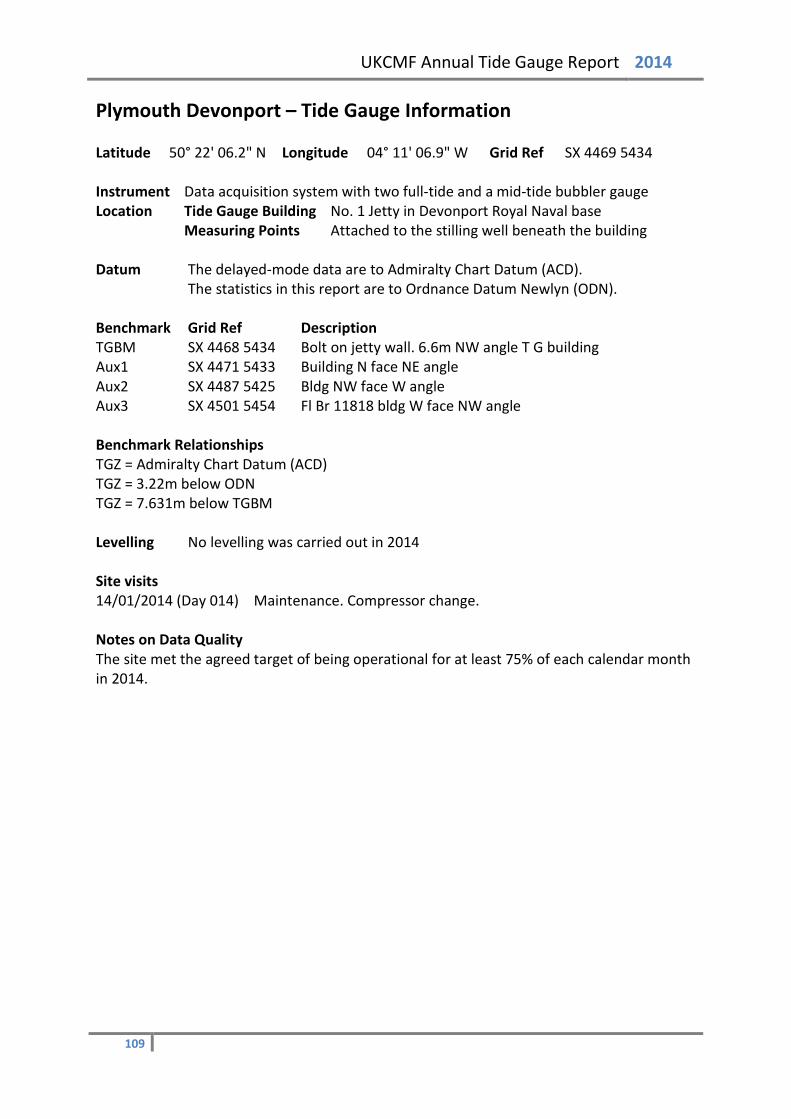
UKCMF Annual Tide Gauge Report 2014
Plymouth Devonport – Tide Gauge Information Latitude 50° 22' 06.2" N Longitude 04° 11' 06.9" W Grid Ref SX 4469 5434 Instrument Data acquisition system with two full-tide and a mid-tide bubbler gauge Location Tide Gauge Building No. 1 Jetty in Devonport Royal Naval base
Measuring Points Attached to the stilling well beneath the building Datum The delayed-mode data are to Admiralty Chart Datum (ACD).
The statistics in this report are to Ordnance Datum Newlyn (ODN). Benchmark Grid Ref Description TGBM SX 4468 5434 Bolt on jetty wall. 6.6m NW angle T G building Aux1 SX 4471 5433 Building N face NE angle Aux2 SX 4487 5425 Bldg NW face W angle Aux3 SX 4501 5454 Fl Br 11818 bldg W face NW angle Benchmark Relationships TGZ = Admiralty Chart Datum (ACD) TGZ = 3.22m below ODN TGZ = 7.631m below TGBM Levelling No levelling was carried out in 2014 Site visits 14/01/2014 (Day 014) Maintenance. Compressor change. Notes on Data Quality The site met the agreed target of being operational for at least 75% of each calendar month in 2014.
109
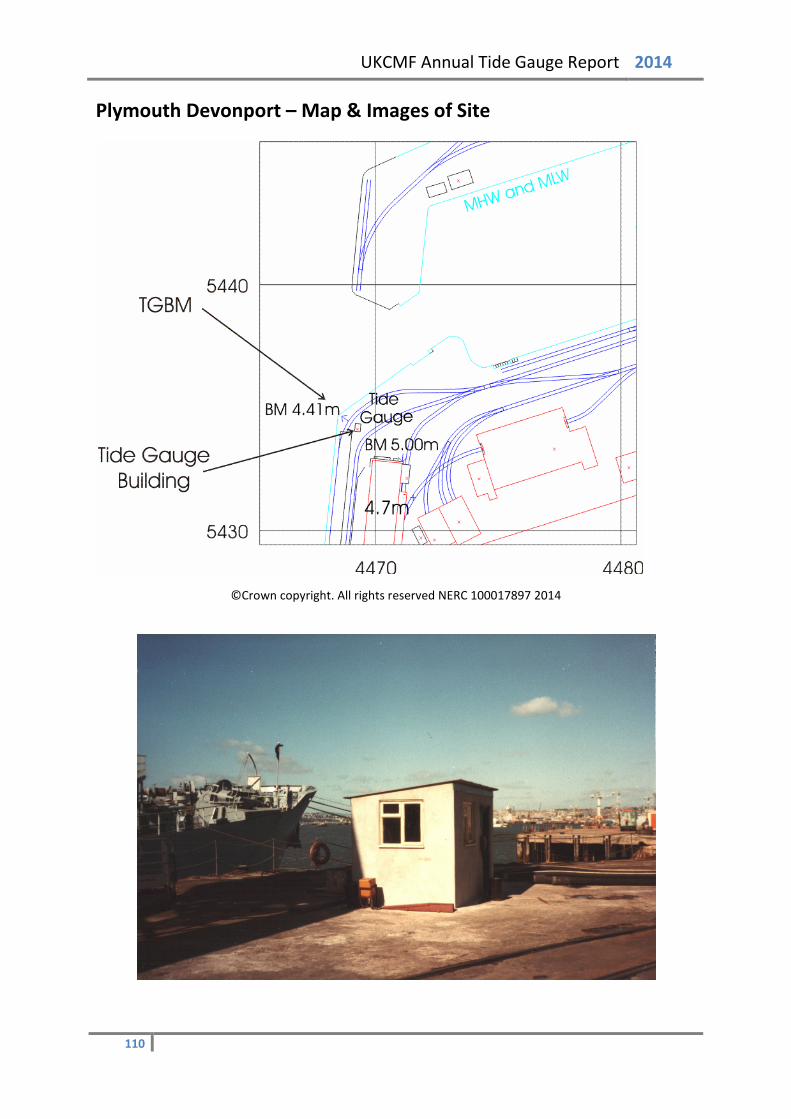
UKCMF Annual Tide Gauge Report 2014
Plymouth Devonport – Map & Images of Site
©Crown copyright. All rights reserved NERC 100017897 2014
110

UKCMF Annual Tide Gauge Report 2014
Plymouth Devonport – Statistics
Surge Maxima Surge Minima
Channel 1 Channel 2 Channel 1 Channel 2 Value Day Time Value Day Time Value Day Time Value Day Time
Jan 0.637 1 13:00:00 0.629 1 13:00:00 -0.274 25 09:15:00 -0.279 25 09:15:00 Feb 1.087 14 17:45:00 1.082 14 17:45:00 -0.191 28 17:15:00 -0.195 28 17:15:00 Mar 0.434 2 15:45:00 0.425 2 15:45:00 -0.258 15 00:15:00 -0.262 15 00:15:00 Apr 0.453 26 10:15:00 0.447 26 10:15:00 -0.161 16 02:00:00 -0.166 16 02:00:00 May 0.283 22 02:45:00 0.28 22 02:45:00 -0.24 15 10:00:00 -0.246 15 15:00:00 Jun 0.257 27 06:15:00 0.255 27 06:15:00 -0.19 17 08:00:00 -0.195 17 08:00:00 July 0.301 18 01:15:00 0.297 18 01:15:00 -0.125 17 08:45:00 -0.131 17 08:45:00 Aug 0.356 10 08:30:00 0.352 10 08:30:00 -0.088 16 18:30:00 -0.096 16 18:30:00 Sep 0.26 19 01:45:00 0.257 19 01:45:00 -0.137 1 18:45:00 -0.142 1 18:45:00 Oct 0.458 8 21:30:00 0.453 8 21:30:00 -0.262 21 14:45:00 -0.267 21 14:45:00 Nov 0.784 13 11:00:00 0.78 13 11:00:00 -0.095 23 15:00:00 -0.105 23 15:00:00 Dec 0.281 12 02:45:00 0.276 12 02:45:00 -0.393 10 05:15:00 -0.399 10 05:15:00
Extreme Maxima Extreme Minima
Channel 1 Channel 2 Channel 1 Channel 2 Value Day Time Value Day Time Value Day Time Value Day Time
Jan 3.112 3 06:45:00 3.106 3 06:45:00 -2.423 3 13:00:00 -2.433 3 13:15:00 Feb 3.154 3 08:15:00 3.149 3 08:15:00 -2.913 2 13:45:00 -2.92 2 13:45:00 Mar 3.077 3 07:00:00 3.069 3 07:00:00 -2.914 4 01:45:00 -2.921 4 01:45:00 Apr 2.688 2 07:15:00 2.681 2 07:15:00 -2.74 1 00:45:00 -2.745 1 00:45:00 May 2.338 1 07:00:00 2.334 1 07:00:00 -2.729 17 01:15:00 -2.733 17 01:15:00 Jun 2.42 14 18:45:00 2.414 14 18:45:00 -2.696 16 01:45:00 -2.7 16 01:45:00 July 2.681 14 19:15:00 2.673 14 19:15:00 -2.809 15 01:45:00 -2.814 15 01:45:00 Aug 2.856 12 19:00:00 2.846 12 19:00:00 -2.886 13 01:30:00 -2.891 13 01:30:00 Sep 2.826 10 18:45:00 2.816 10 18:45:00 -2.927 11 01:15:00 -2.932 11 01:15:00 Oct 2.999 8 17:45:00 2.989 8 17:45:00 -2.63 10 00:45:00 -2.634 10 00:45:00 Nov 2.835 6 17:15:00 2.825 6 17:15:00 -2.379 8 00:15:00 -2.384 8 00:15:00 Dec 2.533 24 07:00:00 2.524 24 07:00:00 -2.604 24 13:15:00 -2.608 24 13:15:00
Mean Sea Level
Channel 1 Channel 2 January 31 0.393 31 0.387 February 19 0.341 17 0.326 March 31 0.158 31 0.153 April 30 0.213 30 0.208 May 31 0.17 31 0.166 June 30 0.175 30 0.171 July 31 0.196 31 0.191 August 31 0.23 31 0.226 September 30 0.238 30 0.234 October 31 0.331 31 0.326 November 30 0.435 30 0.43 December 31 0.167 31 0.163 TOTAL & AVG 356 0.254 354 0.248 * No mean sea level value as more than 15 days of data missing ** No yearly average value as more than one month’s MSL missing
111
UKCMF Annual Tide Gauge Report 2014
Portpatrick – Tide Gauge Information Latitude 54° 50' 33.2" N Longitude 05° 07' 12.1" W Grid Ref NW 9976 5421 Instrument Data acquisition system with a full-tide bubbler gauge and a potentiometer
attached to a Munro float gauge Location Tide Gauge Building The western corner of Portpatrick harbour
Measuring Points The stilling well is directly underneath the tide gauge building
Datum The delayed-mode data are to Admiralty Chart Datum (ACD).
The statistics in this report are to Ordnance Datum Newlyn (ODN). Benchmark Grid Ref Description TGBM NW 9976 5421 Bolt Harbour wall 13.84M NE angle of building Aux1 NW 9977 5411 Rivet E side of Jetty wall 16.6M SE angle Lifeboat HQ Aux2 NW 9995 5412 Rivet S angle No 53 Main St Aux3 NX 0006 5423 Church hall SE side of Rd W angle Benchmark Relationships TGZ = Admiralty Chart Datum (ACD) TGZ = 1.80m below Ordnance Datum Newlyn (ODN) TGZ = 6.827m below TGBM Levelling No levelling was carried out in 2014 Site visits 01/03/2014 (Day 060) Maintenance. Levelling. Compressor change. Calibration of the float
gauge. 03/03/2014 (Day 062) Repair of faulty flow regulator. Notes on Data Quality Channel 1 was ~70mm low and has been flagged. TGI were on site in March to calibrate the float gauge. The site met the agreed target of being operational for at least 75% of each calendar month in 2014.
112
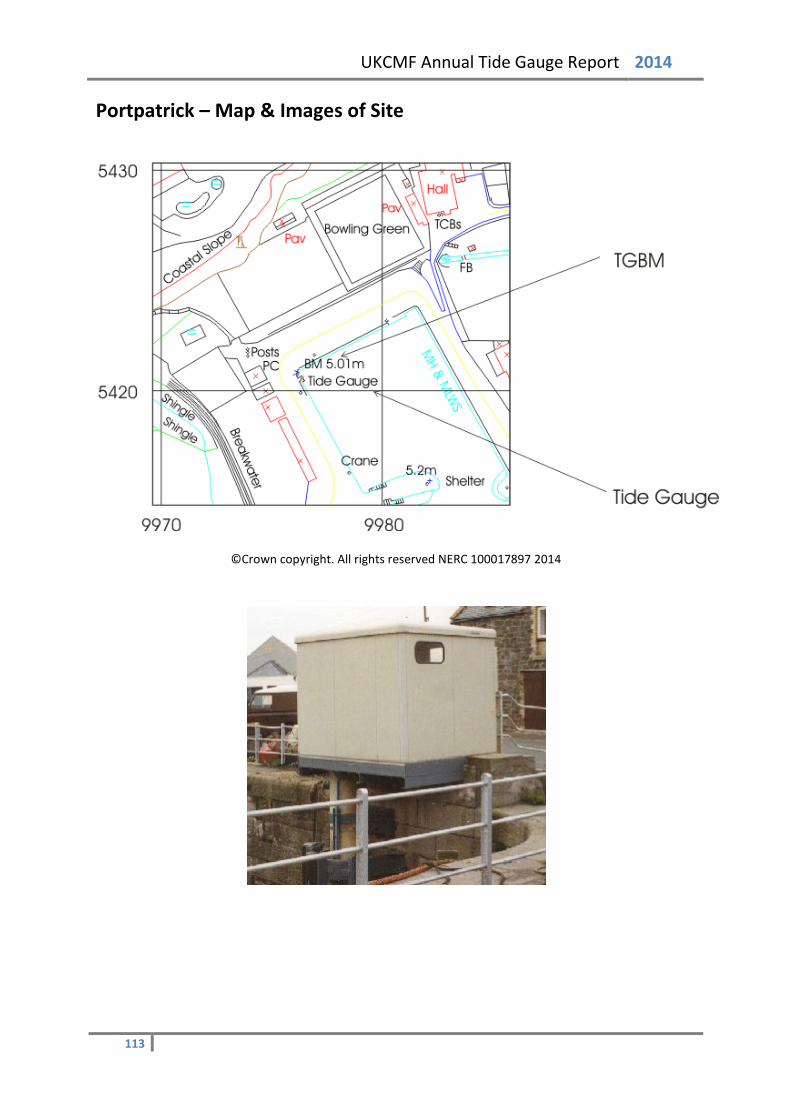
UKCMF Annual Tide Gauge Report 2014
Portpatrick – Map & Images of Site
©Crown copyright. All rights reserved NERC 100017897 2014
113
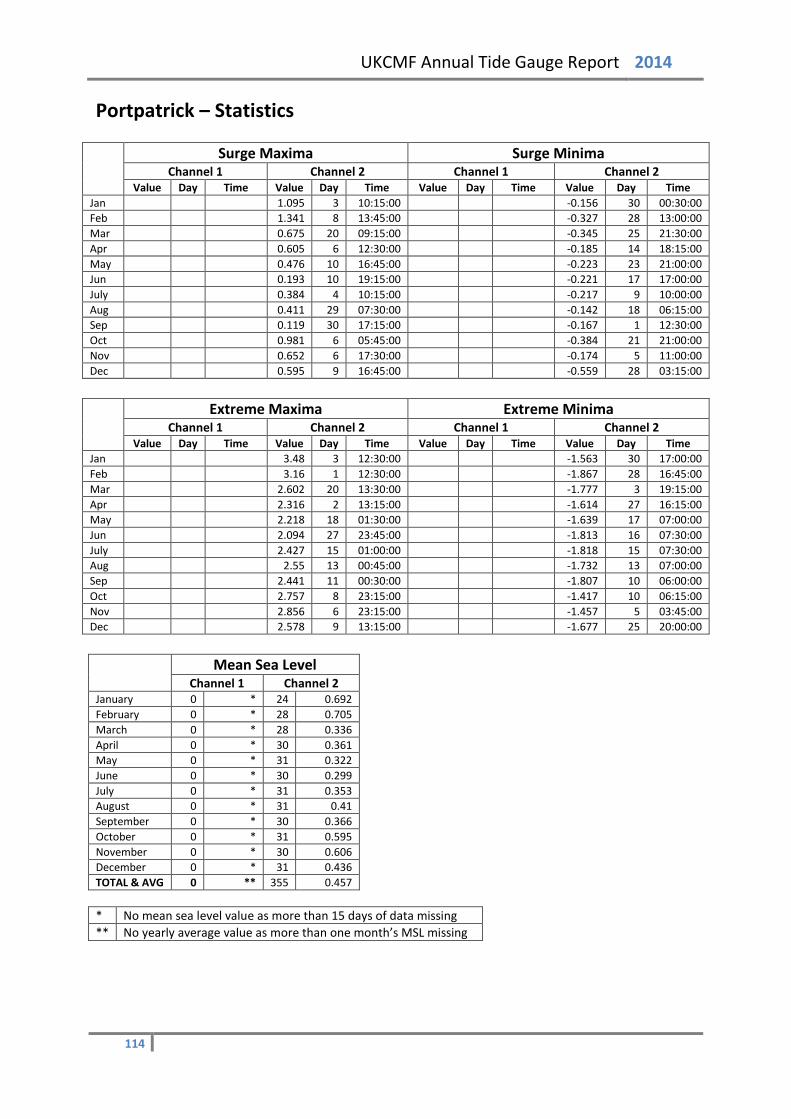
UKCMF Annual Tide Gauge Report 2014
Portpatrick – Statistics
Surge Maxima Surge Minima
Channel 1 Channel 2 Channel 1 Channel 2 Value Day Time Value Day Time Value Day Time Value Day Time
Jan 1.095 3 10:15:00 -0.156 30 00:30:00 Feb 1.341 8 13:45:00 -0.327 28 13:00:00 Mar 0.675 20 09:15:00 -0.345 25 21:30:00 Apr 0.605 6 12:30:00 -0.185 14 18:15:00 May 0.476 10 16:45:00 -0.223 23 21:00:00 Jun 0.193 10 19:15:00 -0.221 17 17:00:00 July 0.384 4 10:15:00 -0.217 9 10:00:00 Aug 0.411 29 07:30:00 -0.142 18 06:15:00 Sep 0.119 30 17:15:00 -0.167 1 12:30:00 Oct 0.981 6 05:45:00 -0.384 21 21:00:00 Nov 0.652 6 17:30:00 -0.174 5 11:00:00 Dec 0.595 9 16:45:00 -0.559 28 03:15:00
Extreme Maxima Extreme Minima
Channel 1 Channel 2 Channel 1 Channel 2 Value Day Time Value Day Time Value Day Time Value Day Time
Jan 3.48 3 12:30:00 -1.563 30 17:00:00 Feb 3.16 1 12:30:00 -1.867 28 16:45:00 Mar 2.602 20 13:30:00 -1.777 3 19:15:00 Apr 2.316 2 13:15:00 -1.614 27 16:15:00 May 2.218 18 01:30:00 -1.639 17 07:00:00 Jun 2.094 27 23:45:00 -1.813 16 07:30:00 July 2.427 15 01:00:00 -1.818 15 07:30:00 Aug 2.55 13 00:45:00 -1.732 13 07:00:00 Sep 2.441 11 00:30:00 -1.807 10 06:00:00 Oct 2.757 8 23:15:00 -1.417 10 06:15:00 Nov 2.856 6 23:15:00 -1.457 5 03:45:00 Dec 2.578 9 13:15:00 -1.677 25 20:00:00
Mean Sea Level
Channel 1 Channel 2 January 0 * 24 0.692 February 0 * 28 0.705 March 0 * 28 0.336 April 0 * 30 0.361 May 0 * 31 0.322 June 0 * 30 0.299 July 0 * 31 0.353 August 0 * 31 0.41 September 0 * 30 0.366 October 0 * 31 0.595 November 0 * 30 0.606 December 0 * 31 0.436 TOTAL & AVG 0 ** 355 0.457 * No mean sea level value as more than 15 days of data missing ** No yearly average value as more than one month’s MSL missing
114
UKCMF Annual Tide Gauge Report 2014
Portrush – Tide Gauge Information Latitude 55° 12' 24.4" N Longitude 06° 39' 24.6" W Grid Ref NW 0416 9952 Instrument Data acquisition system with two full-tide and a mid-tide bubbler gauge Location Tide Gauge Building Portrush RNLI boathouse
Measuring Points Fixed to a leg of the boathouse slipway Datum The delayed-mode data are to Admiralty Chart Datum (ACD).
The statistics in this report are to Ordnance Datum Belfast (ODB). Benchmark Grid Ref Description TGBM NR 0385 0018 Pin RNLI slipway Aux1 NR 0395 0008 Cut mark wall Kerr St Aux2 NW 0406 9992 Cut mark wall Kerr St Benchmark Relationships TGZ = Admiralty Chart Datum (ACD) TGZ = 1.24m below Ordnance Datum Belfast (ODB) TGZ = 2.844m below TGBM Levelling No levelling was carried out in 2014 Site visits 13/05/2014 (Day 133) Maintenance. Compressor change. 13/08/2014 (Day 225) Maintenance and inspection dive. Notes on Data Quality The lower quality index is due to a feature of the near real time quality control algorithm. The algorithm requires 2 hours of data either side of high water, which due to the position of the mid tide at Portrush, is not always available, giving an erroneous impression of the data quality. The algorithm is being refined to perform better at these sites. The data inspected in delayed mode reveal no issues.
115
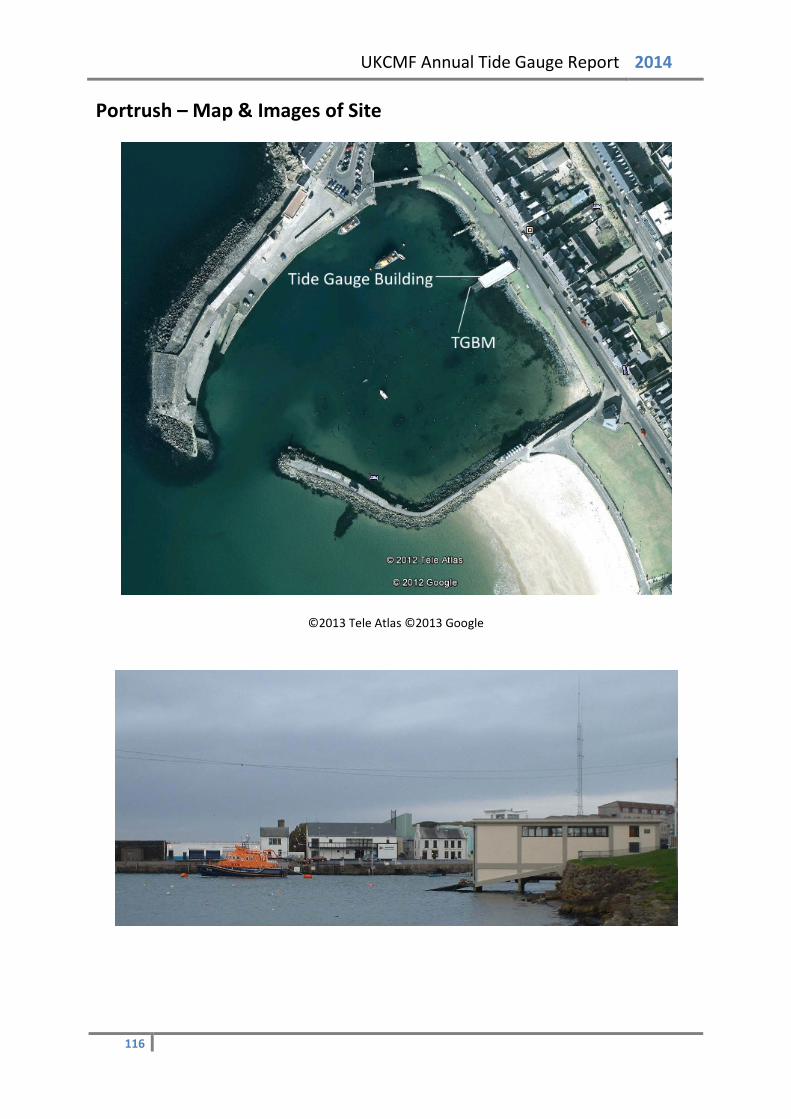
UKCMF Annual Tide Gauge Report 2014
Portrush – Map & Images of Site
©2013 Tele Atlas ©2013 Google
116
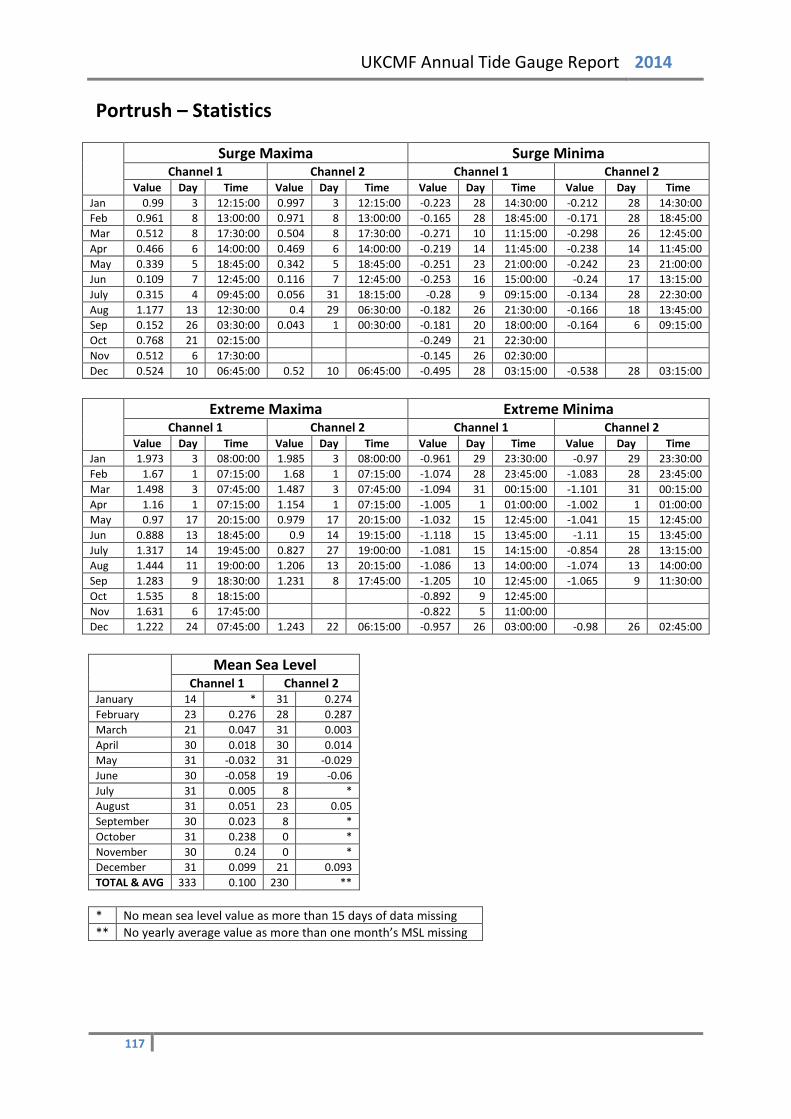
UKCMF Annual Tide Gauge Report 2014
Portrush – Statistics
Surge Maxima Surge Minima
Channel 1 Channel 2 Channel 1 Channel 2 Value Day Time Value Day Time Value Day Time Value Day Time
Jan 0.99 3 12:15:00 0.997 3 12:15:00 -0.223 28 14:30:00 -0.212 28 14:30:00 Feb 0.961 8 13:00:00 0.971 8 13:00:00 -0.165 28 18:45:00 -0.171 28 18:45:00 Mar 0.512 8 17:30:00 0.504 8 17:30:00 -0.271 10 11:15:00 -0.298 26 12:45:00 Apr 0.466 6 14:00:00 0.469 6 14:00:00 -0.219 14 11:45:00 -0.238 14 11:45:00 May 0.339 5 18:45:00 0.342 5 18:45:00 -0.251 23 21:00:00 -0.242 23 21:00:00 Jun 0.109 7 12:45:00 0.116 7 12:45:00 -0.253 16 15:00:00 -0.24 17 13:15:00 July 0.315 4 09:45:00 0.056 31 18:15:00 -0.28 9 09:15:00 -0.134 28 22:30:00 Aug 1.177 13 12:30:00 0.4 29 06:30:00 -0.182 26 21:30:00 -0.166 18 13:45:00 Sep 0.152 26 03:30:00 0.043 1 00:30:00 -0.181 20 18:00:00 -0.164 6 09:15:00 Oct 0.768 21 02:15:00 -0.249 21 22:30:00 Nov 0.512 6 17:30:00 -0.145 26 02:30:00 Dec 0.524 10 06:45:00 0.52 10 06:45:00 -0.495 28 03:15:00 -0.538 28 03:15:00
Extreme Maxima Extreme Minima
Channel 1 Channel 2 Channel 1 Channel 2 Value Day Time Value Day Time Value Day Time Value Day Time
Jan 1.973 3 08:00:00 1.985 3 08:00:00 -0.961 29 23:30:00 -0.97 29 23:30:00 Feb 1.67 1 07:15:00 1.68 1 07:15:00 -1.074 28 23:45:00 -1.083 28 23:45:00 Mar 1.498 3 07:45:00 1.487 3 07:45:00 -1.094 31 00:15:00 -1.101 31 00:15:00 Apr 1.16 1 07:15:00 1.154 1 07:15:00 -1.005 1 01:00:00 -1.002 1 01:00:00 May 0.97 17 20:15:00 0.979 17 20:15:00 -1.032 15 12:45:00 -1.041 15 12:45:00 Jun 0.888 13 18:45:00 0.9 14 19:15:00 -1.118 15 13:45:00 -1.11 15 13:45:00 July 1.317 14 19:45:00 0.827 27 19:00:00 -1.081 15 14:15:00 -0.854 28 13:15:00 Aug 1.444 11 19:00:00 1.206 13 20:15:00 -1.086 13 14:00:00 -1.074 13 14:00:00 Sep 1.283 9 18:30:00 1.231 8 17:45:00 -1.205 10 12:45:00 -1.065 9 11:30:00 Oct 1.535 8 18:15:00 -0.892 9 12:45:00 Nov 1.631 6 17:45:00 -0.822 5 11:00:00 Dec 1.222 24 07:45:00 1.243 22 06:15:00 -0.957 26 03:00:00 -0.98 26 02:45:00
Mean Sea Level
Channel 1 Channel 2 January 14 * 31 0.274 February 23 0.276 28 0.287 March 21 0.047 31 0.003 April 30 0.018 30 0.014 May 31 -0.032 31 -0.029 June 30 -0.058 19 -0.06 July 31 0.005 8 * August 31 0.051 23 0.05 September 30 0.023 8 * October 31 0.238 0 * November 30 0.24 0 * December 31 0.099 21 0.093 TOTAL & AVG 333 0.100 230 ** * No mean sea level value as more than 15 days of data missing ** No yearly average value as more than one month’s MSL missing
117
UKCMF Annual Tide Gauge Report 2014
Portsmouth – Tide Gauge Information Latitude 50° 48' 08.1" N Longitude 01° 06' 40.5" W Grid Ref SU 6273 0068 Instrument Data acquisition system with two full-tide and a mid-tide bubbler gauge Location Tide Gauge Building Victory Jetty in Portsmouth Royal Naval base
Measuring Points On a leg at the north west corner of the jetty Datum The delayed-mode data are to Admiralty Chart Datum (ACD).
The statistics in this report are to Ordnance Datum Newlyn (ODN). Benchmark Grid Ref Description TGBM SU 6269 0053 Bolt in concrete jetty TG building S angle Aux1 SU 6330 9996 GP N side entrance to HMS Vernon Aux2 SU 6274 0039 Building SW face 0.6M S angle Aux3 SU 6283 0050 Building SW side of Main Rd NE face N angle Benchmark Relationships TGZ = Admiralty Chart Datum (ACD) TGZ = 2.73m below Ordnance Datum Newlyn (ODN) TGZ = 6.007m below TGBM Levelling No levelling was carried out in 2014 Site visits 16/01/2014 (Day 016) Maintenance. Compressor change. Notes on Data Quality The site met the agreed target of being operational for at least 75% of each calendar month in 2014.
118
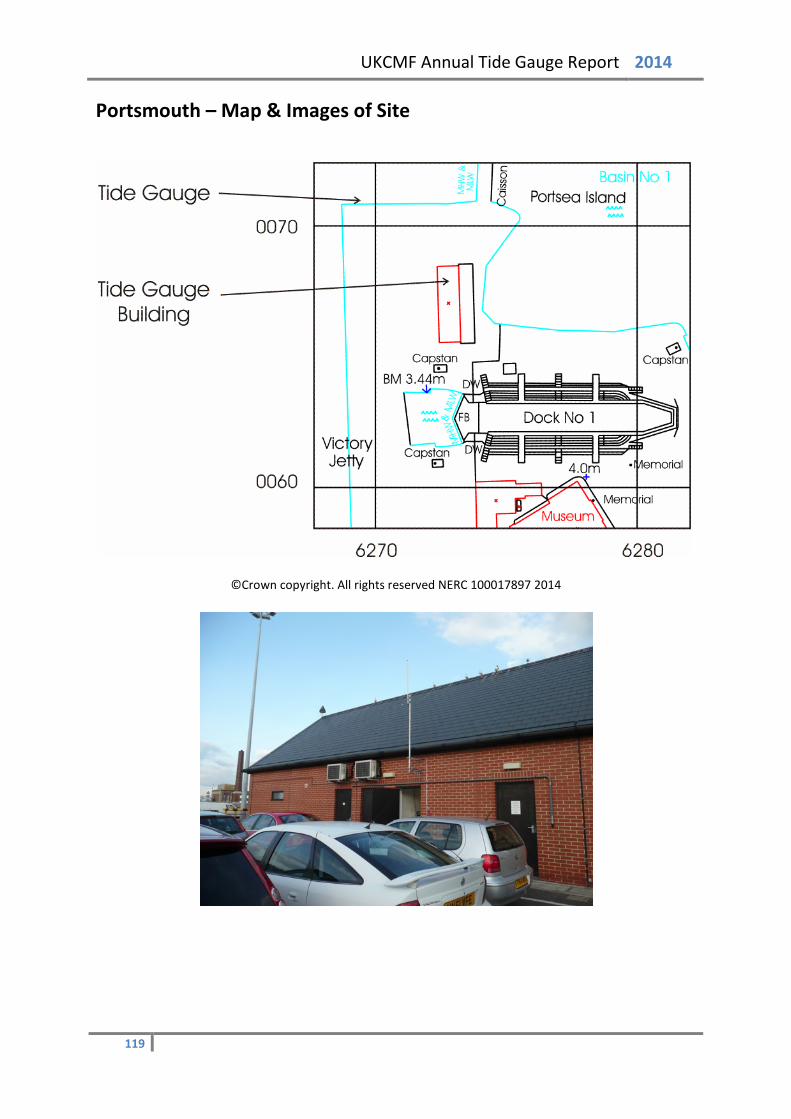
UKCMF Annual Tide Gauge Report 2014
Portsmouth – Map & Images of Site
©Crown copyright. All rights reserved NERC 100017897 2014
119

UKCMF Annual Tide Gauge Report 2014
Portsmouth – Statistics
Surge Maxima Surge Minima
Channel 1 Channel 2 Channel 1 Channel 2 Value Day Time Value Day Time Value Day Time Value Day Time
Jan 0.796 1 16:30:00 0.813 1 16:30:00 -0.421 25 13:00:00 -0.407 25 13:00:00 Feb 1.194 14 22:00:00 1.213 14 22:00:00 -0.434 6 04:15:00 -0.419 6 04:15:00 Mar 0.459 2 16:15:00 0.475 2 16:15:00 -0.351 9 00:30:00 -0.337 9 00:30:00 Apr 0.421 26 04:00:00 0.436 26 04:00:00 -0.253 16 05:30:00 -0.237 16 05:30:00 May 0.384 23 05:45:00 0.398 23 05:45:00 -0.258 15 06:15:00 -0.244 15 06:15:00 Jun 0.261 7 01:00:00 0.274 7 01:00:00 -0.195 17 07:45:00 -0.181 17 07:45:00 July 0.284 5 03:45:00 0.299 5 03:45:00 -0.243 16 15:30:00 -0.229 16 15:30:00 Aug 0.444 10 11:00:00 0.458 10 11:00:00 -0.162 16 16:30:00 -0.149 16 16:30:00 Sep 0.207 27 02:30:00 0.222 27 02:30:00 -0.223 12 07:15:00 -0.21 12 07:15:00 Oct 0.573 22 06:15:00 0.588 22 06:15:00 -0.216 5 13:15:00 -0.202 5 13:15:00 Nov 0.455 4 00:00:00 0.47 12 08:00:00 -0.19 14 17:15:00 -0.175 14 17:15:00 Dec 0.565 10 15:00:00 0.58 10 15:00:00 -0.574 10 02:45:00 -0.56 10 02:45:00
Extreme Maxima Extreme Minima
Channel 1 Channel 2 Channel 1 Channel 2 Value Day Time Value Day Time Value Day Time Value Day Time
Jan 2.744 3 12:30:00 2.763 3 12:30:00 -2.112 30 16:15:00 -2.097 30 16:15:00 Feb 2.786 14 23:00:00 2.807 14 23:00:00 -2.392 2 18:30:00 -2.377 2 18:30:00 Mar 2.546 3 00:15:00 2.562 3 00:15:00 -2.326 1 16:45:00 -2.311 1 16:45:00 Apr 2.278 2 00:45:00 2.293 2 00:45:00 -2.261 1 05:15:00 -2.247 1 05:15:00 May 2.134 1 00:15:00 2.148 1 00:15:00 -2.326 17 06:00:00 -2.313 17 06:00:00 Jun 2.03 15 00:15:00 2.043 15 00:15:00 -2.313 15 05:45:00 -2.301 15 05:45:00 July 2.24 14 00:00:00 2.253 14 00:00:00 -2.355 15 06:15:00 -2.34 15 06:15:00 Aug 2.473 10 10:45:00 2.49 10 10:45:00 -2.356 13 06:00:00 -2.341 13 06:00:00 Sep 2.271 9 11:15:00 2.285 9 11:15:00 -2.496 11 05:45:00 -2.474 11 05:45:00 Oct 2.618 9 11:30:00 2.635 9 11:30:00 -2.106 10 05:15:00 -2.091 10 05:15:00 Nov 2.575 8 12:00:00 2.593 8 12:00:00 -2.027 24 17:30:00 -2.013 24 17:30:00 Dec 2.328 10 13:30:00 2.343 10 13:30:00 -2.177 25 19:00:00 -2.164 25 19:00:00
Mean Sea Level
Channel 1 Channel 2 January 31 0.306 31 0.32 February 28 0.32 28 0.335 March 31 0.117 31 0.132 April 30 0.165 30 0.18 May 31 0.137 31 0.151 June 30 0.134 30 0.147 July 31 0.175 31 0.189 August 31 0.212 31 0.226 September 30 0.194 30 0.209 October 31 0.286 31 0.3 November 30 0.342 30 0.356 December 31 0.167 31 0.181 TOTAL & AVG 365 0.213 365 0.227 * No mean sea level value as more than 15 days of data missing ** No yearly average value as more than one month’s MSL missing
120
UKCMF Annual Tide Gauge Report 2014
Sheerness – Tide Gauge Information Latitude 51° 26' 44.3" N Longitude 00° 44' 36.4" E Grid Ref TQ 9074 7542 Instrument Data acquisition system with two full-tide and a mid-tide bubbler gauge Location Tide Gauge Building On the jetty at Garrison Point, Port of Sheerness
Measuring Points As above Datum The delayed-mode data are to Admiralty Chart Datum (ACD).
The statistics in this report are to Ordnance Datum Newlyn (ODN). Benchmark Grid Ref Description TGBM TQ 9080 7549 Flush bracket 11859, Garrison Fort, S angle, SW building Aux1 TQ 9133 7532 Flush bracket G.4790, on house, NW angle, N face Aux2 TQ 9115 7533 Wall on SW side of road, NE angle Aux3 TQ 9147 7516 Bolt Ch. Dis, SW side of road, E face, NE angle Benchmark Relationships TGZ = Admiralty Chart Datum (ACD) TGZ = 2.90m below Ordnance Datum Newlyn (ODN ) TGZ = 7.532m below TGBM Levelling No levelling was carried out in 2014 Site visits 30/07/2014 (Day 211) Maintenance. Diving to clear completely blocked channel. Channel
not fully cleared, may require the pressure points to be lifted. 22/11/2014 (Day 326) Maintenance. 16/12/2014 (Day 350) Compressor change. Attempt made to clear the blocked line - still
much reduced flow. Notes on Data Quality Channel 2 was blocking and several attempts, including diving on site, were made to clear the channel. The site met the agreed target of being operational for at least 75% of each calendar month in 2014.
121
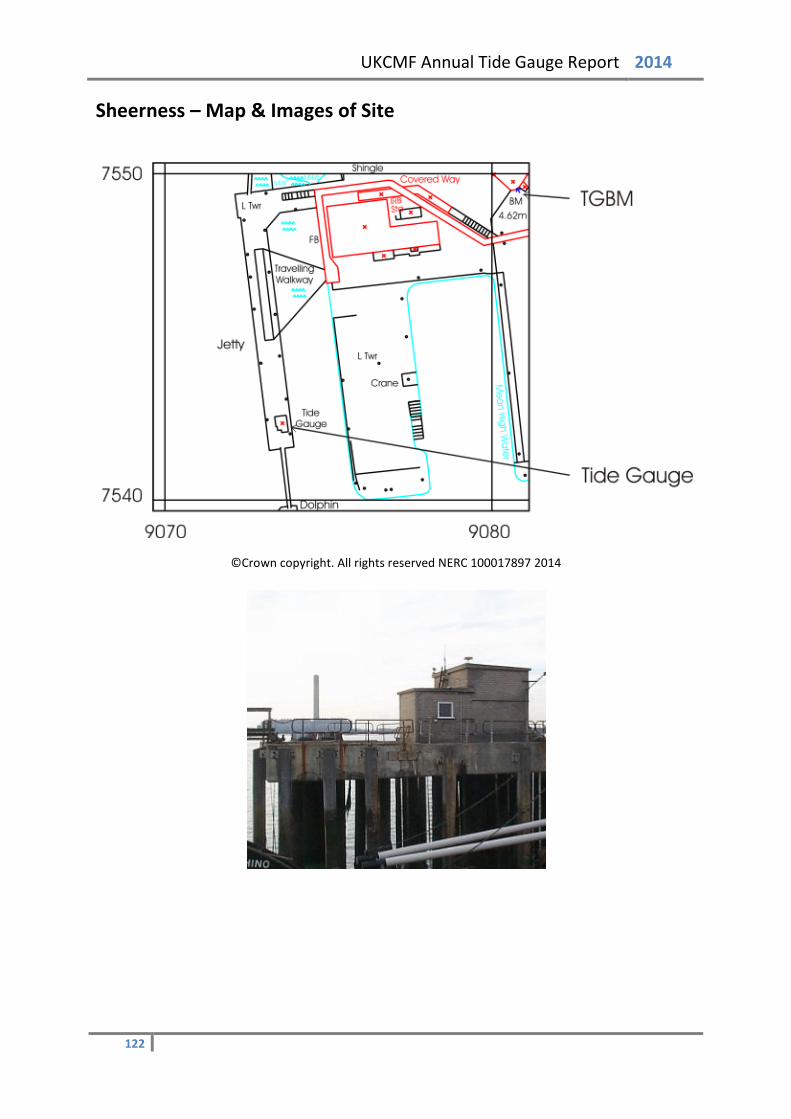
UKCMF Annual Tide Gauge Report 2014
Sheerness – Map & Images of Site
©Crown copyright. All rights reserved NERC 100017897 2014
122
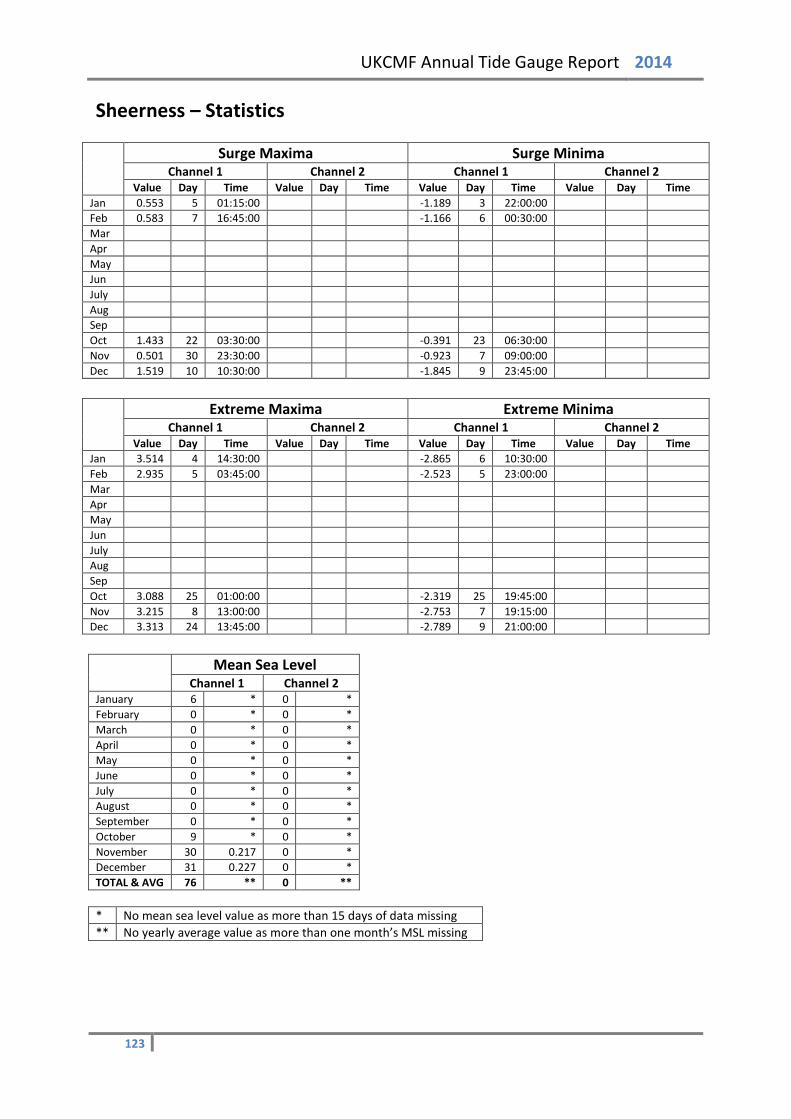
UKCMF Annual Tide Gauge Report 2014
Sheerness – Statistics
Surge Maxima Surge Minima
Channel 1 Channel 2 Channel 1 Channel 2 Value Day Time Value Day Time Value Day Time Value Day Time
Jan 0.553 5 01:15:00 -1.189 3 22:00:00 Feb 0.583 7 16:45:00 -1.166 6 00:30:00 Mar Apr May Jun July Aug Sep Oct 1.433 22 03:30:00 -0.391 23 06:30:00 Nov 0.501 30 23:30:00 -0.923 7 09:00:00 Dec 1.519 10 10:30:00 -1.845 9 23:45:00
Extreme Maxima Extreme Minima
Channel 1 Channel 2 Channel 1 Channel 2 Value Day Time Value Day Time Value Day Time Value Day Time
Jan 3.514 4 14:30:00 -2.865 6 10:30:00 Feb 2.935 5 03:45:00 -2.523 5 23:00:00 Mar Apr May Jun July Aug Sep Oct 3.088 25 01:00:00 -2.319 25 19:45:00 Nov 3.215 8 13:00:00 -2.753 7 19:15:00 Dec 3.313 24 13:45:00 -2.789 9 21:00:00
Mean Sea Level
Channel 1 Channel 2 January 6 * 0 * February 0 * 0 * March 0 * 0 * April 0 * 0 * May 0 * 0 * June 0 * 0 * July 0 * 0 * August 0 * 0 * September 0 * 0 * October 9 * 0 * November 30 0.217 0 * December 31 0.227 0 * TOTAL & AVG 76 ** 0 ** * No mean sea level value as more than 15 days of data missing ** No yearly average value as more than one month’s MSL missing
123
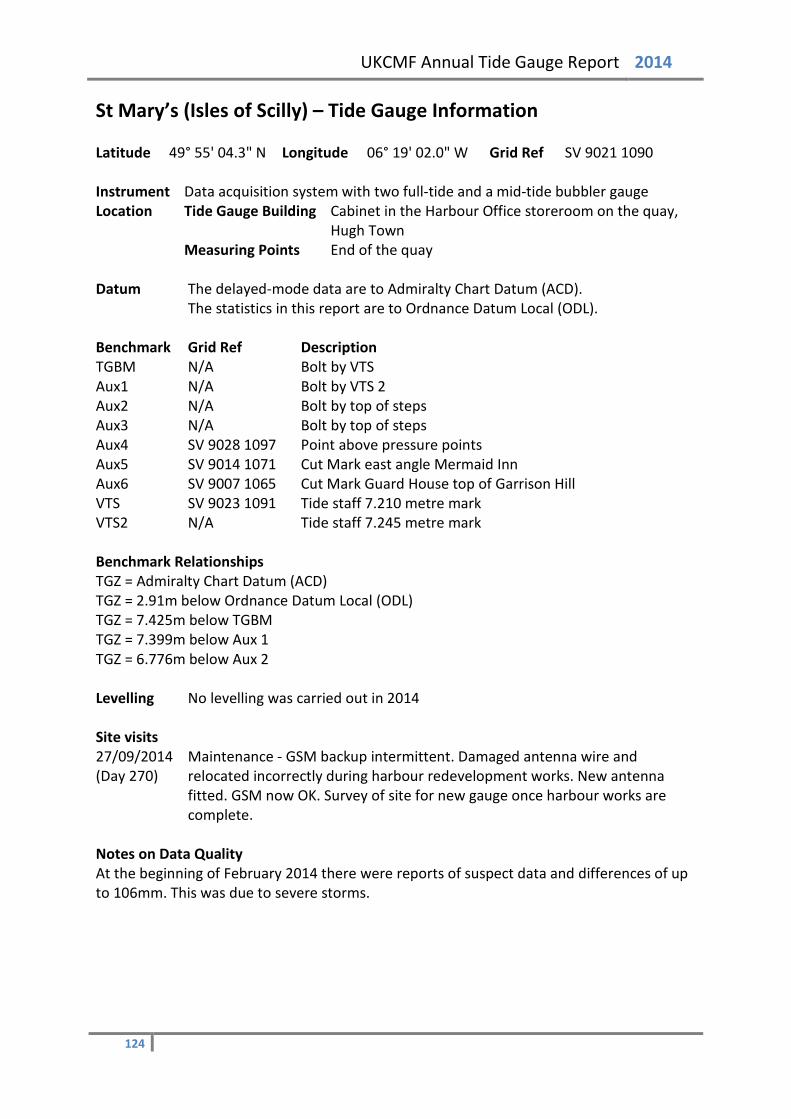
UKCMF Annual Tide Gauge Report 2014
St Mary’s (Isles of Scilly) – Tide Gauge Information Latitude 49° 55' 04.3" N Longitude 06° 19' 02.0" W Grid Ref SV 9021 1090 Instrument Data acquisition system with two full-tide and a mid-tide bubbler gauge Location Tide Gauge Building Cabinet in the Harbour Office storeroom on the quay,
Hugh Town Measuring Points End of the quay
Datum The delayed-mode data are to Admiralty Chart Datum (ACD).
The statistics in this report are to Ordnance Datum Local (ODL). Benchmark Grid Ref Description TGBM N/A Bolt by VTS Aux1 N/A Bolt by VTS 2 Aux2 N/A Bolt by top of steps Aux3 N/A Bolt by top of steps Aux4 SV 9028 1097 Point above pressure points Aux5 SV 9014 1071 Cut Mark east angle Mermaid Inn Aux6 SV 9007 1065 Cut Mark Guard House top of Garrison Hill VTS SV 9023 1091 Tide staff 7.210 metre mark VTS2 N/A Tide staff 7.245 metre mark Benchmark Relationships TGZ = Admiralty Chart Datum (ACD) TGZ = 2.91m below Ordnance Datum Local (ODL) TGZ = 7.425m below TGBM TGZ = 7.399m below Aux 1 TGZ = 6.776m below Aux 2 Levelling No levelling was carried out in 2014 Site visits 27/09/2014 (Day 270)
Maintenance - GSM backup intermittent. Damaged antenna wire and relocated incorrectly during harbour redevelopment works. New antenna fitted. GSM now OK. Survey of site for new gauge once harbour works are complete.
Notes on Data Quality At the beginning of February 2014 there were reports of suspect data and differences of up to 106mm. This was due to severe storms.
124
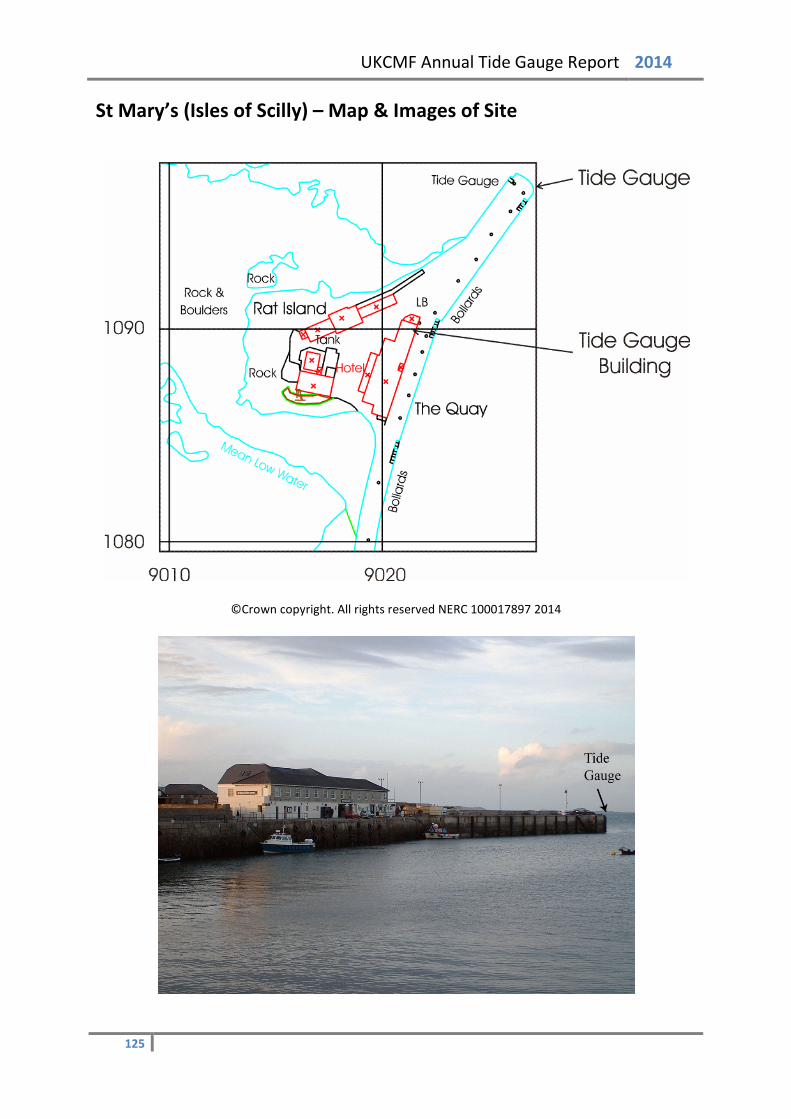
UKCMF Annual Tide Gauge Report 2014
St Mary’s (Isles of Scilly) – Map & Images of Site
©Crown copyright. All rights reserved NERC 100017897 2014
125
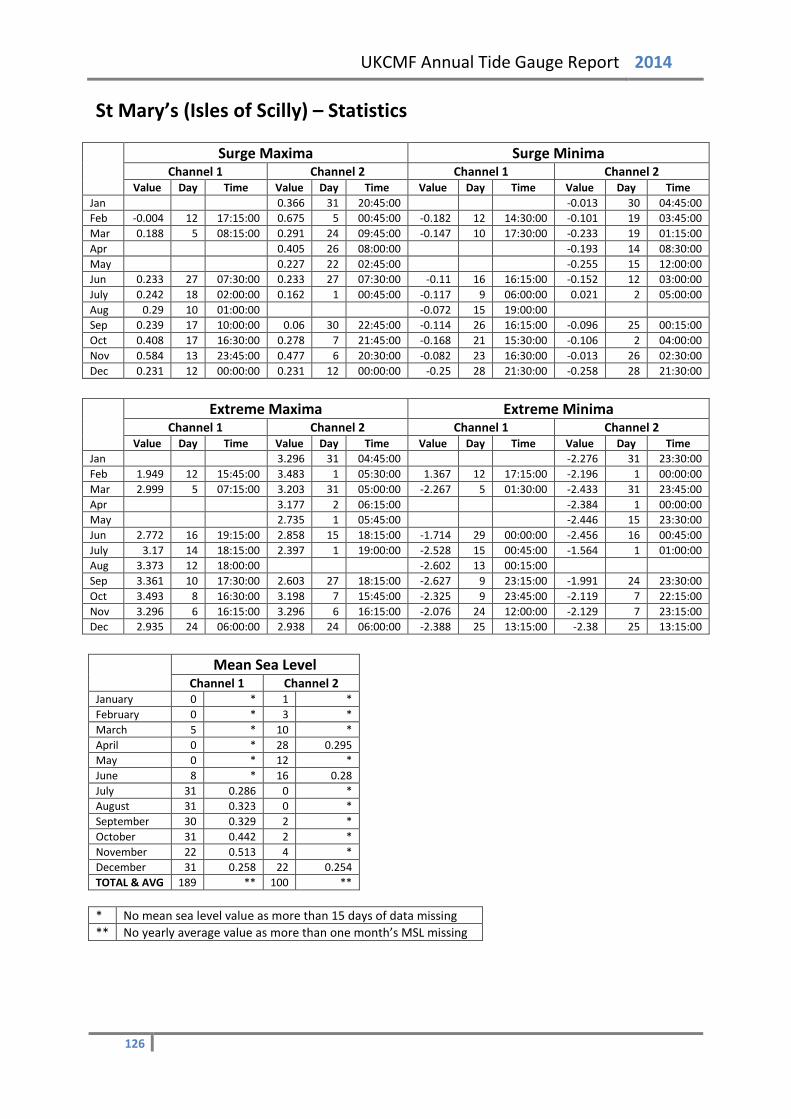
UKCMF Annual Tide Gauge Report 2014
St Mary’s (Isles of Scilly) – Statistics
Surge Maxima Surge Minima
Channel 1 Channel 2 Channel 1 Channel 2 Value Day Time Value Day Time Value Day Time Value Day Time
Jan 0.366 31 20:45:00 -0.013 30 04:45:00 Feb -0.004 12 17:15:00 0.675 5 00:45:00 -0.182 12 14:30:00 -0.101 19 03:45:00 Mar 0.188 5 08:15:00 0.291 24 09:45:00 -0.147 10 17:30:00 -0.233 19 01:15:00 Apr 0.405 26 08:00:00 -0.193 14 08:30:00 May 0.227 22 02:45:00 -0.255 15 12:00:00 Jun 0.233 27 07:30:00 0.233 27 07:30:00 -0.11 16 16:15:00 -0.152 12 03:00:00 July 0.242 18 02:00:00 0.162 1 00:45:00 -0.117 9 06:00:00 0.021 2 05:00:00 Aug 0.29 10 01:00:00 -0.072 15 19:00:00 Sep 0.239 17 10:00:00 0.06 30 22:45:00 -0.114 26 16:15:00 -0.096 25 00:15:00 Oct 0.408 17 16:30:00 0.278 7 21:45:00 -0.168 21 15:30:00 -0.106 2 04:00:00 Nov 0.584 13 23:45:00 0.477 6 20:30:00 -0.082 23 16:30:00 -0.013 26 02:30:00 Dec 0.231 12 00:00:00 0.231 12 00:00:00 -0.25 28 21:30:00 -0.258 28 21:30:00
Extreme Maxima Extreme Minima
Channel 1 Channel 2 Channel 1 Channel 2 Value Day Time Value Day Time Value Day Time Value Day Time
Jan 3.296 31 04:45:00 -2.276 31 23:30:00 Feb 1.949 12 15:45:00 3.483 1 05:30:00 1.367 12 17:15:00 -2.196 1 00:00:00 Mar 2.999 5 07:15:00 3.203 31 05:00:00 -2.267 5 01:30:00 -2.433 31 23:45:00 Apr 3.177 2 06:15:00 -2.384 1 00:00:00 May 2.735 1 05:45:00 -2.446 15 23:30:00 Jun 2.772 16 19:15:00 2.858 15 18:15:00 -1.714 29 00:00:00 -2.456 16 00:45:00 July 3.17 14 18:15:00 2.397 1 19:00:00 -2.528 15 00:45:00 -1.564 1 01:00:00 Aug 3.373 12 18:00:00 -2.602 13 00:15:00 Sep 3.361 10 17:30:00 2.603 27 18:15:00 -2.627 9 23:15:00 -1.991 24 23:30:00 Oct 3.493 8 16:30:00 3.198 7 15:45:00 -2.325 9 23:45:00 -2.119 7 22:15:00 Nov 3.296 6 16:15:00 3.296 6 16:15:00 -2.076 24 12:00:00 -2.129 7 23:15:00 Dec 2.935 24 06:00:00 2.938 24 06:00:00 -2.388 25 13:15:00 -2.38 25 13:15:00
Mean Sea Level
Channel 1 Channel 2 January 0 * 1 * February 0 * 3 * March 5 * 10 * April 0 * 28 0.295 May 0 * 12 * June 8 * 16 0.28 July 31 0.286 0 * August 31 0.323 0 * September 30 0.329 2 * October 31 0.442 2 * November 22 0.513 4 * December 31 0.258 22 0.254 TOTAL & AVG 189 ** 100 ** * No mean sea level value as more than 15 days of data missing ** No yearly average value as more than one month’s MSL missing
126

UKCMF Annual Tide Gauge Report 2014
Stornoway – Tide Gauge Information Latitude 58° 12' 28.1" N Longitude 06° 23' 20.3" W Grid Ref NB 4228 3274 Instrument Data acquisition system with two full-tide and a mid-tide bubbler gauge Location Tide Gauge Building By the weighbridge at the entrance to Stornoway Port
Authority, No. 2 wharf Measuring Points Attached to a leg on the east side of the wharf
Datum The delayed-mode data are to Admiralty Chart Datum (ACD).
The statistics in this report are to Ordnance Datum Local (ODL). Benchmark Grid Ref Description TGBM NB 4228 3264 OSBM bolt E side of No 2 wharf Aux1 NB 4215 3271 OSBM bolt STS NE angle King Edwards Wharf Aux2 NB 4212 3275 Amity House E side of Espl Rd N face NW angle Aux3 NB 4223 3280 BK S side Worth Beach NW angle N face Benchmark Relationships TGZ = Admiralty Chart Datum (ACD) TGZ = 2.71m below Ordnance Datum Local (ODL) TGZ = 6.368m below TGBM Levelling No levelling was carried out in 2014 Site visits 02/12/2014 (Day 336) A pontoon had come adrift in a storm and cut through all 3
pneumatic lines - replaced and repaired. The compressor autodrain was also found to be faulty - disconnected. A new auto drain will be fitted on the next visit.
Notes on Data Quality On 06/11/2014 all 3 channels were lost. TGI contacted the harbour and were informed that a pontoon came adrift in the storm and severed all 3 pneumatic lines. A site visit was made and all 3 lines were repaired.
127
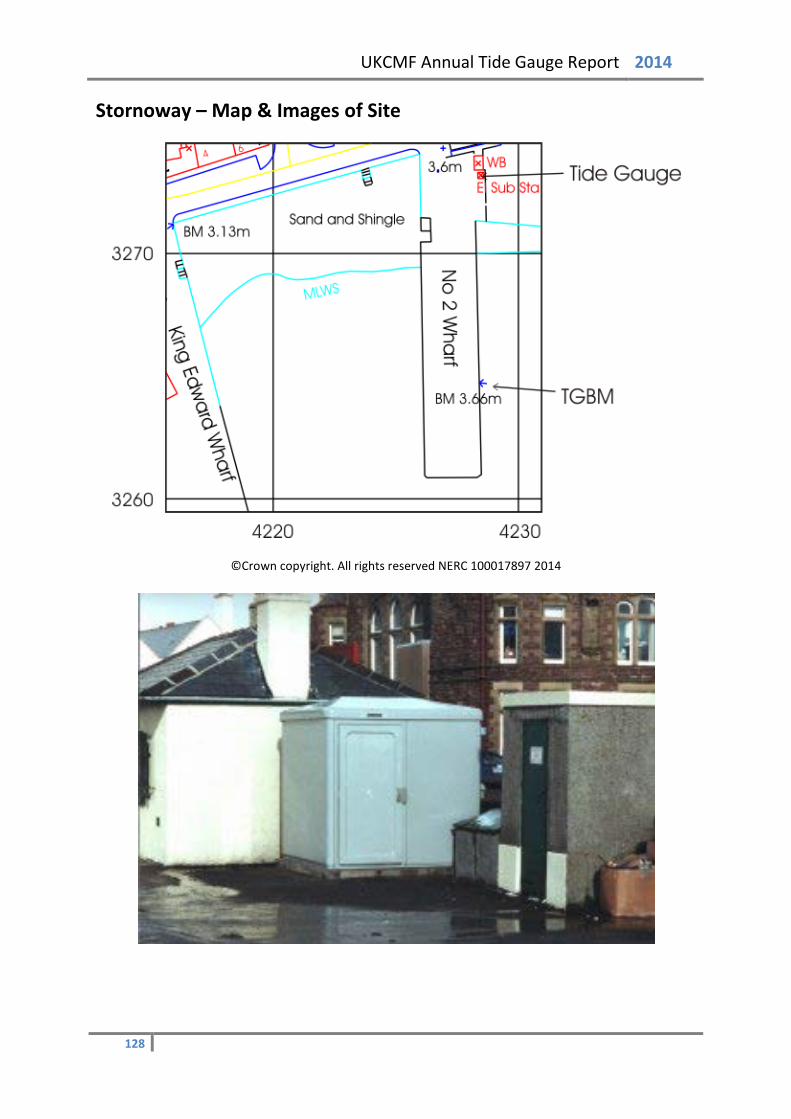
UKCMF Annual Tide Gauge Report 2014
Stornoway – Map & Images of Site
©Crown copyright. All rights reserved NERC 100017897 2014
128

UKCMF Annual Tide Gauge Report 2014
Stornoway – Statistics
Surge Maxima Surge Minima
Channel 1 Channel 2 Channel 1 Channel 2 Value Day Time Value Day Time Value Day Time Value Day Time
Jan 0.764 26 19:30:00 0.766 26 19:30:00 -0.237 29 15:45:00 -0.235 29 09:45:00 Feb 0.695 8 15:00:00 0.697 8 15:00:00 -0.1 16 04:00:00 -0.098 16 04:15:00 Mar 0.582 20 21:30:00 0.583 20 21:30:00 -0.271 26 10:30:00 -0.269 26 10:30:00 Apr 0.457 6 14:00:00 0.457 6 14:00:00 -0.121 14 21:30:00 -0.12 14 21:30:00 May 0.402 6 08:15:00 0.405 6 08:15:00 -0.199 23 19:45:00 -0.197 23 19:45:00 Jun 0.188 11 00:00:00 0.192 11 00:00:00 -0.216 15 22:45:00 -0.212 15 22:45:00 July 0.396 4 07:45:00 0.397 4 07:45:00 -0.146 9 07:30:00 -0.142 9 07:30:00 Aug 0.29 29 09:30:00 0.295 29 09:30:00 -0.165 17 22:45:00 -0.161 17 22:45:00 Sep 0.32 26 02:45:00 0.325 26 02:45:00 -0.173 13 12:30:00 -0.168 13 12:30:00 Oct 0.61 19 05:00:00 0.615 19 05:00:00 -0.186 22 00:15:00 -0.182 22 00:15:00 Nov 0.358 1 21:00:00 0.362 1 21:00:00 -0.186 5 07:15:00 -0.182 5 07:15:00 Dec 0.605 10 05:45:00 -0.093 2 20:45:00 -0.471 28 03:45:00 -0.159 2 23:30:00
Extreme Maxima Extreme Minima
Channel 1 Channel 2 Channel 1 Channel 2 Value Day Time Value Day Time Value Day Time Value Day Time
Jan 3.179 3 08:15:00 3.179 3 08:15:00 -2.05 30 12:45:00 -2.048 30 12:45:00 Feb 3.258 1 07:30:00 3.259 1 07:30:00 -2.185 2 15:00:00 -2.183 2 15:00:00 Mar 2.93 3 08:00:00 2.93 3 08:00:00 -2.431 1 13:00:00 -2.429 1 13:00:00 Apr 2.458 1 07:30:00 2.46 1 07:30:00 -2.276 1 01:45:00 -2.273 1 01:45:00 May 2.249 17 20:30:00 2.252 17 20:30:00 -2.179 15 13:15:00 -2.177 15 13:15:00 Jun 2.213 14 19:30:00 2.214 14 19:30:00 -2.381 16 03:00:00 -2.377 16 03:00:00 July 2.721 14 20:15:00 2.719 14 20:15:00 -2.333 15 02:45:00 -2.33 15 02:45:00 Aug 2.919 11 19:15:00 2.919 11 19:15:00 -2.435 13 02:30:00 -2.431 13 02:30:00 Sep 2.753 10 19:30:00 2.754 10 19:30:00 -2.614 11 02:00:00 -2.61 11 02:00:00 Oct 2.878 8 18:30:00 2.878 8 18:30:00 -2.268 10 01:45:00 -2.264 10 01:45:00 Nov 2.462 6 06:15:00 2.451 6 06:15:00 -1.901 4 23:30:00 -1.898 4 23:30:00 Dec 2.628 24 08:00:00 1.634 2 15:30:00 -2.301 25 15:30:00 -1.432 2 22:00:00
Mean Sea Level
Channel 1 Channel 2 January 31 0.43 31 0.431 February 28 0.442 28 0.443 March 31 0.207 31 0.208 April 30 0.18 30 0.182 May 31 0.122 31 0.125 June 30 0.113 30 0.116 July 31 0.201 31 0.205 August 31 0.217 31 0.22 September 30 0.196 30 0.2 October 31 0.412 31 0.415 November 4 * 4 * December 28 0.312 0 * TOTAL & AVG 336 0.273 308 ** * No mean sea level value as more than 15 days of data missing ** No yearly average value as more than one month’s MSL missing
129
UKCMF Annual Tide Gauge Report 2014
Tobermory – Tide Gauge Information Latitude 56° 37' 23.2" N Longitude 06° 03' 51.2" W Grid Ref NM 5079 5531 Instrument Data acquisition system with two full-tide and a mid-tide bubbler gauge Location Tide Gauge Building In the Caledonian MacBrayne ferry terminal on
Mishnish Pier Measuring Points Attached to a leg of the pier
Datum The delayed-mode data are to Admiralty Chart Datum (ACD).
The statistics in this report are to Ordnance Datum Newlyn (ODN). Benchmark Grid Ref Description TGBM NM 5069 5530 F bracket G5186 on SW angle of Royal bldg Aux2 NM 5077 5529 NBM rivet in sea wall of Mishnish Pier Benchmark Relationships TGZ = Admiralty Chart Datum (ACD) TGZ = 2.39m below Ordnance Datum Newlyn (ODN) TGZ = Chart Datum = 6.856m below TGBM Levelling No levelling was carried out in 2014 Site visits 07/02/2014 (Day 038) Compressor change. 01/07/2014 (Day 182) Maintenance. Notes on Data Quality The site met the agreed target of being operational for at least 75% of each calendar month in 2014.
130
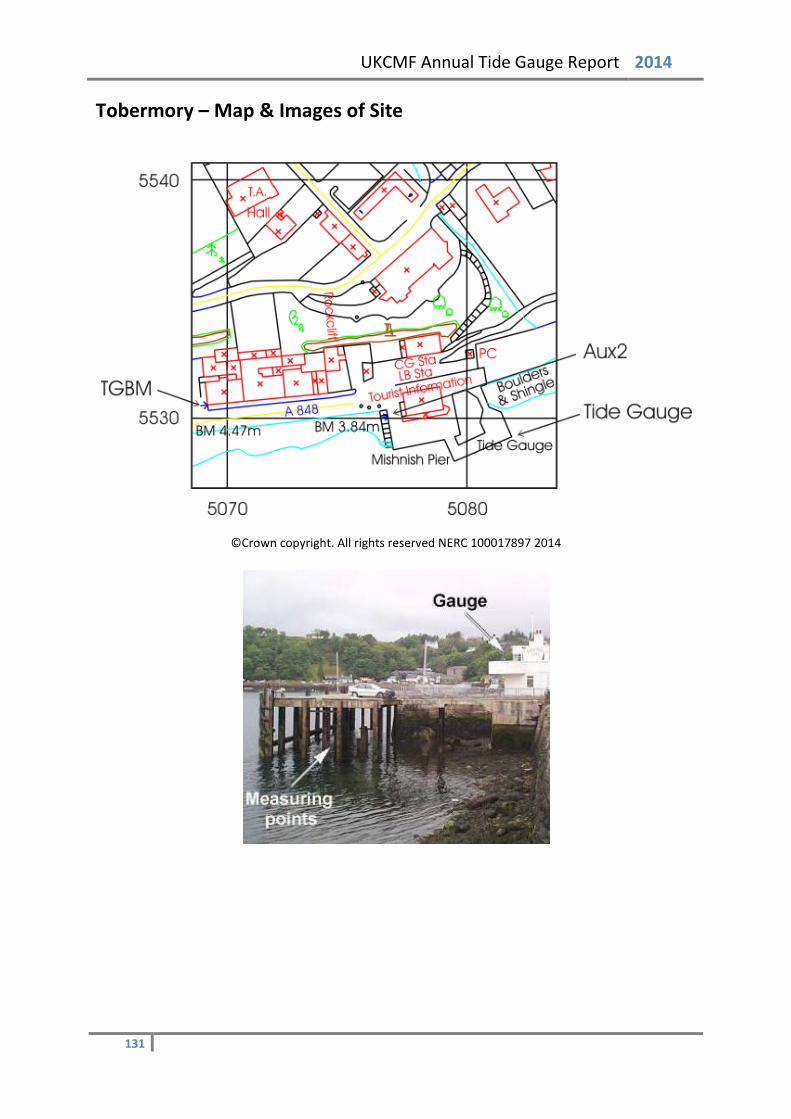
UKCMF Annual Tide Gauge Report 2014
Tobermory – Map & Images of Site
©Crown copyright. All rights reserved NERC 100017897 2014
131

UKCMF Annual Tide Gauge Report 2014
Tobermory – Statistics
Surge Maxima Surge Minima
Channel 1 Channel 2 Channel 1 Channel 2 Value Day Time Value Day Time Value Day Time Value Day Time
Jan 1.144 3 12:30:00 1.142 3 12:30:00 -0.198 29 15:15:00 -0.198 29 15:15:00 Feb 0.984 8 13:45:00 0.982 8 13:45:00 -0.13 28 18:30:00 -0.131 28 18:30:00 Mar 0.603 20 03:00:00 0.603 20 03:00:00 -0.285 26 07:15:00 -0.286 26 07:15:00 Apr 0.551 6 13:15:00 0.55 6 13:15:00 -0.186 14 11:00:00 -0.187 14 11:00:00 May 0.391 5 18:00:00 0.39 5 18:00:00 -0.258 23 20:45:00 -0.259 23 20:45:00 Jun 0.212 7 11:15:00 0.212 7 11:15:00 -0.226 15 16:15:00 -0.225 15 16:15:00 July 0.397 4 09:00:00 0.394 4 09:00:00 -0.19 9 10:00:00 -0.193 9 10:00:00 Aug 0.411 29 08:30:00 0.409 29 08:30:00 -0.196 18 06:30:00 -0.199 18 06:30:00 Sep 0.245 26 02:45:00 0.242 26 02:45:00 -0.163 20 18:30:00 -0.165 20 18:30:00 Oct 0.709 19 06:00:00 0.706 19 06:00:00 -0.33 21 23:30:00 -0.334 21 23:30:00 Nov 0.514 6 11:00:00 0.507 6 11:00:00 -0.155 5 08:00:00 -0.16 5 08:00:00 Dec -0.072 26 19:30:00 0.574 9 13:45:00 -0.305 27 09:45:00 -0.551 28 05:30:00
Extreme Maxima Extreme Minima
Channel 1 Channel 2 Channel 1 Channel 2 Value Day Time Value Day Time Value Day Time Value Day Time
Jan 3.338 3 07:30:00 3.336 3 07:15:00 -1.728 30 23:45:00 -1.73 30 23:45:00 Feb 3.193 1 06:45:00 3.192 1 06:45:00 -1.951 28 23:45:00 -1.952 28 23:45:00 Mar 2.955 3 07:15:00 2.953 3 07:15:00 -2.046 31 00:00:00 -2.047 31 00:00:00 Apr 2.528 1 06:45:00 2.527 1 06:45:00 -1.944 1 01:00:00 -1.945 1 00:45:00 May 2.257 17 19:30:00 2.257 17 19:30:00 -1.843 16 00:30:00 -1.844 16 00:30:00 Jun 2.208 14 18:45:00 2.207 14 18:45:00 -1.962 15 13:30:00 -1.963 15 13:30:00 July 2.699 14 19:15:00 2.697 14 19:15:00 -1.995 15 14:15:00 -1.998 15 14:15:00 Aug 2.887 12 19:00:00 2.884 12 19:00:00 -2.061 13 14:00:00 -2.064 13 13:45:00 Sep 2.727 10 18:45:00 2.725 10 18:45:00 -2.2 10 12:45:00 -2.203 10 12:45:00 Oct 2.896 8 17:45:00 2.893 8 17:45:00 -1.869 10 00:45:00 -1.873 10 00:45:00 Nov 2.945 6 17:15:00 2.94 6 17:15:00 -1.553 5 10:30:00 -1.573 25 01:30:00 Dec 2.059 26 08:45:00 2.573 24 07:15:00 -1.509 26 15:15:00 -1.793 26 02:30:00
Mean Sea Level
Channel 1 Channel 2 January 31 0.595 31 0.594 February 28 0.627 28 0.626 March 31 0.328 31 0.327 April 30 0.325 30 0.324 May 31 0.273 31 0.272 June 30 0.252 30 0.251 July 31 0.322 31 0.319 August 31 0.356 31 0.353 September 30 0.324 30 0.322 October 31 0.563 31 0.559 November 19 0.596 30 0.54 December 0 * 31 0.414 TOTAL & AVG 323 0.415 365 0.408 * No mean sea level value as more than 15 days of data missing ** No yearly average value as more than one month’s MSL missing
132
UKCMF Annual Tide Gauge Report 2014
Ullapool – Tide Gauge Information Latitude 57° 53' 42.9" N Longitude 05° 09' 28.4" W Grid Ref NH 1293 9391 Instrument Data acquisition system with a full-tide bubbler gauge and a back-up
potentiometer attached to a Munro float gauge Location Tide Gauge Building On the Ullapool harbour pier
Measuring Points Below the tide gauge building Datum The delayed-mode data are to Admiralty Chart Datum (ACD).
The statistics in this report are to Ordnance Datum Newlyn (ODN). Benchmark Grid Ref Description TGBM NH 1288 9391 OSBM Pier NW Para 8.2M NE steps Aux1 NH 1303 9425 PA bolt Church SW side of road NE face N angle Aux2 NH 1288 9398 No 8 Shore Street SE face 0.3M S angle Aux3 NH 1253 9376 Rivet Fnd No 21 West Shore Street S angle Benchmark Relationships TGZ = Admiralty Chart Datum (ACD) TGZ = 2.75m below Ordnance Datum Newlyn (ODN) TGZ = 7.155m below TGBM Levelling No levelling was carried out in 2014 Site visits 03/10/2014 (Day 276) Maintenance. Compressor change. Water/damp damage
refurbishment. Notes on Data Quality The site met the agreed target of being operational for at least 75% of each calendar month in 2014.
133
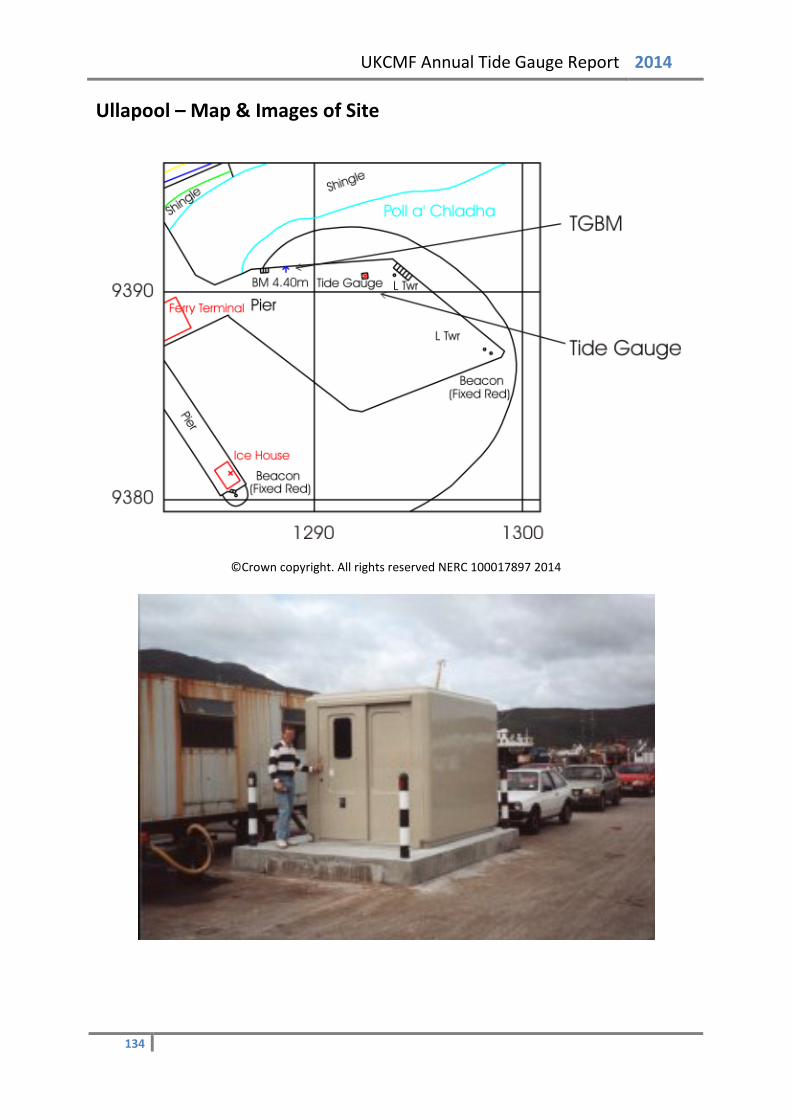
UKCMF Annual Tide Gauge Report 2014
Ullapool – Map & Images of Site
©Crown copyright. All rights reserved NERC 100017897 2014
134

UKCMF Annual Tide Gauge Report 2014
Ullapool – Statistics
Surge Maxima Surge Minima
Channel 1 Channel 2 Channel 1 Channel 2 Value Day Time Value Day Time Value Day Time Value Day Time
Jan 0.784 3 15:15:00 0.818 3 15:15:00 -0.35 29 09:45:00 -0.325 29 08:30:00 Feb 0.703 8 21:00:00 0.739 8 21:00:00 -0.184 16 04:30:00 -0.143 16 04:30:00 Mar 0.638 8 20:00:00 0.67 8 20:00:00 -0.356 26 11:15:00 -0.332 26 11:15:00 Apr 0.468 6 13:45:00 0.491 6 13:45:00 -0.219 21 07:15:00 -0.187 21 07:15:00 May 0.378 6 00:45:00 0.406 5 20:45:00 -0.294 23 09:00:00 -0.263 23 09:00:00 Jun 0.161 11 00:30:00 0.194 11 00:30:00 -0.288 17 06:00:00 -0.251 17 05:45:00 July -0.015 1 04:30:00 0.418 4 08:45:00 -0.081 1 04:00:00 -0.213 9 07:15:00 Aug 0.297 29 09:45:00 0.349 11 08:45:00 -0.178 15 11:30:00 -0.179 15 11:30:00 Sep 0.386 26 02:30:00 0.42 26 02:30:00 -0.225 13 07:15:00 -0.272 21 13:15:00 Oct 0.649 21 03:30:00 0.664 21 03:30:00 -0.298 22 01:15:00 -0.276 21 18:15:00 Nov 0.539 6 20:15:00 0.557 6 20:15:00 -0.248 5 00:00:00 -0.226 5 00:00:00 Dec 0.711 10 06:00:00 0.736 10 06:00:00 -0.564 28 05:45:00 -0.55 28 05:45:00
Extreme Maxima Extreme Minima
Channel 1 Channel 2 Channel 1 Channel 2 Value Day Time Value Day Time Value Day Time Value Day Time
Jan 3.465 3 08:00:00 3.502 3 08:00:00 -2.181 31 13:30:00 -2.15 31 13:30:00 Feb 3.458 1 07:45:00 3.5 1 07:45:00 -2.309 2 15:00:00 -2.279 2 15:00:00 Mar 3.212 3 08:00:00 3.247 3 08:00:00 -2.537 1 13:15:00 -2.508 1 13:15:00 Apr 2.673 1 08:00:00 2.701 1 07:30:00 -2.38 1 01:45:00 -2.357 1 01:45:00 May 2.522 17 20:45:00 2.551 17 20:45:00 -2.189 15 13:30:00 -2.163 15 13:30:00 Jun 2.462 14 19:45:00 2.491 14 19:45:00 -2.448 16 03:00:00 -2.424 16 03:00:00 July 0.556 1 00:00:00 2.986 14 20:15:00 -1.659 1 03:15:00 -2.39 15 02:45:00 Aug 3.162 12 20:15:00 3.204 12 20:00:00 -2.436 14 03:30:00 -2.451 13 02:30:00 Sep 3.004 10 19:45:00 3.028 10 19:45:00 -2.687 10 01:30:00 -2.666 10 01:30:00 Oct 3.137 8 18:30:00 3.169 8 18:30:00 -2.362 10 02:00:00 -2.334 10 02:00:00 Nov 3.128 6 18:45:00 3.15 6 18:45:00 -1.938 25 15:00:00 -1.917 25 15:00:00 Dec 2.926 24 08:15:00 2.934 24 08:15:00 -2.337 25 15:30:00 -2.329 25 15:30:00
Mean Sea Level
Channel 1 Channel 2 January 31 0.538 31 0.568 February 28 0.551 28 0.583 March 31 0.32 31 0.346 April 30 0.291 30 0.317 May 31 0.224 31 0.253 June 29 0.21 30 0.238 July 0 * 31 0.316 August 18 0.311 31 0.346 September 25 0.303 25 0.322 October 24 0.498 24 0.523 November 26 0.484 26 0.509 December 31 0.436 31 0.456 TOTAL & AVG 304 0.379 349 0.398 * No mean sea level value as more than 15 days of data missing ** No yearly average value as more than one month’s MSL missing
135
UKCMF Annual Tide Gauge Report 2014
Weymouth – Tide Gauge Information Latitude 50° 36' 30.6" N Longitude 02° 26' 52.6" W Grid Ref SY 6840 7885 Instrument Data acquisition system with two full-tide bubbler gauges Location Tide Gauge Building Commercial Pier, next to the ferry terminal
Measuring Points On the pier wall, directly in front of the tide gauge building
Datum The delayed-mode data are to Admiralty Chart Datum (ACD).
The statistics in this report are to Ordnance Datum Newlyn (ODN). Benchmark Grid Ref Description TGBM SY 6826 7882 Bolt corner of quay wall NW side N angle Aux1 SY 6822 7886 Bolt sea wall 5.5M W steps Aux2 SY 6813 7888 Right base NW pillar NE entrance Alexandra gardens Aux3 SY 6810 7893 Bolt sea wall 10.1M NW shelter Aux4 SY 6806 7908 Bolt N base STS aquarium E side of esplanade REFBM SY 6837 7884 Bolt concrete SW corner of building next to tide gauge hut Benchmark Relationships TGZ = Admiralty Chart Datum (ACD) TGZ = 1.02m below Ordnance Datum Newlyn (ODN) TGZ = 4.334m below TGBM Levelling No levelling was carried out in 2014 Site visits 15/01/2014 (Day 015) Clearing a pneumatic line blockage. 03/04/2014 (Day 093) Maintenance. Diving inspection and clear blocking channel - report
of damage to steelwork but data OK. Notes on Data Quality The site met the agreed target of being operational for at least 75% of each calendar month in 2014.
136
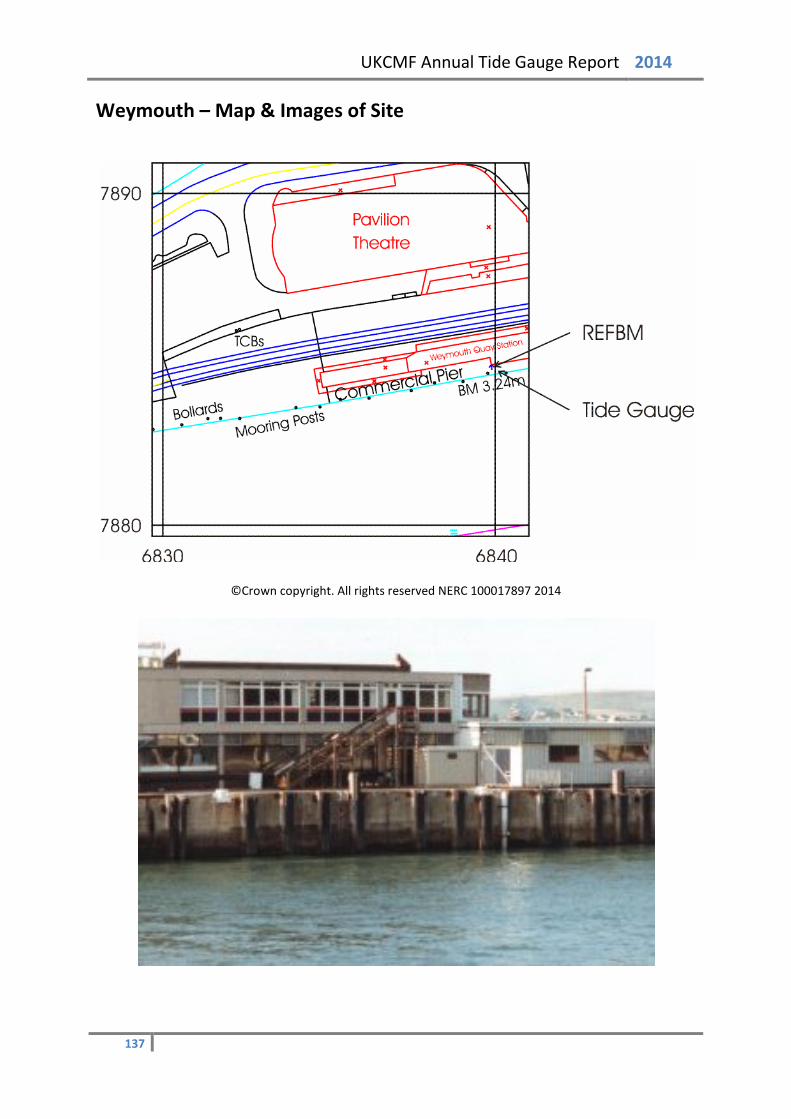
UKCMF Annual Tide Gauge Report 2014
Weymouth – Map & Images of Site
©Crown copyright. All rights reserved NERC 100017897 2014
137

UKCMF Annual Tide Gauge Report 2014
Weymouth – Statistics
Surge Maxima Surge Minima
Channel 1 Channel 2 Channel 1 Channel 2 Value Day Time Value Day Time Value Day Time Value Day Time
Jan 0.621 3 15:00:00 0.645 3 15:00:00 -0.434 25 08:00:00 -0.407 25 08:00:00 Feb 1.025 14 21:00:00 1.076 14 21:00:00 -0.335 6 05:30:00 -0.308 6 05:30:00 Mar 0.376 2 17:15:00 0.403 2 18:15:00 -0.347 15 00:00:00 -0.324 15 00:00:00 Apr 0.345 26 09:45:00 0.371 26 09:45:00 -0.298 16 01:15:00 -0.272 16 01:15:00 May 0.32 23 04:45:00 0.346 23 04:45:00 -0.376 15 13:15:00 -0.35 15 13:15:00 Jun 0.214 27 12:15:00 0.239 27 12:15:00 -0.269 17 07:00:00 -0.244 17 07:00:00 July 0.22 18 02:15:00 0.253 18 02:15:00 -0.223 16 14:30:00 -0.195 16 14:30:00 Aug 0.361 10 09:15:00 0.384 10 09:15:00 -0.209 16 15:30:00 -0.185 16 15:30:00 Sep 0.195 19 02:30:00 0.199 19 02:30:00 -0.205 1 16:45:00 -0.187 1 16:45:00 Oct 0.474 6 07:15:00 0.489 6 07:15:00 -0.224 22 23:00:00 -0.217 22 23:00:00 Nov 0.468 14 03:00:00 0.51 14 03:00:00 -0.178 25 02:15:00 -0.139 25 02:15:00 Dec 0.418 10 14:15:00 0.459 10 14:15:00 -0.549 10 03:30:00 -0.508 10 03:30:00
Extreme Maxima Extreme Minima
Channel 1 Channel 2 Channel 1 Channel 2 Value Day Time Value Day Time Value Day Time Value Day Time
Jan 1.989 3 08:00:00 2.015 3 08:00:00 -0.825 30 14:30:00 -0.799 30 14:30:00 Feb 1.965 14 19:45:00 2.004 14 19:45:00 -1.144 2 16:45:00 -1.116 2 16:45:00 Mar 1.834 3 08:30:00 1.861 3 08:30:00 -1.008 1 15:00:00 -0.983 1 15:00:00 Apr 1.544 2 08:45:00 1.569 2 08:45:00 -0.909 16 12:00:00 -0.884 16 12:00:00 May 1.281 1 20:00:00 1.306 1 20:15:00 -1.006 17 04:15:00 -0.982 17 04:15:00 Jun 1.356 14 19:45:00 1.381 14 20:00:00 -1.01 16 05:00:00 -0.986 16 05:00:00 July 1.569 14 20:30:00 1.596 14 20:30:00 -1.074 15 04:45:00 -1.048 15 04:45:00 Aug 1.702 12 20:15:00 1.725 12 20:15:00 -1.13 12 03:30:00 -1.106 12 03:30:00 Sep 1.721 10 20:00:00 1.717 10 20:00:00 -1.111 11 04:00:00 -1.111 11 04:00:00 Oct 1.872 8 18:45:00 1.879 8 18:45:00 -0.817 10 03:30:00 -0.817 10 03:30:00 Nov 1.749 6 18:30:00 1.779 6 18:30:00 -0.679 24 16:00:00 -0.64 24 16:00:00 Dec 1.431 24 08:30:00 1.462 24 08:30:00 -0.931 24 16:30:00 -0.903 24 16:30:00
Mean Sea Level
Channel 1 Channel 2 January 31 0.346 26 0.375 February 28 0.351 28 0.378 March 31 0.13 31 0.154 April 30 0.184 30 0.209 May 31 0.151 31 0.176 June 30 0.152 30 0.178 July 31 0.189 31 0.217 August 31 0.23 31 0.252 September 30 0.239 30 0.246 October 31 0.331 31 0.338 November 30 0.392 30 0.425 December 31 0.165 31 0.201 TOTAL & AVG 365 0.238 360 0.262 * No mean sea level value as more than 15 days of data missing ** No yearly average value as more than one month’s MSL missing
138
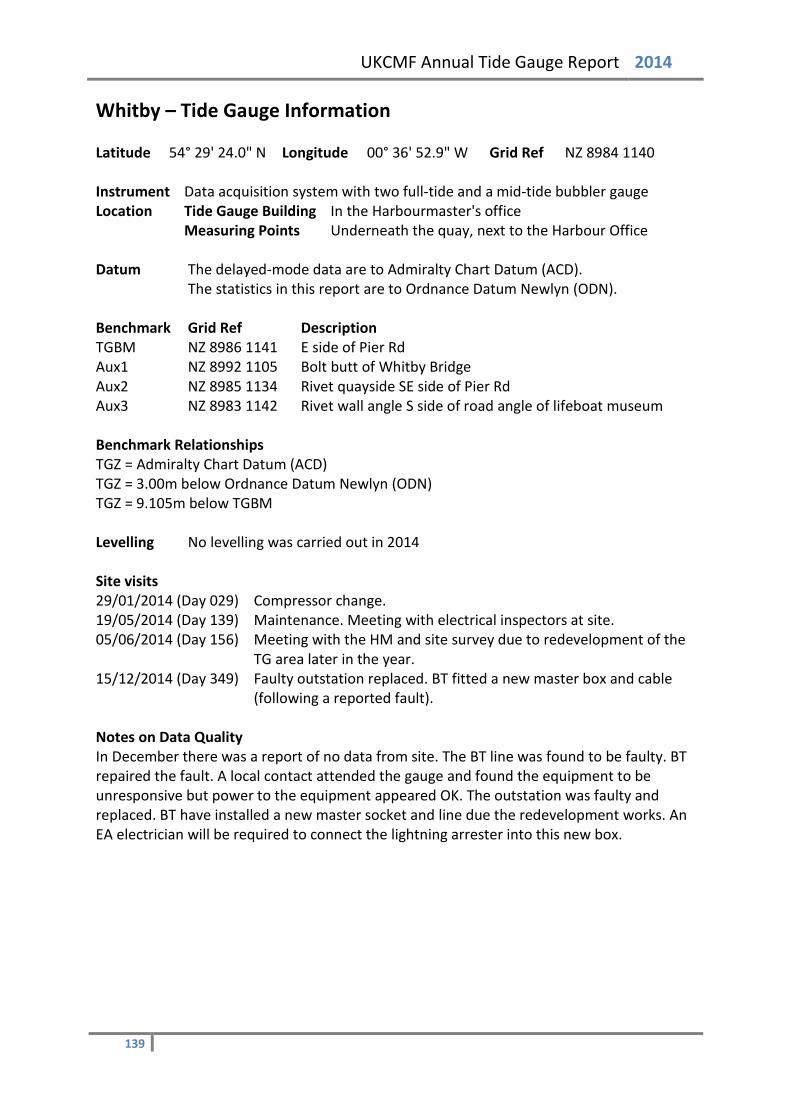
UKCMF Annual Tide Gauge Report 2014
Whitby – Tide Gauge Information Latitude 54° 29' 24.0" N Longitude 00° 36' 52.9" W Grid Ref NZ 8984 1140 Instrument Data acquisition system with two full-tide and a mid-tide bubbler gauge Location Tide Gauge Building In the Harbourmaster's office
Measuring Points Underneath the quay, next to the Harbour Office Datum The delayed-mode data are to Admiralty Chart Datum (ACD).
The statistics in this report are to Ordnance Datum Newlyn (ODN). Benchmark Grid Ref Description TGBM NZ 8986 1141 E side of Pier Rd Aux1 NZ 8992 1105 Bolt butt of Whitby Bridge Aux2 NZ 8985 1134 Rivet quayside SE side of Pier Rd Aux3 NZ 8983 1142 Rivet wall angle S side of road angle of lifeboat museum Benchmark Relationships TGZ = Admiralty Chart Datum (ACD) TGZ = 3.00m below Ordnance Datum Newlyn (ODN) TGZ = 9.105m below TGBM Levelling No levelling was carried out in 2014 Site visits 29/01/2014 (Day 029) Compressor change. 19/05/2014 (Day 139) Maintenance. Meeting with electrical inspectors at site. 05/06/2014 (Day 156) Meeting with the HM and site survey due to redevelopment of the
TG area later in the year. 15/12/2014 (Day 349) Faulty outstation replaced. BT fitted a new master box and cable
(following a reported fault). Notes on Data Quality In December there was a report of no data from site. The BT line was found to be faulty. BT repaired the fault. A local contact attended the gauge and found the equipment to be unresponsive but power to the equipment appeared OK. The outstation was faulty and replaced. BT have installed a new master socket and line due the redevelopment works. An EA electrician will be required to connect the lightning arrester into this new box.
139
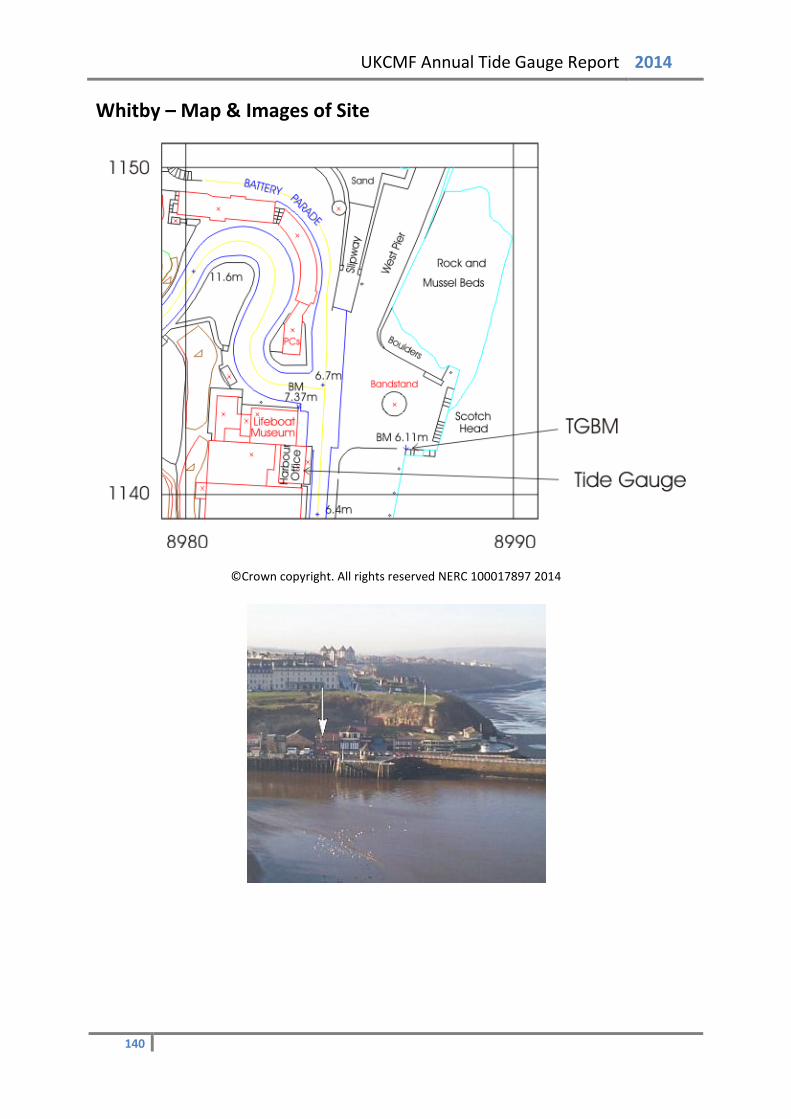
UKCMF Annual Tide Gauge Report 2014
Whitby – Map & Images of Site
©Crown copyright. All rights reserved NERC 100017897 2014
140

UKCMF Annual Tide Gauge Report 2014
Whitby – Statistics
Surge Maxima Surge Minima
Channel 1 Channel 2 Channel 1 Channel 2 Value Day Time Value Day Time Value Day Time Value Day Time
Jan 3.046 28 15:00:00 0.663 4 14:30:00 -0.711 24 22:45:00 -0.711 24 22:45:00 Feb 0.536 24 18:00:00 0.538 24 18:00:00 -0.551 13 00:30:00 -0.55 13 00:30:00 Mar 0.954 14 23:45:00 0.953 14 23:45:00 -0.586 8 15:30:00 -0.584 8 15:30:00 Apr 0.563 12 23:45:00 0.566 12 23:45:00 -0.195 15 23:30:00 -0.196 15 12:00:00 May 0.429 6 20:15:00 0.427 6 20:15:00 -0.179 14 23:15:00 -0.177 14 23:15:00 Jun 0.394 19 06:00:00 0.401 19 06:00:00 -0.065 17 15:15:00 -0.056 17 15:15:00 July 0.434 5 00:00:00 0.444 5 00:00:00 -0.074 16 17:30:00 -0.062 16 17:30:00 Aug 0.466 10 13:00:00 0.477 10 13:00:00 -0.162 3 18:15:00 -0.148 3 18:15:00 Sep 0.586 26 12:30:00 0.594 26 12:30:00 -0.125 11 14:00:00 -0.117 11 14:00:00 Oct 1.188 21 20:15:00 1.2 21 20:15:00 -0.215 6 11:45:00 -0.208 6 11:45:00 Nov 0.434 8 10:15:00 0.442 8 10:15:00 -0.254 6 17:30:00 -0.247 6 17:30:00 Dec 0.562 16 13:30:00 0.565 22 11:15:00 -0.312 21 05:45:00 -0.309 21 05:45:00
Extreme Maxima Extreme Minima
Channel 1 Channel 2 Channel 1 Channel 2 Value Day Time Value Day Time Value Day Time Value Day Time
Jan 4.696 28 15:00:00 3.464 4 18:00:00 -2.239 6 00:45:00 -2.232 6 00:45:00 Feb 3.233 2 17:45:00 3.234 2 17:45:00 -2.21 4 00:30:00 -2.206 4 00:30:00 Mar 3.185 3 17:15:00 3.182 3 17:15:00 -2.243 5 01:00:00 -2.235 5 01:00:00 Apr 2.988 17 17:15:00 2.987 17 17:15:00 -2.241 15 22:15:00 -2.231 15 22:15:00 May 2.743 17 05:15:00 2.745 17 05:15:00 -2.17 14 22:00:00 -2.164 14 22:00:00 Jun 2.82 16 05:45:00 2.827 16 05:45:00 -2.261 15 11:30:00 -2.236 15 11:30:00 July 3.1 15 05:45:00 3.109 15 05:45:00 -2.265 16 12:15:00 -2.236 16 12:15:00 Aug 3.311 13 05:15:00 3.321 13 05:15:00 -2.218 14 12:15:00 -2.204 14 12:15:00 Sep 3.265 10 04:15:00 3.273 10 04:15:00 -2.256 9 09:15:00 -2.235 10 23:00:00 Oct 3.318 9 03:45:00 3.323 9 03:45:00 -2.242 8 09:45:00 -2.231 8 09:45:00 Nov 3.087 8 04:15:00 3.092 8 04:15:00 -2.163 6 09:30:00 -2.153 6 09:30:00 Dec 3.087 23 16:30:00 3.089 23 16:30:00 -2.237 26 00:45:00 -2.223 26 00:45:00
Mean Sea Level
Channel 1 Channel 2 January 31 0.452 31 0.453 February 28 0.483 28 0.484 March 31 0.424 31 0.423 April 30 0.44 30 0.44 May 31 0.404 31 0.407 June 30 0.428 30 0.434 July 30 0.475 30 0.486 August 29 0.503 29 0.514 September 28 0.501 28 0.511 October 31 0.604 31 0.612 November 30 0.557 30 0.562 December 23 0.549 23 0.551 TOTAL & AVG 352 0.485 352 0.490 * No mean sea level value as more than 15 days of data missing ** No yearly average value as more than one month’s MSL missing
141
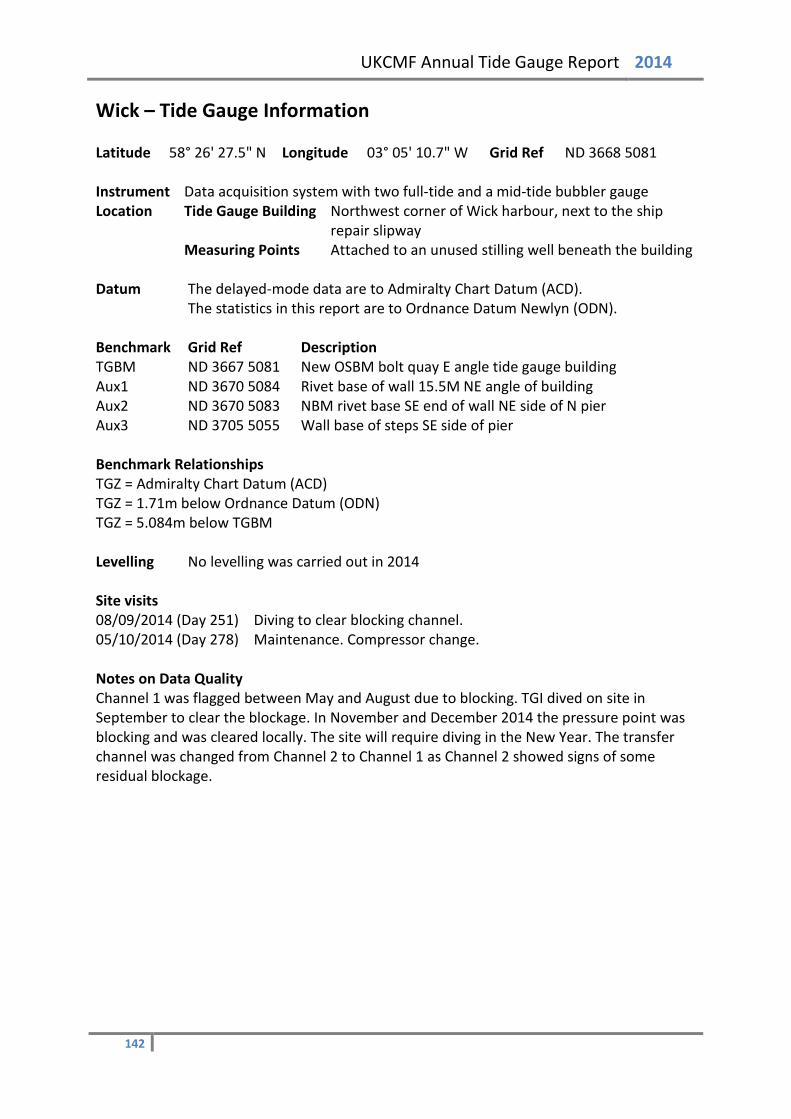
UKCMF Annual Tide Gauge Report 2014
Wick – Tide Gauge Information Latitude 58° 26' 27.5" N Longitude 03° 05' 10.7" W Grid Ref ND 3668 5081 Instrument Data acquisition system with two full-tide and a mid-tide bubbler gauge Location Tide Gauge Building Northwest corner of Wick harbour, next to the ship
repair slipway Measuring Points Attached to an unused stilling well beneath the building
Datum The delayed-mode data are to Admiralty Chart Datum (ACD).
The statistics in this report are to Ordnance Datum Newlyn (ODN). Benchmark Grid Ref Description TGBM ND 3667 5081 New OSBM bolt quay E angle tide gauge building Aux1 ND 3670 5084 Rivet base of wall 15.5M NE angle of building Aux2 ND 3670 5083 NBM rivet base SE end of wall NE side of N pier Aux3 ND 3705 5055 Wall base of steps SE side of pier Benchmark Relationships TGZ = Admiralty Chart Datum (ACD) TGZ = 1.71m below Ordnance Datum (ODN) TGZ = 5.084m below TGBM Levelling No levelling was carried out in 2014 Site visits 08/09/2014 (Day 251) Diving to clear blocking channel. 05/10/2014 (Day 278) Maintenance. Compressor change. Notes on Data Quality Channel 1 was flagged between May and August due to blocking. TGI dived on site in September to clear the blockage. In November and December 2014 the pressure point was blocking and was cleared locally. The site will require diving in the New Year. The transfer channel was changed from Channel 2 to Channel 1 as Channel 2 showed signs of some residual blockage.
142
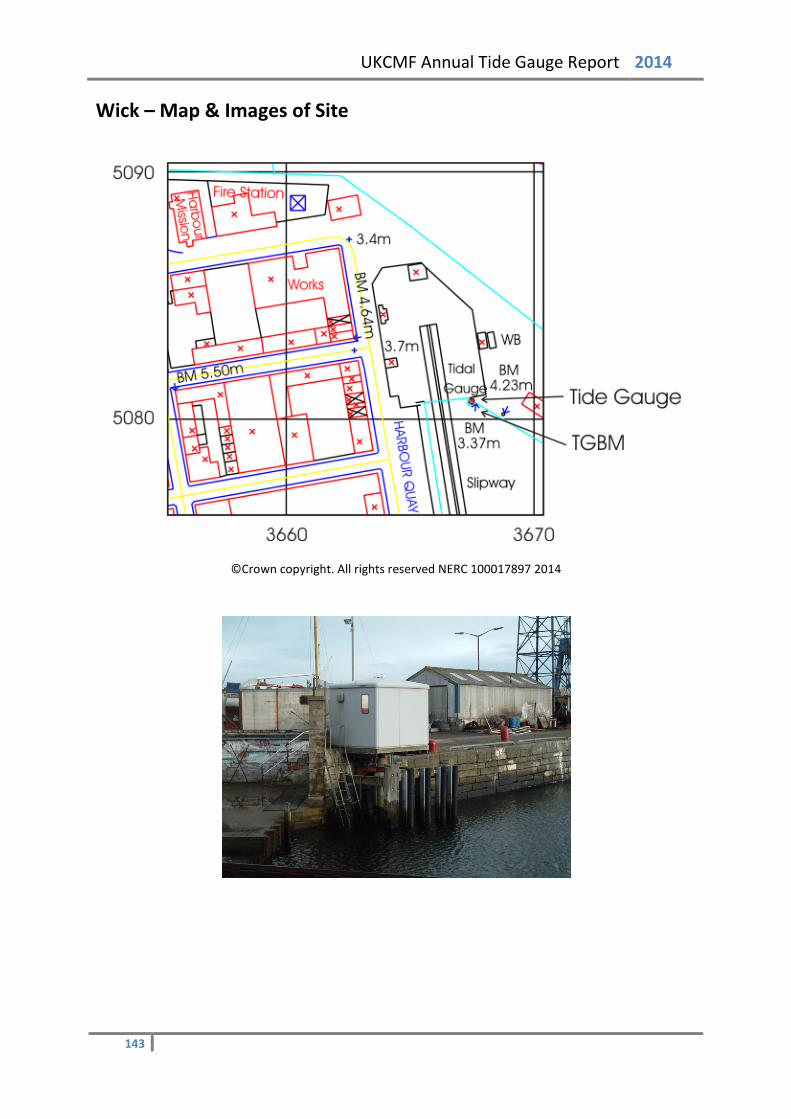
UKCMF Annual Tide Gauge Report 2014
Wick – Map & Images of Site
©Crown copyright. All rights reserved NERC 100017897 2014
143

UKCMF Annual Tide Gauge Report 2014
Wick – Statistics
Surge Maxima Surge Minima
Channel 1 Channel 2 Channel 1 Channel 2 Value Day Time Value Day Time Value Day Time Value Day Time
Jan 0.587 6 13:00:00 0.564 6 13:00:00 -0.309 29 20:15:00 -0.311 29 20:15:00 Feb 0.585 9 04:30:00 0.583 9 04:30:00 -0.113 19 09:45:00 -0.116 19 09:45:00 Mar 0.556 21 04:15:00 0.554 21 04:15:00 -0.311 28 19:30:00 -0.315 28 19:30:00 Apr 0.446 12 19:15:00 0.438 12 19:15:00 -0.14 15 07:00:00 -0.15 15 07:00:00 May 0.368 6 18:45:00 -0.214 23 12:45:00 Jun 0.162 10 16:00:00 -0.208 17 08:15:00 July 0.389 4 17:00:00 -0.152 9 12:15:00 Aug 0.208 5 23:45:00 -0.135 27 01:15:00 Sep 4.51 8 09:15:00 0.355 26 06:30:00 -0.228 13 13:15:00 -0.23 13 13:15:00 Oct 0.586 26 10:15:00 0.583 26 10:15:00 -0.149 14 03:30:00 -0.153 14 03:30:00 Nov 0.386 2 12:15:00 0.382 2 12:15:00 -0.176 5 05:30:00 -0.179 17 23:00:00 Dec 0.629 10 18:15:00 0.612 9 21:45:00 -0.471 28 08:15:00 -0.2 5 20:00:00
Extreme Maxima Extreme Minima
Channel 1 Channel 2 Channel 1 Channel 2 Value Day Time Value Day Time Value Day Time Value Day Time
Jan 2.58 4 13:00:00 2.153 6 13:30:00 -1.348 30 16:45:00 -1.351 30 16:45:00 Feb 2.468 2 13:00:00 2.466 2 13:00:00 -1.257 2 19:15:00 -1.259 2 19:15:00 Mar 2.248 3 12:30:00 2.246 3 12:30:00 -1.558 29 16:00:00 -1.563 29 16:00:00 Apr 1.95 1 12:15:00 1.943 1 12:15:00 -1.348 1 18:15:00 -1.357 1 18:15:00 May 1.849 18 01:15:00 -1.276 14 16:45:00 Jun 1.774 13 23:30:00 -1.502 15 06:30:00 July 2.188 15 00:45:00 -1.459 14 06:15:00 Aug 1.821 29 01:00:00 -1.171 27 06:00:00 Sep 6.002 8 09:15:00 2.196 11 00:15:00 -1.58 10 05:30:00 -1.583 10 05:30:00 Oct 2.336 8 23:00:00 2.333 8 23:00:00 -1.22 10 06:00:00 -1.222 10 06:00:00 Nov 2.248 6 22:45:00 2.245 6 22:45:00 -1.162 5 03:45:00 -1.165 5 03:45:00 Dec 2.265 23 12:15:00 2.067 10 01:15:00 -1.432 25 19:45:00 -0.993 6 04:30:00
Mean Sea Level
Channel 1 Channel 2 January 25 0.531 19 0.456 February 28 0.551 28 0.549 March 31 0.344 31 0.341 April 12 * 27 0.3 May 0 * 31 0.257 June 0 * 30 0.258 July 0 * 31 0.332 August 0 * 16 0.339 September 22 0.36 30 0.345 October 31 0.557 31 0.554 November 23 0.519 23 0.515 December 20 0.468 0 * TOTAL & AVG 192 ** 297 0.386 * No mean sea level value as more than 15 days of data missing ** No yearly average value as more than one month’s MSL missing
144
UKCMF Annual Tide Gauge Report 2014
Workington – Tide Gauge Information Latitude 54° 39' 02.6" N Longitude 03° 34' 01.8" W Grid Ref NX 9898 2953 Instrument Data acquisition system with two full-tide bubbler gauges Location Tide Gauge Building North side of the dock entrance
Measuring Points Behind fender piles on the north seaward side of the dock gates
Datum The delayed-mode data are to Admiralty Chart Datum (ACD).
The statistics in this report are to Ordnance Datum Newlyn (ODN). Benchmark Grid Ref Description Aux1 NX 9917 2928 Building SW face 3.7M from S angle Workington Dock Aux2 NX 9948 2967 NBM works building S side Rd N face NE angle Benchmark Relationships TGZ = Admiralty Chart Datum (ACD) TGZ = 4.20m below Ordnance Datum Newlyn (ODN) TGZ = 11.59m below Aux1 Levelling No levelling was carried out in 2014 Site visits 14/05/2014 (Day 134) Meeting with electrical inspectors at site. 10/11/2014 (Day 314) Maintenance. Compressor change. Notes on Data Quality The site met the agreed target of being operational for at least 75% of each calendar month in 2014.
145
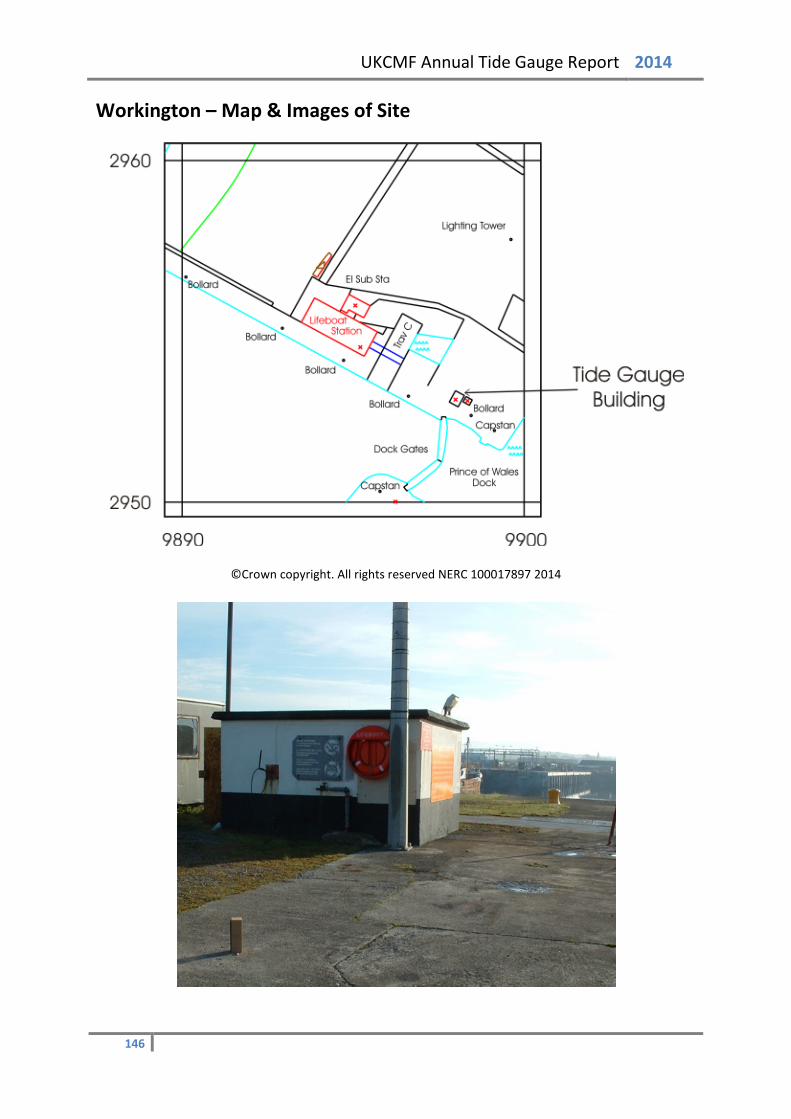
UKCMF Annual Tide Gauge Report 2014
Workington – Map & Images of Site
©Crown copyright. All rights reserved NERC 100017897 2014
146

UKCMF Annual Tide Gauge Report 2014
Workington – Statistics
Surge Maxima Surge Minima
Channel 1 Channel 2 Channel 1 Channel 2 Value Day Time Value Day Time Value Day Time Value Day Time
Jan 1.068 3 16:00:00 1.048 3 16:00:00 -0.473 26 03:15:00 -0.479 26 03:15:00 Feb 1.86 12 17:30:00 1.859 12 17:30:00 -0.278 28 18:30:00 -0.631 28 13:15:00 Mar 0.707 20 09:00:00 0.705 20 09:00:00 -0.506 25 21:30:00 -0.5 25 21:30:00 Apr 0.587 6 13:30:00 0.591 6 13:15:00 -0.371 20 22:00:00 -0.373 20 22:00:00 May 0.468 10 18:00:00 0.471 10 18:00:00 -0.409 23 21:15:00 -0.408 23 21:00:00 Jun 0.173 10 18:15:00 0.175 10 18:15:00 -0.358 17 17:15:00 -0.351 17 17:15:00 July 0.364 4 08:30:00 0.37 4 08:30:00 -0.316 9 11:45:00 -0.309 9 12:15:00 Aug 0.445 29 07:15:00 0.44 29 07:15:00 -0.243 18 03:30:00 -0.246 18 03:30:00 Sep 0.139 26 06:30:00 0.141 26 06:30:00 -0.283 1 13:00:00 -0.286 1 13:15:00 Oct 1.012 21 04:30:00 1.009 21 04:30:00 -0.53 21 19:30:00 -0.531 21 19:30:00 Nov 0.716 1 22:00:00 0.723 1 22:00:00 -0.345 5 12:15:00 -0.344 5 12:30:00 Dec 0.812 9 18:45:00 0.821 9 18:45:00 -0.689 28 01:45:00 -0.686 28 01:45:00
Extreme Maxima Extreme Minima
Channel 1 Channel 2 Channel 1 Channel 2 Value Day Time Value Day Time Value Day Time Value Day Time
Jan 5.716 3 12:30:00 5.696 3 12:30:00 -3.519 4 20:00:00 -3.542 4 20:00:00 Feb 5.576 1 12:15:00 5.573 1 12:15:00 -3.792 2 19:45:00 -3.804 2 19:45:00 Mar 5.196 2 12:00:00 5.17 2 12:00:00 -3.927 3 19:30:00 -3.927 3 19:30:00 Apr 4.622 1 12:15:00 4.622 1 12:15:00 -3.744 1 19:00:00 -3.74 1 19:00:00 May 4.241 18 01:30:00 4.239 18 01:30:00 -3.594 17 07:15:00 -3.624 17 07:15:00 Jun 4.266 15 00:30:00 4.259 15 00:30:00 -3.812 16 07:45:00 -3.819 16 07:45:00 July 4.752 15 01:00:00 4.746 15 01:00:00 -3.945 15 07:45:00 -3.952 15 07:45:00 Aug 5.051 13 00:45:00 5.046 13 00:45:00 -3.909 13 07:15:00 -3.916 13 07:15:00 Sep 4.919 11 00:15:00 4.912 11 00:15:00 -3.911 10 18:30:00 -4.109 10 06:15:00 Oct 5.14 8 23:15:00 5.138 8 23:15:00 -3.566 10 06:30:00 -3.567 10 06:30:00 Nov 4.947 6 23:00:00 4.943 6 23:00:00 -3.284 5 04:00:00 -3.28 5 04:00:00 Dec 4.6 23 12:00:00 4.602 23 12:00:00 -3.623 25 20:15:00 -3.617 25 20:15:00
Mean Sea Level
Channel 1 Channel 2 January 31 0.577 31 0.571 February 26 0.687 28 0.649 March 28 0.248 31 0.261 April 30 0.261 30 0.261 May 31 0.228 31 0.229 June 30 0.207 30 0.207 July 29 0.26 31 0.265 August 30 0.341 31 0.335 September 22 0.276 30 0.268 October 31 0.513 31 0.514 November 30 0.495 30 0.496 December 31 0.361 31 0.366 TOTAL & AVG 349 0.371 365 0.369 * No mean sea level value as more than 15 days of data missing ** No yearly average value as more than one month’s MSL missing
147