compensation study for executives in switzerland hcm swiss 100
TRANSCRIPT
Compensation Study for Executives in Switzerland
HCM Swiss 100
hcm.com
July 2020

2 H C M S W I SS 1 0 0
4 Executive summary
6 Data sample
7 Methodology
8 Compensation level Chief Executive Officer Other Executive Board members
14 Compensation structure Chief Executive Officer Other Executive Board members
18 Variable compensation design Annual bonus Long-term incentive awards
28 Equity ownership guidelines
30 Overall view on executive compensation

3 H C M S W I SS 1 0 0
Compensation levelA company’s size remained the primary determinant of the compensation level for Chief Executive Officers (CEO) and other Executive Board (EB) members, respectively.
At median, the total direct compensation level for CEOs in SMI companies was 1.7 times higher than that of CEOs in SMIM firms, and 4.5 times higher than in smaller mid-caps. The adjacent figures for other EB members were 1.9 and 4.1 times.
Compensation structureVariable compensation elements constituted a major part of executive compensation packages and correlated with company size with larger companies putting more emphasis on variable pay and LTI awards in particular. The largest proportion of variable compensation (around 55 to 65 percent of total direct compensation) was observed among health care companies.
Annual bonusMedian annual bonus target opportunities were observed to lie at 90 percent of CEO base salaries and at 60 percent for other EB members. Annual bonus caps varied between 150 (CEO) and 100 (other EB members) percent of base salary, respectively. Larger companies in the SMI group typically employed higher leveraged annual bonus plans with a maximum bonus opportunity amounting to between 150 and 200 percent of base salary.
Earning and/or revenue KPIs prevailed among the determinants of annual bonuses (used by 93 percent and 64 percent of companies, respectively) across all size and industry groups. Moreover, slightly over 40 percent of sampled companies deferred around 50 percent of the annual bonus.
Executive summary
Total direct compensation
CHF 2.09 million for CEOs
CHF 0.95 million for other EB members
Variable compensation in % of total pay package
58% for CEOs
52% for other EB members
Annual bonus target opportunity
90% of base salary for CEOs
60% of base salary for other EB members
Most often used annual bonus KPIs
93% of companies use earning measures
64% of companies use revenue

4 H C M S W I SS 1 0 0
Long-term incentive awardsWith regards to funding, an almost equal split in performance-driven (mostly deferral of annual bonus) and stand-alone LTI (independent from realized annual performance and budgeted grant) allocations was observed in 2019. LTI plans with a budgeted grant level were seemingly preferred by all industries with the exception of the financials industry, where performance-driven grants were more common (mostly regulatory-driven).
Performance shares led the list of LTI instruments granted independently from realized (annual) performance (60% of stand-alone plans).
When taking a closer look at vesting, total shareholder return (TSR) was the most prevalent performance measure for LTI plans with performance-based vesting (used by 58 percent of companies). TSR was mainly used in combination with another metric, typically return on (employed/invested) capital (ROC) or earnings per share (EPS).
Equity ownership guidelines36 percent of analyzed companies specified equity ownership guidelines/requirements, with the intent of strengthening the alignment between shareholder and manager interests.
Ownership requirements were typically defined as a multiple of base salary and amounted to an average of 300 percent of base salary for CEOs and 200 percent of base salary for other EB members. This translated into a median monetary value of CHF 2.63 million (CEO) and CHF 1.06 million (other EB members).
In addition, ten companies (10 percent) specified additional post-vesting blocking periods to vested LTI awards.
Funding approach for LTI awards
48% performance-driven grants
52% stand-alone grants
LTI KPIs
58% of companies use total shareholder return
31% of companies use return on capital
Equity ownership guidelines
1 in 3 companies specified equity
ownership guidelines
300% of base salary for CEOs
200% of base salary for other EB members

5 H C M S W I SS 1 0 0
This study is based on publicly available data published in compensation reports of the largest 100 Swiss-listed companies, i.e. constituents of the Swiss Performance Index (SPI), in terms of their respective market capitalization as of December 31, 2019 (“HCM Swiss 100”). In total, 98 companies of the HCM Swiss 100 – which published their reports before June 30, 2020 – were analyzed.
To provide more structured insights, the data is segmented by size and industry. The following three size groups are applied:
■ SMI – the Swiss blue-chip index that includes the 20 largest stocks in the SPI with a market capitalization between CHF 10.0 and 311.8 billion.
■ SMIM – the Swiss mid-cap index that includes the next 30 largest stocks not already included in the SMI index, or 27 companies if dual listings are not considered. Market capitalization for this group varied between CHF 2.9 and 25.9 billion.
■ Smaller mid-caps – 53 further companies of the SPI not included in the SMI or SMIM. Market capitalization of smaller mid-caps lied between CHF 1.1 and 6.8 billion.
The industry groups are based on the Industry Classification Benchmark. Separate assessments are shown for the four most significant industries: consumer goods, financials, health care, and industrials, accounting for 93 percent of the HCM Swiss 100 in terms of market capitalization.
Some companies were excluded from the analysis due to disclosure and comparability reasons1. The sample sizes applicable per data point are reported throughout the study.
Figure 1 specifies the number of companies in each size and industry group in the HCM Swiss 100 and provides an overview of the average market capitalization per company in each group.
Data sample
Sm
alle
r mid
-cap
s
Basic Materials
ConsumerGoods
ConsumerServices
Financials
Industrials
HealthCare
Technology
Telecom
Bubble size corresponds to the average market capitalization, whilethe number corresponds to the number of companies in an industry-size group.
Utilities
SM
I
SM
IM
HC
M S
wis
s 10
0(a
ggre
gate
vie
w)
1
5
3
18
8
14
3
2
4
6
2
103
1 2 3
2
1
5 7 30
4 153
6 8 28
3
1 2
Figure 1: Sample of companies by industry
and size
1 For details on our methodology, please refer to the section: “Methodology”
6 H C M S W I SS 1 0 0
While the compensation of the CEO (or more precisely: the highest-paid EB member) is disclosed separately, lump-sum disclosure in relation to the compensation of other EB members is a prevailing market practice and the level of detail is further required by law in Switzerland. Among the companies analyzed, only 10 percent disclose compensation figures individually per EB member. Therefore, compensation packages are analyzed individually for CEOs and on average for other EB members (i.e. any EB member other than the CEO). To ensure comparability, CEOs not in office for the full year are excluded from any trend analyses.
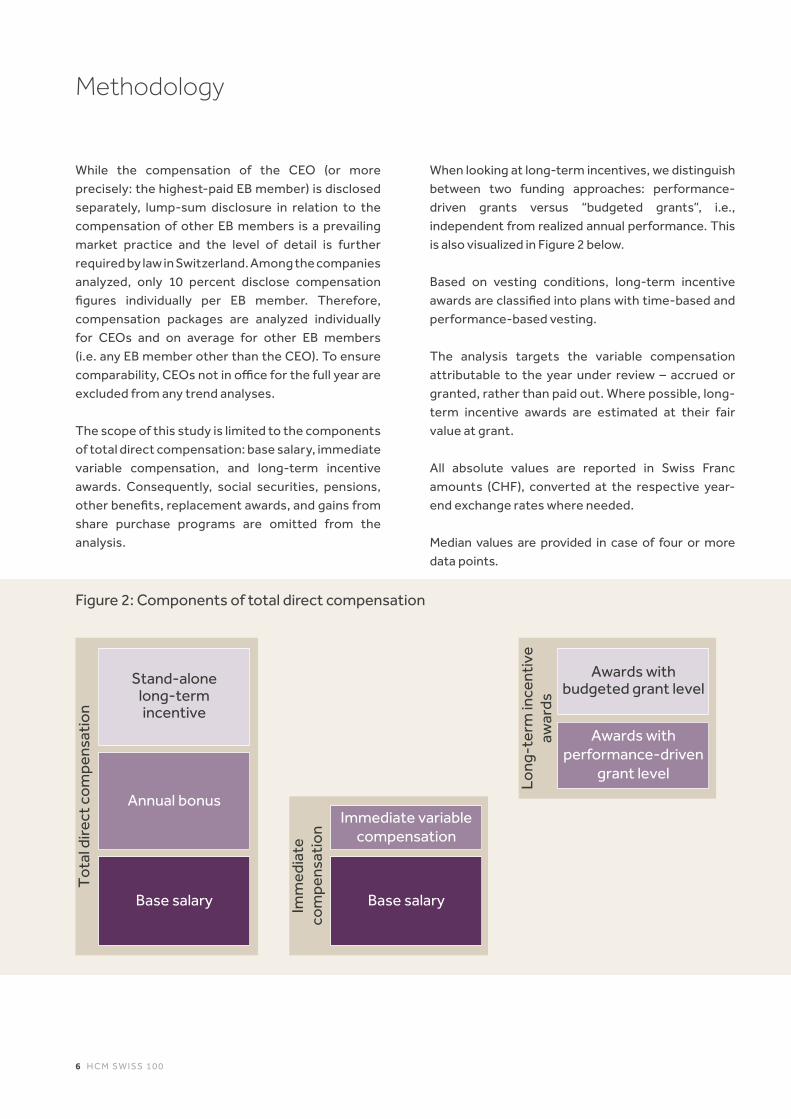
The scope of this study is limited to the components of total direct compensation: base salary, immediate variable compensation, and long-term incentive awards. Consequently, social securities, pensions, other benefits, replacement awards, and gains from share purchase programs are omitted from the analysis.
When looking at long-term incentives, we distinguish between two funding approaches: performance-driven grants versus “budgeted grants”, i.e., independent from realized annual performance. This is also visualized in Figure 2 below.
Based on vesting conditions, long-term incentive awards are classified into plans with time-based and performance-based vesting.
The analysis targets the variable compensation attributable to the year under review – accrued or granted, rather than paid out. Where possible, long-term incentive awards are estimated at their fair value at grant.
All absolute values are reported in Swiss Franc amounts (CHF), converted at the respective year-end exchange rates where needed.
Median values are provided in case of four or more data points.
Methodology
Imm
edia
te
com
pens
atio
n
Long
-ter
m in
cent
ive
awar
ds
Tota
l dire
ct c
ompe
nsat
ion
Base salary
Annual bonus
Stand-alonelong-termincentive
Immediate variable compensation
Awards with performance-driven
grant level
Base salary
Awards with budgeted grant level
Figure 2: Components of total direct compensation
7 H C M S W I SS 1 0 0
Regular reviews of executive compensation are conducted by the majority of the companies analyzed, most often on an annual basis. Such internal reviews are typically related to the pay package in terms of compensation level and/or structure. Moreover, the HCM Swiss 100 firms commonly conduct periodical external benchmarks against peer companies that are comparable in terms of size, nature, and business complexity.
Chief Executive Officer
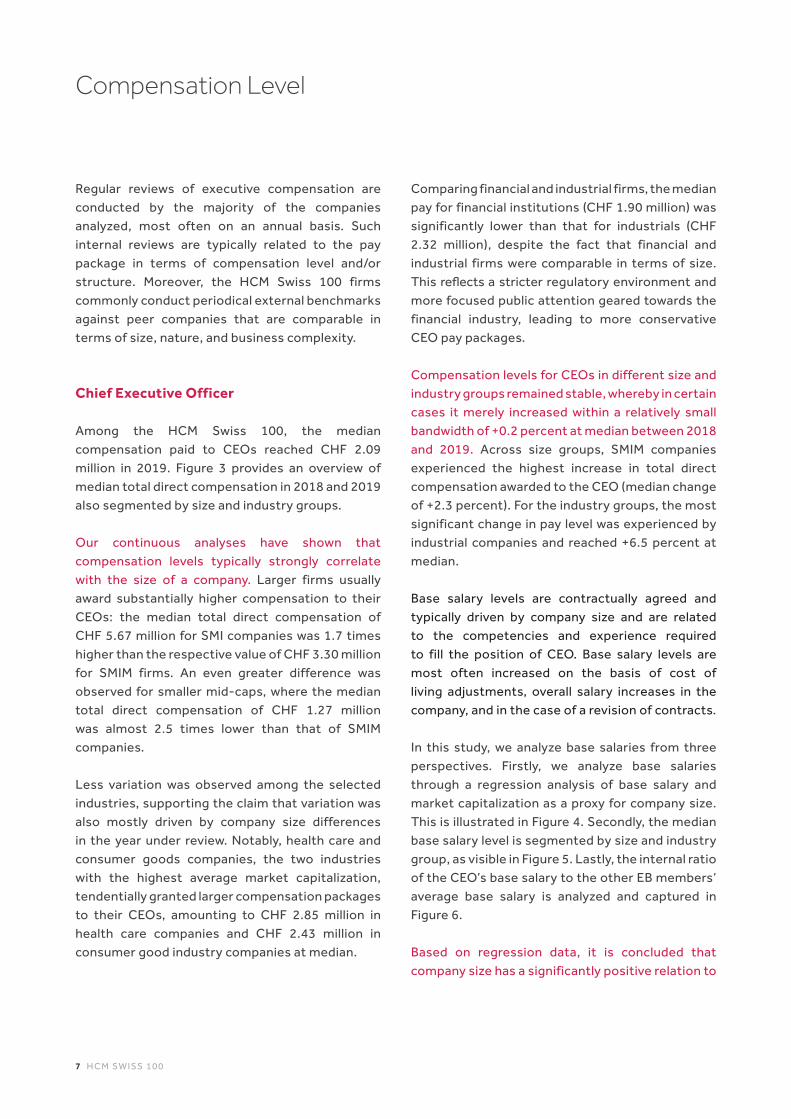
Among the HCM Swiss 100, the median compensation paid to CEOs reached CHF 2.09 million in 2019. Figure 3 provides an overview of median total direct compensation in 2018 and 2019 also segmented by size and industry groups.
Our continuous analyses have shown that compensation levels typically strongly correlate with the size of a company. Larger firms usually award substantially higher compensation to their CEOs: the median total direct compensation of CHF 5.67 million for SMI companies was 1.7 times higher than the respective value of CHF 3.30 million for SMIM firms. An even greater difference was observed for smaller mid-caps, where the median total direct compensation of CHF 1.27 million was almost 2.5 times lower than that of SMIM companies.
Less variation was observed among the selected industries, supporting the claim that variation was also mostly driven by company size differences in the year under review. Notably, health care and consumer goods companies, the two industries with the highest average market capitalization, tendentially granted larger compensation packages to their CEOs, amounting to CHF 2.85 million in health care companies and CHF 2.43 million in consumer good industry companies at median.
Comparing financial and industrial firms, the median pay for financial institutions (CHF 1.90 million) was significantly lower than that for industrials (CHF 2.32 million), despite the fact that financial and industrial firms were comparable in terms of size. This reflects a stricter regulatory environment and more focused public attention geared towards the financial industry, leading to more conservative CEO pay packages.
Compensation levels for CEOs in different size and industry groups remained stable, whereby in certain cases it merely increased within a relatively small bandwidth of +0.2 percent at median between 2018 and 2019. Across size groups, SMIM companies experienced the highest increase in total direct compensation awarded to the CEO (median change of +2.3 percent). For the industry groups, the most significant change in pay level was experienced by industrial companies and reached +6.5 percent at median.
Base salary levels are contractually agreed and typically driven by company size and are related to the competencies and experience required to fill the position of CEO. Base salary levels are most often increased on the basis of cost of living adjustments, overall salary increases in the company, and in the case of a revision of contracts.
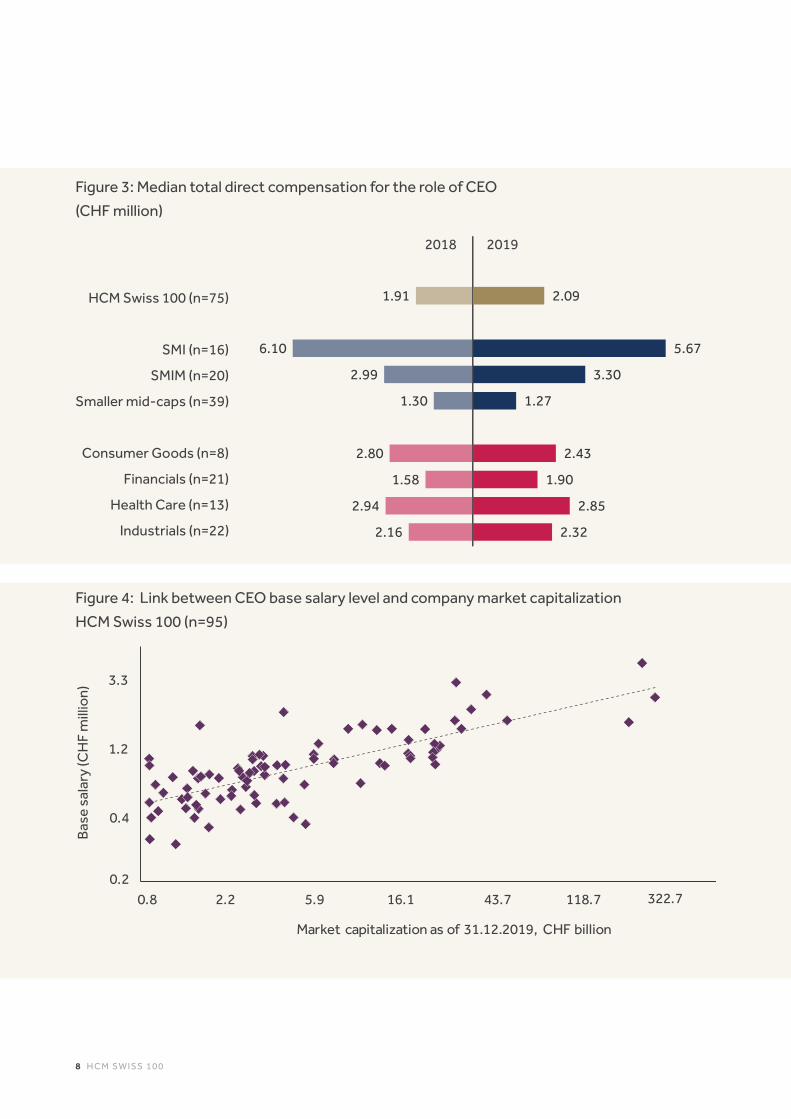
In this study, we analyze base salaries from three perspectives. Firstly, we analyze base salaries through a regression analysis of base salary and market capitalization as a proxy for company size. This is illustrated in Figure 4. Secondly, the median base salary level is segmented by size and industry group, as visible in Figure 5. Lastly, the internal ratio of the CEO’s base salary to the other EB members’ average base salary is analyzed and captured in Figure 6.
Based on regression data, it is concluded that company size has a significantly positive relation to
Compensation Level
8 H C M S W I SS 1 0 0
Figure 3: Median total direct compensation for the role of CEO
(CHF million)
HCM Swiss 100 (n=75)
SMI (n=16)
SMIM (n=20)
Smaller mid-caps (n=39)
Consumer Goods (n=8)
Financials (n=21)
Health Care (n=13)
Industrials (n=22)
20192018
1.91
6.10
2.99
1.30
2.80
1.58
2.94
2.16
2.09
5.67
3.30
1.27
2.43
1.90
2.85
2.32
Bas
e sa
lary
(CH
F m
illio
n)
0.8
0.4
1.2
3.3
Market capitalization as of 31.12.2019, CHF billion
2.2 5.9 16.1 43.7 118.7 322.70.2
Figure 4: Link between CEO base salary level and company market capitalization
HCM Swiss 100 (n=95)

9 H C M S W I SS 1 0 0
the CEO base salary and explains approximately 57 percent of its variation.
A similar conclusion about the size factor can be drawn from the data illustrated in Figure 5. The median base salary for CEOs amounted to CHF 0.62 million for smaller mid-caps, increasing to CHF 0.95 million for SMIM firms, and reaching the highest value of CHF 1.50 million for SMI companies in 2019.
From an industry perspective, median base salary for financial, health care and industrial company CEOs did not disperse much from the overall median of CHF 0.83 million for 2019. Notably, slightly higher base salaries of CHF 1.07 million were observed in consumer goods companies.
As highlighted in Figure 6, the internal ratio between the CEO’s base salary as a multiple of the average base salary for other EB members remained in line with 2018. At median, the CEO base salary was 1.84 times higher than for other EB members on average in 2019 (compared to 1.77 times in 2018). The median pay gap was wider for SMI companies (1.90) and narrower for smaller mid-cap companies (1.77).
The levels of variable pay exhibited more variance than those of base salary across size and industry groups and were found to be the main driver of differences in total direct compensation levels.
The overall median level of immediate variable compensation for the role of CEO increased in 2019 compared to the previous year (CHF 0.55 million in 2019 versus CHF 0.48 million in 2018). Looking at size groupings, median levels in 2019 were comparable to the previous year for the SMIM, whereas the median immediate variable compensation rose from CHF 1.17 to 1.53 million among SMI companies and decreased from CHF 0.30 to 0.25 million at smaller mid-caps.
Immediate variable compensation experienced significant fluctuation across industry groups. Similar to total direct compensation, CEOs at consumer goods companies earned a similarly high amount of immediate variable pay (CHF 0.97 million), whereas the lowest amounts (CHF 0.32 million) at median were earned by CEOs in financial companies (mostly regulatory-driven).
LTI awards contributed the most to the variance in compensation levels across the company size and industry groups. Particularly wide gaps regarding the level of LTI awards were observed when segmenting the analysis for company size. The overall median level of LTI awards was CHF 0.56 million in 2019. For smaller mid-cap firms, LTI awards measured at median levels amounted to CHF 0.29 million, whereas the respective value was almost 3.8 times higher for SMIM companies (CHF 1.11 million) and 9.6 times higher for SMI firms (CHF 2.79 million).
Rather surprisingly, the LTI awards level was the lowest at consumer goods companies (CHF 0.41 million at median) in contrast to their positioning with particularly high levels of total direct compensation when compared to companies in other industries. The largest median value for LTI award levels was observed at health care firms (CHF 1.50 million).
Other Executive Board members
The median level of total direct compensation for the HCM Swiss 100 in 2019 amounted to CHF 0.95 million for other EB members. This was relatively similar to the 2018 results (CHF 0.93 million). Figures 7 and 8 provide an overview of the median total direct compensation and base salary levels for other EB members on average in 2018 and 2019 as segmented by company size groups and industry classifications.

1 0 H C M S W I SS 1 0 0
20192018
HCM Swiss 100 (n=74)
SMI (n=16)
SMIM (n=20)
Smaller mid-caps (n=38)
Consumer Goods (n=8)
Financials (n=21)
Health Care (n=12)
Industrials (n=22)
1.77
1.85
1.78
1.76
2.09
1.66
1.74
1.77
1.84
1.90
1.83
1.77
2.13
1.80
1.90
1.77
Figure 5: Median base salary for the role of CEO
(CHF million)
HCM Swiss 100 (n=75)
SMI (n=16)
SMIM (n=20)
Smaller mid-caps (n=39)
Consumer Goods (n=8)
Financials (n=21)
Health Care (n=13)
Industrials (n=22)
20192018
0.80
1.50
0.90
0.61
1.07
0.74
0.69
0.80
0.83
1.50
0.95
0.62
1.07
0.74
0.69
0.80
Figure 6: Internal ratio between CEO and average other Executive Board member
base salary

1 1 H C M S W I SS 1 0 0
Mirroring the analysis executed for CEOs, a positive relationship between company size and compensation level also holds true for the total direct compensation of other EB members. However, the range of pay levels across the size groups is narrower. The median total direct compensation for SMI firms was around 4.1 times higher than that of smaller mid-cap companies. Such variation was – parallel to the findings for CEO total direct compensation – mostly driven by differences in LTI award levels.
Other EB members were also paid more homogeneously across the selected industries compared to the findings for CEOs. Moreover, the lowest median total direct compensation level (CHF 0.80 million) was observed among the financials group. In contrast, EB members earn 1.6 times as much in consumer goods companies at median (CHF 1.24 million).
The base salary levels for other EB members remained stable in 2019 and differed less across the size groups as shown in Figure 8. Nevertheless, there was a clear positive relationship between company size and the level of base salary: the median base salary was equal to CHF 0.34 million for smaller mid-caps and CHF 0.53 million for SMIM companies, reaching CHF 0.81 million for SMI firms in 2019. The industry-specific base salaries were comparable with the HCM Swiss 100 median (CHF 0.44 million) and varied between CHF 0.39 million and CHF 0.50 million.
Variable compensation components for other EB members followed the same patterns as identified for CEO pay. They largely contributed to the gaps between total direct compensation across size and industry groups.
The overall median level of immediate variable compensation for other EB members did not change significantly compared to the previous
year (CHF 0.23 million) and amounted to CHF 0.24 million. The median levels for the size groups ranged from CHF 0.13 million for smaller mid-cap firms to CHF 0.33 for SMIM companies, and CHF 0.57 million for SMI companies.
The observed differences in LTI award levels contributed the most to the variation in variable compensation and hence, to the overall variation in total direct compensation levels of other EB members. The overall HCM Swiss 100 median level of LTI awards was CHF 0.23 million in 2019.
For smaller mid-cap firms, LTI compensation amounted to CHF 0.10 million at median, whereas the respective value was 3.6 times higher for SMIM companies (CHF 0.37 million) and 10.7 times higher for SMI firms (CHF 1.08 million). These relations similarly mirror those encountered in analyzing CEO LTI compensation, although the LTI awards level for other EB members was considerably lower.
Same as for CEOs, the highest amount of LTI awards at median was granted to health care companies and amounted to CHF 0.41 million. This was both due to the relatively large size of the companies included in this industry group and the long-term oriented business model typically employed by this industry.

1 2 H C M S W I SS 1 0 0
Figure 7: Median total direct compensation for other Executive Board members
(CHF million)
20192018
HCM Swiss 100 (n=84)
SMI (n=18)
SMIM (n=22)
Smaller mid-caps (n=44)
Consumer Goods (n=9)
Financials (n=27)
Health Care (n=11)
Industrials (n=24)
0.93
2.27
1.17
0.61
1.62
0.81
1.13
0.91
0.95
2.39
1.25
0.59
1.24
0.80
1.14
1.01
Figure 8: Median base salary for other Executive Board members
(CHF million)
20192018
HCM Swiss 100 (n=84)
SMI (n=18)
SMIM (n=22)
Smaller mid-caps (n=44)
Consumer Goods (n=9)
Financials (n=27)
Health Care (n=11)
Industrials (n=24)
0.41
0.84
0.50
0.34
0.46
0.39
0.42
0.41
0.44
0.81
0.53
0.34
0.50
0.40
0.39
0.46

1 3 H C M S W I SS 1 0 0
The structure of total direct compensation describes the split between base salary, immediate variable compensation, and LTI awards. It reflects the degree to which EB members are incentivized to deliver specific company results through a customized compensation package.
The way public companies in Switzerland split compensation packages for their EB members is typically driven by the role and responsibility of the respective executive. Other factors such as company size, industry and respective legal requirements may also influence the pay mix.
The structure of total direct compensation in 2019 remained similar to that in 2018 for the CEO and other EB members on average.
Chief Executive Officer
As is illustrated in Figure 9, variable pay (consisting of immediate variable compensation and LTI awards) made up a large part of CEO compensation packages and reached 58 percent of total direct compensation on average among the HCM Swiss 100 companies. Larger companies typically offered a larger portion of variable pay, whereas the portion of base salary increased with decreasing company size. Thereby, the average share of base salary in total direct compensation varied from 29 percent for SMI firms to 49 percent for smaller mid-cap companies. LTI awards accounted for 24 percent of CEOs’ pay packages for smaller mid-caps and reached 46 percent for SMI companies. Less variation, however, was observed with regards to immediate variable compensation, which accounted for 25 percent of total direct compensation in SMI companies and reached 28 percent in SMIM firms. Such patterns could be explained by the fact that a larger company size usually implies broader responsibilities for the CEO and increased attention from the investment
community, which translates into the need for more long-term performance-sensitive pay packages.
When considering selected industries, consumer goods and financial companies portrayed similar pay structures with a large proportion of base salary each, accounting for 49 percent and 46 percent of total direct compensation on average, respectively. When looking at the variable pay component, the share of immediate compensation was higher for consumer goods (61 percent of variable compensation), while contrarily the share of LTI awards prevailed for financials (64 percent of variable compensation). Industrial companies had a similar compensation structure as the HCM Swiss 100 in total in 2019. Health care firms deferred 41 percent of CEO compensation packages on average, whereas base salary represented approximately one third of total pay. The significant share of LTI awards addresses specific business model features in this industry group. Specifically, health care (and in particular pharmaceutical and biotech) companies make significant investments in research and development activities, which tend to materialize only in the long term, for example.
Figure 10 illustrates the relationship between the share of the LTI awards for CEOs and the size of a company in terms of market capitalization. Although the portion of total direct compensation being typically deferred varied from 20 to 43 percent (interquartile range), larger companies deferred up to 73 percent of total direct compensation in form of LTIs aiming to better align executive pay with long-term company performance and, as a result, with the interests of shareholders.
Compensation structure

1 4 H C M S W I SS 1 0 0
0.0 1.3 3.6 9.7 26.5 72.0 195.7 532.00%
20%
40%
60%
80%
100%
Long
-ter
m i
ncen
tive
aw
ards
(per
cent
age
of t
otal
dire
ct c
ompe
nsat
ion)
Market capitalization as of 31.12.2019, CHF billion
The size of a bubble
direct compensation received by the Chief Executive Officer
Inte
rqua
rtile
ra
nge
corresponds to the total The size of a bubble
Figure 9: Average structure of total direct compensation for the role of CEO
HCM Swiss 100 (n=75)
SMI (n=16)
SMIM (n=20)
Smaller mid-caps (n=39)
Consumer Goods (n=8)
Financials (n=21)
Health Care (n=13)
Industrials (n=22)
Base salary Immediate variable compensation
Long-term incentive awards
42%
29%
38%
49%
49%
46%
35%
39%
26%
25%
28%
27%
31%
19%
24%
31%
32%
46%
34%
24%
20%
35%
41%
30%
Figure 10: Link between the level of long-term compensation for the role of CEO and
company size
HCM Swiss 100 (n=75)

1 5 H C M S W I SS 1 0 0
Other Executive Board members
As highlighted in Figure 11, almost half of total direct compensation for other EB members consisted of fixed base salary (48 percent) and half of variable pay, which was almost equally split between immediate (25 percent of total direct compensation) and long-term (27 percent of total direct compensation) variable compensation. In general, compensation packages for other EB members were more conservative, i.e. less exposed to risk, than those of CEOs with a smaller portion of variable compensation and a larger share of base salary.
The share of base salary in terms of total direct compensation paid to other EB members was mostly driven by the size of the company, declining as the market capitalization increased. The portion of base salary varied from 34 percent of total direct compensation on average for SMI companies to 57 percent for smaller mid-cap firms in 2019.
The portion of immediate variable compensation exhibited less variation across size groups. Immediate variable pay as a percentage of total direct compensation ranged from 24 percent for smaller mid-caps to 26 percent for SMI firms on average.
From an industry perspective, the compensation structure was similar for most industries with about half of compensation paid in base salary. Variable compensation packages across the selected industries commonly included between 20 percent and 28 percent of immediate variable pay, and between 24 percent and 35 percent of LTI awards.
Looking at LTI awards in more detail, the positive relationship between the size of the company, compensation levels and the deferral rates observed for CEOs also holds true for other EB members. As shown in Figure 12, the LTI share typically varied between 14 and 37 percent of
total direct compensation (interquartile range). Larger companies with higher pay levels typically deferred a greater portion of the pay package, reaching a maximum of 74 percent of total direct compensation. Ten companies among the HCM Swiss 100 (mostly SMI and SMIM) granted compensation packages with an LTI share above 50 percent, while nine companies (all smaller mid-caps) did not defer any total direct compensation for other EB members in 2019.

1 6 H C M S W I SS 1 0 0
26.5 72.0 195.7 532.00.5 3.6 9.71.30%
20%
40%
60%
80%
100%
Long
-ter
m in
cent
ive
awar
ds(p
erce
ntag
e of
tot
al d
irec
t co
mpe
nsat
ion)
Market capitalization as of 31.12.2019, CHF billion
Inte
rqua
rtile
ra
nge
The size of a bubble corresponds to the total direct compensation received by other Executive Board members (on average)
Figure 11: Average structure of total direct compensation for other Executive Board members
Base salary Immediate variable compensation
Long-term incentive awards
HCM Swiss 100 (n=84)
SMI (n=18)
SMIM (n=22)
Smaller mid-caps (n=44)
Consumer Goods (n=9)
Financials (n=27)
Health Care (n=11)
Industrials (n=24)
48%
34%
43%
57%
49%
51%
45%
48%
25%
26%
25%
24%
27%
22%
20%
28%
27%
40%
32%
19%
24%
27%
35%
24%
Figure 12: Link between the level of long-term compensation for other Executive Board
members and company size
HCM Swiss 100 (n=84)

1 7 H C M S W I SS 1 0 0
Variable compensation design
Despite a certain level of heterogeneity in pay practices across the companies analyzed, almost all compensation packages for EB members contained three basic components: base salary, annual bonus, and LTI awards.
Differences in the design of variable compensation were primarily related to EB members’ roles and responsibilities, compensation levels, as well as the regulatory landscape exposed to. From the regulatory perspective, the design of executive compensation is subject to an even greater number of requirements than the pay level or structure.
Annual bonus
Most of the companies under review (98 percent) had at least one annual bonus plan for EB members. As depicted in Figure 13, median target bonus opportunities at the HCM Swiss 100 firms reached 90 percent of base salary for CEOs and 60 percent of base salary for other EB members.
Size differences had a decisive influence on the annual bonus design. larger companies tended to construct compensation packages with higher payout opportunities for the CEO and other EB members. Indeed, target bonus opportunities for CEOs in SMI companies were set at 105 percent of base salary at median and reached only 65 percent of base salary in smaller mid-cap firms. The target rates for other EB members were slightly lower, with the median target bonus varying between 50 percent (smaller mid-caps and SMIM) and 75 percent (SMI) of base salaries in 2019.
The maximum annual bonus opportunity as a percentage of base salary also increased with the company’s size. The median annual bonus cap for CEOs amounted to 105 percent of the base salary for smaller mid-cap firms and reached 200 percent for CEOs in SMI firms. The caps for other EB
members were lower varying between 90 percent of base salary for SMIM and 150 percent for SMI firms.
Financial companies stood out with the lowest target and maximum annual bonus opportunities in percentage of base salary for CEOs and other EB members. This is an industry-wide practice aiming to prevent EB members from taking unsustainable risks in order to maximize variable compensation. In contrast, consumer goods firms provided for the highest maximum annual bonus opportunities for EB members (85 percent of base salary).
In this context, there are two common approaches to annual bonus payout, which must be elaborated on:
■ Immediate payout (i.e. shortly after the end of the financial year under review) in form of immediate variable compensation; or
■ Deferred payout, meaning that payout occurs at some point in the future.
Slightly more than 40 percent of the sampled companies required the deferral of a certain part of executive compensation in 2019. For these companies, the required deferral rates of annual bonus were 50 percent for EB members at median.
The deferral period ranged between 1 and 10 years, while most companies deferred their annual bonus for 3 years (56 percent of companies). Notably, longer deferral periods, typically 5 years, were common among financial companies, which stems from regulatory requirements. The design aspects of deferred annual bonus plans are further considered in the following section as part of the long-term incentive awards with performance-driven grant levels.
When designing the 2019 annual bonus plans, the majority of the reviewed companies (73 percent)

1 8 H C M S W I SS 1 0 0
Figure 13: Median annual bonus opportunity
(Percentage of base salary)CEOOther EB members
Target bonus Maximum payout opportunity
HCM Swiss 100 (n=61)
SMI (n=16)
SMIM (n=19)
Smaller mid-caps (n=26)
Consumer Goods (n=6)
Financials (n=10)
Health Care (n=9)
Industrials (n=23)
60%
75%
50%
50%
85%
45%
45%
60%
100%
150%
90%
100%
140%
100%
100%
100%
90%
105%
100%
65%
100%
50%
100%
90%
150%
200%
150%
105%
175%
100%
190%
150%
applied a combination of individual and corporate performance metrics, while the rest (27 percent of the companies analyzed) employed the corporate measures only.
On average, a quarter of the annual bonus amount was defined based on individual performance results of EB members. Individual performance was typically assessed by means of a mix of qualitative metrics (e.g. sustainability, competency, leadership, personal development) and quantitative metrics (e.g., specific, project-related objectives).
A combination of two to four corporate performance metrics was the most common mix used by around half of the companies analyzed. Earning measures were the most commonly employed performance metrics (used by 93 percent of companies) across the sample. Revenue
was the second most prevalent KPI group used by 64 percent of the HCM Swiss 100 companies. Furthermore, annual bonus KPIs tend to measure operating value creation. Therefore, the use of KPIs is to a significant extent determined by the industry affiliation and maturity of the company. For example, revenue was used as a KPI by at least 70 percent of firms in all industry groups except financials (with only 48 percent). Instead, financial institutions more heavily relied on return measures (namely, return on equity) than other industries. This was implemented by 41 percent of financial companies compared to 7 percent for health care, 10 percent for consumer goods, and 18 percent for industrials. Furthermore, risk management and compliance with legal or internal requirements were additionally emphasized among financial companies. As a matter of fact, financial companies were the only ones to use risk

1 9 H C M S W I SS 1 0 0
capital measures (e.g. Tier 1 common capital ratio, solvency ratio, credit rating, etc.).
Contrarily to the industrial affiliation, no significant conclusions about the use of quantitative KPIs could be drawn from the size groups. However, it could be inferred that larger companies are more eager to use sustainability-related and other qualitative KPIs. The design of annual bonus plans in larger companies was generally more complex and considered a greater number of KPIs to assess the performance of EB members. In contrast, smaller companies tended to adopt plans with a simpler design and fewer KPIs (mostly quantitative in nature), which more closely focused on the core factors of company performance.
Long-term incentive awards
LTI awards cover a variety of equity or equity-based instruments as well as cash-based plans. Depending on the award’s funding approach, these plans can be classified as:
■ LTI awards with a performance-driven grant level, i.e. financed through realized performance, typically annual bonus deferral; or
■ LTI awards with a budgeted grant level, i.e. pre-defined or fixed in terms of an absolute amount or number of shares/units.
As is made visible in Figure 14, both funding approaches were almost equally frequent among the HCM Swiss 100 companies. While there was a prevalence of budgeted LTI awards among SMIM f irms (74 percent of the plans) for smaller mid-caps performance-driven grant levels were most often used. Furthermore, for smaller companies, the deferred annual bonus was often the only type of long-term compensation in place, whereas larger f irms typically had stand-alone LTI awards in addition to the bonus deferral.
At industry level, budgeted LTI awards were more popular among non-financial companies: consumer goods (77 percent of the plans), health care (71 percent of the plans), and industrials (54 percent of the plans). In contrast, 73 percent of the LTIs awarded by f inancial institutions had a performance-driven grant level since many companies in this industry group had an annual bonus deferral framework. This is in line with the specific industry-related regulatory requirement to fund variable compensation on a risk-adjusted basis.
With regards to vesting, LTI awards can be distinguished as:
■ Awards with time-based vesting subject to a service condition or deferred payout with no additional performance conditions (e.g. deferred cash or blocked shares); and
■ Awards with performance-based vesting dependent on both service conditions and the achievement of particular targets or thresholds.
The split of LTI plans by vesting types is presented in Figure 15. Overall, LTI awards with time-based vesting are more often observed (55 percent of the plans). It is noteworthy that most awards with time-based vesting were determined with a performance-driven grant, while awards with performance-based vesting typically follow a budgeted grant approach. Indeed, companies often impose performance conditions at either the grant or vesting stage rather than at both. The only exception could be found in the financial group, where performance conditions at some companies were used to determine both the grant level and vesting amount.
When looking at the size groups, LTI awards with time-based vesting were more frequent among smaller mid-cap firms (71 percent of plans), with

2 0 H C M S W I SS 1 0 0
Performance-based awardsTime-based awards
HCM Swiss 100 (130 plans)
SMI (37 plans)
SMIM (34 plans)
Smaller mid-caps (59 plans)
Consumer Goods (13 plans)
Financials (44 plans)
Health Care (21 plans)
Industrials (37 plans)
55%
41%
44%
71%
54%
66%
57%
49%
45%
59%
56%
29%
46%
34%
43%
51%
Figure 14: Split of long-term incentive awards with regard to funding decision
(Percentage of long-term incentive plans)
LTIs with budgeted grant level
LTIs with performance-driven grant level
HCM Swiss 100 (130 plans)
SMI (37 plans)
SMIM (34 plans)
Smaller mid-caps (59 plans)
Consumer Goods (13plans)
Financials (44 plans)
Health Care (21 plans)
Industrials (37 plans)
48%
43%
26%
63%
23%
73%
29%
46%
52%
57%
74%
37%
77%
27%
71%
54%
Figure 15: Split of long-term incentive awards with regard to vesting condition
(Percentage of long-term incentive plans)

2 1 H C M S W I SS 1 0 0
only 29 percent of the awards being subject to both time and performance vesting. In contrast, larger companies granted LTI awards with time-based vesting less frequently (41 percent of the cases for SMI and 44 percent of cases for SMIM). Notably, around 60 percent of SMI companies operated several LTI plans in 2019, while the majority of SMIM and smaller mid-cap companies had one LTI plan in place.
Figure 16 depicts the detailed statistics on the instruments used for LTI awards with time-based vesting. These include deferred cash, blocked shares, restricted shares, and stock option awards.
Blocked shares typically imply an immediate transfer of ownership, and, as a consequence a full taxation upfront, but are blocked for a subsequent period of time. They represent a low-risk LTI instrument. Blocked shares’ sale and/or pledging restriction typically lasted for 2 to 10 years (3 years at median). Restricted share awards – so called “pay-for-stay” equity instruments with a vesting solely subject to a service condition – fully vested after a waiting period of 1 to 7 years (3 years at median). Stock options are considered time-based instruments at risk (vesting independent from performance conditions and payout subject to share price developments) and typically had a 3-year vesting period followed by a 1 to 7-year exercise period (5 years at median). Deferred cash with payout subject to a service condition was the least applied (6 percent) long-term incentive instrument with vesting after 3 to 5 years from grant.
Overall, blocked shares were most frequently granted, accounting for 58 percent of LTI plans with time-based vesting operated among the HCM Swiss 100 companies. Moreover, the use of these awards was driven by the size of the pay package and/or degree of international exposure of the company. For example, smaller mid-cap companies
with lower compensation levels and presumably less international exposure preferred blocked shares (72 percent of time-based LTI plans) over other instruments, while for larger companies, SMI and SMIM, the usage of blocked shares amounted to 40 percent of time-based LTI plans.
The use of different LTI instruments with time-based vesting was also influenced by industry specifics. For example, industrial companies granted only blocked or restricted shares, with prevalence of the former (72 percent of the LTI plans with time-based vesting). In other industries, there were also occasional stock option awards accounting for 10 percent (financials) to 33 percent (health care) of the LTI plans with time-based vesting. As for deferred cash, it was only used by financial firms (14 percent of the LTI awards with time-based vesting) as a mandatory deferral of annual incentive.
Figure 17 depicts the detailed statistics on LTI instruments with performance-based vesting. These instruments comprise performance cash, performance shares and performance options. The number of share-based instruments or amount of cash awarded at vesting for these LTI awards is contingent on the achievement of performance targets. The awards in performance shares and performance options had a double performance hurdle in terms of number of instruments and market price of the instruments at vesting. The instruments with performance-based vesting typically vested after 3 years. The exercise period for performance options varied from 4 to 7 years after vesting.
The use of instruments with performance-based vesting, however, differed slightly across industries. Apart from performance share plans, several companies used performance options and one financial company operated a carried interest plan. Performance cash (including carried

2 2 H C M S W I SS 1 0 0
Performance sharesPerformance cash
Performance options
HCM Swiss 100 (58 plans)
SMI (22 plans)
SMIM (19 plans)
Smaller mid-caps (17 plans)
Consumer Goods (6 plans)
Financials (15 plans)
Health Care (9 plans)
Industrials (19 plans)
7%
9%
12%
13%
10%
81%
77%
84%
82%
83%
80%
89%
74%
12%
14%
16%
6%
17%
7%
11%
16%
Figure 16: Time-based long-term incentive instruments
(Percentage of plans)
Blocked sharesDeferred cash
Stock optionsRestricted shares
HCM Swiss 100 (72 plans)
SMI (15 plans)
SMIM (15 plans)
Smaller mid-caps (42 plans)
Consumer Goods (7 plans)
Financials (29 plans)
Health Care (12 plans)
Industrials (18 plans)
6%
20%
7%
14%
58%
40%
40%
72%
43%
59%
42%
72%
22%
27%
40%
14%
29%
17%
25%
28%
14%
13%
13%
14%
28%
10%
33%
Figure 17: Performance-based long-term incentive instruments
(Percentage of plans)

2 3 H C M S W I SS 1 0 0
interest) plans were in place in several financial and industrial companies. One reason for the scarce use of cash instruments could be that they are seen as less effective in enhancing the alignment between LTI outcomes for management and shareholder experience. This could presumably be due to the fact that performance conditions used in these plans are typically of operational nature.
A detailed overview of the KPIs used in LTI plans is presented in Figure 18. Unlike annual bonus performance measures, KPIs in LTI plans are more standardized. Generally, qualitative, and company-specific performance measures (e.g. launch of particular products) are less often used. In fact, LTI plans are typically designed and administrated in a way that allows for the measurement of performance conditions and consistency across employees participating in the plan.
In 2019, the payout of LTI plans with performance-based vesting was driven by two KPIs on average. 13 percent of HCM Swiss 100 companies operated LTI plans with a single KPI, while 52 percent of firms used two performance criteria to determine a payout of deferred awards. On the other hand, almost one third of companies had a more complex link between performance and payout with three or four LTI KPIs. As in previous years, TSR remains the most used performance metric (58 percent of companies) since it represents a direct link of the LTI payout with shareholders’ experience. TSR was mainly used in combination with another metric (51 percent of firms), typically return on (employed/invested) capital (ROC) or earnings per share (EPS).
In addition, TSR is most often measured on a relative basis (82 percent of cases). The company’s share price performance is typically compared to a defined peer group. Peers are chosen based on criteria such as comparable size and scope
of activities, which may represent an alternative investment opportunity for shareholders.
ROC was the second most popular LTI performance metric (31 percent of companies). This metric combines aspects of multiple KPIs, including profitability of the company and the sustainable management of the company’s capital, given a multi-year perspective.
EPS was used as often as ROC (31 percent of the companies). This measure is a standardized company performance measure employed by investors for stock valuation purposes and industry comparison. However, as this measure can be distorted by earnings management, corporate events, or share repurchases, EPS was typically introduced to LTI plans in combination with other performance indicators.
Risk capital measures (e.g. Tier 1 common capital ratio, solvency ratio, credit rating, etc.) belong to industry specific measures and were employed solely by financial companies, as was return on equity (ROE).
Most LTI plans with performance-based vesting set a cap on the maximum award (a so-called maximum payout opportunity), which determines the plan’s riskiness and influences motivation to exceed the targets. In this regard, we distinguish between malus and bonus/malus plans. For the former, the payout for target achievement represents the maximum possible value of the award. It can only be reduced in case of underperformance. For the latter, the value of the award can be either increased (bonus provision or leverage) or decreased (malus provision) depending on the achievement of targets at the end of the performance period.
The maximum payout opportunity for plans with performance-based vesting other than performance cash, was typically limited in terms

2 4 H C M S W I SS 1 0 0
HCM Swiss 100(n=52)
Health Care(n=8)
SMI(n=17)
SMIM(n=18)
Smaller mid-caps(n=17)
Consumer Goods(n=5)
Financials(n=13)
Industrials(n=17)
TS
R
RO
CE,
RO
IC
EPS
RO
E
Ope
rati
ng in
com
e
Rev
enue
Eco
nom
ic p
rofit
Co
mpa
ny-s
pecific
m
easu
res
Cas
h flo
w
Ris
k ca
pita
l mea
sure
s
Net
profit
Qua
litat
ive
perf
orm
ance
mea
sure
s
58% 31% 31% 21% 19% 10% 8% 8% 13% 6%2% 2%
65% 41% 29% 24% 18% 18% 24% 24% 12% 6%
67% 17% 33% 11% 22% 11% 6%
41% 35% 29% 29% 18% 18% 6% 12% 6% 6%
40% 80% 40% 20% 20% 40%
62% 15% 15% 8% 8% 15% 31% 15% 15% 23% 8% 8%
50% 50% 25% 38% 38% 25%
76% 29% 35% 24% 18% 6% 6%
Figure 18: Long-term incentive awards performance measures
(Percentage of companies)

2 5 H C M S W I SS 1 0 0
of maximum number of vested shares/units rather than the absolute amount in CHF (or other currency).
As shown in Figure 19, the maximum payout opportunity was capped at 100 percent of the granted amounts or units in approximately one third of the LTI plans with performance-based vesting (which means malus provisions only), while the remaining two thirds also foresaw the possibility to reward the overachievement of performance targets by including the potential for both, bonus and malus adjustments.
The proportion of malus-only plans across the size groups was close to that of the HCM Swiss 100 value. From an industry perspective, malus-only plans were most popular among financial companies as an instrument to limit risk-taking. In contrast, in other industries companies were more likely to use bonus-malus plans targeting a broader performance range.
As shown in Figure 20, the overall maximum payout opportunity for bonus-malus plans ranged from 140 percent of target at minimum to 300 percent of target at maximum, being twice the number of granted award at median. Maximum payout opportunities for all size and industry groups were in line with the HCM Swiss 100 common practice.
Half of the LTI plans with performance-based vesting (mostly operated by SMI and SMIM companies) included a clawback provision, i.e. a contractual agreement under which the staff member is obliged to repay an amount of compensation to the company in certain cases, such as involvement in fraudulent behavior, intentional misconduct, material misstatement of a company’s accounts, etc. after transfer of ownership (i.e. vesting).

2 6 H C M S W I SS 1 0 0
Median Minimum - maximum
HCM Swiss 100 (40 plans)
SMI (12plans)
SMIM (14 plans)
Smaller mid-caps (14 plans)
Consumer Goods (4 plans)
Financials (7 plans)
Health Care (7 plans)
Industrials (15 plans)
140%
150%
140%
150%
175%
150%
200%
150%
200%
200%
200%
188%
200%
200%
200%
250%
300%
250%
300%
300%
300%
Figure 19: Split of long-term incentive awards with regard to malus provision
(Percentage of performance-based long-term incentive plans)
Bonus-malus plansMalus-only plans
HCM Swiss 100 (57 plans)
SMI (22 plans)
SMIM (18 plans)
Smaller mid-caps (17 plans)
Consumer Goods (6 plans)
Financials (14 plans)
Health Care (9 plans)
Industrials (19 plans)
30%
45%
22%
18%
33%
50%
22%
21%
70%
55%
78%
82%
67%
50%
78%
79%
Figure 20: Maximum payout opportunity for performance-based long-term incentive plans
(Percentage of number of granted awards)

2 7 H C M S W I SS 1 0 0
Equity ownership guidelines
Increasingly, companies are introducing equity ownership requirements that oblige executives to hold a predefined minimum amount of stock in the company. The aim of such requirements is to strengthen the alignment of EB member and shareholder interests.
In 2019, 36 percent of companies in the HCM Swiss 100 disclosed equity ownership policies for their EB members. These typically constituted large companies in terms of market capitalization, i.e. the majority of SMI companies (80 percent), almost half of the SMIM firms (48 percent), and several smaller mid-caps (13 percent).
As shown in Figure 21, the median estimated value of required stock ownership amounted to CHF 2.63 million for the CEO and CHF 1.06 million for other EB members in 2019. Executives were expected to reach the required level of shareholdings within 3 to 5 (5 years at median) years.
Stock ownership guidelines were most often expressed (80 percent of companies) as a multiple of the EB member’s base salary. The median stock ownership rate was 300 percent of base salary for the CEO and 200 percent for other EB members. In case of base salary changes (e.g. due to a promotion), shareholding requirements are automatically adjusted. However, the remaining 20 percent of the HCM Swiss 100 firms also required a certain fixed number of shares to be held.
The types of equity instruments that count towards the guidelines generally included directly owned shares and vested equity awards.
Some of the companies also described a penalty for not satisfying the guidelines. The common consequences of non-compliance with the ownership requirements were:
■ Prohibition to sell any vested compensation-related share awards; or
■ Mandatory investments of realized bonus into company shares.
Furthermore, ten companies (10 percent) used extended blocking periods post vesting instead of or in addition to the conventional ownership requirements as described above. Such post-vesting holding periods amounted to typically 2 or 3 years.

2 8 H C M S W I SS 1 0 0
Equity ownership guidelines (CHF million)
CEO
Other EB members
Equity ownership guidelines type (percentage of companies)
20% 80%
Interquartile rangeMedian
Multiple of base salaryNumber of shares
Equity ownership guidelines multiple (percentage of base salary)
CEO
Other EB members
Minimum - maximumMedian
Build-up period (years)
Minimum - maximumMedian
100%
51%
500%300%
1.93
0.58
5.24
1.73
2.63
1.06
400%200%
3 5
Figure 21: Equity ownership guidelines

2 9 H C M S W I SS 1 0 0
Overall view on executive compensation
HCM has elaborated a concept of “sensitivity-duration” that allows for the estimation of the relative risk exposure of a compensation package, measured on the basis of the following two perspectives:
■ Weighted average sensitivity of total direct compensation relative to the long-term company performance; and
■ Weighted average duration of total direct compensation.
Sensitivity is assessed by using a rating system that accounts for the financial nature of LTI instruments as well as maximum payout opportunities under LTI plans.
By definition, any immediate compensation has zero sensitivity. The more uncertainty there is around the LTI award payout, the more sensitivity points will be assigned. Therefore, performance-based LTIs have a higher sensitivity than time-based awards and awards with larger maximum payout opportunity are considered as more sensitive too.
The weighted average duration of total direct compensation is measured based on a vesting schedule for each element of the pay package. Any compensation payable within 12 months as well as any annual bonus accrued for the year under review is considered to have zero duration.
Figure 22 depicts the relationship between the weighted average duration of the compensation package, its sensitivity to the long-term company performance, and the size of compensation allocated to EB members on average.
A direct relationship between the amount of total direct compensation, the size of the company, and its duration can be observed – larger companies tend to defer relatively higher executive compensation amounts for longer
periods. Generally, EB members “waited” between 5 (lower quartile) to 17 (upper quartile) months for the payout of their total direct compensation with a median duration of 11 months.
The sensitivity of executive pay to long-term company performance also increased with the size of the allocated total direct compensation and varied between 14 sensitivity points (lower quartile) and 94 sensitivity points (upper quartile) for most of the firms analyzed. In 2019, the maximum sensitivity score was around 261 points, whereas the longest weighted average duration almost reached four years.
Furthermore, companies offering larger total direct compensation generally also designed pay packages with a higher performance sensitivity. Nevertheless, some exceptions were found as well.
In general, the average sensitivity and duration of compensation packages for EB members in the HCM Swiss 100 have increased over the last five years. Even though the portion of the variable pay component did not change significantly, LTI awards in 2019 were granted using more performance-sensitive instruments and longer vesting terms than in the past.

3 0 H C M S W I SS 1 0 0
0
25
50
75
100
125
150
175
200
225
250
275
0.0
Interquartile range
Inte
rqua
rtile
ran
ge
0.0
Sen
siti
vity
(poi
nts)
Weighted average duration (years)
0 0.5 1.0 1.5 2.0 2.5 3.0 3.5 4.0 4.50
Size of a bubble corresponds to the total direct compensation of Executive Board members (on average)
Figure 22: Sensitivity and duration of total direct compensation
HCM Swiss 100 (n=90)

3 1 H C M S W I SS 1 0 0
Strategic and innovative: We understand business strategy and the need for agility and innovation. We are highly skilled and tactful at working on the most sensitive and pressing matters directly with boards, board committees, CEOs, heads of group functions, and other decision-makers.
Highly skilled: We possess deep expertise in board practices, compensation design, performance management and HR matters, finance, governance, corporate culture, ESG, and compliance and regulatory management.
Thought leaders: We are actively involved in research, publishing, speaking, and teaching (e.g. University of St. Gallen, Zurich, etc.) in Switzerland and abroad. Our studies and publications are well-known in the marketplace.
HCM is a leading independent international advisory firm specialized in the strategic and more challenging aspects of corporate governance & compliance, finance & risk, and compensation.
Since our founding in 2001, we have advised hundreds of companies – from global multinationals to locally-focused small enterprises – across multiple industries and geographies. We also support public and governmental institutions.
HCM is part of and chairs the Global Governance and Executive Compensation Group (GECN) (www.gecn.com) which enhances our worldwide reach. With our strategically located offices, we service our clients across time zones and provide solutions that are informed by expertise, market practice, research, analytics, and surveys across Europe, North America, Asia, Australia and the Gulf area.
About HCM International Ltd.

3 2 H C M S W I SS 1 0 0
Olga Beregova is a partner with over 15 years of experience in compensation and compensation governance consulting, working with large, publicly traded firms, privately held enterprises, and emerging growth companies across multiple industries.
Olga’s engagements include advising Compensation Committees on Board and executive compensation issues, developing compensation and governance strategies that support the organizational strategy and drive long-term value creation to a company and its shareholders, (re)designing incentive plans also as a result of mergers and acquisitions, initial public offerings, and regulatory requirements.
Olga holds a Master of Finance and Capital Markets from the University of Zurich and of Linguistics from the Kyiv State University of Foreign Languages.
Natalia Iavorska has over five years of professional experience in economic research and analytics related to compensation and other corporate governance matters. Her expertise extends across a variety of industries from manufacturing, consumer products, energy, and financial services, to technology and telecommunication.
Natalia supports her clients in developing solutions that are effective within the context of a company’s organizational structure and specific situation. Further, her incentive design work focuses on identifying and implementing the appropriate incentive structures, performance measures, and approaches for goal setting.
Natalia holds a Bachelor’s degree in Sociology from the National University of Kyiv-Mohyla Academy and a Master’s degree in Economics from the University of Houston and Kyiv School of Economics.
About the authors