cheng, qiang; hulkkonen, tuomo; kaario, ossi; larmi
TRANSCRIPT
This is an electronic reprint of the original article.This reprint may differ from the original in pagination and typographic detail.
Powered by TCPDF (www.tcpdf.org)
This material is protected by copyright and other intellectual property rights, and duplication or sale of all or part of any of the repository collections is not permitted, except that material may be duplicated by you for your research use or educational purposes in electronic or print form. You must obtain permission for any other use. Electronic or print copies may not be offered, whether for sale or otherwise to anyone who is not an authorised user.
Cheng, Qiang; Hulkkonen, Tuomo; Kaario, Ossi; Larmi, MarttiHVO, RME and diesel fuel combustion in an optically accessible compression ignition engine
Published in:Energy and Fuels
DOI:10.1021/acs.energyfuels.8b03822
Published: 21/03/2019
Document VersionPeer reviewed version
Please cite the original version:Cheng, Q., Hulkkonen, T., Kaario, O., & Larmi, M. (2019). HVO, RME and diesel fuel combustion in an opticallyaccessible compression ignition engine. Energy and Fuels, 33(3), 2489-2501.https://doi.org/10.1021/acs.energyfuels.8b03822
HVO, RME and Diesel Fuel Combustion in an Optically
Accessible Compression Ignition Engine
Qiang Chenga, Hulkkonen Tuomo
b, Ossi Kaario
a, Larmi Martti
a
a Aalto University, School of Engineering, Department of Mechanical Engineering, 00076 Aalto, Finland
b Energy Authority, FIN-00530 Helsinki, Finland
Abstract: The current paper investigates the spray and combustion characteristics of Hydrotreated
Vegetable Oil (HVO), petrol diesel (EN590), blends of HVO with petrol diesel (70% EN590 and 30%
HVO) and Rapeseed oil Methyl Esters (RME) in an optically accessible compression ignition engine.
Mie scattering and natural luminosity imaging are employed to measure the liquid spray and combustion
behaviors. The spray and combustion processes are divided into four stages based on optical imaging.
The morphology and quantitative analysis based on imaging provides a method for visualizing the in-
cylinder spray and combustion behavior with four test fuels. The ignition delay and combustion
characteristics detected from optical measurements are compared to those determined from cylinder
pressure. The results show that the ignition delay of HVO and RME occurs earlier and the flame
propagation at the premixed combustion stage proceeds faster compared to EN590 and HVO30. The
spray and combustion characteristics of HVO30 are similar to EN590. However, ignition occurs earlier
for HVO30 due to the higher CN. Comparison of the HVO and RME shows that there is a marginal
difference in the ignition delay for these two fuels. However, the combustion duration of RME is shorter
than that of HVO.
Keywords: renewable diesels, optical compression ignition engine, natural luminosity,combustion
process
1. Introduction
The European Council agreed on a target to deliver at least 20% of its total energy requirement and at
least 10% of transport fuels as renewable by 2020 [1]. In light of these targets, research on alternative
fuels is needed. In the current investigation, we explore four different fuels: 100% Hydrotreated
Vegetable Oil (HVO), 100% European Diesel (EN590), a mixture of 30% HVO and 70% EN590, and
100% rapeseed methyl ester (RME).
Researchers have widely explored combustion and emission characteristics of neat HVO, blends of
HVO with EN590, and HVO with additives. Vojtisek-Lom et al. [2] examined the performance of a
mixture of butanol and HVO, in an Iveco Tector diesel engine without any after-treatment devices.
They founded that blends of 30% of either n-butanol or iso-butanol into HVO resulted in a 70%-80%
decrease in the emissions of elemental carbon and carcinogenic polycyclic aromatic hydrocarbons
(cPAHs) and a moderate decrease in the emissions of NOx. Koronen et al. [3] concluded that HVO
could be applied as a fuel in city bus fleets due to the reduction in harmful exhaust emissions (~14%
NOx) compared with petrol diesel fuels. Kim et al. [4] analyzed the engine performance and emission
characteristics of HVO and blends of HVO and iso-HVO in light-duty diesel engines. They reported
that iso-HVO offers better engine performance than blended diesel (BD) and more optimal than HVO,
but less efficient than petro-diesel. Iso-HVO and HVO blended diesel emit less unburned-HC and CO
than BD, even though iso-HVO blended diesel emits a similar level of NOx and PM to BD. Lehto et
al.[5] compared the NOx and PM emission among 100% of partially-isomerized HVO, fatty acid methyl
esters (FAME), gas to liquids (GTL), and petro-diesel, respectively. They concluded that the alternative
diesel showed emissions reduction due to the absence of aromatics and olefins. No et al. [6] reported a
comprehensive review at HVO, biofuels, and petro-diesel. It is conclusive that the use of HVO enables
appreciable reductions in NOx, PM, HC and CO emissions without any changes to the heavy-duty
engine or its control. Although the advantages of HVO have been proved beneficial for the engine
emissions and performance, the drawbacks of poor low-temperature properties still exist.
Besides HVO, rapeseed methyl ester (RME) constitutes the most common additive for biofuels in the
moderate climate zone, and mainly produced in Europe [7]. Several studies of combustions have studied
the combustion characteristics and soot processes of RME and petrol diesel on standard metal engines
and optical diesel engines [8-11]. The exhaust soot emissions of RME are lower than the petrol diesel
and other biodiesels. Labecki et al. [12] investigated the exhaust soot particle number and size
distributions obtained from the combustion of diesel and RME fuels in a high-speed direct injection
engine. They observed that under most engine operating conditions, RME emitted lower soot particles
concentration than petrol diesel under both nucleation and accumulation modes. Ahmed et al. [13]
compared fuel economy and emission characteristics among GTL, RME and petrol diesel based on the
emission test cycles (ESC) 13-mode test procedure. They concluded that RME emitted up to 70% less
CO, up to 50% less HC, and 60% less specific PM emissions compared to the baseline diesel fuel. Imran
et al. [14] observed that RME has slightly higher thermal efficiency at the maximum power range, RME
produces less unburned hydrocarbon emissions than diesel at the higher loads, and RME produces lower
NOx and CO2 than diesel throughout the engine operating range. Nyström et al. [15] compared the
physical and chemical properties of particulate carbonaceous matter and PAH/Oxy-PAH from the RME
and petrol diesel combustion. They emphasized that when shifting from petrol diesel to RME, the total
particle mass emissions and particle size decrease considerably, but the organic matter and Oxy-PAH’s
are higher. It can be concluded that the presence of oxygen content in RME is beneficial for the
reduction of exhaust soot emissions. However, the details of the soot formation in diesel spray
combustion have to be resolved with visualization approaches.
In-cylinder investigations based on optical diagnostics have been employed in combustion visualization
that help understand the diesel spray combustion process. Mancaruso et al. [16, 17] adopted an Infrared
(IR) camera in the characterization of the injection and combustion process. They claimed that RME
exhibited the shortest auto-ignition time due to the highest oxygen content, which improved the mixing
process and provided a low soot emission. Haiwen et al. [18] applied natural luminosity imaging for
the visible flame development processes and emissions measurement. They observed that oxygen
content in the three oxygenated fuels lowered the smoke and unburned hydrocarbon emissions, with
NOx and fuel consumption penalties. Menkiel et al. [19] investigated the in-cylinder combustion and
soot formation processes with ULSD (ultra-low sulfur diesel) and RME in an optical engine by applying
PLII, natural luminosity and OH* CL. The results revealed that the ignition occurs earlier, and the early
phase of combustion proceeds more quickly for RME compared to ULSD. The flame lift-off length
(FLoL) and the length based on the first appearance of soot (SLoL) are longer for RME. Allocca et al.
[20] characterized the spatial fuel distribution, mixture formation and the vaporization-combustion
processes of the petrodiesel and RME in a non-evaporative spray chamber and an optically accessible
engine. The observation indicated that diesel fuel evaporates more efficiently than RME, which affect
the gaseous emissions; in fact, HC and CO for RME are slightly higher than diesel.
However, even though a number of studies have reported the benefits of renewable fuels in engine
performance and emissions, few studies have systematically compared the combustion process with
different renewable diesel fuels. In order to gain insight into the influence of chemical and physical
properties of fuels on spray, ignition and combustion characteristics, the in-situ optical diagnostic
techniques with high spatial resolution are employed to examine the spray and combustion processes
of renewable fuels. In this analysis, in-cylinder combustion processes for pure renewable fuels (HVO
and RME), blended diesel (HVO30) and petrol-diesel (EN590) are explored in an optical engine. The
Mie Scattering is employed to visualize the liquid phase before ignition. The natural luminosity is
adopted to reveal the effects of different fuels on combustion processes. Imaging analysis assisted with
cylinder pressure is conducted to estimate the engine performance.
2 Experimental Apparatus
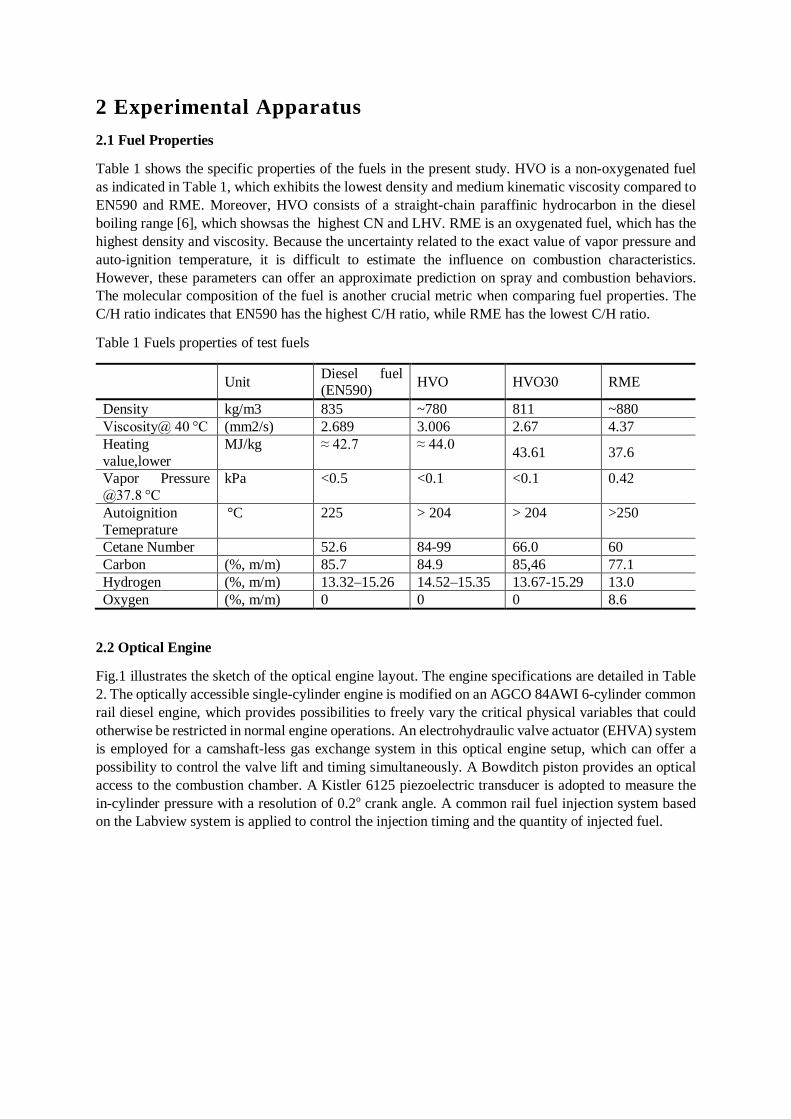
2.1 Fuel Properties
Table 1 shows the specific properties of the fuels in the present study. HVO is a non-oxygenated fuel
as indicated in Table 1, which exhibits the lowest density and medium kinematic viscosity compared to
EN590 and RME. Moreover, HVO consists of a straight-chain paraffinic hydrocarbon in the diesel
boiling range [6], which showsas the highest CN and LHV. RME is an oxygenated fuel, which has the
highest density and viscosity. Because the uncertainty related to the exact value of vapor pressure and
auto-ignition temperature, it is difficult to estimate the influence on combustion characteristics.
However, these parameters can offer an approximate prediction on spray and combustion behaviors.
The molecular composition of the fuel is another crucial metric when comparing fuel properties. The
C/H ratio indicates that EN590 has the highest C/H ratio, while RME has the lowest C/H ratio.
Table 1 Fuels properties of test fuels
Unit Diesel fuel (EN590)
HVO HVO30 RME
Density kg/m3 835 ~780 811 ~880
Viscosity@ 40 °C (mm2/s) 2.689 3.006 2.67 4.37
Heating
value,lower
MJ/kg ≈ 42.7 ≈ 44.0 43.61 37.6
Vapor Pressure
@37.8 °C
kPa <0.5 <0.1 <0.1 0.42
Autoignition
Temeprature
°C 225 > 204 > 204 >250
Cetane Number 52.6 84-99 66.0 60
Carbon (%, m/m) 85.7 84.9 85,46 77.1
Hydrogen (%, m/m) 13.32–15.26 14.52–15.35 13.67-15.29 13.0
Oxygen (%, m/m) 0 0 0 8.6
2.2 Optical Engine
Fig.1 illustrates the sketch of the optical engine layout. The engine specifications are detailed in Table
2. The optically accessible single-cylinder engine is modified on an AGCO 84AWI 6-cylinder common
rail diesel engine, which provides possibilities to freely vary the critical physical variables that could
otherwise be restricted in normal engine operations. An electrohydraulic valve actuator (EHVA) system
is employed for a camshaft-less gas exchange system in this optical engine setup, which can offer a
possibility to control the valve lift and timing simultaneously. A Bowditch piston provides an optical
access to the combustion chamber. A Kistler 6125 piezoelectric transducer is adopted to measure the
in-cylinder pressure with a resolution of 0.2o crank angle. A common rail fuel injection system based
on the Labview system is applied to control the injection timing and the quantity of injected fuel.
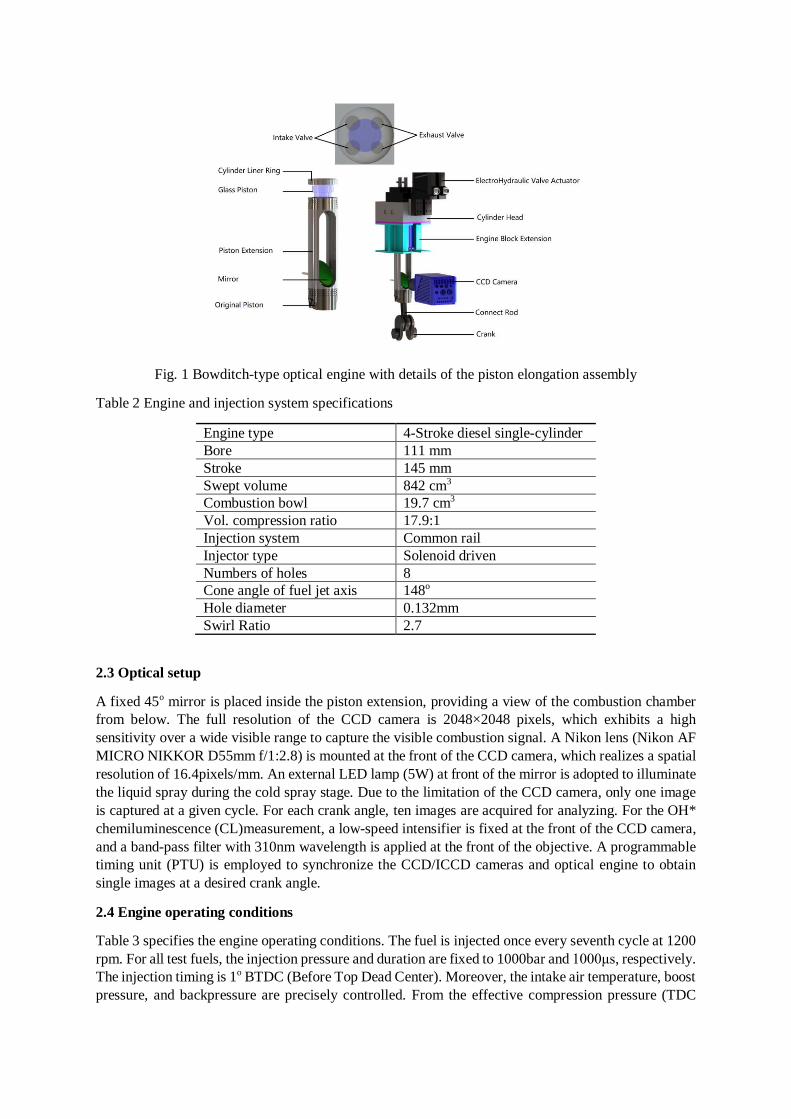
Fig. 1 Bowditch-type optical engine with details of the piston elongation assembly
Table 2 Engine and injection system specifications
Engine type 4-Stroke diesel single-cylinder
Bore 111 mm
Stroke 145 mm
Swept volume 842 cm3
Combustion bowl 19.7 cm3
Vol. compression ratio 17.9:1
Injection system Common rail
Injector type Solenoid driven
Numbers of holes 8
Cone angle of fuel jet axis 148o
Hole diameter 0.132mm
Swirl Ratio 2.7
2.3 Optical setup
A fixed 45o mirror is placed inside the piston extension, providing a view of the combustion chamber
from below. The full resolution of the CCD camera is 2048×2048 pixels, which exhibits a high
sensitivity over a wide visible range to capture the visible combustion signal. A Nikon lens (Nikon AF
MICRO NIKKOR D55mm f/1:2.8) is mounted at the front of the CCD camera, which realizes a spatial
resolution of 16.4pixels/mm. An external LED lamp (5W) at front of the mirror is adopted to illuminate
the liquid spray during the cold spray stage. Due to the limitation of the CCD camera, only one image
is captured at a given cycle. For each crank angle, ten images are acquired for analyzing. For the OH*
chemiluminescence (CL)measurement, a low-speed intensifier is fixed at the front of the CCD camera,
and a band-pass filter with 310nm wavelength is applied at the front of the objective. A programmable
timing unit (PTU) is employed to synchronize the CCD/ICCD cameras and optical engine to obtain
single images at a desired crank angle.
2.4 Engine operating conditions
Table 3 specifies the engine operating conditions. The fuel is injected once every seventh cycle at 1200
rpm. For all test fuels, the injection pressure and duration are fixed to 1000bar and 1000μs, respectively.
The injection timing is 1o BTDC (Before Top Dead Center). Moreover, the intake air temperature, boost
pressure, and backpressure are precisely controlled. From the effective compression pressure (TDC
pressure 77 bar), the temperature and density at TDC can be estimated. At motored condition, the
temperature and density at TDC are 889K and 29.2kg/m3, respectively.
Table 3 Engine operating conditions
Parameter Value and Unit
Speed 1200 RPM
Injection pressure 1000 bar
Injection Timing 1o BTDC
Injection Duration 1000μs
Motored peak pressure 77 bar
Intake air temperature 75ºC
Boost pressure 1.3 bar
Back pressure 0.47 bar
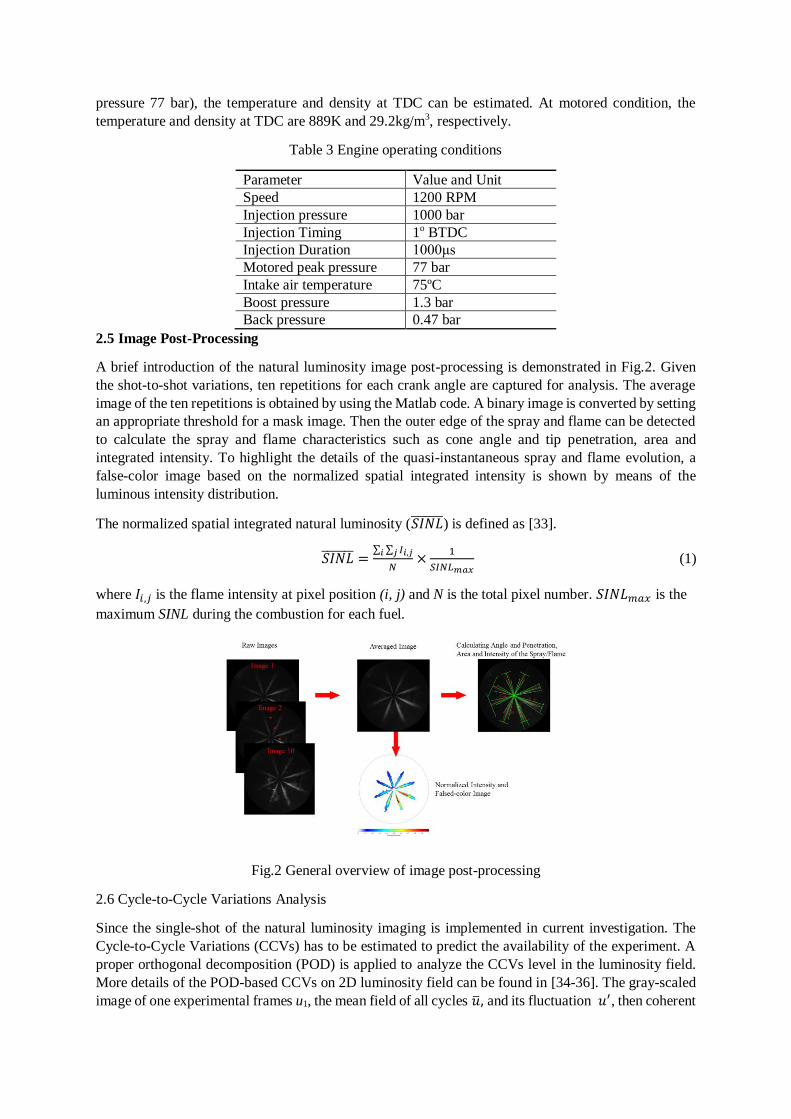
2.5 Image Post-Processing
A brief introduction of the natural luminosity image post-processing is demonstrated in Fig.2. Given
the shot-to-shot variations, ten repetitions for each crank angle are captured for analysis. The average
image of the ten repetitions is obtained by using the Matlab code. A binary image is converted by setting
an appropriate threshold for a mask image. Then the outer edge of the spray and flame can be detected
to calculate the spray and flame characteristics such as cone angle and tip penetration, area and
integrated intensity. To highlight the details of the quasi-instantaneous spray and flame evolution, a
false-color image based on the normalized spatial integrated intensity is shown by means of the
luminous intensity distribution.
The normalized spatial integrated natural luminosity (𝑆𝐼𝑁𝐿̅̅ ̅̅ ̅̅ ̅) is defined as [33].
𝑆𝐼𝑁𝐿̅̅ ̅̅ ̅̅ ̅ =∑ ∑ 𝐼𝑖,𝑗𝑗𝑖
𝑁×
1
𝑆𝐼𝑁𝐿𝑚𝑎𝑥 (1)
where 𝐼𝑖,𝑗 is the flame intensity at pixel position (i, j) and N is the total pixel number. 𝑆𝐼𝑁𝐿𝑚𝑎𝑥 is the
maximum SINL during the combustion for each fuel.
Fig.2 General overview of image post-processing
2.6 Cycle-to-Cycle Variations Analysis
Since the single-shot of the natural luminosity imaging is implemented in current investigation. The
Cycle-to-Cycle Variations (CCVs) has to be estimated to predict the availability of the experiment. A
proper orthogonal decomposition (POD) is applied to analyze the CCVs level in the luminosity field.
More details of the POD-based CCVs on 2D luminosity field can be found in [34-36]. The gray-scaled
image of one experimental frames u1, the mean field of all cycles �̅�, and its fluctuation 𝑢′, then coherent
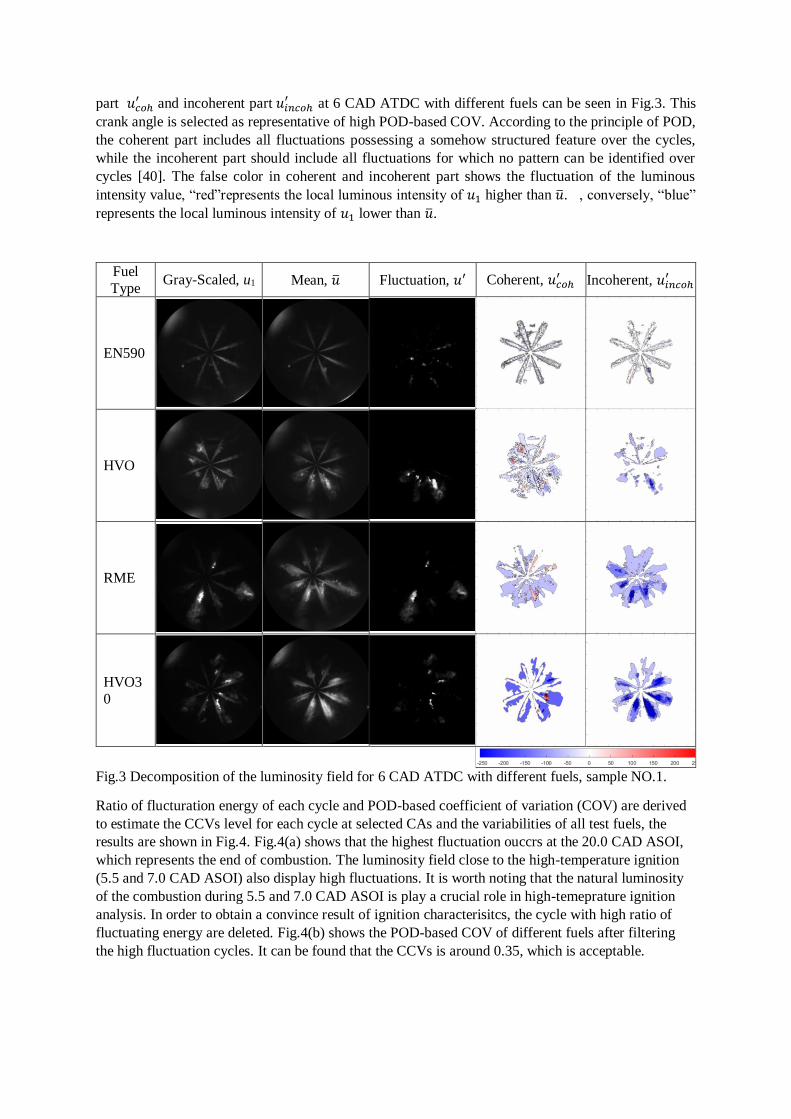
part 𝑢𝑐𝑜ℎ′ and incoherent part 𝑢𝑖𝑛𝑐𝑜ℎ
′ at 6 CAD ATDC with different fuels can be seen in Fig.3. This
crank angle is selected as representative of high POD-based COV. According to the principle of POD,
the coherent part includes all fluctuations possessing a somehow structured feature over the cycles,
while the incoherent part should include all fluctuations for which no pattern can be identified over
cycles [40]. The false color in coherent and incoherent part shows the fluctuation of the luminous
intensity value, “red”represents the local luminous intensity of 𝑢1 higher than �̅�. , conversely, “blue”
represents the local luminous intensity of 𝑢1 lower than �̅�.
Fuel
Type Gray-Scaled, u1 Mean, �̅� Fluctuation, 𝑢′ Coherent, 𝑢𝑐𝑜ℎ
′ Incoherent, 𝑢𝑖𝑛𝑐𝑜ℎ′
EN590
HVO
RME
HVO3
0
Fig.3 Decomposition of the luminosity field for 6 CAD ATDC with different fuels, sample NO.1.
Ratio of flucturation energy of each cycle and POD-based coefficient of variation (COV) are derived
to estimate the CCVs level for each cycle at selected CAs and the variabilities of all test fuels, the
results are shown in Fig.4. Fig.4(a) shows that the highest fluctuation ouccrs at the 20.0 CAD ASOI,
which represents the end of combustion. The luminosity field close to the high-temperature ignition
(5.5 and 7.0 CAD ASOI) also display high fluctuations. It is worth noting that the natural luminosity
of the combustion during 5.5 and 7.0 CAD ASOI is play a crucial role in high-temeprature ignition
analysis. In order to obtain a convince result of ignition characterisitcs, the cycle with high ratio of
fluctuating energy are deleted. Fig.4(b) shows the POD-based COV of different fuels after filtering
the high fluctuation cycles. It can be found that the CCVs is around 0.35, which is acceptable.
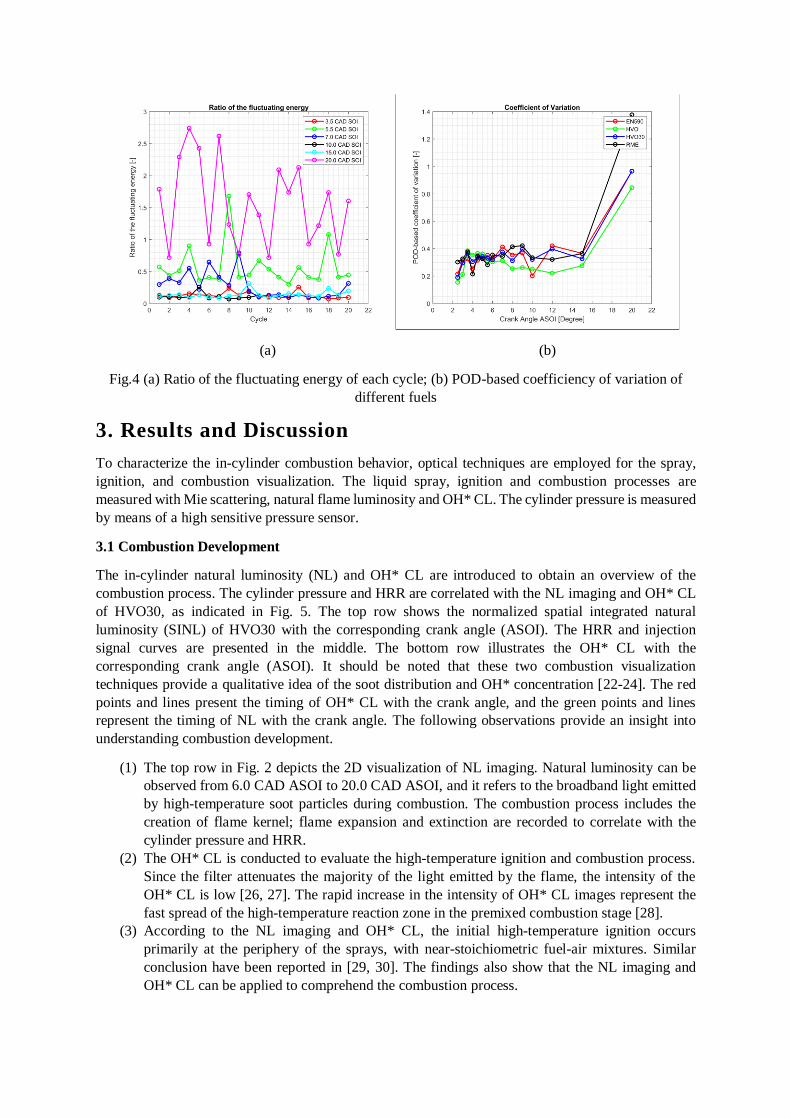
(a) (b)
Fig.4 (a) Ratio of the fluctuating energy of each cycle; (b) POD-based coefficiency of variation of
different fuels
3. Results and Discussion
To characterize the in-cylinder combustion behavior, optical techniques are employed for the spray,
ignition, and combustion visualization. The liquid spray, ignition and combustion processes are
measured with Mie scattering, natural flame luminosity and OH* CL. The cylinder pressure is measured
by means of a high sensitive pressure sensor.
3.1 Combustion Development
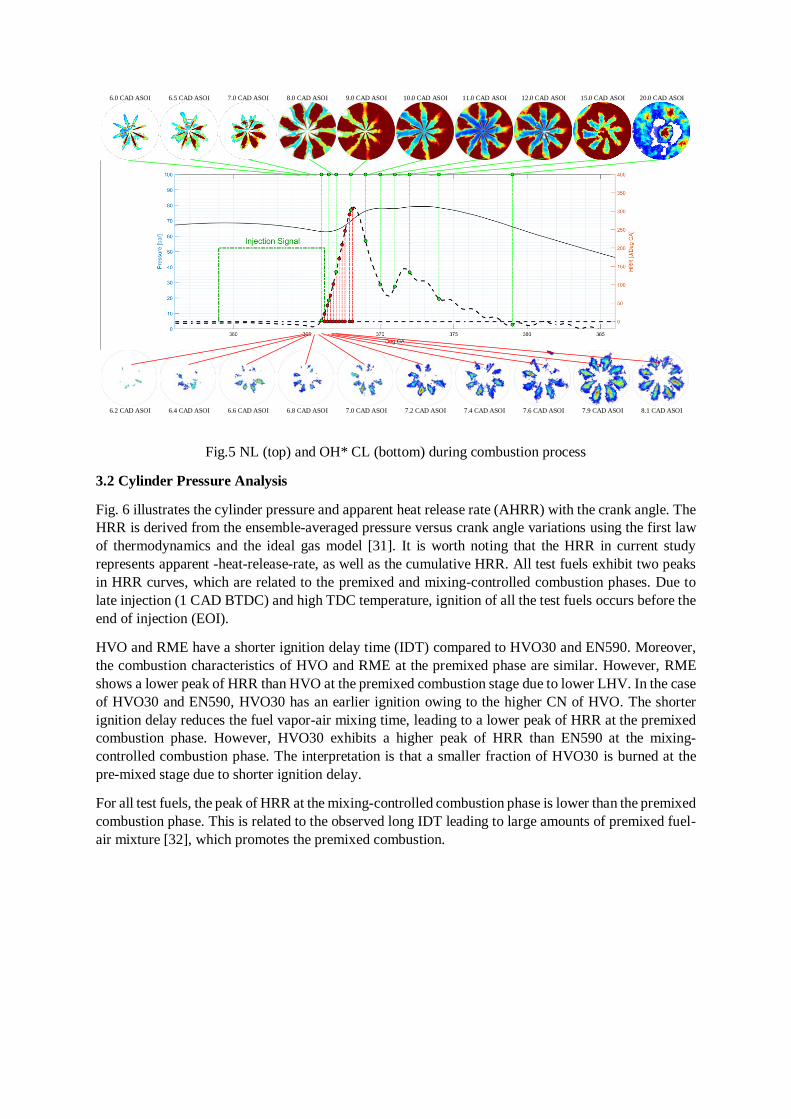
The in-cylinder natural luminosity (NL) and OH* CL are introduced to obtain an overview of the
combustion process. The cylinder pressure and HRR are correlated with the NL imaging and OH* CL
of HVO30, as indicated in Fig. 5. The top row shows the normalized spatial integrated natural
luminosity (SINL) of HVO30 with the corresponding crank angle (ASOI). The HRR and injection
signal curves are presented in the middle. The bottom row illustrates the OH* CL with the
corresponding crank angle (ASOI). It should be noted that these two combustion visualization
techniques provide a qualitative idea of the soot distribution and OH* concentration [22-24]. The red
points and lines present the timing of OH* CL with the crank angle, and the green points and lines
represent the timing of NL with the crank angle. The following observations provide an insight into
understanding combustion development.
(1) The top row in Fig. 2 depicts the 2D visualization of NL imaging. Natural luminosity can be
observed from 6.0 CAD ASOI to 20.0 CAD ASOI, and it refers to the broadband light emitted
by high-temperature soot particles during combustion. The combustion process includes the
creation of flame kernel; flame expansion and extinction are recorded to correlate with the
cylinder pressure and HRR.
(2) The OH* CL is conducted to evaluate the high-temperature ignition and combustion process.
Since the filter attenuates the majority of the light emitted by the flame, the intensity of the
OH* CL is low [26, 27]. The rapid increase in the intensity of OH* CL images represent the
fast spread of the high-temperature reaction zone in the premixed combustion stage [28].
(3) According to the NL imaging and OH* CL, the initial high-temperature ignition occurs
primarily at the periphery of the sprays, with near-stoichiometric fuel-air mixtures. Similar
conclusion have been reported in [29, 30]. The findings also show that the NL imaging and
OH* CL can be applied to comprehend the combustion process.
6.0 CAD ASOI 6.5 CAD ASOI 7.0 CAD ASOI 8.0 CAD ASOI 9.0 CAD ASOI 10.0 CAD ASOI 11.0 CAD ASOI 12.0 CAD ASOI 15.0 CAD ASOI 20.0 CAD ASOI
6.2 CAD ASOI 6.4 CAD ASOI 6.6 CAD ASOI 6.8 CAD ASOI 7.0 CAD ASOI 7.2 CAD ASOI 7.4 CAD ASOI 7.6 CAD ASOI 7.9 CAD ASOI 8.1 CAD ASOI
Fig.5 NL (top) and OH* CL (bottom) during combustion process
3.2 Cylinder Pressure Analysis
Fig. 6 illustrates the cylinder pressure and apparent heat release rate (AHRR) with the crank angle. The
HRR is derived from the ensemble-averaged pressure versus crank angle variations using the first law
of thermodynamics and the ideal gas model [31]. It is worth noting that the HRR in current study
represents apparent -heat-release-rate, as well as the cumulative HRR. All test fuels exhibit two peaks
in HRR curves, which are related to the premixed and mixing-controlled combustion phases. Due to
late injection (1 CAD BTDC) and high TDC temperature, ignition of all the test fuels occurs before the
end of injection (EOI).
HVO and RME have a shorter ignition delay time (IDT) compared to HVO30 and EN590. Moreover,
the combustion characteristics of HVO and RME at the premixed phase are similar. However, RME
shows a lower peak of HRR than HVO at the premixed combustion stage due to lower LHV. In the case
of HVO30 and EN590, HVO30 has an earlier ignition owing to the higher CN of HVO. The shorter
ignition delay reduces the fuel vapor-air mixing time, leading to a lower peak of HRR at the premixed
combustion phase. However, HVO30 exhibits a higher peak of HRR than EN590 at the mixing-
controlled combustion phase. The interpretation is that a smaller fraction of HVO30 is burned at the
pre-mixed stage due to shorter ignition delay.
For all test fuels, the peak of HRR at the mixing-controlled combustion phase is lower than the premixed
combustion phase. This is related to the observed long IDT leading to large amounts of premixed fuel-
air mixture [32], which promotes the premixed combustion.
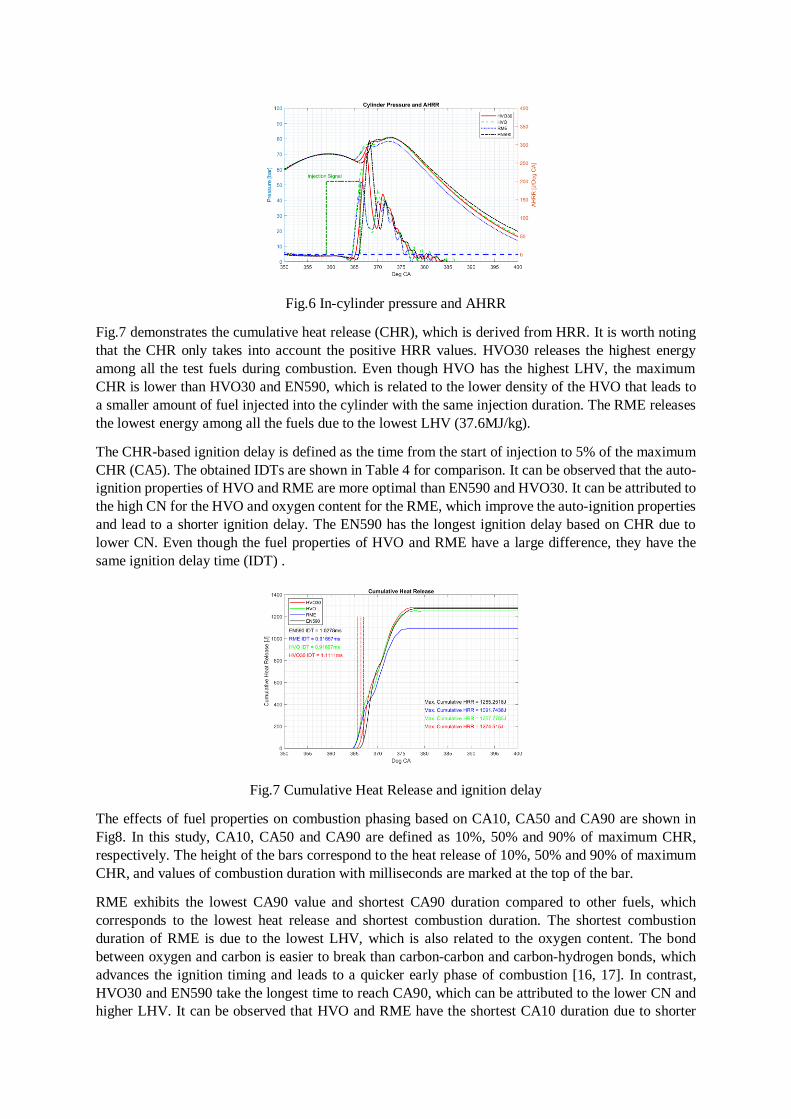
Fig.6 In-cylinder pressure and AHRR
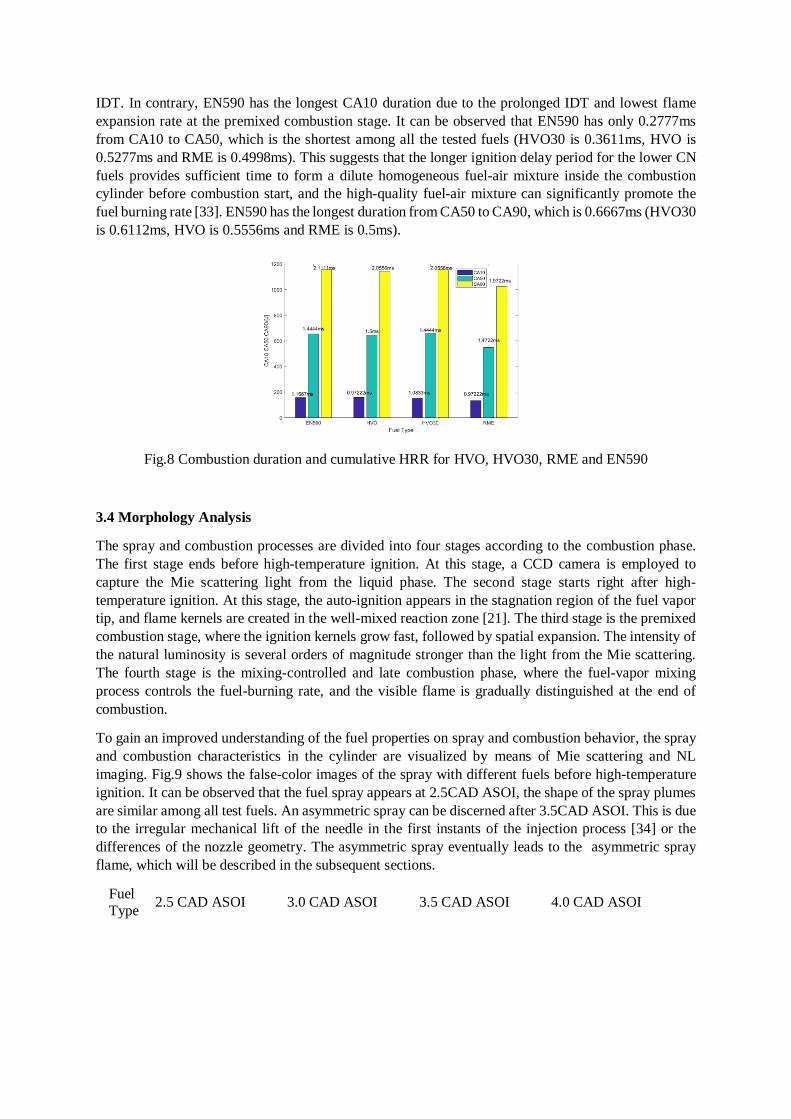
Fig.7 demonstrates the cumulative heat release (CHR), which is derived from HRR. It is worth noting
that the CHR only takes into account the positive HRR values. HVO30 releases the highest energy
among all the test fuels during combustion. Even though HVO has the highest LHV, the maximum
CHR is lower than HVO30 and EN590, which is related to the lower density of the HVO that leads to
a smaller amount of fuel injected into the cylinder with the same injection duration. The RME releases
the lowest energy among all the fuels due to the lowest LHV (37.6MJ/kg).
The CHR-based ignition delay is defined as the time from the start of injection to 5% of the maximum
CHR (CA5). The obtained IDTs are shown in Table 4 for comparison. It can be observed that the auto-
ignition properties of HVO and RME are more optimal than EN590 and HVO30. It can be attributed to
the high CN for the HVO and oxygen content for the RME, which improve the auto-ignition properties
and lead to a shorter ignition delay. The EN590 has the longest ignition delay based on CHR due to
lower CN. Even though the fuel properties of HVO and RME have a large difference, they have the
same ignition delay time (IDT) .
Fig.7 Cumulative Heat Release and ignition delay
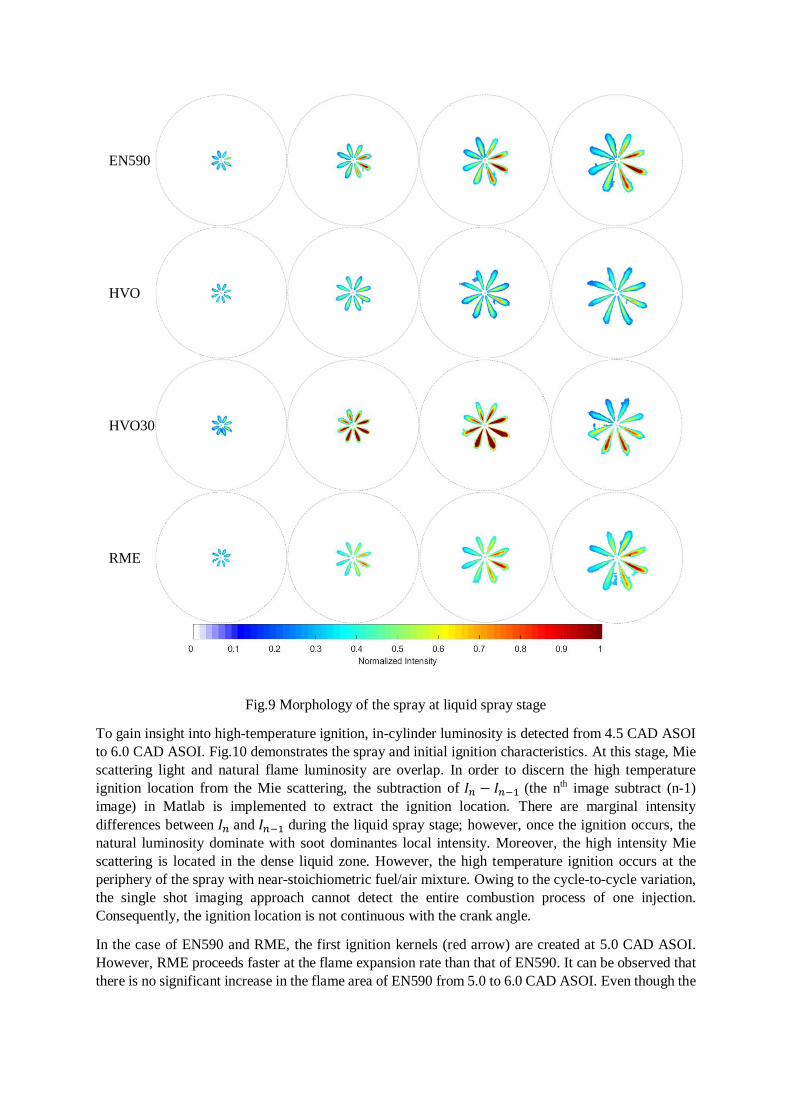
The effects of fuel properties on combustion phasing based on CA10, CA50 and CA90 are shown in
Fig8. In this study, CA10, CA50 and CA90 are defined as 10%, 50% and 90% of maximum CHR,
respectively. The height of the bars correspond to the heat release of 10%, 50% and 90% of maximum
CHR, and values of combustion duration with milliseconds are marked at the top of the bar.
RME exhibits the lowest CA90 value and shortest CA90 duration compared to other fuels, which
corresponds to the lowest heat release and shortest combustion duration. The shortest combustion
duration of RME is due to the lowest LHV, which is also related to the oxygen content. The bond
between oxygen and carbon is easier to break than carbon-carbon and carbon-hydrogen bonds, which
advances the ignition timing and leads to a quicker early phase of combustion [16, 17]. In contrast,
HVO30 and EN590 take the longest time to reach CA90, which can be attributed to the lower CN and
higher LHV. It can be observed that HVO and RME have the shortest CA10 duration due to shorter
IDT. In contrary, EN590 has the longest CA10 duration due to the prolonged IDT and lowest flame
expansion rate at the premixed combustion stage. It can be observed that EN590 has only 0.2777ms
from CA10 to CA50, which is the shortest among all the tested fuels (HVO30 is 0.3611ms, HVO is
0.5277ms and RME is 0.4998ms). This suggests that the longer ignition delay period for the lower CN
fuels provides sufficient time to form a dilute homogeneous fuel-air mixture inside the combustion
cylinder before combustion start, and the high-quality fuel-air mixture can significantly promote the
fuel burning rate [33]. EN590 has the longest duration from CA50 to CA90, which is 0.6667ms (HVO30
is 0.6112ms, HVO is 0.5556ms and RME is 0.5ms).
Fig.8 Combustion duration and cumulative HRR for HVO, HVO30, RME and EN590
3.4 Morphology Analysis
The spray and combustion processes are divided into four stages according to the combustion phase.
The first stage ends before high-temperature ignition. At this stage, a CCD camera is employed to
capture the Mie scattering light from the liquid phase. The second stage starts right after high-
temperature ignition. At this stage, the auto-ignition appears in the stagnation region of the fuel vapor
tip, and flame kernels are created in the well-mixed reaction zone [21]. The third stage is the premixed
combustion stage, where the ignition kernels grow fast, followed by spatial expansion. The intensity of
the natural luminosity is several orders of magnitude stronger than the light from the Mie scattering.
The fourth stage is the mixing-controlled and late combustion phase, where the fuel-vapor mixing
process controls the fuel-burning rate, and the visible flame is gradually distinguished at the end of
combustion.
To gain an improved understanding of the fuel properties on spray and combustion behavior, the spray
and combustion characteristics in the cylinder are visualized by means of Mie scattering and NL
imaging. Fig.9 shows the false-color images of the spray with different fuels before high-temperature
ignition. It can be observed that the fuel spray appears at 2.5CAD ASOI, the shape of the spray plumes
are similar among all test fuels. An asymmetric spray can be discerned after 3.5CAD ASOI. This is due
to the irregular mechanical lift of the needle in the first instants of the injection process [34] or the
differences of the nozzle geometry. The asymmetric spray eventually leads to the asymmetric spray
flame, which will be described in the subsequent sections.
Fuel
Type 2.5 CAD ASOI 3.0 CAD ASOI 3.5 CAD ASOI 4.0 CAD ASOI
EN590
HVO
HVO30
RME
Fig.9 Morphology of the spray at liquid spray stage
To gain insight into high-temperature ignition, in-cylinder luminosity is detected from 4.5 CAD ASOI
to 6.0 CAD ASOI. Fig.10 demonstrates the spray and initial ignition characteristics. At this stage, Mie
scattering light and natural flame luminosity are overlap. In order to discern the high temperature
ignition location from the Mie scattering, the subtraction of 𝐼𝑛 − 𝐼𝑛−1 (the nth image subtract (n-1)
image) in Matlab is implemented to extract the ignition location. There are marginal intensity
differences between 𝐼𝑛 and 𝐼𝑛−1 during the liquid spray stage; however, once the ignition occurs, the
natural luminosity dominate with soot dominantes local intensity. Moreover, the high intensity Mie
scattering is located in the dense liquid zone. However, the high temperature ignition occurs at the
periphery of the spray with near-stoichiometric fuel/air mixture. Owing to the cycle-to-cycle variation,
the single shot imaging approach cannot detect the entire combustion process of one injection.
Consequently, the ignition location is not continuous with the crank angle.
In the case of EN590 and RME, the first ignition kernels (red arrow) are created at 5.0 CAD ASOI.
However, RME proceeds faster at the flame expansion rate than that of EN590. It can be observed that
there is no significant increase in the flame area of EN590 from 5.0 to 6.0 CAD ASOI. Even though the
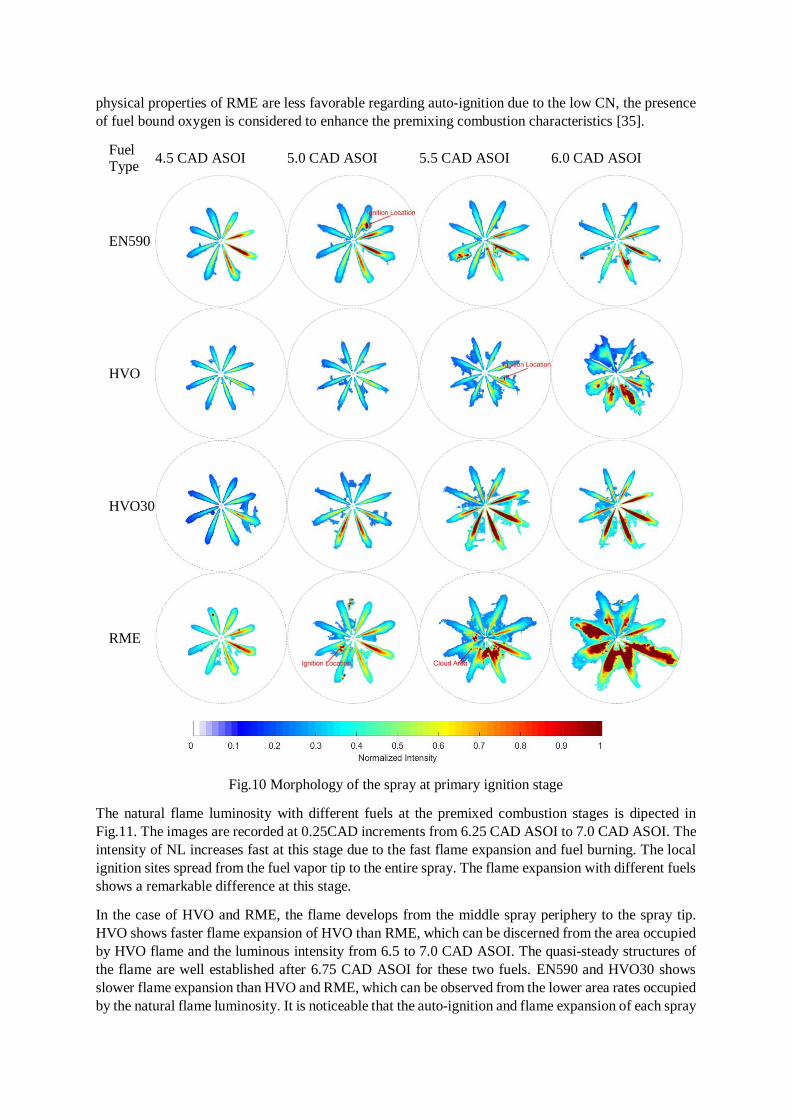
physical properties of RME are less favorable regarding auto-ignition due to the low CN, the presence
of fuel bound oxygen is considered to enhance the premixing combustion characteristics [35].
Fuel Type
4.5 CAD ASOI 5.0 CAD ASOI 5.5 CAD ASOI 6.0 CAD ASOI
EN590
HVO
HVO30
RME
Fig.10 Morphology of the spray at primary ignition stage
The natural flame luminosity with different fuels at the premixed combustion stages is dipected in
Fig.11. The images are recorded at 0.25CAD increments from 6.25 CAD ASOI to 7.0 CAD ASOI. The
intensity of NL increases fast at this stage due to the fast flame expansion and fuel burning. The local
ignition sites spread from the fuel vapor tip to the entire spray. The flame expansion with different fuels
shows a remarkable difference at this stage.
In the case of HVO and RME, the flame develops from the middle spray periphery to the spray tip.
HVO shows faster flame expansion of HVO than RME, which can be discerned from the area occupied
by HVO flame and the luminous intensity from 6.5 to 7.0 CAD ASOI. The quasi-steady structures of
the flame are well established after 6.75 CAD ASOI for these two fuels. EN590 and HVO30 shows
slower flame expansion than HVO and RME, which can be observed from the lower area rates occupied
by the natural flame luminosity. It is noticeable that the auto-ignition and flame expansion of each spray
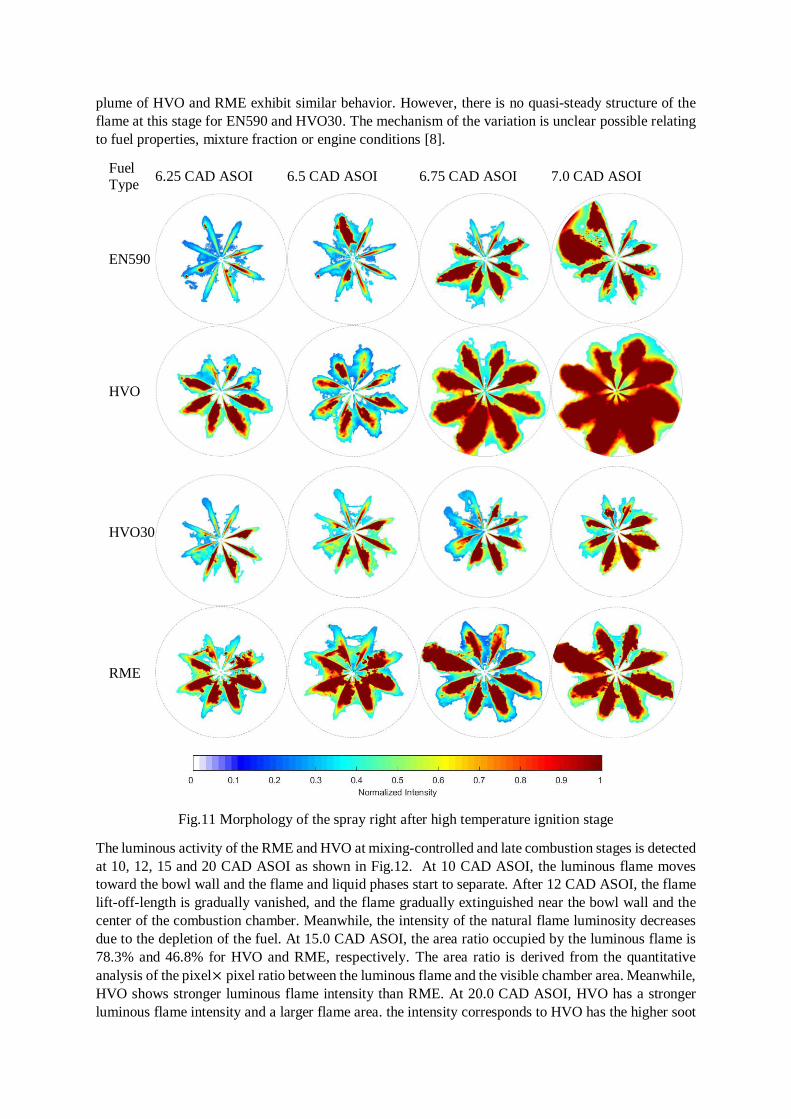
plume of HVO and RME exhibit similar behavior. However, there is no quasi-steady structure of the
flame at this stage for EN590 and HVO30. The mechanism of the variation is unclear possible relating
to fuel properties, mixture fraction or engine conditions [8].
Fuel Type
6.25 CAD ASOI 6.5 CAD ASOI 6.75 CAD ASOI 7.0 CAD ASOI
EN590
HVO
HVO30
RME
Fig.11 Morphology of the spray right after high temperature ignition stage
The luminous activity of the RME and HVO at mixing-controlled and late combustion stages is detected
at 10, 12, 15 and 20 CAD ASOI as shown in Fig.12. At 10 CAD ASOI, the luminous flame moves
toward the bowl wall and the flame and liquid phases start to separate. After 12 CAD ASOI, the flame
lift-off-length is gradually vanished, and the flame gradually extinguished near the bowl wall and the
center of the combustion chamber. Meanwhile, the intensity of the natural flame luminosity decreases
due to the depletion of the fuel. At 15.0 CAD ASOI, the area ratio occupied by the luminous flame is
78.3% and 46.8% for HVO and RME, respectively. The area ratio is derived from the quantitative
analysis of the pixel× pixel ratio between the luminous flame and the visible chamber area. Meanwhile,
HVO shows stronger luminous flame intensity than RME. At 20.0 CAD ASOI, HVO has a stronger
luminous flame intensity and a larger flame area. the intensity corresponds to HVO has the higher soot
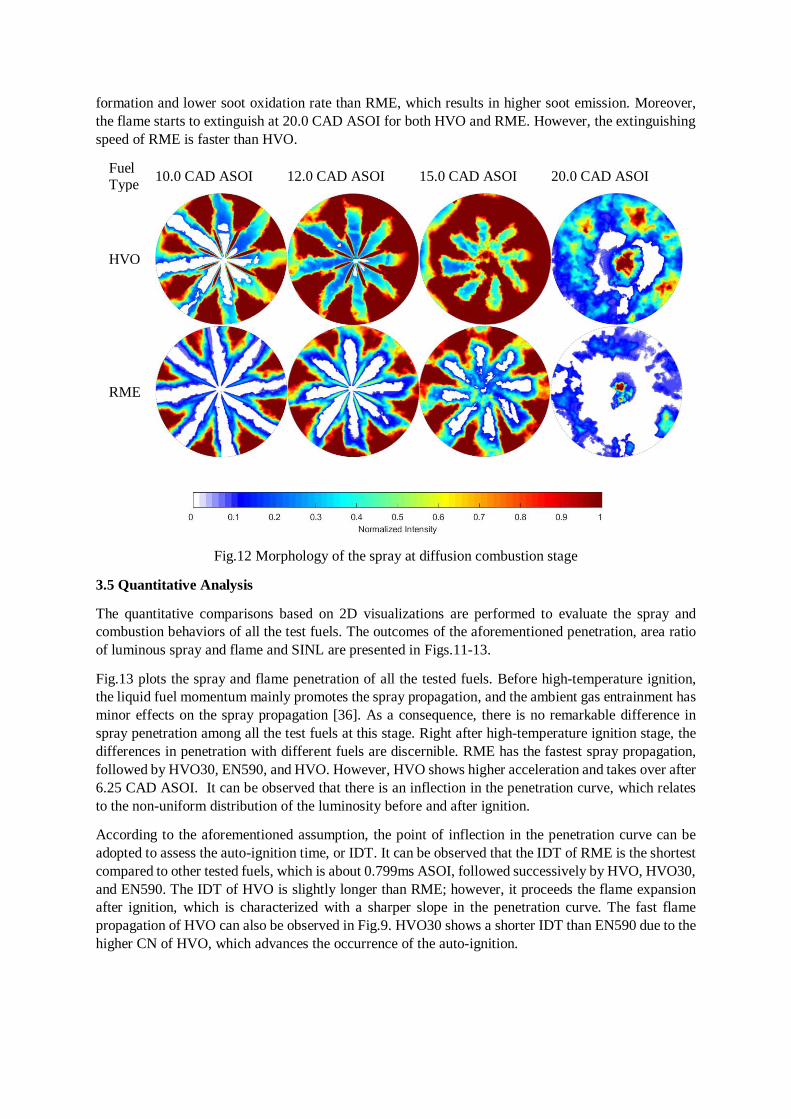
formation and lower soot oxidation rate than RME, which results in higher soot emission. Moreover,
the flame starts to extinguish at 20.0 CAD ASOI for both HVO and RME. However, the extinguishing
speed of RME is faster than HVO.
Fuel Type
10.0 CAD ASOI 12.0 CAD ASOI 15.0 CAD ASOI 20.0 CAD ASOI
HVO
RME
Fig.12 Morphology of the spray at diffusion combustion stage
3.5 Quantitative Analysis
The quantitative comparisons based on 2D visualizations are performed to evaluate the spray and
combustion behaviors of all the test fuels. The outcomes of the aforementioned penetration, area ratio
of luminous spray and flame and SINL are presented in Figs.11-13.
Fig.13 plots the spray and flame penetration of all the tested fuels. Before high-temperature ignition,
the liquid fuel momentum mainly promotes the spray propagation, and the ambient gas entrainment has
minor effects on the spray propagation [36]. As a consequence, there is no remarkable difference in
spray penetration among all the test fuels at this stage. Right after high-temperature ignition stage, the
differences in penetration with different fuels are discernible. RME has the fastest spray propagation,
followed by HVO30, EN590, and HVO. However, HVO shows higher acceleration and takes over after
6.25 CAD ASOI. It can be observed that there is an inflection in the penetration curve, which relates
to the non-uniform distribution of the luminosity before and after ignition.
According to the aforementioned assumption, the point of inflection in the penetration curve can be
adopted to assess the auto-ignition time, or IDT. It can be observed that the IDT of RME is the shortest
compared to other tested fuels, which is about 0.799ms ASOI, followed successively by HVO, HVO30,
and EN590. The IDT of HVO is slightly longer than RME; however, it proceeds the flame expansion
after ignition, which is characterized with a sharper slope in the penetration curve. The fast flame
propagation of HVO can also be observed in Fig.9. HVO30 shows a shorter IDT than EN590 due to the
higher CN of HVO, which advances the occurrence of the auto-ignition.
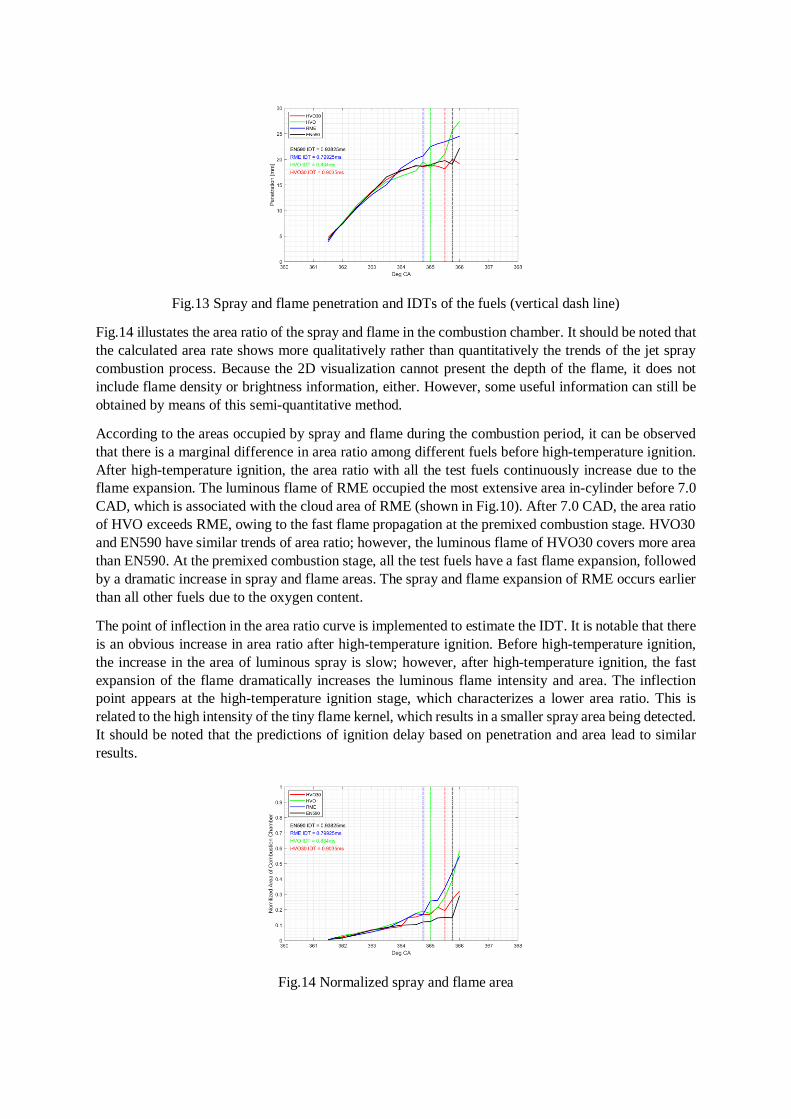
Fig.13 Spray and flame penetration and IDTs of the fuels (vertical dash line)
Fig.14 illustates the area ratio of the spray and flame in the combustion chamber. It should be noted that
the calculated area rate shows more qualitatively rather than quantitatively the trends of the jet spray
combustion process. Because the 2D visualization cannot present the depth of the flame, it does not
include flame density or brightness information, either. However, some useful information can still be
obtained by means of this semi-quantitative method.
According to the areas occupied by spray and flame during the combustion period, it can be observed
that there is a marginal difference in area ratio among different fuels before high-temperature ignition.
After high-temperature ignition, the area ratio with all the test fuels continuously increase due to the
flame expansion. The luminous flame of RME occupied the most extensive area in-cylinder before 7.0
CAD, which is associated with the cloud area of RME (shown in Fig.10). After 7.0 CAD, the area ratio
of HVO exceeds RME, owing to the fast flame propagation at the premixed combustion stage. HVO30
and EN590 have similar trends of area ratio; however, the luminous flame of HVO30 covers more area
than EN590. At the premixed combustion stage, all the test fuels have a fast flame expansion, followed
by a dramatic increase in spray and flame areas. The spray and flame expansion of RME occurs earlier
than all other fuels due to the oxygen content.
The point of inflection in the area ratio curve is implemented to estimate the IDT. It is notable that there
is an obvious increase in area ratio after high-temperature ignition. Before high-temperature ignition,
the increase in the area of luminous spray is slow; however, after high-temperature ignition, the fast
expansion of the flame dramatically increases the luminous flame intensity and area. The inflection
point appears at the high-temperature ignition stage, which characterizes a lower area ratio. This is
related to the high intensity of the tiny flame kernel, which results in a smaller spray area being detected.
It should be noted that the predictions of ignition delay based on penetration and area lead to similar
results.
Fig.14 Normalized spray and flame area
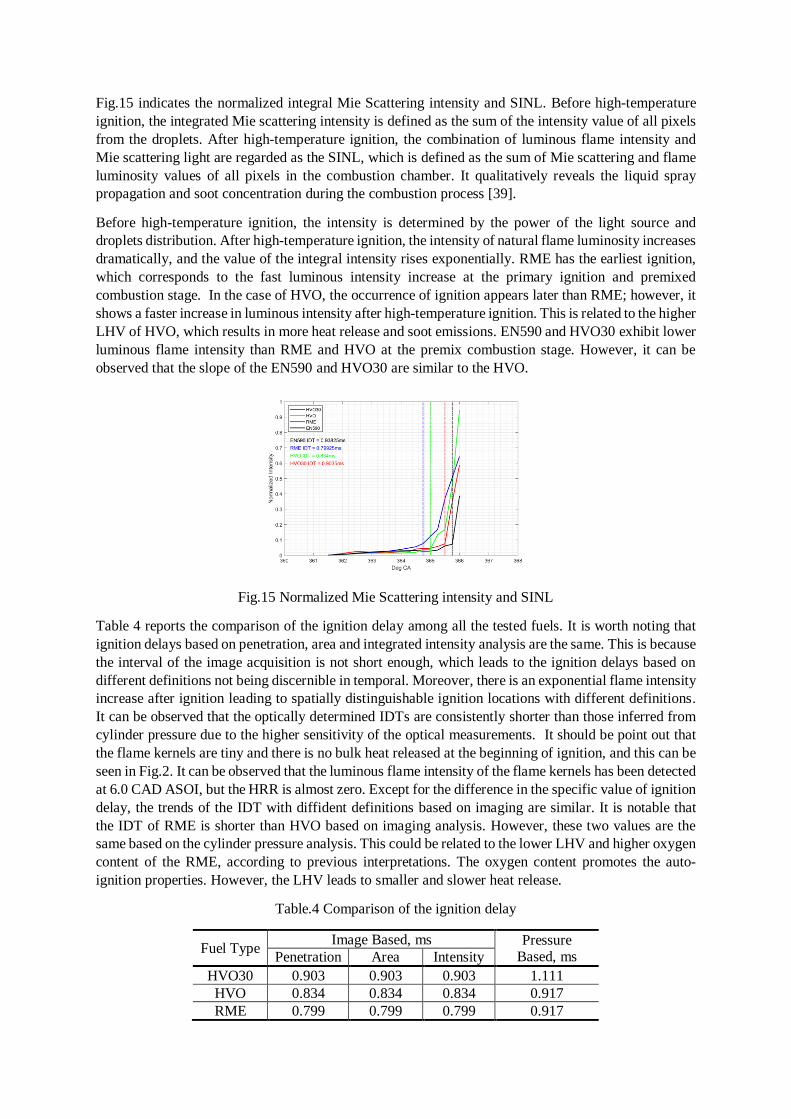
Fig.15 indicates the normalized integral Mie Scattering intensity and SINL. Before high-temperature
ignition, the integrated Mie scattering intensity is defined as the sum of the intensity value of all pixels
from the droplets. After high-temperature ignition, the combination of luminous flame intensity and
Mie scattering light are regarded as the SINL, which is defined as the sum of Mie scattering and flame
luminosity values of all pixels in the combustion chamber. It qualitatively reveals the liquid spray
propagation and soot concentration during the combustion process [39].
Before high-temperature ignition, the intensity is determined by the power of the light source and
droplets distribution. After high-temperature ignition, the intensity of natural flame luminosity increases
dramatically, and the value of the integral intensity rises exponentially. RME has the earliest ignition,
which corresponds to the fast luminous intensity increase at the primary ignition and premixed
combustion stage. In the case of HVO, the occurrence of ignition appears later than RME; however, it
shows a faster increase in luminous intensity after high-temperature ignition. This is related to the higher
LHV of HVO, which results in more heat release and soot emissions. EN590 and HVO30 exhibit lower
luminous flame intensity than RME and HVO at the premix combustion stage. However, it can be
observed that the slope of the EN590 and HVO30 are similar to the HVO.
Fig.15 Normalized Mie Scattering intensity and SINL
Table 4 reports the comparison of the ignition delay among all the tested fuels. It is worth noting that
ignition delays based on penetration, area and integrated intensity analysis are the same. This is because
the interval of the image acquisition is not short enough, which leads to the ignition delays based on
different definitions not being discernible in temporal. Moreover, there is an exponential flame intensity
increase after ignition leading to spatially distinguishable ignition locations with different definitions.
It can be observed that the optically determined IDTs are consistently shorter than those inferred from
cylinder pressure due to the higher sensitivity of the optical measurements. It should be point out that
the flame kernels are tiny and there is no bulk heat released at the beginning of ignition, and this can be
seen in Fig.2. It can be observed that the luminous flame intensity of the flame kernels has been detected
at 6.0 CAD ASOI, but the HRR is almost zero. Except for the difference in the specific value of ignition
delay, the trends of the IDT with diffident definitions based on imaging are similar. It is notable that
the IDT of RME is shorter than HVO based on imaging analysis. However, these two values are the
same based on the cylinder pressure analysis. This could be related to the lower LHV and higher oxygen
content of the RME, according to previous interpretations. The oxygen content promotes the auto-
ignition properties. However, the LHV leads to smaller and slower heat release.
Table.4 Comparison of the ignition delay
Fuel Type Image Based, ms Pressure
Based, ms Penetration Area Intensity
HVO30 0.903 0.903 0.903 1.111
HVO 0.834 0.834 0.834 0.917
RME 0.799 0.799 0.799 0.917
EN590 0.938 0.938 0.938 1.028
4 Conclusions
Optical diagnostics based on Mie scattering and natural luminosity are applied to examine the effects
of alternative fuel properties on spray and combustion characteristics in an optical diesel engine. Four
fuels, HVO, EN590, HVO30, and RME, are selected as test fuels, representing non-oxygenated content
renewable fuel, standard petrol-diesel, blended fuel and oxygenated biofuel, respectively. A single shot
Mie scattering combined with the NL imaging are employed to detect the spray and combustion
processes. The in-cylinder pressure and HRR correlate with the NL imaging and OH*
chemiluminescence of HVO30 to gain insight into the combustion process. The major conclusions
regarding the fuel specific combustion behaviors are given as follows:
(1) The overview of the NL imaging and OH* chemiluminescence of HVO30 indicates that the high-
temperature ignition delays based on NL imaging well agreed with the OH* chemiluminescence. As
the further analysis, the ignition location can be also discerned from the subtraction of two images of
consecutive cycles.
(2) To reduce the effect of cycle-to-cycle variations on the analysis of the spray and combustion
processes. A POD-based method is applied to estimate the variability level of each cycle, and then get
rid of the cycle with high CCVs based on the ratio of fluctuating energy. The results show that the CCVs
of all test fuels are reasonable and acceptable.
(3) All test fuels exhibite similar spray behavior such as spray penetration, area and intensity in cylinder.
However, significant differences can be discerned from the luminosity field after high-temperature
ignition, for instance, RME has the earliest ignition delay than other fuels; HVO and RME showed
faster flame expansion than EN590 and HVO30; the combustion duration of HVO is longer than RME,
which exhibite a longer duration of sooty flame.
(4) The quantitative analysises based on the luminosity field are performed to estimate the ignition
delays. It can be observed that there is an inflection in the penetration curve, which relates to the non-
uniform distribution of the luminosity before and after ignition. This has a significant effect on the
penetration, area and intensity curves, which exhibite inflection point on those curves. The results show
that the IDTs of each fuel based on penetration, area and intensity are exactly the same, and well agreed
with the pressure-based IDTs.
(5) Overall, HVO is beneficial in fuel for diesel engines due to high CN, which results in short IDT.
For the RME, despite the lower CN, the oxygen content promotes its auto-ignition characteristics, which
exhibit similar or even shorter IDT than HVO. According to this study, the properties of HVO and RME
are characterized by shorter IDT and faster flame expansion than EN590, which present two possible
means of partially replacing diesel fuel among the multitude of possible renewable fuels.
Nomenclature
ASOI = After Start of Injection
CHR=Cumulative Heat Release Rate
CL = Chemiluminescence CAD=Crank Angle Degree
CA10 =CAD corresponding to 10% maximum CHR
CA50 =CAD corresponding to 50% maximum CHR
CA90 =CAD corresponding to 90% maximum CHR CN=Cetane Number
CO = Carbon Monoxide
EN590=European Stand Diesel HC=Unburned Hydrocarbons
HVO= Hydrotreated Vegetable Oil
HVO30=70% EN590 and 30% HVO
HRR= Heat Release Rate IDT=Ignition Delay Time
NL=Natural Luminosity
NOx=Nitrogen Oxides PM=particulate matter
RME= Rapeseed oil Methyl Esters
SINL=Spatially Integrated Natural Luminosity TDC=Top Dead Center
Acknowledgments
The financial support from Aalto University, School of Engineering (Department of Mechanical
Engineering) and Finnish Academy project (Grant No. 297248) are acknowledged.
References
[1] Muth J, Smith E. 45% by 2030 towards a truly sustainable energy system in EU. European
Renewable Energy Council Report. May 2011.
[2] Michal Vojtisek-Lom, Vít Beránek, Pavel Mikuška, et al. Blends of butanol and hydrotreated
vegetable oils as drop-in replacement for diesel engines: Effects on combustion and emissions. Fuel
197 (2017): 407–421
[3] Kuronen M, Mikkonen S. Hydrotreated vegetable oil as fuel for heavy duty diesel engines. SAE
2007-01-4031.
[4] Duckhan Kim, Seonghwan Kim, Sehun Oh, et al. Engine performance and emission characteristics
of hydrotreated vegetable oil in light duty diesel engines. Fuel 125 (2014): 36–43.
[5] Lehto K, Elonheimo A, Hakkinen K, Sarjovaara T, Larmi M. Emission reduction using hydrotreated
vegetable oil (HVO) with miller timing and EGR in diesel combustion. SAE 2011-01-1955.
[6] Soo-Young No. Application of hydrotreated vegetable oil from triglyceride based biomass to CI
engines – A review. Fuel 115 (2014): 88–96.
[7] Barbara Menkiel, Arjan Donkerbroek, Renate Uitz, et al. Blends of butanol and hydrotreated
vegetable oils as drop-in replacement for diesel engines: Effects on combustion and emissions. Fuel
197 (2017): 407–421
[8] Barbara Menkiel, Arjan Donkerbroek, Renate Uitz, et al. Combustion and soot processes of diesel
and rapeseed methyl ester in an optical diesel engine. Fuel 118 (2014): 406–415.
[9]Klein-Douwel RJH, Donkerbroek AJ, van Vliet AP, Boot MD, Somers LMT, Baert RSG, et al. Soot
and chemiluminescence in diesel combustion of bio-derived, oxygenated and reference fuels. Proc
Combust Inst 32(2009): 2817–2825.
[10] Musculus MP, Dec JE, Tree DR. Effects of fuel parameters and diffusion flame lift-off on soot
formation in a heavy-duty DI diesel engine. SAE 2002-01-0889.
[11] Mueller CJ, Martin GC, Effects of oxygenated compounds on combustion and soot evolution in a
DI diesel engine: broadband natural luminosity imaging. SAE 2002-01-1631.
[12] Labecki L, Winklmayer W, Uitz R, Cracknell R, Ganippa LC. Effects of injection parameters and
EGR on the soot particles size distribution for diesel and RME fuels. Fuel 112(2013): 224–35.
[13] Ahmed Hassaneen, Axel Munack, YvonneRuschel, et al. Fuel economy and emission
characteristics of Gas-to-Liquid (GTL) and Rapeseed Methyl Ester (RME) as alternative fuels for diesel
engines. Fuel 97(2012):125–130.
[14] S. Imran, D.R. Emberson, D.S. Wen, et al. Performance and specific emissions contours of a diesel
and RME fueled compression-ignition engine throughout its operating speed and power range[J].
Applied Energy 111 (2013):771–777
[15] Robin Nyström, Ioannis Sadiktsis, Trifa M. Ahmed, et al. Physical and chemical properties of
RME biodiesel exhaust particles without engine modifications. Fuel 186 (2016): 261–269
[16] Ezio Mancaruso, Luigi Sequino, Bianca Maria Vaglieco. GTL (Gas To Liquid) and RME
(Rapeseed Methyl Ester) combustion analysis in a transparent CI (compression ignition) engine by
means of IR (infrared) digital imaging. Energy 58 (2013): 185-191
[17] Ezio Mancaruso, Bianca Maria Vaglieco. Premixed combustion of GTL and RME fuels in a single
cylinder research engine. Applied Energy 91 (2012): 385–394
[18] Haiwen Song, Zhijun Peng, Kelly Sison Quinton, et al. An Experimental Study on Effects of Fuel
Oxygenates on Diesel Engine Combustion. Energy Procedia 66 ( 2015 ): 17 – 20
[19] Barbara Menkiel, Arjan Donkerbroek, Renate Uitz, et al. Combustion and soot processes of diesel
and rapeseed methyl ester in an optical diesel engine. Fuel 118 (2014): 406–415
[20] Luigi Allocca, Ezio Mancaruso, Alessandro Montanaro, et al. Evaluation of RME (rapeseed methyl
ester) and mineral diesel fuels behaviour in quiescent vessel and EURO 5 engine. Energy 77 (2014):
783-790
[21] J.I. Sato, K. Konishi, H. Okada, T. Niioka, in: Symposium (International) of Combustion, vol. 21,
1988, pp. 695–702
[22] Westbrook CK. Chemical kinetics of hydrocarbon ignition in practical combustion systems. In:
Proc of the combust inst, vol. 28(2000):1563–1577.
[23] Dec JE, Coy EB. OH radical imaging in a DI diesel engine and the structure of the early diffusion
flame. SAE 960831.
[24] Dumitrescu CE, Cheng A, Kurtz E, Mueller CJ. A Comparison of Methyl Decanoate and
Tripropylene Glycol Monomethyl Ether for Soot-Free Combustion in an Optical Direct-Injection Diesel
Engine. ASME. Internal Combustion Engine Division Fall Technical Conference, ASME
2016:V001T02A008.
[25] M. Cardenas, P. Hottenbach, R. Kneer, G. Grünefeld, SAE Int. J. Eng. 2 (2) (2010): 272–286.
[26] J. Kojima, Y. Ikeda, T. Nakajima. Spatially resolved measurement of OH*, CH*, and C2*
chemiluminescence in the reaction zone of laminar methane/air premixed flames. Proc. Combust. Inst.
28 (2000): 1757–1767.
[27] E. Mancaruso, B.M. Vaglieco. Premixed combustion of GTL and RME fuels in a single cylinder
research engine. Applied Energy, 91(2012): 385-394
[28] Markus Jakob, Thomas Hülser, Andreas Janssen, et al. Simultaneous high-speed visualization of
soot luminosity and OH* chemiluminescence of alternative-fuel combustion in a HSDI diesel engine
under realistic operating conditions. Combustion and Flame 159 (2012): 2516–2529.
[29] Venkata Nori and Jerry Seitzman. Evaluation of Chemiluminescence as a Combustion Diagnostic
under Varying Operating Conditions. 46th AIAA Aerospace Sciences Meeting and Exhibit 7-10
January 2008, Reno, Nevada
[30] T. Hoffmann, P. Hottenbach, H.-J. Koss, C. Pauls, G. Grünefeld, Investigation of mixture
formation in diesel sprays under quiescent conditions using raman, mie and lif diagnostics, SAE 2008-
01-0945.
[31] Heywood JB. Internal combustion engine fundamentals. NewYork: Mc Graw-Hill; 1988.
[32] Bittle JA, Jacobs TJ. On the Relationship Between Fuel Injection Pressure and Two-Stage Ignition
Behavior of Low Temperature Diesel Combustion. ASME. J. Energy Resour. Technol.
2012;134(4):042201-042201-6.
[33] Kihyun Kim, Donghoon Kim, Yongjin Jung, et al. Spray and combustion characteristics of gasoline
and diesel in a direct injection compression ignition engine [J]. Fuel 109(2013): 616-626.
[34] Bizon K, Continillo G, Lombardi S, Sementa P, Vaglieco BM. Independent component analysis
of cycle resolved combustion images from a spark ignition optical engine. Combustion and Flame
2016(163):258–69.
[35] K. Bizon , S. Lombardi , G. Continillo , E. Mancaruso , B.M. Vaglieco , Analysis of Diesel engine
combustion using imaging and independent component analysis, Proc. Combust. Inst. 2013 (34) 2921–
2931.
[36] K. Bizon, G. Continillo, E. Mancaruso, et al. POD-based analysis of combustion images in
optically accessible engines. Combustion and Flame 2010 (157): 632–640
[37]Samet Gürgen, Bedir Ünver, İsmail Altın. Prediction of cyclic variability in a diesel engine fueled
with n-butanol and diesel fuel blends using artificial neural network. Renewable Energy 117(2018):
538-544.
[38] Jamil Ghojel, Damon Honnery. Heat release model for the combustion of diesel oil emulsions in
DI diesel engines. Applied Thermal Engineering 25 (2005): 2072–2085.
[39] Hulkkonen T, Hillamo H, Sarjovaara T, Larmi M. Experimental study of spray characteristics
between hydrotreated vegetable oil (HVO) and crude oil based EN 590 diesel fuel. SAE 2011-24-0042.
[40] F. Payri, R. Payri, M. Bardi,M. Carreres. Engine combustion network: Influence of the gas
properties on the spray penetration and spreading angle [J]. Experimental Thermal and Fluid Science
53(2014):236-243.
[41] J.M. Desantes, J.V. Pastor, J.M. García-Oliver, J.M. Pastor. A 1D model for the description of
mixing-controlled reacting diesel sprays [J]. Combustion and Flame 156 (2009): 234–249
[42] Mueller CJ. Effects of oxygenated compounds on combustion and soot evolution in a di diesel
engine broadband natural luminosity imaging. SAE 2002-01-1631.