carbon sequestration in the trees, products and soils of forest plantations: an analysis using uk...
TRANSCRIPT
Tree Physiology 11,49-7 1 0 1992 Heron Publishing-Victoria, Canada
Carbon sequestration in the trees, products and soils of forest plantations: an analysis using UK examples
RODERICK C. DEWAR and MELVIN G. R. CANNELL Institute of Terrestrial Ecology, Bush Estate, Penicuik, Midlothian EH26 OQB, Scotland, UK
Received December 12, 1991
Summary
A carbon-flow model for managed forest plantations was used to estimate carbon storage in UK plantations differing in Yield Class (growth rate), thinning regime and species characteristics. Tiie- averaged, total carbon storage (at equilibrium) was generally in the range 40-80 Mg C ha-’ in trees, 15-25 Mg C ha-’ in above- and belowground litter, 70-90 Mg C ha-’ in soil organic matter and 20-40 Mg C ha-’ in wood products (assuming product lifetime equalled rotation length). The rate of carbon storage during the first rotation in most plantations was in the range 2-5 Mg C ha-’ year-‘.
A sensitivity analysis revealed the following processes to be both uncertain and critical: the fraction of total woody biomass in branches and roots; litter and soil organic matter decomposition rates; and rates of fine root turnover. Other variables, including the time to canopy closure and the possibility of accelerated decomposition after harvest, were less critical. The lifetime of wood products was not critical to total carbon storage because wood products formed only a modest fraction of the total.
The average increase in total carbon storage in the tree-soil-product system per unit increase in Yield Class (m3 ha-’ year-‘) for unthinned Picea sitchensis (Bong.) Carr. plantations was 5.6 Mg C ha-‘. Increasing the Yield Class from 6 to 24 m3 ha-’ year -’ increased the rate of carbon storage in the first rotation from 2.5 to 5.6 Mg C ha-’ year-’ m unthinned plantations. Thinning reduced total carbon storage in P. sitchensis plantations by about 15%, and is likely to reduce carbon storage in all plantation types.
If the objective is to store carbon rapidly in the short term and achieve high carbon storage in the long term, Populus plantations growing on fertile land (2.7 m spacing, 26-year rotations, Yield Class 12) were the best option examined. If the objective is to achieve high carbon storage in the medium term (50 years) without regard to the initial rate of storage, then plantations of conifers of any species with above-average Yield Classes would suffice. In the long term (100 years), broadleaved plantations of oak and beech store as much carbon as conifer plantations. Mini-rotations (10 years) do not achieve a high carbon storage.
Introduction
Concern about an enhanced greenhouse effect has prompted several attempts to calculate the net release of CO2 to the atmosphere resulting from deforestation (Houghton et al. 1983, 1987, 1991, Emanuel et al. 1984, Harmon et al. 1990, Houghton 1991). Similar efforts have been made to calculate the amount of CO2 that can be sequestered by planting trees (Cooper 1983, Cropper and Ewe1 1983, 1984, Thompson and Matthews 1989, Schroeder and Ladd 1991, Birdsey (in preparation) 1991). Workers have variously concentrated on the amount of carbon stored in the living trees (Cooper 1983, Johnson and Sharpe 1983, Schroeder and Ladd 199 1, Matthews et al. 1991), the wood products (Row and Phelps 1990), the tree-soil ecosystem (Cropper and Ewe1 1983,1984), or the trees and wood products (Thomp-
at Aston U
niversity on August 24, 2014
http://treephys.oxfordjournals.org/D
ownloaded from
50 DEWAR AND CANNELL
son and Matthews 1989). Few studies have encompassed the entire tree-soil-prod- ucts system, and few have tracked the flow of carbon from the trees to soils and products in a dynamic fashion, as outlined in a model proposed by Dewar (1991).
In this paper, the Dewar (1991) model (with some modifications) is used to explore the options for storing carbon by establishing new plantations with different growth rates and of different kinds. The analysis is restricted to the range of plantation types that are grown in the UK, but the main findings apply more widely. The study was, in part, a sensitivity analysis of the variables in the carbon flow model and, in part, a comparison of plantation types using best-guess parameter values.
The model
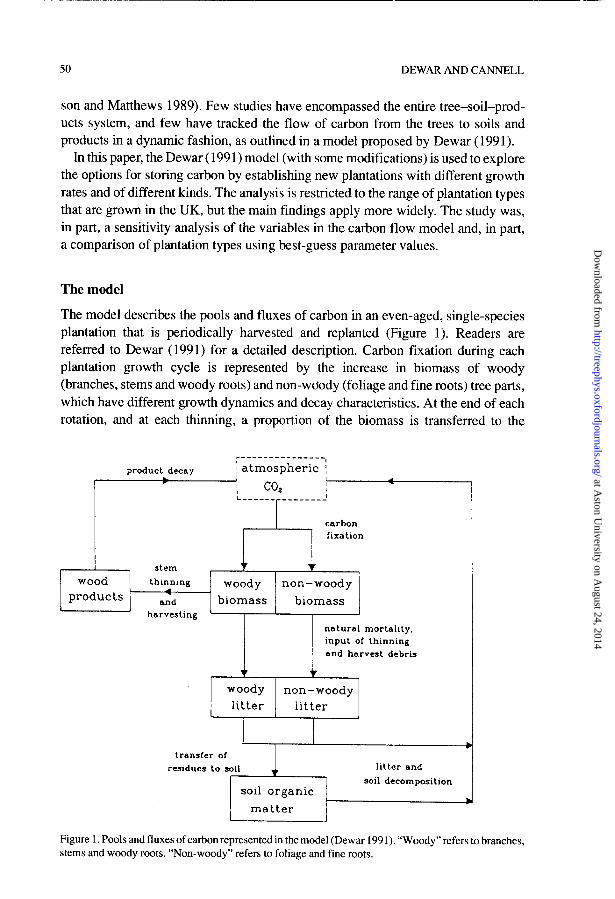
The model describes the pools and fluxes of carbon in an even-aged, single-species plantation that is periodically harvested and replanted (Figure 1). Readers are referred to Dewar (1991) for a detailed description. Carbon fixation during each plantation growth cycle is represented by the increase in biomass of woody (branches, stems and woody roots) and non-woody (foliage and fine roots) tree parts, which have different growth dynamics and decay characteristics. At the end of each rotation, and at each thinning, a proportion of the biomass is transferred to the
product decay
c___-_--______-_, i atmospheric ;
wood thrnnrng woody non-woody products and biomass biomass I
harvesting ’ I I natural mortality. input of thinning and harvest debris
woody non-woody litter litter
transfer of
residues to soil
soil organic matter
J
litter and
soil decomposition
J
Figure 1. Pools and fluxes of carbon represented in the model (Dewar 1991). “Woody” refers to branches, stems and woody roots. “Non-woody” refers to foliage and fine roots.
at Aston U
niversity on August 24, 2014
http://treephys.oxfordjournals.org/D
ownloaded from
CARBON SEQUESTRATION BY FOREST PLANTATIONS 51
product pool, and eventually decays to COz. Throughout each rotation, the forest floor continuously receives carbon in the form of dead woody and non-woody litter. Further litter inputs occur at each thinning and harvest. A proportion of this litter decomposes to CO2 and the remainder is transferred to the soil organic matter pool, where it also decomposes to CO2.
The model does not include ground vegetation, and assumes that the pattern of tree growth is the same in successive rotations with no major catastrophes such as windthrow or pest outbreaks. Also, it is assumed that negligible amounts of carbon are permanently lost to the system in groundwater or to recalcitrant soil organic matter.
Species and Yield Classes compared
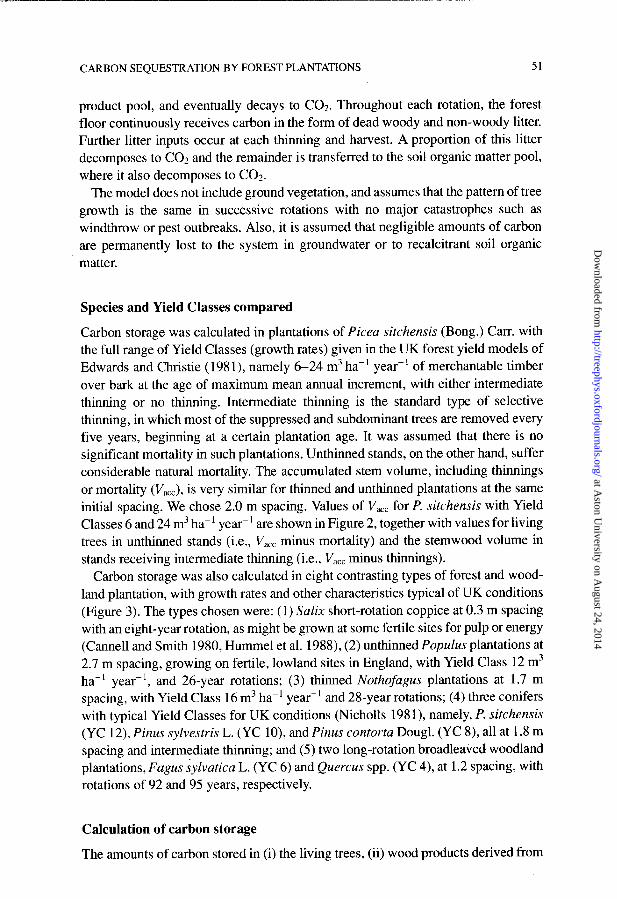
Carbon storage was calculated in plantations of Picea sitchensis (Bong.) Carr. with the full range of Yield Classes (growth rates) given in the UK forest yield models of Edwards and Christie (1981), namely 6-24 m3 ha-’ year-’ of merchantable timber over bark at the age of maximum mean annual increment, with either intermediate thinning or no thinning. Intermediate thinning is the standard type of selective thinning, in which most of the suppressed and subdominant trees are removed every five years, beginning at a certain plantation age. It was assumed that there is no significant mortality in such plantations. Unthinned stands, on the other hand, suffer considerable natural mortality. The accumulated stem volume, including thinnings or mortality (V&, is very similar for thinned and unthinned plantations at the same initial spacing. We chose 2.0 m spacing. Values of V,, for P sitchensis with Yield Classes 6 and 24 m3 ha-’ year-’ are shown in Figure 2, together with values for living trees in unthinned stands (i.e., V,,, minus mortality) and the stemwood volume in stands receiving intermediate thinning (i.e., V,,, minus thinnings).
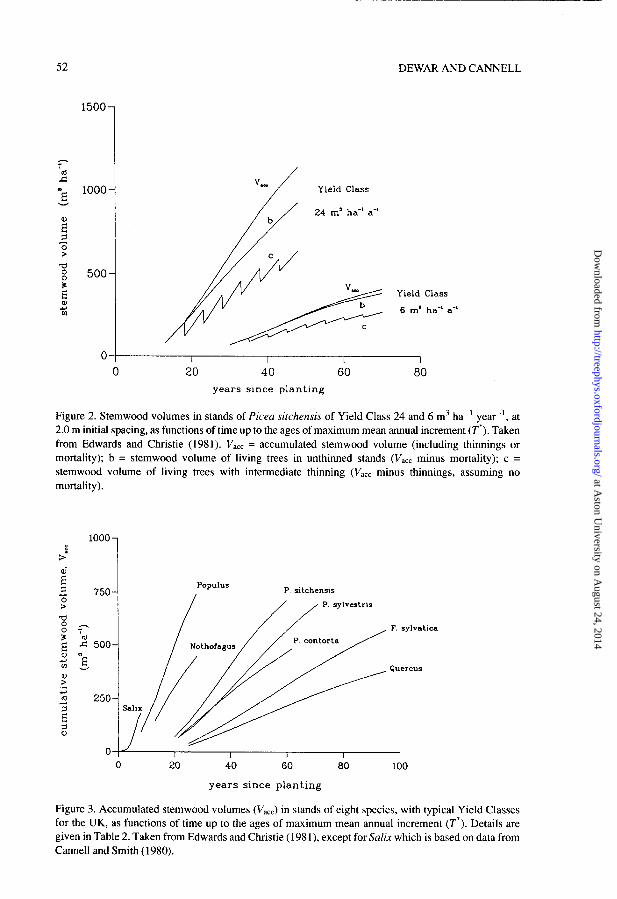
Carbon storage was also calculated in eight contrasting types of forest and wood- land plantation, with growth rates and other characteristics typical of UK conditions (Figure 3). The types chosen were: (1) Salix short-rotation coppice at 0.3 m spacing with an eight-year rotation, as might be grown at some fertile sites for pulp or energy (Cannel1 and Smith 1980, Hummel et al. 1988), (2) unthinned Popufus plantations at 2.7 m spacing, growing on fertile, lowland sites in England, with Yield Class 12 m3 ha-’ year-‘, and 26-year rotations; (3) thinned Nothofagus plantations at 1.7 m spacing, with Yield Class 16 m3 ha-’ year-’ and 28-year rotations; (4) three conifers with typical Yield Classes for UK conditions (Nicholls 198 l), namely, P. sitchensis (YC 12), Pinus sylvestris L. (YC lo), and Pinus contortu Dougl. (YC S), all at 1.8 m spacing and intermediate thinning; and (5) two long-rotation broadleaved woodland plantations, Fagus iyfvuticu L. (YC 6) and Quercus spp. (YC 4), at 1.2 spacing, with rotations of 92 and 95 years, respectively.
Calculation of carbon storage
The amounts of carbon stored in (i) the living trees, (ii) wood products derived from
at Aston U
niversity on August 24, 2014
http://treephys.oxfordjournals.org/D
ownloaded from
O-- 0
I I I I
20 40 60 80 years ~lnce planting
Figure 2. Stemwood volumes in stands of Picea sitchensis of Yield Class 24 and 6 m3 ha-’ year-‘, at 2.0 m initial spacing, as functions of time up to the ages of maximum mean annual increment (T*). Taken from Edwards and Christie (1981). V act = accumulated stemwood volume (including thinnings or mortality); b = stemwood volume of living trees in unthinned stands (V,,, minus mortality); c = stemwood volume of living trees with intermediate thinning (V act minus thinnings, assuming no mortality).
DEWAR AND CANNELL
Yield Class
24 m’ ha-’ a-’
lOOO-
Populus
/
P sitchensm
/ , P. sylvestris
/ I I I I I
20 40 60 60 100
years since planting
Figure 3. Accumulated stemwood volumes (V,,,) in stands of eight species, with typical Yield Classes for the UK, as functions of time up to the ages of maximum mean annual increment (T*). Details are given in Table 2. Taken from Edwards and Christie (198 l), except for Salix which is based on data from Cannel1 and Smith (1980).
at Aston U
niversity on August 24, 2014
http://treephys.oxfordjournals.org/D
ownloaded from
CARBON SEQUESTRATION BY FOREST PLANTATIONS 53
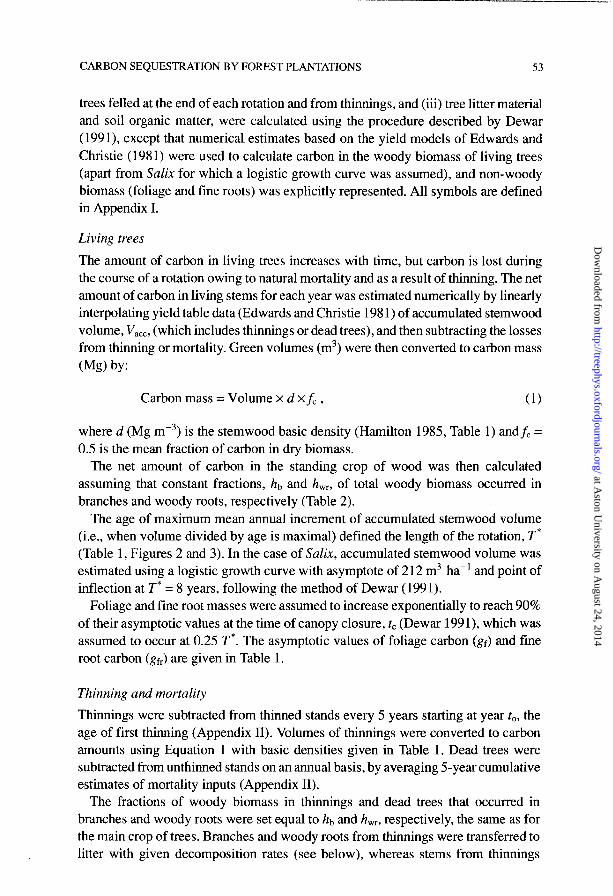
trees felled at the end of each rotation and from thinnings, and (iii) tree litter material and soil organic matter, were calculated using the procedure described by Dewar (1991), except that numerical estimates based on the yield models of Edwards and Christie (1981) were used to calculate carbon in the woody biomass of living trees (apart from Salix for which a logistic growth curve was assumed), and non-woody biomass (foliage and line roots) was explicitly represented. All symbols are defined in Appendix I.
Living trees
The amount of carbon in living trees increases with time, but carbon is lost during the course of a rotation owing to natural mortality and as a result of thinning. The net amount of carbon in living stems for each year was estimated numerically by linearly interpolating yield table data (Edwards and Christie 198 1) of accumulated stemwood volume, Vacc, (which includes thinmngs or dead trees), and then subtracting the losses from thinning or mortality. Green volumes (m3) were then converted to carbon mass (Mg) by:
Carbon mass = Volume x d xfc , (1)
where d (Mg rne3) is the stemwood basic density (Hamilton 1985, Table 1) andf, = 0.5 is the mean fraction of carbon in dry biomass.
The net amount of carbon in the standing crop of wood was then calculated assuming that constant fractions, hb and h,,, of total woody biomass occurred in branches and woody roots, respectively (Table 2).
The age of maximum mean annual increment of accumulated stemwood volume (i.e., when volume divided by age is maximal) defined the length of the rotation, T* (Table 1, Figures 2 and 3). In the case of Salix, accumulated stemwood volume was estimated using a logistic growth curve with asymptote of 212 m3 ha-’ and point of inflection at T” = 8 years, following the method of Dewar (199 1).
Foliage and fine root masses were assumed to increase exponentially to reach 90% of their asymptotic values at the time of canopy closure, tc (Dewar 1991), which was assumed to occur at 0.25 T*. The asymptotic values of foliage carbon (gr) and tine root carbon (gr,) are given in Table 1.
Thinning and mortality
Thinnings were subtracted from thinned stands every 5 years starting at year to, the age of first thinning (Appendix II). Volumes of thinnings were converted to carbon amounts using Equation 1 with basic densities given in Table 1. Dead trees were subtracted from unthinned stands on an annual basis, by averaging 5-year cumulative estimates of mortality inputs (Appendix II).
The fractions of woody biomass in thinnings and dead trees that occurred in branches and woody roots were set equal to hb and h,,, respectively, the same as for the main crop of trees. Branches and woody roots from thinnings were transferred to litter with given decomposition rates (see below), whereas stems from thinnings
at Aston U
niversity on August 24, 2014
http://treephys.oxfordjournals.org/D
ownloaded from
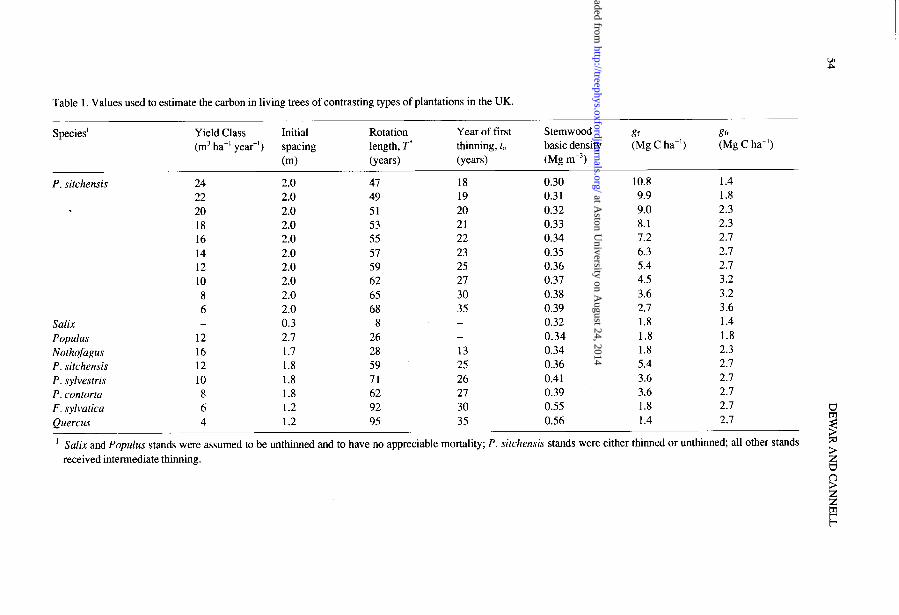
Table 1. Values used to estimate the carbon in living trees of contrasting types of plantations in the UK.
Species’ Yield Class Initial Rotation Year of first Stemwood t3 531 (m3 ha-’ yea?) spacing length, T’ thinning, t, basic density (Mg C ha-‘) (Mg C ha-‘)
(ml (ye@ (ye4 0% me31 P. sitchensis 24 2.0 47 18 0.30 10.8 1.4
22 2.0 49 19 0.31 9.9 1.8 20 2.0 51 20 0.32 9.0 2.3 18 2.0 53 21 0.33 8.1 2.3 16 2.0 55 22 0.34 7.2 2.1 14 2.0 57 23 0.35 6.3 2.1 12 2.0 59 25 0.36 5.4 2.1 10 2.0 62 21 0.31 4.5 3.2
8 2.0 65 30 0.38 3.6 3.2 6 2.0 68 35 0.39 2.1 3.6
Salix - 0.3 8 - 0.32 1.8 1.4 Populus 12 2.1 26 - 0.34 1.8 1.8 Nothofagus 16 1.1 28 13 0.34 1.8 2.3 P. sitchensis 12 1.8 59 25 0.36 5.4 2.1 P. sylvestris 10 1.8 11 26 0.41 3.6 2.7 P. contorta 8 1.8 62 21 0.39 3.6 2.1
F. sylvatica 6 1.2 92 30 0.55 1.8 2.7 Quercus 4 1.2 95 35 0.56 1.4 2.1 Ez
s ’ Mix and Populus stands were assumed to be unthinned and to have no appreciable mortality; P. sitchensis stands were either thinned or unthinned; all other stands z
received intermediate thinning. 3 0
at Aston U
niversity on August 24, 2014
http://treephys.oxfordjournals.org/D
ownloaded from
CARBON SEQUESTRATION BY FOREST PLANTATIONS 55
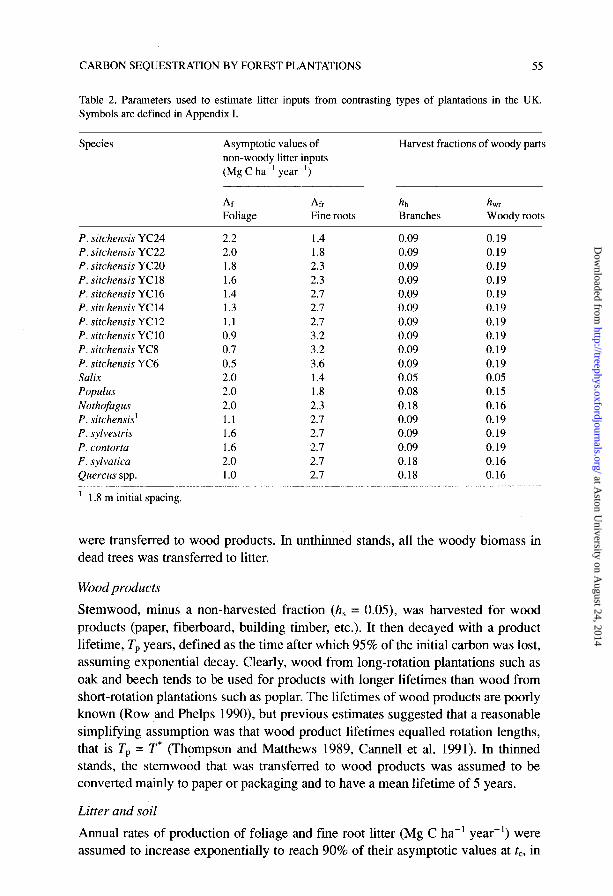
Table 2. Parameters used to estimate litter inputs from contrasting types of plantations in the UK. Symbols are defined in Appendix I.
Species Asymptotic values of non-woody litter inputs (Mg C ha-’ year-‘)
Harvest fractions of woody parts
Ar Afr Foliage Fine roots
hb Branches
h $iody roots
P. sitchensis YC24 2.2 1.4 0.09 0.19 P. sitchensis YC22 2.0 1.8 0.09 0.19 P. sitchensis YC20 1.8 2.3 0.09 0.19 P. sitchensis YC18 1.6 2.3 0.09 0.19 P. sitchensis YC16 1.4 2.7 0.09 0.19 P. sitchensis YC14 1.3 2.7 0.09 0.19 P. sitchensis YC12 1.1 2.7 0.09 0.19 P. sitchensis YClO 0.9 3.2 0.09 0.19 P. sitchensis YC8 0.7 3.2 0.09 0.19 P. sitchensis YC6 0.5 3.6 0.09 0.19 Salix 2.0 1.4 0.05 0.05 Populus 2.0 1.8 0.08 0.15 Nothofagus 2.0 2.3 0.18 0.16 P. sitchensis’ 1.1 2.7 0.09 0.19 P. sylvestris 1.6 2.7 0.09 0.19 P. contorta 1.6 2.7 0.09 0.19 F. sylvatica 2.0 2.7 0.18 0.16 Quercus spp. 1.0 2.7 0.18 0.16
’ 1.8 m initial spacing.
were transferred to wood products. In unthinned stands, all the woody biomass in dead trees was transferred to litter.
Wood products
Stemwood, minus a non-harvested fraction (h, = 0.05), was harvested for wood products (paper, fiberboard, building timber, etc.). It then decayed with a product lifetime, Tp years, defined as the time after which 95% of the initial carbon was lost, assuming exponential decay. Clearly, wood from long-rotation plantations such as oak and beech tends to be used for products with longer lifetimes than wood from short-rotation plantations such as poplar. The lifetimes of wood products are poorly known (Row and Phelps 1990), but previous estimates suggested that a reasonable simplifying assumption was that wood product lifetimes equalled rotation lengths, that is Tp = T* (Thompson and Matthews 1989, Cannel1 et al. 1991). In thinned stands, the stemwood that was transferred to wood products was assumed to be converted mainly to paper or packaging and to have a mean lifetime of 5 years.
Litter and soil
Annual rates of production of foliage and fine root litter (Mg C ha-’ year-‘) were assumed to increase exponentially to reach 90% of their asymptotic values at to in
at Aston U
niversity on August 24, 2014
http://treephys.oxfordjournals.org/D
ownloaded from
56 DEWAR AND CANNELL
the same manner as living foliage and fine root biomass (Dewar 1991). For deciduous tree species, the asymptotic values for annual foliage litterfall, An were numerically equal to gr. For spruce, Ar was assumed to be 0.2 gr, and for pine 0.4 gr (Table 2). The asymptotic values for fine roots, hk, were assumed to be equal to gr,; that is, all fine roots were replaced once each year.
It was assumed that 0.5% of the standing biomass of branches (after thinning and stem mortality) and 0.25% of woody roots were shed as woody litter each year, but that there was no stemwood litter in thinned stands. Branch and woody root litter input from thinnings occurred every 5 years beginning at time to (Table l), whereas litter input from dead trees occurred every year, as described above.
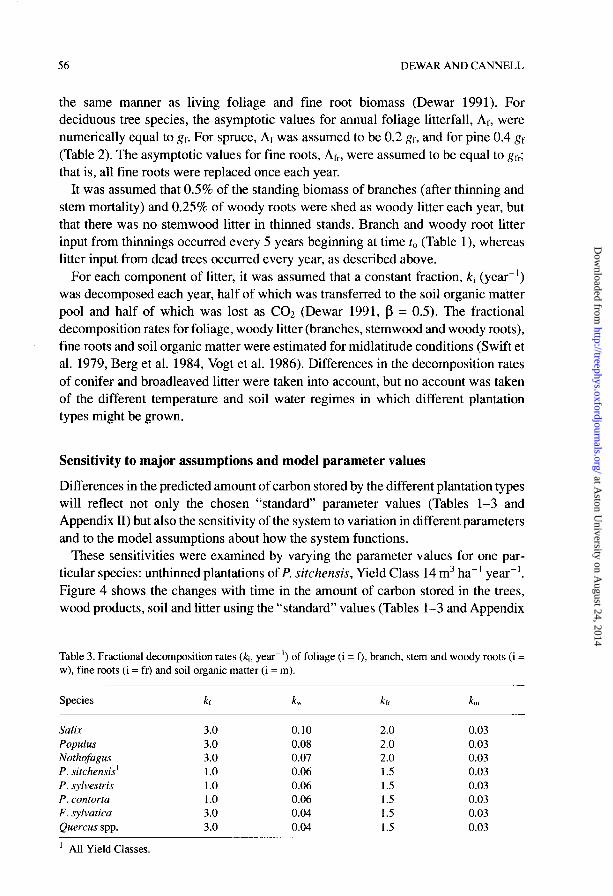
For each component of litter, it was assumed that a constant fraction, ki (year’) was decomposed each year, half of which was transferred to the soil organic matter pool and half of which was lost as CO2 (Dewar 1991, p = 0.5). The fractional decomposition rates for foliage, woody litter (branches, stemwood and woody roots), fine roots and soil organic matter were estimated for midlatitude conditions (Swift et al. 1979, Berg et al. 1984, Vogt et al. 1986). Differences in the decomposition rates of conifer and broadleaved litter were taken into account, but no account was taken of the different temperature and soil water regimes in which different plantation types might be grown.
Sensitivity to major assumptions and model parameter values
Differences in the predicted amount of carbon stored by the different plantation types will reflect not only the chosen “standard’ parameter values (Tables l-3 and Appendix II) but also the sensitivity of the system to variation in different parameters and to the model assumptions about how the system functions.
These sensitivities were examined by varying the parameter values for one par- ticular species: unthinned plantations of P. sitchensis, Yield Class 14 m3 ha-’ year-‘. Figure 4 shows the changes with time in the amount of carbon stored in the trees, wood products, soil and litter using the “standard” values (Tables l-3 and Appendix
Table 3. Fractional decomposition rates (ki, year-‘) of foliage (i = f), branch, stem and woody roots (i = w), fine roots (i = fr) and soil organic matter (i = m).
Species kt kw km
Salix 3.0 0.10 2.0 0.03 Populus 3.0 0.08 2.0 0.03 Nothofagus 3.0 0.07 2.0 0.03 P. sitchensis’ 1.0 0.06 1.5 0.03 P. sylvestris 1.0 0.06 1.5 0.03 P. contorta 1.0 0.06 1.5 0.03 F. sylvatica 3.0 0.04 1.5 0.03 Quercus spp. 3.0 0.04 1.5 0.03
’ All Yield Classes.
at Aston U
niversity on August 24, 2014
http://treephys.oxfordjournals.org/D
ownloaded from
CARBON SEQUESTRATION BY FOREST PLANTATIONS 51
trees
products
litter +
soil
TOTAL
0 50 100 150 200 250 300
years since planting
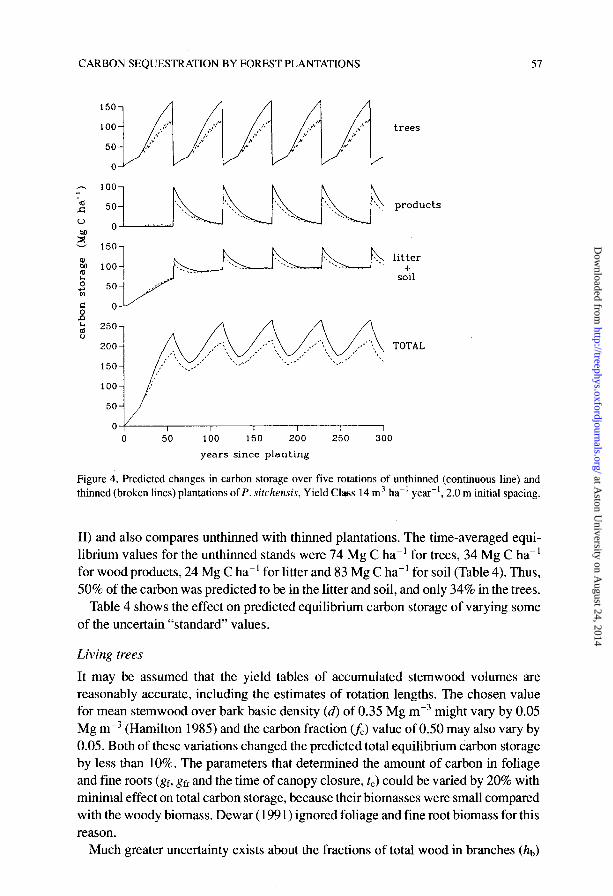
Figure 4. Predicted changes in carbon storage over five rotations of unthinned (continuous line) and thinned (broken lines) plantations of P. sit&ens& Yield Class 14 m3 ha-’ year-‘, 2.0 m initial spacing.
II) and also compares unthinned with thinned plantations. The time-averaged equi- librium values for the unthinned stands were 74 Mg C ha-’ for trees, 34 Mg C ha-’ for wood products, 24 Mg C ha-’ for litter and 83 Mg C ha-’ for soil (Table 4). Thus, 50% of the carbon was predicted to be in the litter and soil, and only 34% in the trees.
Table 4 shows the effect on predicted equilibrium carbon storage of varying some of the uncertain “standard’ values.
Living trees
It may be assumed that the yield tables of accumulated stemwood volumes are reasonably accurate, including the estimates of rotation lengths. The chosen value for mean stemwood over bark basic density (d> of 0.35 Mg mm3 might vary by 0.05 Mg mm3 (Hamilton 1985) and the carbon fraction (fc) value of 0.50 may also vary by 0.05. Both of these variations changed the predicted total equilibrium carbon storage by less than 10%. The parameters that determined the amount of carbon in foliage and fine roots (gr, gk and the time of canopy closure, tc) could be varied by 20% with minimal effect on total carbon storage, because their biomasses were small compared with the woody biomass. Dewar (1991) ignored foliage and fine root biomass for this reason.
Much greater uncertainty exists about the fractions of total wood in branches (ht,)
at Aston U
niversity on August 24, 2014
http://treephys.oxfordjournals.org/D
ownloaded from
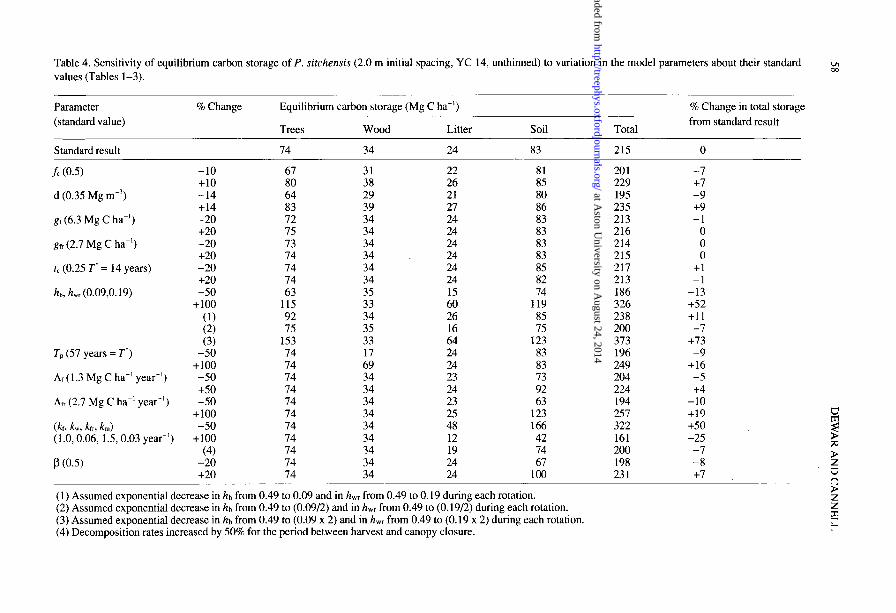
Table 4. Sensitivity of equilibrium carbon storage of P. sirchensis (2.0 m initial spacing, YC 14, unthinned) to variation in the model parameters about their standard values (Tables l-3).
Parameter (standard value)
% Change Equilibrium carbon storage (Mg C ha-‘)
Trees Wood Litter Soil Total
% Change in total storage from standard result
Standard result 14 34 24 83 21.5 0
fc (0.5)
d (0.35 Mg mm’)
gf (6.3 Mg C ha-‘)
g,t (2.7 Mg C ha-‘)
2, (0.25 T’ = 14 years)
hb, h,, (0.09,O. 19)
Tp (57 years = T’)
At (1.3 Mg C ha-’ year-‘)
& (2.7 Mg C ha-’ year-‘)
(kf, kw, kr,, km) (1.0,0.06, 1.5,0.03 year-‘)
P (0.5)
-10 67 31 +lO 80 38 -14 64 29 +14 83 39 -20 72 34 +20 75 34 -20 73 34 +20 74 34 -20 74 34 +20 74 34 -50 63 35
+I00 115 33 (1) 92 34 (2) 75 35 (3) 153 33
-50 74 17 +lOO 74 69 -50 74 34 +50 14 34 -50 74 34
+lOO 74 34 -50 74 34
+lOO 14 34 (4) 14 34
-20 74 34 +20 74 34
22 26 21 27 24 24 24 24 24 24 15 60 26 16 64 24 24 23 24 23 25 48 12 19 24 24
81 201 85 229 80 195 86 235 83 213 83 216 83 214 83 215 85 217 82 213 74 186
119 326 85 238 75 200
123 373 83 196 83 249 73 204 92 224 63 194
123 257 166 322 42 161 74 200 67 198
100 231
(1) Assumed exponential decrease in hb from 0.49 to 0.09 and in hwr from 0.49 to 0.19 during each rotation. (2) Assumed exponential decrease in hb from 0.49 to (0.09/2) and in hwr from 0.49 to (0.19/2) during each rotation. (3) Assumed exponential decrease in hb from 0.49 to (0.09 x 2) and in h,, from 0.49 to (0.19 x 2) during each rotation. (4) Decomposition rates increased by 50% for the period between harvest and canopy closure.
-7 +7 -9 +9 -1
0 0 0
+l -1
-13 +52 +11 -7
+73 -9
+16 -5 +4
-10 +19 +50 w -25 5
-7 -8
E
+I 3 P 2
F
at Aston U
niversity on August 24, 2014
http://treephys.oxfordjournals.org/D
ownloaded from
CARBON SEQUESTRATION BY FOREST PLANTATIONS 59
and woody roots (h,,) and their change with age. We assumed, for simplicity, that these fractions were constant over the rotation, whereas in reality they are large in young stands and decrease as the stemwood mass increases (Satoo and Madgwick 1982, Cannel1 1982, Matthews et al. 1991). If it were assumed that 0.98 of the woody biomass occurred in branches and woody roots at planting (hb = 0.49, h,, = 0.49) and that this fraction decreased exponentially to the standard values (ht, = 0.09, h,, = 0.19) during each rotation, then total equilibrium carbon storage would be only 11% greater than that estimated in this study (Table 4). Clearly, when the trees are young, ht, and h,, are large fractions of small values.
Uncertainty about the patterns of change in hb and h,, during each rotation is, we suggest, less important than uncertainty about their absolute values, which depend on tree genotype, environment and management (e.g.., Valinger 1990). The values given in Table 2 were based on data for 14 conifer and 12 broadleaved plantations at rotation age from a world database (Cannel1 1982): for conifers, the values of h,, varied from 0.05 to 0.14, and of h,, from 0.06 to 0.28. Other workers have calculated the total/merchantable biomass ratio, where the totalincludes foliage and fine roots. This fraction was about 1.4 using our standard values. Workers in the UK have suggested values of 1.3 for Pinus nigra var. maritima, and 1.5 for P. sitchensis plantations (Miller et al. 1980, Matthews et al. 1991), whereas workers in the USA, concerned with more open-grown stands, have derived a mean value for forests in Virginia of 2.7 (Johnson and Sharpe 1983), and US-wide means of 1.9 for conifers and 2.4 for broadleaves (Birdsey 1991).
The effect on carbon storage of doubling our standard values for hb and h, was very large (+ 73%), simply because the branches and woody roots represent such a large fraction of the carbon in trees and a large input to the litter and soil carbon pools (Table 4).
Wood products
There are few data on which to base or evaluate our assumption that the lifetime of wood products (T,) may be approximately equal to the rotation length. However, halving or doubling the value of TP does not have a marked effect on total carbon storage, because the carbon stored in wood products represents only 16% of the total carbon using our standard values (34/215 Mg C ha-‘, Table 4).
Litter and soil The importance of litter inputs from branches and woody roots has already been stated. The input from foliage is smaller, and can be half or double the standard value of 1.3 Mg C ha-’ year-’ without changing total carbon storage by more than 5%. By contrast, if the annual input of root litter was twice, rather than equal to, the standing biomass of fine roots (i.e., fine root biomass turned over twice rather than once a year) carbon storage in soils would be doubled and total carbon storage would be increased by 19% (Table 4).
Even greater uncertainty concerns the decomposition rates of the litter and soil organic matter, which will depend on the composition of the litter, the physical
at Aston U
niversity on August 24, 2014
http://treephys.oxfordjournals.org/D
ownloaded from
60 DEWAR AND CANNELL
environment and the abundance and activity of soil microbes, fauna and flora. Halving or doubling the standard values approximately doubled or halved the size of the equilibrium soil carbon pool and hence had a major effect on total carbon storage (Table 4).
The model of Dewar (1991) does not include the possibility of accelerated litter and soil organic matter decomposition resulting from disturbance and increased temperature and soil water after each harvest (Moore et al. 1981, Covington 198 1, Houghton et al. 1983). Increasing the rates of decomposition by 50% for the period from harvest to canopy closure in each rotation decreased total storage by only 7%. We would therefore agree with Aber et al. (1978) and Harmon et al. (1990) that any accelerated decomposition after harvest is likely to be less important than the recovery of litter input as the new plantation grows.
Varying the fraction of litter that passes to the soil (p) by + 20% had a relatively minor effect on total carbon storage.
Carbon storage in different types of plantation
Table 5 presents the predicted equilibrium carbon storage in different types of plantations, using the standard parameter values in Tables l-3. Table 5 enables comparisons to be made between thinned and unthinned P. sit&ens& plantations, plantations of P. sitchensis of different Yield Class, and between species with contrasting average growth, product and litterfall characteristics in the UK.
In addition to knowing how much carbon is stored and where (in trees, products, litter and soil), it is important to know how rapidly storage occurs. However, for all plantations, the time taken to reach 95% of total equilibrium carbon storage was over 80 years, because of the limitation imposed by the slow buildup of soil organic matter (e.g., Figure 4). A more useful parameter is the initial rate of increase in total carbon storage, calculated as total carbon storage at the end of the first rotation divided by the rotation length. These values are given in Table 5.
Effects of thinning
Simulated thinned plantations of P. sitchensis (YC 14,2.0 m) stored about 15% less carbon than unthinned plantations (Figure 4). Thinning decreased the average amount of carbon stored in all carbon pools. A 25% decrease in carbon stored by trees resulted in a loss in input to wood products and litter, and this loss was not compensated by contributions to those two pools from thinnings. This compensation would occur only if the decay rates of thinnings and of trees harvested at the end of the rotations from thinned plantations were both adjusted so that they were substan- tially less than the decay rates of dead trees and trees harvested from unthinned stands. Increasing the lifetime of thinnings from 5 years to the lifetime assumed for harvested trees (57 years) increased storage in products to 44 Mg C ha-‘, but the total storage was still only 198 Mg C ha-‘, less than the 215 Mg C ha-’ stored by unthinned stands.
Even if it were reasonable to adjust the product lifetimes so that thinned plantations
at Aston U
niversity on August 24, 2014
http://treephys.oxfordjournals.org/D
ownloaded from
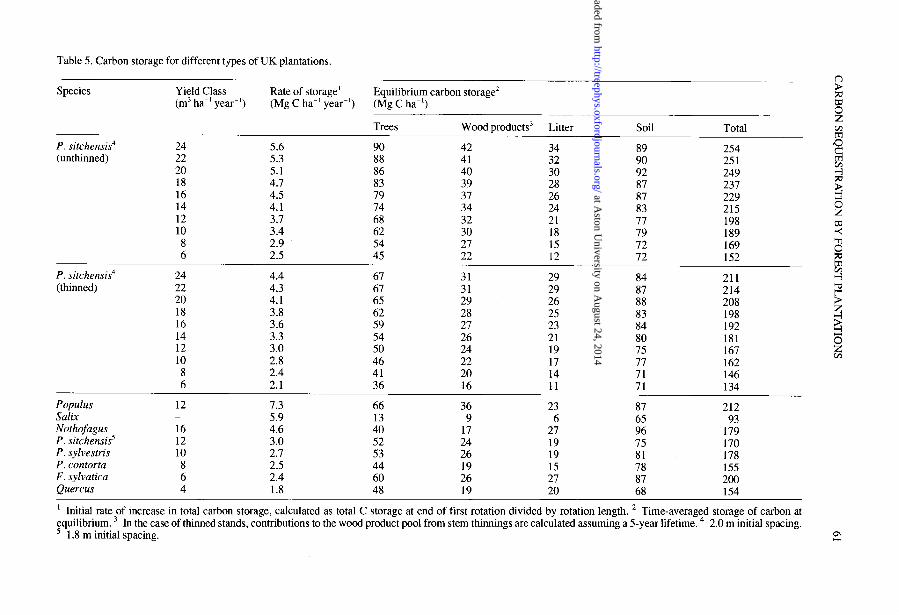
Table 5. Carbon storage for different types of UK plantations.
Trees Wood products3 Litter Soil Total
P. sitchensis4 24 5.6 90 (unthinned) 22 5.3 88
20 5.1 86 18 4.7 83 16 4.5 79 14 4.1 74 12 3.7 68 10 3.4 62 8 2.9 54 6 2.5 45
P. sitchensis4 24 4.4 67 (thinned) 22 4.3 67
20 4.1 65 18 3.8 62 16 3.6 59 14 3.3 54 12 3.0 50 10 2.8 46 8 2.4 41 6 2.1 36
42 34 89 254 41 32 90 251 40 30 92 249 39 28 87 237 37 26 87 229 34 24 83 215 32 21 77 198 30 18 79 189 27 15 72 169 22 12 72 152
31 31 29 28 27 26 24 22 20 16
29 84 211 29 87 214 26 88 208 25 83 198 23 84 192 21 80 181 19 75 167 17 77 162 14 71 146 11 71 134
Species Yield Class (ml ha-’ year-‘)
Rate of storage’ (Mg C ha-’ year-‘)
Equilibrium carbon storage’ (Mg C ha-‘)
Populus 12 7.3 66 36 23 87 212 Salix - 5.9 13 9 6 65 93 Nothofagus 16 4.6 40 17 27 96 P. sitchensis’
179 12 3.0 52 24 19 75 170
P. sylvestris 10 2.7 53 26 19 81 178 P. contorta 8 2.5 44 19 15 78 155 F. sylvatica 6 2.4 60 26 27 87 200 Quercus 4 1.8 48 19 20 68 154
1 Initial rate of increase in total carbon storage, calculated as total C storage at end of first rotation divided by rotation length. * Fquilibrium. 3
Time-averaged storage of carbon at In the case of thinned stands, contributions to the wood product pool from stem thimrings are calculated assuming a 5-year lifetime. 4 2.0 m initial spacing.
1.8 m initial spacing.
at Aston U
niversity on August 24, 2014
http://treephys.oxfordjournals.org/D
ownloaded from

62 DEWAR AND CANNELL
trees
products
litter +
soil
50- ,/
o ,,,’ I I I I I I
0 50 100 150 200 250 300
years since planting
Figure 5. Predicted changes in carbon storage with time of thinned P. sitchensis plantations of Yield Class 24 m3 ha-’ year-’ (continuous line) and 6 m3 ha-’ year-’ (broken line), 2.0 m initial spacing.
had a larger product carbon pool than unthinned plantations, it is difficult to escape the fact that thinned plantations input less woody litter at the end of each rotation than unthinned plantations and so accumulate smaller litter and soil carbon pools (Table 5, Figure 4).
It is concluded that unthinned plantations will normally store more carbon than thinned plantations. They also accumulate carbon faster than thinned plantations over the first rotation (ca. 20% faster in Table 5).
Effects of Yield Class An increase in Yield Class means an increase in the rate of carbon accumulation in the trees (despite a decrease in stemwood basic density), a shorter rotation, and larger and more frequent transfers of carbon to the product and litter pools. Consequently, whatever the species, an increase in Yield Class increases carbon storage in all carbon pools.
For P. sitchensis, an increase in Yield Class from 6 to 24 m3 ha-’ year-’ was predicted to increase total carbon storage by about 60% (Table 5). As Yield Class increased, the trees and wood products contained a larger fraction of the total carbon, and the soils contained a smaller fraction. The average increase in total carbon storage per unit increase in Yield Class (1 m3 ha-’ year-‘) was 4.3 Mg C ha-’ for
at Aston U
niversity on August 24, 2014
http://treephys.oxfordjournals.org/D
ownloaded from

CARBON SEQUESTRATION BY FOREST PLANTATIONS 63
thinned stands and 5.6 Mg C ha-’ for unthinned stands (Table 5). The rate of accumulation of carbon over the first rotation more than doubled with
increase in Yield Class from 6 to 24 m3 ha-’ year-’ (2.5 to 5.6 Mg C ha-’ year-’ in unthinned stands, 2.1 to 4.4 Mg C ha-‘year-’ in thinned stands), corresponding to approximately 0.3 Mg C ha-’ year-’ extra sequestration per unit Yield Class.
Species differences
There was a 2.3-fold variation in the predicted total carbon storage in different plantation types, with parameter values typical for UK conditions (Table 5). The largest storage, 212 Mg C ha-’ (for Populus), did not exceed the predicted total storage in unthinned plantations of P. sitchensis of Yield Class 14 and above.
Species that were assigned the largest Yield Class generally had the fastest initial rate of carbon storage, but not necessarily the greatest total storage at equilibrium. Thus, the time-averaged carbon storage in trees in thinned F. sylvatica plantations at Yield Class 6 was greater than that in thinned P. sitchensis plantations at Yield Class 12 (60 cf. 52 Mg C ha-‘, Table 5), because F. sylvatica plantations exist for long periods with a large biomass. Species differences in rotation lengths (= product lifetimes), litter inputs and decomposition rates can also counteract the expected effects of differences in Yield Class on total carbon storage.
Populus plantations, assumed to grow at fertile sites at Yield Class 12 over 26-year rotations, stored carbon more rapidly over the first rotation than any other plantation type (7.3 Mg C ha-’ year-‘) including unthinned P. sitchensis at Yield Class 24. The time-averaged carbon storage in trees was also large (66 Mg C ha-‘), as is evident in Figure 6, and large quantities of carbon were transferred at the end of each rotation to the product and litter/soil carbon pools.
Densely planted Safix stands, harvested every 8 years, stored carbon rapidly over the first rotation (5.9 Mg C ha-’ year-‘), but the total equilibrium carbon storage was small. Compared with other plantation types, relatively little carbon accumulated in the trees during each rotation, and little was transferred to products and litter. There was, however, a slow buildup of soil organic matter, which contained 70% of the total carbon at equilibrium (Table 5).
Nothofugus plantations were predicted to be approximately as effective at storing carbon as typical conifer plantations. However, Nothofugus had a faster initial rate of storage than conifer plantations (4.6 Mg C ha-’ year-‘) and accumulated more carbon in litter and soil, largely because of the high value given for the branch fraction, hb (0.18, Table 2).
There were relatively small differences in carbon storage among the three conifer plantations examined (Table 5). In all cases, over 55% of the total carbon was stored in litter and soil, suggesting that there may be little merit in refining the estimates of biomass accumulation. There seems little reason to suppose that P. sylvestris, P. con- tom and many other conifers will store substantially less carbon than P sitchensis, given similar Yield Classes and wood products.
Fugus sylvatica plantations had a slow initial rate of carbon storage (2.4 Mg C ha-’ year-‘), but, as mentioned, had a large predicted total storage, approaching that of
at Aston U
niversity on August 24, 2014
http://treephys.oxfordjournals.org/D
ownloaded from
64 DEWAR AND CANNELL
trees
litter + soil
2 250
200 : TOTAL
150
100
50 ,’
0 ,_,’ , I I I I I I
0 50 100 150 200 250 300
years since planting
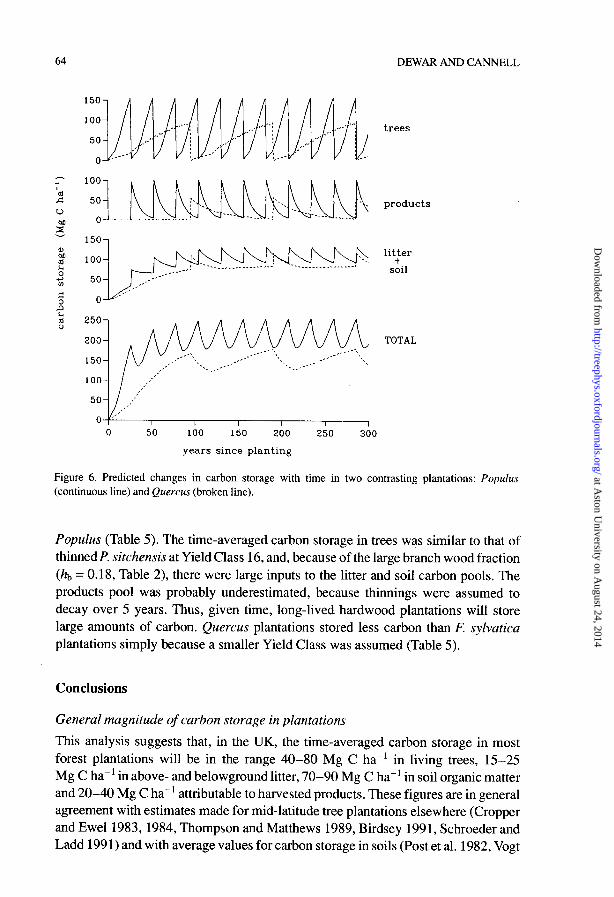
Figure 6. Predicted changes in carbon storage with time in two contrasting plantations: Populus (continuous line) and Quercus (broken line).
Populus (Table 5). The time-averaged carbon storage in trees was similar to that of thinned P. sitchensis at Yield Class 16, and, because of the large branch wood fraction (hb = 0.18, Table 2), there were large inputs to the litter and soil carbon pools. The products pool was probably underestimated, because thinnings were assumed to decay over 5 years. Thus, given time, long-lived hardwood plantations will store large amounts of carbon. Quercus plantations stored less carbon than F. sylvatica plantations simply because a smaller Yield Class was assumed (Table 5).
Conclusions
General magnitude of carbon storage in plantations This analysis suggests that, in the UK, the time-averaged carbon storage in most forest plantations will be in the range 40-80 Mg C ha-’ in living trees, 15-25 Mg C ha-’ in above- and belowground litter, 70-90 Mg C ha-’ in soil organic matter and 20-40 Mg C ha-’ attributable to harvested products. These figures are in general agreement with estimates made for mid-latitude tree plantations elsewhere (Cropper and Ewe1 1983,1984, Thompson and Matthews 1989, Birdsey 1991, Schroeder and Ladd 1991) and with average values for carbon storage in soils (Post et al. 1982, Vogt
at Aston U
niversity on August 24, 2014
http://treephys.oxfordjournals.org/D
ownloaded from
CARBON SEQUESTRATION BY FOREST PLANTATIONS 65
et al. 1986). However, the figures for harvested products should be regarded as no more than informed guesses.
The rate of carbon storage over the first rotation for most UK plantations is in the range 2-5 Mg C ha-’ year-‘, including an assumed buildup in litter and soil organic matter (see below). Thus, doubling the existing UK forest area by establishing one million hectares of new plantation on agricultural land would sequester on average 2-5 x lo6 Mg C year-’ over the first rotation, which represents l.l-2.9% ‘of the 175 x lo6 Mg C that is emitted annually in the UK.
It should be stressed that the figures derived for carbon storage in soils took no account of any loss in carbon that may occur when organic soils are drained, ploughed and fertilized. When forests are planted on organic soils or on former forest land, the net change in soil organic matter at the start and end of a rotation may be zero (Harkness and Harrison 1989) and drained peatlands could lose more carbon than is fixed by the trees during the first one or two rotations (Cannel1 et al. 1991). However, when trees are planted on former agricultural land, or sandy heathland, there is a substantial buildup in soil organic matter, as predicted. Ovington (1959) reported an increase in organic matter in the litter and soil (down to the mineral soil) from about 10 Mg ha-’ to 45 Mg ha-’ dry weight in a chronosequence of Pinus syfvestris plantations from age 14 to 55 years, planted on sandy heathland in eastern England,
Critical variables
The sensitivity analysis of the tree-soil-product system was instructive in distin- guishing processes or parameter values that (i) are either uncertain or very variable and have a major impact on carbon storage, or (ii) are known with reasonable accuracy and/or have a relatively small impact on carbon storage. Clearly, further research should be focused on the former rather than the latter.
The main processes and parameters in category (i) were: -the fractions of total woody biomass that occur in branches and woody roots (hs,
h,,), which relates to the problem of estimating the ratio of total to merchantable biomass (Johnson and Sharpe 1983, Matthews et al. 1991, Birdsey 1991);
- litter and soil organic matter decomposition rates (ki), which were treated simply in our model, but may require separate submodels driven by environmental and litter quality variables (e.g., Aber and Melillo 1982, Parton et al. 1987, Thomley and Verbeme 1989), and the rate of tine root turnover &), which has long been recognized as an important and poorly understood process that could transfer up to 5 Mg C ha-’ year-’ to the belowground litter pool (e.g., Harris et al. 1977, Grier et al. 1981, Santantonio and Hermann 1985).
The main processes and parameters in category (ii), deserving less attention, were: -the fractiou of carbon in biomass (f,); - stemwood basic density (d); -the asymptotic carbon (biomass) amount in living foliage and fine roots (gr, gk); - the time to canopy closure (&);
at Aston U
niversity on August 24, 2014
http://treephys.oxfordjournals.org/D
ownloaded from
66 DEWAR AND CANNELL
-the fraction of litter passing to soil (p); and -the possibility of accelerated decomposition rates after harvest. It is also noteworthy that total carbon storage may not always be sensitive to the
large uncertainty concerning the lifetime of wood products (T,), because, when soils are included, the wood products may represent less than a quarter of the total carbon.
DifSerences among plantation types
There is little doubt that, for any given species and site, an increase in the Yield Class (growth rate) of the plantation, as a result of genetic improvement, fertilization or irrigation, will increase carbon storage in all pools. For P. sitchensis plantations in the UK, a sixfold increase in Yield Class (4 to 24 m3 ha-’ year-‘) led to an approximate doubling of total carbon storage (ca. 2.5 to 5.0 Mg C ha-‘).
Thinning will normally decrease total carbon storage, even though the thinnings may be used for medium-life products and the harvested trees may be used for longer-life products than trees harvested from unthinned stands. Thinning reduces carbon storage mainly because it decreases the input of carbon to the litter pool both during a rotation and at harvest.
If the objective is to store carbon rapidly over a period of 20-30 years and also achieve a high total carbon storage over the longer term (at equilibrium), the best option in the UK would seem to be Popuhs plantations on fertile land. Popuhs has rapid juvenile growth, as is evident in Figure 3, and, in suitable UK conditions, will produce 12 m3 ha-’ year-’ over 26-year rotations at 2.7 m initial spacing. Rapid growth gives an estimated storage rate of 7.3 Mg C ha-’ year-’ over the first rotation (Table 5), a large time-averaged carbon storage in trees (66 Mg C ha-‘), with large inputs of litter which give equilibrium values for litter and soil carbon comparable to those in oak, beech and conifer plantations. Mini-rotations (8 years) of Salix will store carbon rapidly over the first rotation (5.9 Mg C ha-’ year-‘, Table 5), but are poor for long-term carbon storage, because there is, on average, little carbon in tree biomass and little litter input.
If the objective is to store large amounts of carbon over the long term, without regard to the initial rate of storage, then the best options seem to be (i) unthinned conifer plantations with Yield Classes exceeding the UK averages of 8-12 m3 ha-’ year-‘, or, with very slow initial storage, (ii) broadleaved tree plantations (oak, beech, ash, sycamore) with Yield Classes exceeding the UK average of 4-7 m3 ha-’ year-‘. In this study, it did not seem to matter which conifer species or which broadleaved species was used, as long as the Yield Class was high.
Acknowledgments
We thank Andrew Friend and John Thornley for useful comments. This study was supported by the UK Department of the Environment.
References
Aber, J.D. and J.M. Melillo. 1982. FORTNITE: a computer model of organic matter and nitrogen dynamics in forest ecosystems. University of Wisconsin, Research Bulletin R3130.
at Aston U
niversity on August 24, 2014
http://treephys.oxfordjournals.org/D
ownloaded from
CARBON SEQUESTRATION BY FOREST PLANTATIONS 61
Aber, J.D., D.B. Botkin and J.M. Melillo. 1978. Predicting the effects of different harvesting regimes on forest floor dynamics in northern hardwoods. Can. .I. For. Res. 8:306-315.
Berg, B., P.E. Jansson and V. Meentegeyer. 1984. Litter decomposition and climate-regional and local models. In State and Change of Forest Ecosystems-Indicators in Current Research. Ed. G.I. Agren. Swedish University of Agricultural Science, Uppsala, pp 389-404.
Cannell, M.G.R. 1982. World forest biomass and primary production data. Academic Press, London and New York.
Cannell, M.G.R. and RI. Smith. 1980. Yields of minirotation closely spaced hardwoods in temperate regions: review and appraisal. For. Sci. 26:415-428.
Cannell, M.G.R., R.C. Dewar and J.H.M. Thomley. 1991. Carbon flux and storage in European forests. In Proceedings of First Symposium on European Ecosystems. Ed. P. Mathy. CEC. In press.
Cooper, C.F. 1983. Carbon storage in managed forests. Can. J. For. Res. 13:155-166. Covington, W.W. 1981. Changes in forest floor organic matter and nutrient content following clear
cutting in northern hardwoods. Ecology 62~41-48. Cropper, W.P. and K.C. Ewel. 1983. Computer simulation of long-term carbon storage patterns in Florida
slash pine plantations. For. Ecol. Manage. 6: 101-l 14. Cropper, W.P. and K.C. Ewel. 1984. Carbon storage patterns in Douglas-fir ecosystems. Can. J. For. Res.
14:855-859. Dewar, R.C. 1991. Analytical model of carbon storage in the trees, soils and wood products of managed
forests. Tree Physiol. 8:239-258. Edwards, P.N. and J.M. Christie. 1981. Yield models for forest management. Forestry Commission
Booklet No. 48. HMSO, London. Emanuel, W.R., G.G. Killough, W.M. Post and H.H. Shugart. 1984. Modelling terrestrial ecosystems in
the global carbon cycle with shifts in carbon storage capacity by land-use change. Ecology 65:970- 983.
Grier, C.C., K.A. Vogt, M.R. Keyes and R.C. Edmonds. 1981. Biomass distribution and above and belowground production in young and mature Abies amabilis zone ecosystems of the Washington Cascades. Can. J. For. Res. 11: 155-167.
Hamilton, G.J. 1985. Forest mensuration handbook. Forestry Commission Booklet No. 35. HMSO, London.
Harkness, D.D. and A.F. Harrison. 1989. The influence of afforestation on upland soils: use of bomb 14C enrichment as a quantitative tracer for changes in organic status. Radiocarbon 31:637-643.
Harmon, M.E., W.K. Ferrell and J.F. Franklin. 1990. Effects on carbon storage of conversion of old-growth forests to young forests. Science 247:699-702.
Harris, W.F., R.S. Kinerson and N.T. Edwards. 1977. Comparison of belowground biomass of natural deciduous forests and loblolly pine plantations. Pedobiologia 17:369-381.
Houghton, R.A. 1991. Releases of carbon to the atmosphere from degradation of forests in tropical Asia. Can. J. For. Res. 21:132-142.
Houghton, R.A., R.D. Boone, J.R. Fruci, J.E. Hobbie, J.M. Melillo, C.A. Palm, B.J. Peterson, G.R. Shaver and G.M. Woodwell. 1987. The flux of carbon from terrestrial ecosystems to the atmosphere in 1980 due to changes in land use: geographic distribution of the global flux. Tellus 39B: 122-139.
Houghton, R.A., J.E. Hobbie, J.M. Melillo B. Moore, B.J. Peterson, G.R. Shaver and G.M. Woodwell. 1983. Changes in the carbon content of terrestrial biota and soils between 1860 and 1980: a net release of COz to the atmosphere. Ecological Monographs 53:235-262.
Houghton, R.A., D.L. Skole and D.S. Lefkowitz. 1991. Changes in the landscape of Latin America between 1850 and 1985. II. Net release of CO2 to the atmosphere. For. Ecol. Manage. 38173-199.
Hummel, EC., W. Palz and G. Grassi. 1988. Biomass forestry in Europe: a strategy for the future. Elsevier Applied Science, London and New York.
Johnson, W.C. and D.M. Sharpe. 1983. The ratio of total to merchantable forest biomass and its application to the global carbon budget. Can. J. For. Res. 13:372-383.
Matthews, R.W., G.A.R. Matthews, R.A. Anderson and S.S. Sencee. 1991. Construction of yield tables for woody biomass production and carbon storage in British plantation tree species. In Proceedings of Xth World Forestry Congress. In press.
at Aston U
niversity on August 24, 2014
http://treephys.oxfordjournals.org/D
ownloaded from
68 DEWAR AND CANNELL
Miller, H.G., J.D. Miller and J.M. Cooper. 1980. Biomass and nutrient accumulation at different growth rates in thinned plantations of Corsican pine. Forestry 53:23-39.
Moore, B., R.D. Boone, J.E. Hobbie, R.A. Houghton, J.M. Melillo, B.J. Peterson, G.R. Shaver, C.J. Vorosmarty and G.M. Woodwell. 1981. A simple mode1 for analysis of the role of terrestrial ecosystems in the global carbon budget. In Carbon Cycle Modelling. Ed. B. Bolin. SCOPE 16, John Wiley and Sons, pp 365-385.
Nicholls, P.H. 1981. Spatial analysis of forest growth. Forestry Commission Occasional Paper No. 12. Alice Holt, Famham, Surrey, UK.
Ovington, J.D. 1959. The circulation of minerals in plantations of Pinus sylvestris L. Ann. Bot. 23:229-239.
Parton, W.J., D.S. Schimel, C.V. Cole and D.S. Ojima. 1987. Analysis of factors controlling soil organic matter levels in Great Plains grasslands. J. Soil. Sci. Sot. Amer. 5 1: 1173-l 179.
Post, N.M., W.R. Emanuel, PJ. Zinke and A.G. Strangenberger. 1982. Soil carbon pools and world-life zones. Nature 298:156-159.
Row, C. and R.B. Phelps. 1990. Tracing the flow of carbon through the US forest product sector. 19th IUFRO World Congress, Montreal.
Santantonio, D. and R.K. Hermann. 1985. Standing crop production and turnover of fine roots on dry, moderate and wet sites of mature Douglas-fir in western Oregon. Ann. Sci. For. 42:13-142.
Satoo, T. and H.A.I. Madgwick. 1982. Forest biomass. Martinus Nihhoff/Dr W. Junk, The Hague. Schroeder, P and L. Ladd. 1991. Slowing the increase of atmospheric carbon dioxide: a biological
approach. Climate Change 19:283-290. Swift, M.J., O.W. Heal and J.M. Anderson. 1979. Decomposition in terrestrial ecosystems. Blackwell
Scientific, Oxford, UK. Thompson, D. and R. Matthews. 1989. CO2 in trees and timber lowers the greenhouse effect. Forestry
and British Timber 18: 19-24. Thomley, J.H.M. and E.L.J. Verberne. 1989. Amodel of nitrogen flows in grassland. Plant, Cell Environ.
12:863-886. Valinger E. 1990. Influence of thinning, fertilization, wind and tree size on the development of Scats pine
trees. Dissertation. Swedish University of Agricultural Sciences, Umea. Vogt, K.A., C.C. Grier and D.J. Vogt. 1986. Production, turnover and nutrient dynamics of above and
belowground detritus of world forests. In Advances in Ecological Research, Vol. 15. Academic Press, pp 303-377.
at Aston U
niversity on August 24, 2014
http://treephys.oxfordjournals.org/D
ownloaded from
CARBON SEQUESTRATION BY FOREST PLANTATIONS 69
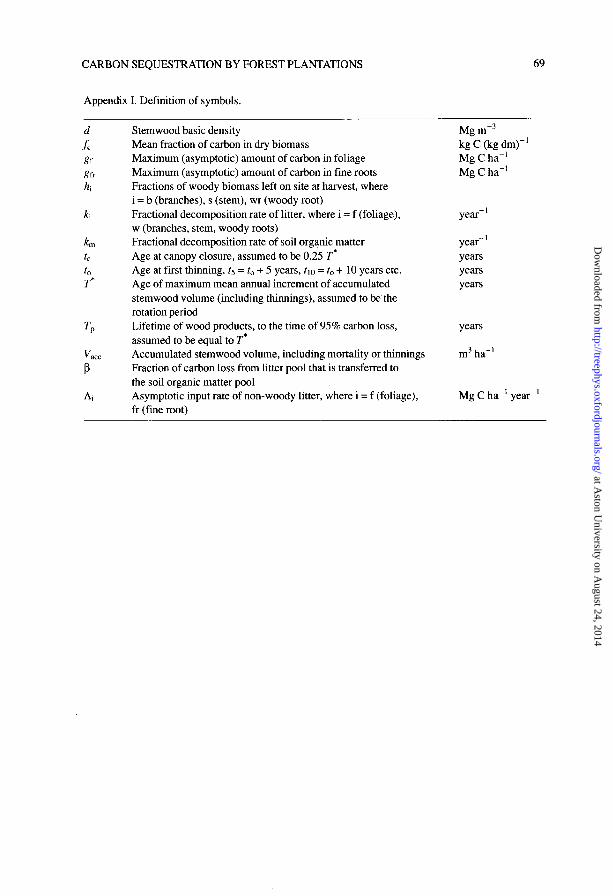
Appendix I. Definition of symbols.
ki
km & to T*
TP
7
Ai
Stemwood basic density Mean fraction of carbon in dry biomass Maximum (asymptotic) amount of carbon in foliage Maximum (asymptotic) amount of carbon in fine roots Fractions of woody biomass left on site at harvest, where i = b (branches), s (stem), wr (woody root) Fractional decomposition rate of litter, where i = f (foliage), w (branches, stem, woody roots) Fractional decomposition rate of soil organic matter Age at canopy closure, assumed to be 0.25 T* Age at first thinning. ts = to + 5 years, ttc = t, + 10 years etc. Age of maximum mean annual increment of accumulated stemwood volume (including thinnings), assumed to be. the rotation period Lifetime of wood products, to the time of 95% carbon loss, assumed to be equal to T* Accumulated stemwood volume, including mortality or thinnings Fraction of carbon loss from litter pool that is transferred to the soil organic matter pool Asymptotic input rate of non-woody litter, where i = f (foliage), fr (fine root)
Mg mm3 kg C (kg dm)-’ Mg C ha-’ Mg C ha-’
year- ’
year-’ years years years
years
m3 ha-’
Mg C ha-’ year-’
at Aston U
niversity on August 24, 2014
http://treephys.oxfordjournals.org/D
ownloaded from
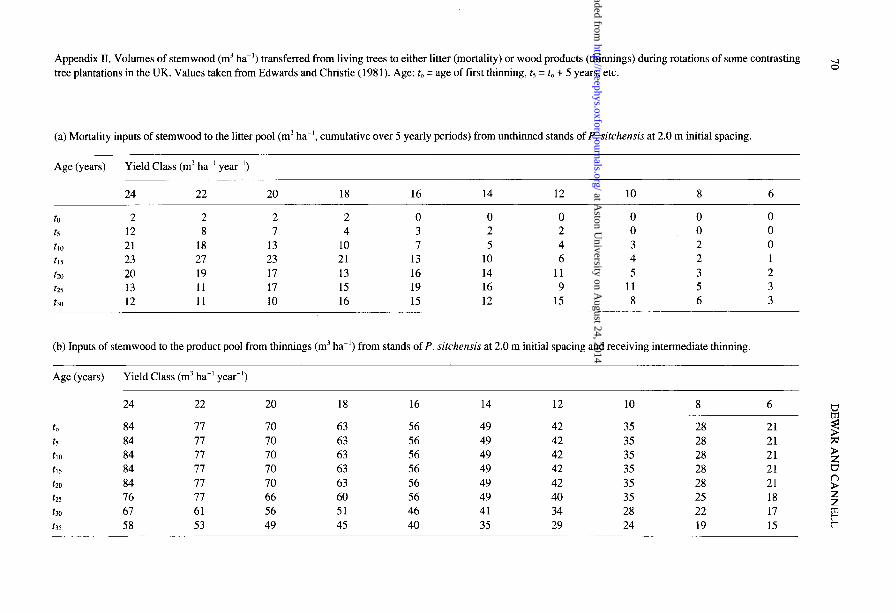
Appendix II. Volumes of stemwood (m3 ha-‘) transferred from living trees to either litter (mortality) or wood products (thinnings) during rotations of some contrasting tree plantations in the UK. Values taken from Edwards and Christie (1981). Age: t, = age of first thinning, t5 = t,, + 5 years, etc. 2
(a) Mortality inputs of stemwood to the litter pool (m3 ha-‘, cumulative over 5 yearly periods) from unthinned stands of P. sifchensis at 2.0 m initial spacing.
Age (YeM Yield Class (m3 ha-’ year-‘)
24 22 20 18 16 14 12 10 8 6
to 2 2 2 2 0 0 0 0 0 0 t.5 12 8 7 4 3 2 2 0 .o 0 tul 21 18 13 10 7 5 4 3 2 0 t15 23 27 23 21 13 10 6 4 2 1 tzo 20 19 17 13 16 14 11 5 3 2 125 13 11 17 15 19 16 9 11 5 3 tso 12 11 10 16 15 12 15 8 6 3
(b) Inputs of stemwood to the product pool from thinnings (m’ ha-‘) from stands of P. sitchensis at 2.0 m initial spacing and receiving intermediate thinning.
Age (ye4 Yield Class (m’ ha-’ year-‘)
24 22 20 18 16 14 12 10 8 6 z
to 84 77 70 63 56 49 42 35 28 21 ts 84 77 70 63 56 49 42 35 28 21 t1o 84 77 70 63 56 49 42 35 28 21 ! t15 84 77 70 63 56 49 42 35 28 21 b ho 84 77 70 63 56 49 42 35 28 21 F t25 76 77 66 60 56 49 40 35 25 18 2 t30 67 61 56 51 46 41 34 28 22 17 t35 58 53 49 45 40 35 29 24 19 15
at Aston U
niversity on August 24, 2014
http://treephys.oxfordjournals.org/D
ownloaded from
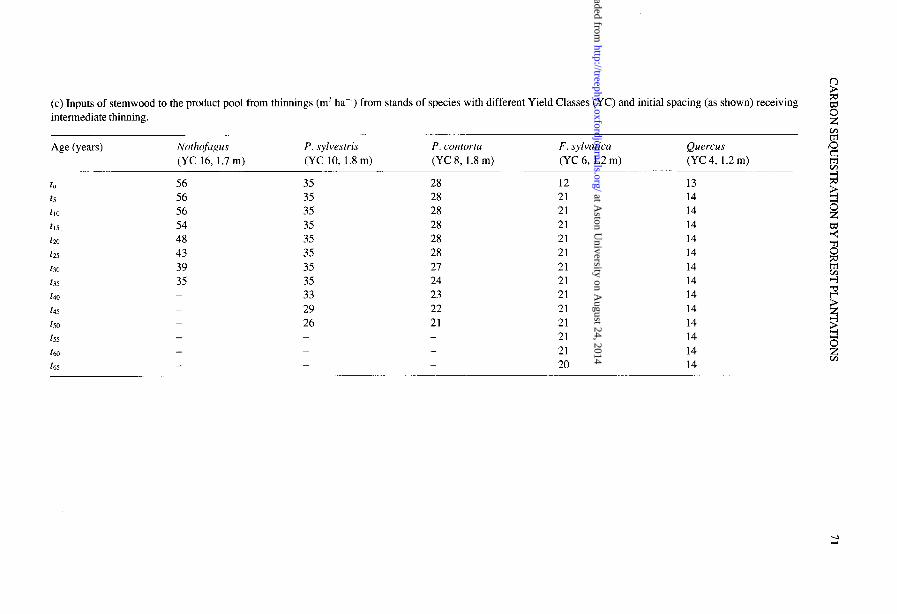
(c) Inputs of stemwood to the product pool from thinnings (m” ha-‘) from stands of species with different Yield Classes (YC) and initial spacing (as shown) receiving intermediate thinning. z
K Age (years) Nothofagus P. sylvestris P. contorta F. sylvatica Quercus
(YC 16, 1.7 m) (YC 10, 1.8 m) (YC 8, 1.8 m) (YC 6, 1.2 m) (YC 4, 1.2 m) s 8
56 56 56 54 48 43 39 35 - -
- - -
35 28 35 28 35 28 35 28 35 28 35 28 35 27 35 24 33 23 29 22 26 21 - -
- -
12 21 21 21 21 21 21 21 21 21 21 21 21 20
13 14 g
14 2 14 14 z 14 8 14 E 14 i?
14 14 ? 14 2 14 &
14 2 14 WI
at Aston U
niversity on August 24, 2014
http://treephys.oxfordjournals.org/D
ownloaded from

at Aston U
niversity on August 24, 2014
http://treephys.oxfordjournals.org/D
ownloaded from