can private airport competition improve runway pricing ... · can private airport competition...
TRANSCRIPT
CAN PRIVATE AIRPORT COMPETITION IMPROVE RUNWAY PRICING?
THE CASE OF SAN FRANCISCO BAY AREA AIRPORTS*
Jia Yan Clifford Winston**
Washington State University Brookings Institution
[email protected] [email protected]
202-797-6173
Forthcoming in the Journal of Public Economics
Abstract. Travelers and airlines are frustrated by long and costly travel delays at public airports that
are attributable to runway charges that do not account for aircraft congestion. Because the inefficient
charges are likely to persist, we explore whether private airport competition could lead to more efficient
charges that improve travelers’ welfare, increase airlines’ profits, and enable the airports to be
profitable. We use the San Francisco Bay Area for our assessment and identify important conditions to
achieve those outcomes, including competition among separately owned airports, bargaining between
airports and airlines, and the ability of airports to differentiate prices and service.
March 2014
*We are grateful to the referees and the editor for many helpful comments.
**Corresponding author.
1
1. Introduction
Public airports have failed to curb the increasingly long and costly travel delays that have
frustrated both air travelers and airlines. The heart of the problem is that aircraft pay for runway
landings—takeoffs are not charged—based on their weight subject to guidelines set by the Federal
Aviation Administration (Van Dender (2007)). Weight-based landing fees do not vary with the volume
of traffic, which affects congestion and delays, and are therefore inefficient. In principle, runway
charges could be reformed to improve efficiency, but political resistance to reforming FAA policies
(Winston (2013)) and the logistical challenges confronting a government authority that attempts to
regulate prices for different airports in a metropolitan area suggest it would be more fruitful to explore
whether private airport competition could improve airport runway pricing with government regulation,
such as price caps, imposed if it could enhance welfare. The U.S. Congressional airport privatization
program and, for example, London’s airport privatization experiment, where its major airports,
Heathrow, Gatwick, and Stansted, have been sold to different owners, indicate that policymakers have a
serious interest in the issue.
The purpose of this paper is to explore the potential effects of private airport competition on
runway prices and the welfare of travelers, airlines, and airports for the San Francisco metropolitan area
by developing an empirically tractable model of competition among Oakland, San Francisco, and San
Jose airports. Previous literature has not modeled airport competition in this manner, but it has identified
possible outcomes of privatization on runway pricing. Starkie (2001) and Zhang and Zhang (2003)
pointed out in the stylized case of a monopoly airport that the rents from leasing space to other
businesses such as retail shops induce the airport to set runway charges much closer to social marginal
costs—to increase passenger throughput—than if the airport had no concessions. Basso (2008) provided
a theoretical and numerical analysis that showed the welfare effects of airport privatization vary with
competitive conditions. And empirical studies of European airports have indicated that privatization’s
effect on prices is debatable as Bel and Fageda (2010) found in a cross-section data analysis that runway
charges are higher at private airports than at public airports and at private airports subject to regulation,
while Bilotkach et al. (2012) found in a panel-data analysis that charges are lower at privatized airports.
Our main finding is that private airport competition could increase commercial travelers’ welfare
and airlines’ profits and enable the airports to be profitable. The key conditions are that policymakers
privatize all three Bay Area airports and sell them to different owners. In this environment, airports
compete for airline operations by setting aircraft charges that reduce delays (upstream competition),
2
aircraft charges are determined through negotiations between each airport and commercial carriers,
which are organized as a bargaining unit (bargaining between upstream and downstream firms), and
different classifications of users, commercial airlines and general aviation, face different charges
(upstream price differentiation). We indicate how those conditions could be met in practice, thereby
providing general guidance to policymakers who may want to institute private airport competition.
2. Modeling Framework
Modeling private airport competition is challenging because consumer welfare and the
profitability of the downstream firms, air carriers, and upstream firms, airports, is affected. We
construct an appropriate network of air transportation routes to study and then model competition among
private San Francisco Bay Area airports as a sequential-moves game given the network. The model and
our findings account for horizontal airport competition, the vertical relationship between airports and
airlines, and horizontal airline competition where airlines compete in both price and capacity.
The Air Transportation Network
We confine our assessment to the San Francisco Bay Area airports, San Francisco Airport
(SFO), Oakland Airport (OAK), and San Jose Airport (SJC), because those airports comprise a plausible
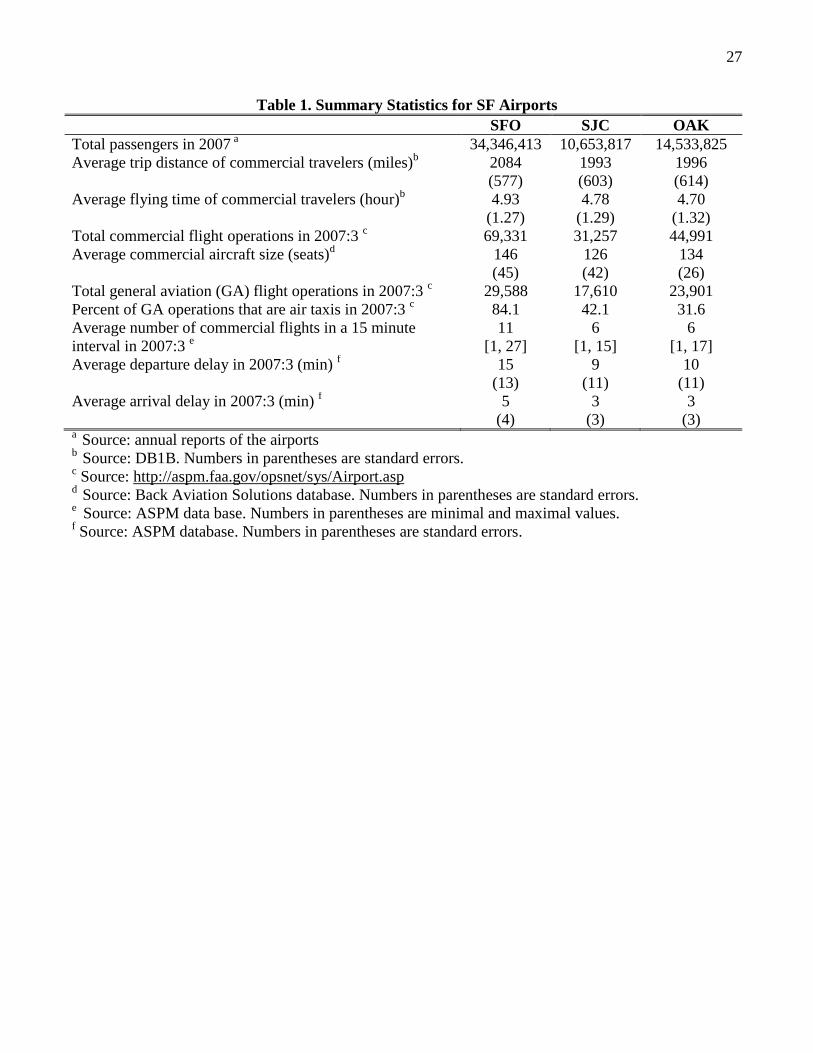
market where competition is feasible and may be beneficial to travelers and airlines. As shown in the
summary of the airports’ operations in table 1, SFO is the largest of the airports in terms of passengers,
commercial flights, and general aviation operations, especially air taxi operations that use larger planes
than other general aviation operations do. SFO also has longer departure and arrival delays but the
average trip distances, flying times, and size of commercial aircraft serving the airports are similar.
The basic unit of observation of our analysis is round trip airline activity involving one of the
three San Francisco Bay Area airports as the origin or destination and another U.S. domestic airport to
complete the route. Our network of routes excludes international routes because data are not publicly
available for the fares and service quality variables of all the carriers, domestic and international, which
serve those routes and for the delays at the foreign airports that comprise the routes. This omission does
not appear to be important for OAK and SJC airports because the share of international passengers at
those airports is less than two percent, but the share of international passengers at SFO is roughly 20
percent.1 We therefore discuss later how our findings may be affected by international airline operations
1 Those figures are from Airports Council International.
3
and we also indicate how we account for any effects of international airline travel on travelers’ demand
and carriers’ supply.
As noted, we are interested in whether private airport competition can improve pricing efficiency
and reduce delays; thus, we distinguish takeoff and landing runway charges set by private Bay Area
airports from (regulated) weight-based landing fees at public airports in other metropolitan areas by
defining airline markets by directional city-pairs, so San Francisco → Los Angeles is a different market
than Los Angeles → San Francisco. Airlines offer multiple products that we define as the combination
of an airport itinerary, air carrier, and a ticket class (price range).2 We capture private airport
competition’s effect on delays by including the 71 airports (including the SF airports) with sufficient
congestion that their traffic delays are monitored by the Federal Aviation Administration (FAA). As a
result, our analysis covers 120 city-pair markets.
We simplify our analysis by making the following assumptions.
Assumption 1: Pricing policy changes at SF airports will not affect congestion in non-SF markets.
Let A denote the set of the 71 airports in city-pair markets comprised by a San Francisco Bay
Area market. For each airline f we restrict our analysis to its sub-network denoted by AH ff , ,
where f is the set of spoke routes that are used by airline f to provide non-stop and connecting service
to and from SF airports. Thus, NSF
f
SF
ff , , where SF
f is the set of the carrier’s spokes connected
to the three SF airports and NSF
f contains non-SF spokes that are used by the airline to provide
connecting services.3
Assumption 2: Pricing policy changes at SF airports will not affect the structure of an airline’s sub-
network.
Assumption 2 states that f is fixed in our analysis for any airline f . We restrict airlines’ entry
and exit behavior because modeling those dynamic decisions would significantly complicate the
complex network equilibrium that we are trying to solve. On the one hand, this restriction may not be
particularly strong in our case because SFO is a United Airlines hub and close to the main city in the
2 For example, the San Francisco Bay Area to New York City metropolitan area market may consist of the following set of
products: 1) A $300 non-stop United Airlines (UA) flight from SFO to EWR (Newark); 2) A $300 connecting (one-stop) UA
flight from SFO to EWR through ORD (Chicago); 3) A $300 non-stop UA flight from SJC to EWR; 4) A $300 non-stop UA
flight from SFO to JFK (New York) ; 5) A $300 connecting UA flight from SFO to EWR through DEN (Denver); 6) A $300
non-stop American Airlines (AA) flight from SFO to EWR.
3 For example, the spoke connecting ORD and BOS is used by United to provide connecting service between SFO and BOS.
4
metropolitan area, while OAK and SJC are smaller airports dominated by Southwest Airlines, which is a
low-cost carrier serving point to point routes. Thus, in response to higher airport charges, United
Airlines, for example, might not be willing to move its hub-and-spoke operations by shifting a large
share of its flights from SFO to OAK and SJC. On the other hand, United could adjust its overall
network to effectively play off its SFO hub against its other hubs in the west, including LAX and
Denver, to serve certain routes that face higher airport charges at SFO. For example, it could reduce its
service to Santa Barbara from SFO and provide more service to Santa Barbara from LAX. Oum, Zhang
and Zhang (1995) show that by adjusting their hubbing activity at hub airports, airlines could gain a
competitive advantage.
We discuss later how the restriction associated with assumption 2 affects our main conclusions
about the possible benefits of private airport competition; but it is worth previewing here that the effect
is to limit the gains to travelers from airlines’ adjusting their operations to generate both more airport
product differentiation and a higher airline demand elasticity that would lower charges by privatized
airports.4 In addition, the capability of United to play off its SFO hub against its other hubs implies that
the three SF airports compete with each other and, to a certain extent, with other airports like Denver
and LAX; thus, airport competition among hub airports is another possible way that airlines can limit
private airports’ market power.
Assumption 3: Pricing policy changes at SF airports will not affect airlines’ aircraft sizes on the routes
that they serve.
Assumption 3 recognizes that it may be difficult for airlines to adjust aircraft sizes quickly by
shifting aircraft between routes because pilots on those routes have to be certified to fly specific aircraft,
union rules have to allow such changes, maintenance facilities at certain airports may be designed to
service specific aircraft, and the like. We subject this assumption to sensitivity analysis by varying
aircraft sizes to assess the effects on our conclusions.
A Three-Stage Game
Currently, public airports receive weight-based landing fees from aircraft and passenger facility
charges from travelers. We assume that a private airport would replace those charges with both takeoff
and landing runway charges; charges to travelers for parking, to retail stores for rental space and
advertising displays, and to airlines for renting terminal counters and gates, which are unrelated to
4 Airline entry at public airports is currently limited by exclusive-use gates (Morrison and Winston (2000)). Private airports
are unlikely to maintain that entry barrier.
5
government policy, would not change. We then make the following assumption to analyze private
airport competition as a sequential-moves game on the preceding air transportation network.
Assumption 4: A three-stage game of private airport competition
Stage 1: The three airports simultaneously and independently choose their aircraft landing and
takeoff charges.
Stage 2: Airlines simultaneously and independently announce capacities (total number of seats)
on their spoke routes that are connected to the three airports.
Stage 3: Airlines simultaneously announce the prices of the products they offer on the 120 city-
pair SF markets and passenger demand is allocated among products subject to the constraint
that SF spoke passengers cannot exceed the spoke capacities announced in the second stage.
Given a fixed aircraft size (assumption 3), airlines’ capacity decisions in the second stage
determine the flight frequency for the products they offer.5 Travelers value greater flight frequency
because it reduces the difference between their desired departure time and the closest available departure
time. That difference was termed schedule delay by Douglas and Miller (1974) and is distinct from
scheduled delay that is included by the airlines in their schedule to account for congestion at the origin,
enroute, and at the destination.
The Bertrand-Nash equilibrium of airline price competition in the third stage of the airport
privatization game allocates seats to products across markets, thereby simplifying the revenue
management techniques adopted by airlines to address uncertain demand. Another simplification is that
we allow spoke capacity to be added marginally when, in fact, it is added in a lumpy manner. Finally,
we assume that airlines do not incur costs from committing to provide spoke capacity; costs are incurred
only when capacity is actually used to transport passengers.
The three-stage private airport competition game provides only a static analysis by not
accounting for airlines’ dynamic entry and exit behavior, which is extremely difficult to model in our
context. But, given our purpose, we can assess whether private airport competition would enhance
social welfare in a static setting and how that assessment would be affected in a dynamic setting.
Specifying Airline Behavior. Taking airport runway charges as given, airlines engage in price and
service competition, where flight frequency, which influences schedule delay, is the key service
variable. A product j in a market m is an airport-airline-routing combination. The number of travelers
choosing product j in market m is denoted by mm d,pjmq , which is a function of a vector of prices
5 For a given period of time, flight frequency on a spoke route is the ratio of the total number of seats to average aircraft size.
6
mp and a vector of schedule delays md for all products in market m . For a given aircraft size,
schedule delays are determined by the spoke capacities chosen by the airlines in the second stage of the
game; we use sfT to denote the total number of seats of airline f on spoke route s . In the last stage of
the game, given spoke capacities, airlines engage in Bertrand competition as each airline simultaneously
chooses prices for the products it offers on SF markets by solving the following constrained profit-
maximization problem:
fsTqts
Cqp
sf
j
jm
f
m Jj
jmjmf
sf
fm
M
m
and allfor , ..
Max
m
1
mmp
d,pfm
(1)
where sf denotes the set of products offered by carrier f using spoke s and
fmJ denotes the set of
products offered by carrier f in market m ; fmJjjmp
fmp where jmp is the price of product j in
market m ; and fC is the airline’s total variable cost function. Unlike total revenues, which are obtained
by aggregating revenue from the products in each market that an airline serves, total costs for those
products cannot be defined because products in different markets may share the same spoke route. Thus,
similar to Berry, Carnall and Spiller (2007), we specify an airline’s total variable costs of providing
services that are connected to the SF airport market as the sum of the total costs of each spoke served by
the airline plus product-specific costs:
M
m Jj
jmjmjm
s
sff
fmf
WqQCC1
, (2)
where sfQC denotes the carrier’s operating costs on spoke s ; sfQ denotes the spoke passengers;
jmjmjm Wq denotes product-specific costs; jmW is a vector of observed exogenous market and
product characteristics including airline and airport dummies; is a vector of parameters; and jm is a
random component capturing unobserved product characteristics.
A carrier’s spoke-route operating costs sfQC include aircraft operating costs ( sfAOC ) that are
affected by airport delays, aircraft take-off and landing fees ( sfLF ), and an additional component
capturing other spoke-route operating costs such as scheduling and maintenance costs ( sfSC ). The
specification of total variable costs implies that the marginal cost of product j in market m is
7
jmjm
js sf
sf
sf
sf
sf
sf
jm WQ
SC
Q
LF
Q
AOCMC
f
, (3)
where jjj NSF
f
SF
ff , is the set of carrier f’s spokes associated with product j.
In stage 2 of the airport privatization game, armed with an accurate prediction of the equilibrium
outcomes of the price subgame given spoke capacities and runway charges, each airline chooses
capacities on the SF segments it serves SFfssfT
to maximize total profits from the markets that are
connected to the SF airports. The capacity decisions affect the equilibrium outcomes of the price
subgame by affecting product demand through flight frequency, the capacity constraint in equation (1),
and aircraft operating costs through airport delays.
It is difficult to fully analyze the airline price and service subgame for a number of reasons.
Given spoke capacities, airlines’ pricing decisions may be interdependent across markets through the
capacity constraints because products in different markets may share the same spoke route. Similarly,
capacity decisions on different spokes may have complex interdependencies. And the pricing and
capacity interdependencies may be exacerbated by airport congestion externalities.6 In practice, airlines
can hardly optimize spoke capacities for their entire network. In a survey paper, Barnhart and Cohn
(2004) indicate that airlines use models of flight scheduling that establish rules to determine incremental
changes to the existing schedule for a limited number of segments. Belobaba et al. (2009, p. 159) found
that airlines generally assume a target load factor—the widely adopted industry measure of capacity
utilization defined as the percentage of seats filled by paying passengers—in their fleet planning
process. We therefore simplify our analysis of airline price and service competition by making the
following plausible assumption:
Assumption 5: Airlines choose capacities on their spoke routes to achieve target load factors on those
spokes.
An airline’s target load factor on a spoke can never be greater than 100%.7 Although U.S.
carriers have become more disciplined about controlling the growth of their capacity, the industry-wide
average load factor in U.S. domestic markets has been roughly 80% for the last several years, suggesting
that carriers operate with excess capacity because the demand for air travel is stochastic and because
6 An example of the interdependencies of a carrier’s decisions is that its capacity decision on a segment affects congestion at
the airport and therefore affects the costs of all other products that are connected to the airport as well as travelers’ choices in
different markets. 7 This does not imply that we assume specific flights are never sold out. Such events do occur because of the stochastic nature
of air travel demand regardless of the target load factor.
8
carriers still compete on service quality by offering more frequent flights. Assumption 5 implies that the
capacity constraint in equation (1) is always non-binding. Given a targeted spoke-route load factor,
which is denoted by sf , the capacity of a spoke-route is determined by sfsfsf QT for each fs .
Thus, the marginal cost of an airline’s product, given by equation (3), includes the marginal spoke costs
(the terms that are summed) even if the capacity constraint is not binding because the spoke costs, which
are functions of sfT , increase when
sfQ increases.
Specifying Airport Behavior. We construct an airport’s profit equation, which is optimized with
respect to its takeoff and landing charges.8 Let n denote a San Francisco Bay Area airport; n
denote
the set of spokes originating from or terminating at the airport; and nQ denote the total number of
departure and arrival passengers at airport n . We define an airport’s operating revenue function as
n
NA
n
s f
sf
A
nn QTRn
, (4)
where An denotes the takeoff and landing charges in dollars per seat at airport n and
NAn denotes the
dollar expenditures per passenger on concessions and parking.
To determine costs , we note that the outputs of an airport include the number of passengers,
the number fights nF which is determined by airlines’ spoke capacities, and non-aeronautical
activities (parking and concessions), which are measured by the revenues they generate. Because we
model those revenues as a linear function of passengers as in equation (4), we specify the short-run
operating cost function for airports as nnn FQ , . Publicly-owned airports set landing charges based
on current weight-based rules at U.S. commercial airports. When the airports are privatized and sold to
different owners, each airport engages in Bertrand competition and solves nnn RMaxAn
. Their
runway charges affect the equilibrium outcomes of airline price and service competition by affecting
airlines’ marginal spoke costs in equation (3).
Equilibrium Concept. The equilibrium concept for the three-stage private airport competition
game is the subgame perfect equilibrium (SPE), which is characterized in this section by backward
induction. Because of the non-binding capacity constraint in equation (1), the airline price subgame can
be investigated market-by-market as firms with multiple products engage in price competition. If a
8 Airport charges can be complex and include add-ons for check-in counters and so on. However, negotiated charges at some
airports (for example, in Europe) consist of one charge based on departing passengers.
9
Bertrand-Nash equilibrium for the price subgame exists,9 then equilibrium prices satisfy the first-order
conditions:
mJjMCpp
pfm
Jk
kmkm
jm
kmjm
jm fm
and allfor ,0 f
. (5)
Note that given the spoke capacities,
0
jm
mk
p
q
when mm .
We now characterize the SPE to the two-stage game of airline price and service competition
given airport runway charges. In stage 2 of the private airport competition game, each airline chooses
SF segment capacities such that it achieves its target load factor at the price equilibrium given its
competitors’ chosen capacities. Let fssfT
,T denote a vector of carriers’ spoke capacities. The demand
for products given the spoke capacities and the associated equilibrium prices can then be denoted by
jPq jm allfor ,TT and m , because spoke capacities affect product demand both directly by
determining flight frequency and indirectly by determining equilibrium prices by affecting marginal
spoke costs. The capacity of a spoke-route given TT P and is determined by:
fsPqQT sfsf
j
jsfsfsf
sf
and allfor , TTT
. (6)
Thus we can define a vector-valued function fssfH
,TTΗ such that Η is a self-map on the
space of spoke capacities.10
The fixed-point of the self-map along with the equilibrium air product
prices, which are determined by equation (5) given the fixed-point of carriers’ spoke capacities,
constitute the SPE to the airline competition game given airport runway charges.
Moving backward to the first stage of the game, the three airports engage in Bertrand
competition, which amounts to price competition with substitute products among single-product firms,
with the expectation of the equilibrium outcomes of airline competition given airport charges. As
summarized in Vives (2005), such a game is supermodular under general conditions and the results in
Topkis (1979) show that pure-strategy equilibra exist for a supermodular game and that the least and the
9 Existence and uniqueness of airline price competition equilibrium in a market depends on the specification of travelers’
demand function. Detailed discussions of this issue based on our empirical demand specification are contained in the
appendix. 10
It is plausible to assume that there is an upper bound on capacity for each of the spoke routes. Η is therefore a self-map
on a closed, bounded, and convex space and according to Brouwer’s fixed-point theorem its fixed-points exist if Η is
continuous. Moreover, the fixed-point is unique if Η is monotonic.
10
greatest equilibrium points exist in the set of equilibrium points. The Bertrand equilibrium airport
charges, along with the SPE to the airline competition game given the airport charges, constitute the SPE
to the overall game.
3. Parameterization, Estimation, Calibration and Validation of the Model
Given the preceding framework, we provide a quantitative assessment of private airport
competition by using data from the SF airports in the 3rd
quarter of 2007 to estimate empirical models of
air travelers’ airline and airport demand and airlines’ and airports’ operating cost functions. We then
validate the empirical models by simulating the equilibrium of airline competition under the current
policy that the SF airports are publicly owned. We outline the specification of the models and empirical
procedures in the text and present the details of estimation, identification, and simulation in the technical
appendix.
Demand. We develop an aggregate discrete choice model in the spirit of Berry, Levinsohn, and
Pakes (1995) hereafter BLP, to analyze San Francisco Bay Area travelers’ airline and airport choices.
Assuming a linear functional form, the utility of traveler i choosing air travel product j in market m is
given by (for simplicity, we suppress the market subscript m):
mijjlj
laj
afj
fjjijij NjtttdpXu ,...,1 , (7)
where jX is a vector of observed exogenous product attributes, including the distance from the origin to
the destination, airline dummies to capture travelers’ preferences for specific airlines, airport dummies
to capture travelers’ preferences for specific airports, a carrier’s origin and destination airport presence,
defined as the number of cities served, domestic and international, by the carrier from the origin and
destination airports, and interactions between the airline and airport dummies to capture travelers’
preferences for specific airlines at specific airports; jp is the price of product j (the passenger-fare
listed in the itinerary); jd is the schedule delay associated with product j ; fjt is the airborne time
associated with product j ; ajt is the total airport delay, which includes departure and arrival delay at the
origin and destination, as well as departure and arrival delay at the connecting airport for connecting
flights, associated with product j ; ljt is the layover time associated with product j (layover time is zero
for non-stop flights); j is a random component representing unobserved attributes of product j (for
example, travel restrictions associated with the fare) and is allowed to be correlated with price and flight
11
frequency; ij is a random component representing measurement error; mN is the total number of
products in market m ; and i , , , f , a , and l are parameters.
Three comments about the specification are in order. First, for a given traveler, the airline and
airport dummies included among the exogenous product attributes capture the effect of such variables as
the attractiveness of an airline’s frequent flier program and the convenience of an airport’s location.
Second, although we do not include international routes in our sample, carriers’ fares, flight frequency,
and other service variables in the demand specification reflect the presence of international travelers on
domestic routes. In addition, as noted, the specification includes the number of international cities that
an airline serves from the Bay Area airports and includes airline and airport dummy interactions, which
capture travelers’ preferences for a specific carrier serving a specific Bay Area airport, which may be
partly related to the carrier’s more extensive international operations at that airport. Third, the subscript
i for the price coefficient α indicates that the coefficient is modeled to vary across travelers to capture
the heterogeneity of their preferences for air travel.11
Because of data limitations, we specify the price
variable in terms of a simple binary random distribution, which enables us to broadly capture the
difference between those travelers who are primarily traveling for business and those who are primarily
traveling for leisure.
The mean utility of the outside product, which is indexed by the subscript zero, is normalized to
zero. We specify the joint distribution of the errors miNiii ,...,, 10 as Generalized Extreme Value
(GEV), which results in a choice probability with the nested-logit form where the outside product is in
one nest and the air travel products are in another nest. As is well known, the GEV distributional
assumption yields a tractable model but it also restricts the substitution pattern among alternatives within
the nest for air travel products by treating the errors as independent. Our empirical specification seeks to
minimize that restriction by including price and various service quality measures as well as both airline
and airport dummies to capture unobserved preferences for specific airlines and airports; by explicitly
modeling the unobserved product attributes j that may be correlated with the price and service time
components; and by capturing preference heterogeneity for the price of air travel products.
11
Initial specifications and estimations attempted to also capture travelers’ preference heterogeneity for the service times
offered by the air travel products; but we were not able to estimate those taste parameters with much precision because
identification from market level data only can rely on the variation in substitution patterns among similar products as the mix
of products varies across markets. Because we analyze a network that includes only markets that originate or terminate in the
San Francisco Bay area, we apparently did not have sufficient variation to estimate the service time taste parameters.
12
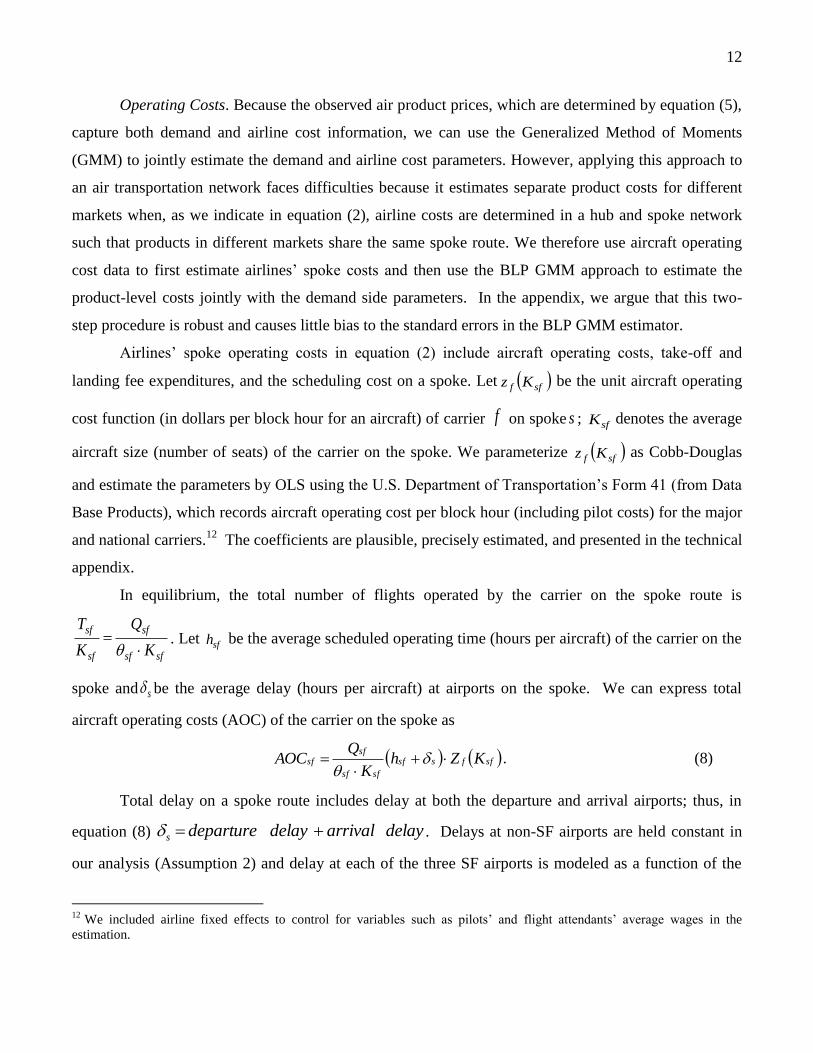
Operating Costs. Because the observed air product prices, which are determined by equation (5),
capture both demand and airline cost information, we can use the Generalized Method of Moments
(GMM) to jointly estimate the demand and airline cost parameters. However, applying this approach to
an air transportation network faces difficulties because it estimates separate product costs for different
markets when, as we indicate in equation (2), airline costs are determined in a hub and spoke network
such that products in different markets share the same spoke route. We therefore use aircraft operating
cost data to first estimate airlines’ spoke costs and then use the BLP GMM approach to estimate the
product-level costs jointly with the demand side parameters. In the appendix, we argue that this two-
step procedure is robust and causes little bias to the standard errors in the BLP GMM estimator.
Airlines’ spoke operating costs in equation (2) include aircraft operating costs, take-off and
landing fee expenditures, and the scheduling cost on a spoke. Let sff Kz be the unit aircraft operating
cost function (in dollars per block hour for an aircraft) of carrier f on spoke s ; sfK denotes the average
aircraft size (number of seats) of the carrier on the spoke. We parameterize sff Kz as Cobb-Douglas
and estimate the parameters by OLS using the U.S. Department of Transportation’s Form 41 (from Data
Base Products), which records aircraft operating cost per block hour (including pilot costs) for the major
and national carriers.12
The coefficients are plausible, precisely estimated, and presented in the technical
appendix.
In equilibrium, the total number of flights operated by the carrier on the spoke route is
sfsf
sf
sf
sf
K
Q
K
T
. Let sfh be the average scheduled operating time (hours per aircraft) of the carrier on the
spoke and s be the average delay (hours per aircraft) at airports on the spoke. We can express total
aircraft operating costs (AOC) of the carrier on the spoke as
sffssf
sfsf
sfsf KZh
K
QAOC
. (8)
Total delay on a spoke route includes delay at both the departure and arrival airports; thus, in
equation (8) delay arrivaldelay departure s . Delays at non-SF airports are held constant in
our analysis (Assumption 2) and delay at each of the three SF airports is modeled as a function of the
12
We included airline fixed effects to control for variables such as pilots’ and flight attendants’ average wages in the
estimation.
13
ratio of the total traffic volume to the number of active runways at each airport. We parameterize the
function by a translog form and use traffic delays recorded in the FAA’s Aviation System Performance
Metrics (ASPM) database, which contains scheduled operations every 15 minutes for 23 specific airlines
(22 U.S. network and commuter airlines plus Air Canada) plus one composite “other” category for all
other commercial airlines, to estimate the parameters for departure and arrival delays for each of the SF
airports. The parameter estimates and the plots of the estimated delay functions are shown in the
technical appendix.
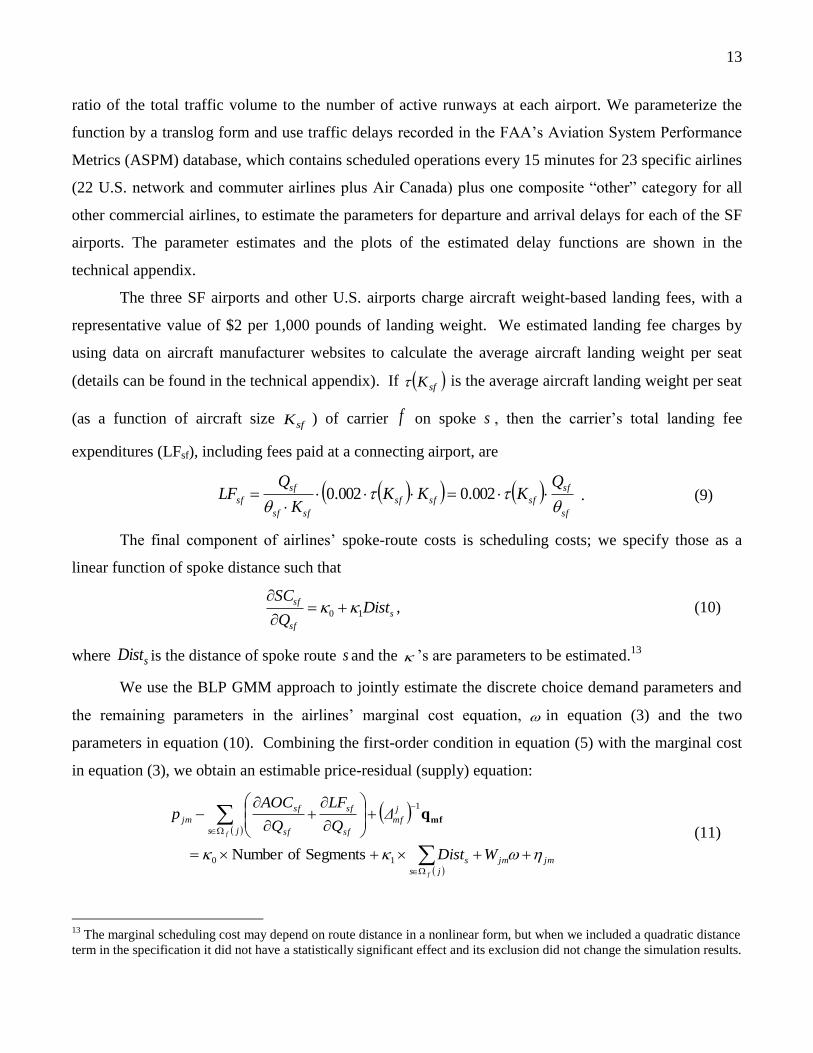
The three SF airports and other U.S. airports charge aircraft weight-based landing fees, with a
representative value of $2 per 1,000 pounds of landing weight. We estimated landing fee charges by
using data on aircraft manufacturer websites to calculate the average aircraft landing weight per seat
(details can be found in the technical appendix). If sfK is the average aircraft landing weight per seat
(as a function of aircraft size sfK ) of carrier f on spoke s , then the carrier’s total landing fee
expenditures (LFsf), including fees paid at a connecting airport, are
sf
sf
sfsfsf
sfsf
sf
sf
QKKK
K
QLF
002.0002.0 . (9)
The final component of airlines’ spoke-route costs is scheduling costs; we specify those as a
linear function of spoke distance such that
s
sf
sfDist
Q
SC10
, (10)
where sDist is the distance of spoke route s and the ’s are parameters to be estimated.13
We use the BLP GMM approach to jointly estimate the discrete choice demand parameters and
the remaining parameters in the airlines’ marginal cost equation, in equation (3) and the two
parameters in equation (10). Combining the first-order condition in equation (5) with the marginal cost
in equation (3), we obtain an estimable price-residual (supply) equation:
jmjm
js
s
j
mf
js sf
sf
sf
sf
jm
WDist
ΔQ
LF
Q
AOCp
f
f
Segments ofNumber 10
1
mfq
(11)
13
The marginal scheduling cost may depend on route distance in a nonlinear form, but when we included a quadratic distance
term in the specification it did not have a statistically significant effect and its exclusion did not change the simulation results.
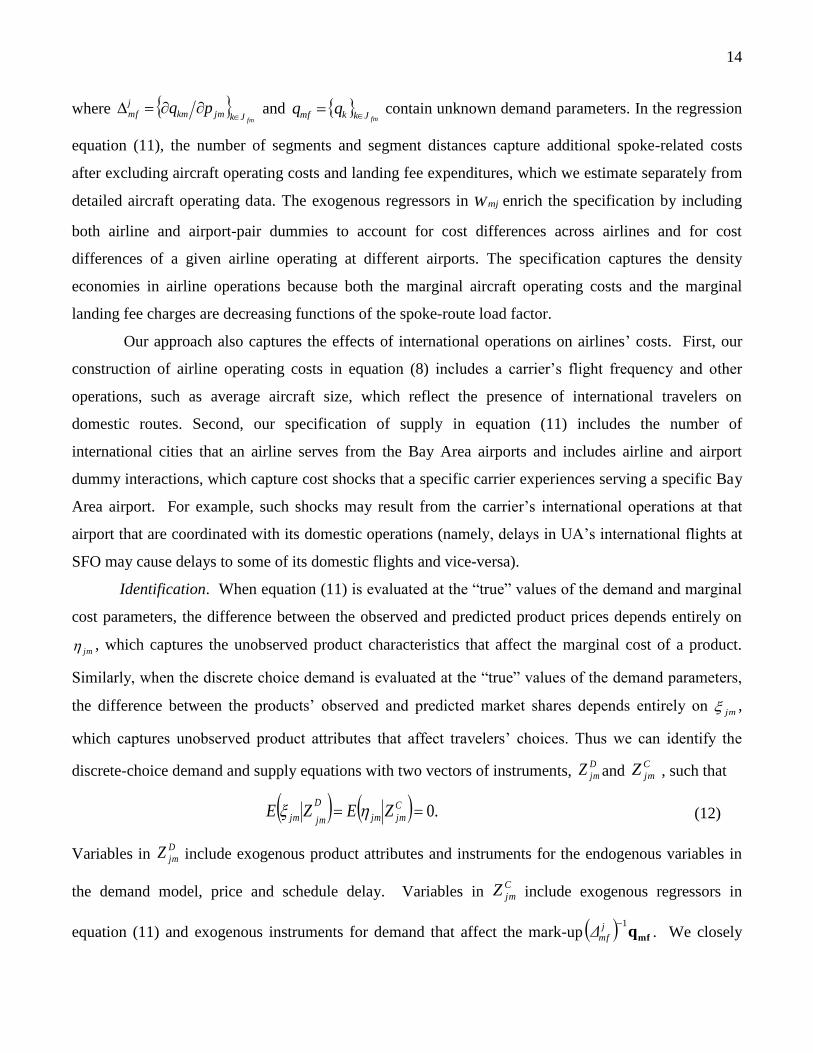
14
where fmJkjmkm
j
mf pq
and fmJkkmf qq
contain unknown demand parameters. In the regression
equation (11), the number of segments and segment distances capture additional spoke-related costs
after excluding aircraft operating costs and landing fee expenditures, which we estimate separately from
detailed aircraft operating data. The exogenous regressors in mjW enrich the specification by including
both airline and airport-pair dummies to account for cost differences across airlines and for cost
differences of a given airline operating at different airports. The specification captures the density
economies in airline operations because both the marginal aircraft operating costs and the marginal
landing fee charges are decreasing functions of the spoke-route load factor.
Our approach also captures the effects of international operations on airlines’ costs. First, our
construction of airline operating costs in equation (8) includes a carrier’s flight frequency and other
operations, such as average aircraft size, which reflect the presence of international travelers on
domestic routes. Second, our specification of supply in equation (11) includes the number of
international cities that an airline serves from the Bay Area airports and includes airline and airport
dummy interactions, which capture cost shocks that a specific carrier experiences serving a specific Bay
Area airport. For example, such shocks may result from the carrier’s international operations at that
airport that are coordinated with its domestic operations (namely, delays in UA’s international flights at
SFO may cause delays to some of its domestic flights and vice-versa).
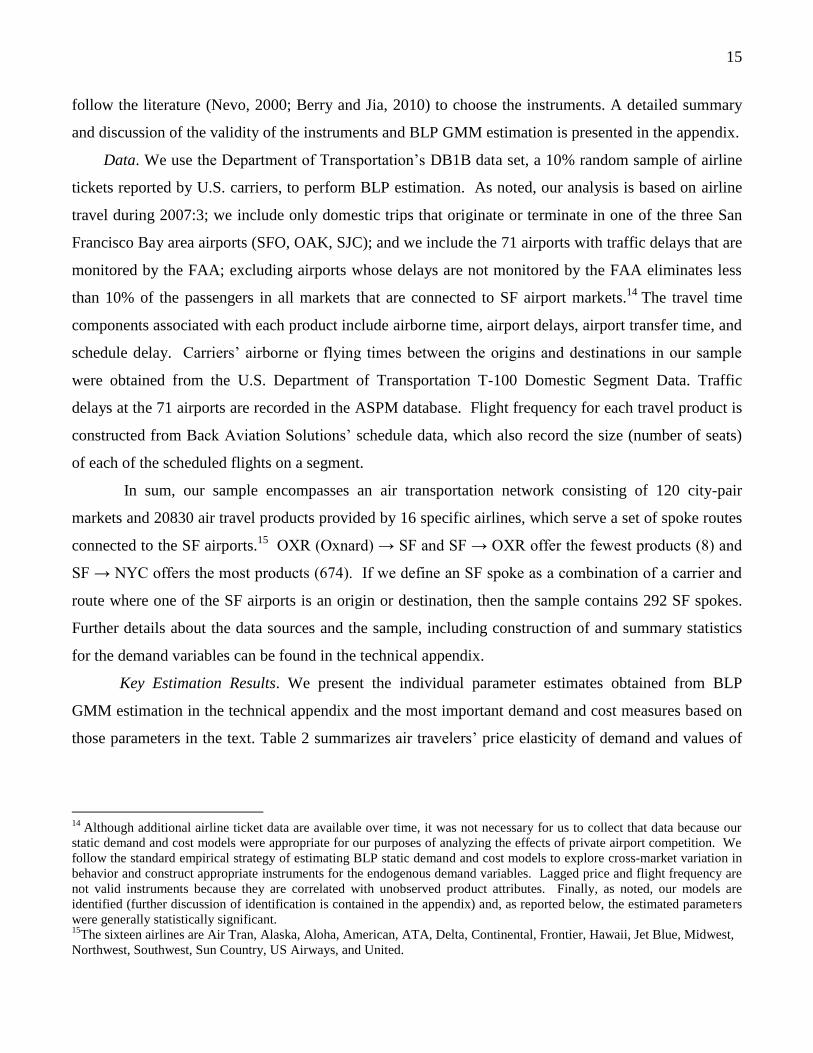
Identification. When equation (11) is evaluated at the “true” values of the demand and marginal
cost parameters, the difference between the observed and predicted product prices depends entirely on
jm , which captures the unobserved product characteristics that affect the marginal cost of a product.
Similarly, when the discrete choice demand is evaluated at the “true” values of the demand parameters,
the difference between the products’ observed and predicted market shares depends entirely on jm ,
which captures unobserved product attributes that affect travelers’ choices. Thus we can identify the
discrete-choice demand and supply equations with two vectors of instruments, D
jmZ and C
jmZ , such that
.0 C
jmjm
D
jmjm ZEZE (12)
Variables in D
jmZ include exogenous product attributes and instruments for the endogenous variables in
the demand model, price and schedule delay. Variables in C
jmZ include exogenous regressors in
equation (11) and exogenous instruments for demand that affect the mark-up mfq1j
mfΔ . We closely
15
follow the literature (Nevo, 2000; Berry and Jia, 2010) to choose the instruments. A detailed summary
and discussion of the validity of the instruments and BLP GMM estimation is presented in the appendix.
Data. We use the Department of Transportation’s DB1B data set, a 10% random sample of airline
tickets reported by U.S. carriers, to perform BLP estimation. As noted, our analysis is based on airline
travel during 2007:3; we include only domestic trips that originate or terminate in one of the three San
Francisco Bay area airports (SFO, OAK, SJC); and we include the 71 airports with traffic delays that are
monitored by the FAA; excluding airports whose delays are not monitored by the FAA eliminates less
than 10% of the passengers in all markets that are connected to SF airport markets.14
The travel time
components associated with each product include airborne time, airport delays, airport transfer time, and
schedule delay. Carriers’ airborne or flying times between the origins and destinations in our sample
were obtained from the U.S. Department of Transportation T-100 Domestic Segment Data. Traffic
delays at the 71 airports are recorded in the ASPM database. Flight frequency for each travel product is
constructed from Back Aviation Solutions’ schedule data, which also record the size (number of seats)
of each of the scheduled flights on a segment.
In sum, our sample encompasses an air transportation network consisting of 120 city-pair
markets and 20830 air travel products provided by 16 specific airlines, which serve a set of spoke routes
connected to the SF airports.15
OXR (Oxnard) → SF and SF → OXR offer the fewest products (8) and
SF → NYC offers the most products (674). If we define an SF spoke as a combination of a carrier and
route where one of the SF airports is an origin or destination, then the sample contains 292 SF spokes.
Further details about the data sources and the sample, including construction of and summary statistics
for the demand variables can be found in the technical appendix.
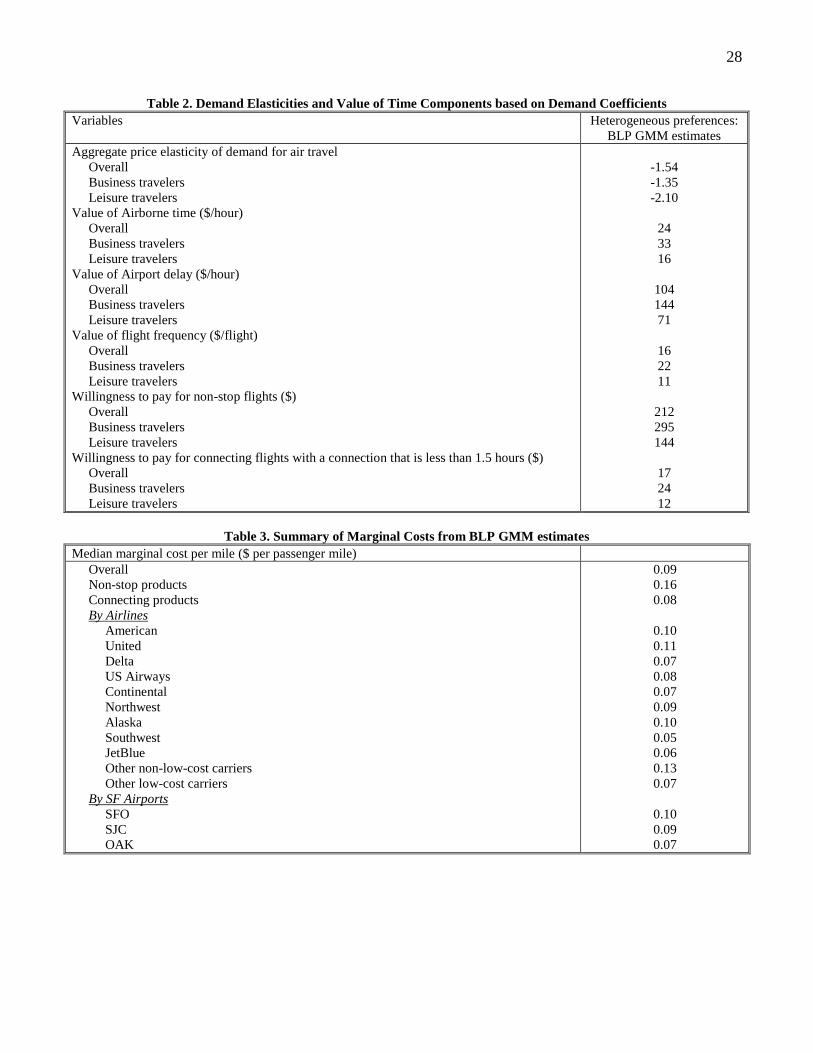
Key Estimation Results. We present the individual parameter estimates obtained from BLP
GMM estimation in the technical appendix and the most important demand and cost measures based on
those parameters in the text. Table 2 summarizes air travelers’ price elasticity of demand and values of
14
Although additional airline ticket data are available over time, it was not necessary for us to collect that data because our
static demand and cost models were appropriate for our purposes of analyzing the effects of private airport competition. We
follow the standard empirical strategy of estimating BLP static demand and cost models to explore cross-market variation in
behavior and construct appropriate instruments for the endogenous demand variables. Lagged price and flight frequency are
not valid instruments because they are correlated with unobserved product attributes. Finally, as noted, our models are
identified (further discussion of identification is contained in the appendix) and, as reported below, the estimated parameters
were generally statistically significant. 15
The sixteen airlines are Air Tran, Alaska, Aloha, American, ATA, Delta, Continental, Frontier, Hawaii, Jet Blue, Midwest,
Northwest, Southwest, Sun Country, US Airways, and United.
16
travel time components.16
The overall aggregate price elasticity of demand for air travel in the 120
markets in our sample, -1.54, is broadly consistent with Gillen et al’s (2003) comprehensive survey of
price elasticity estimates of the demand for air travel that report a median elasticity of -1.33. As
expected, leisure travelers are more responsive to fare changes than business travelers are because they
usually pay for their air travel and their travel schedule in more flexible. In contrast, business travelers
place a higher value on all of the travel time components, obtained as the ratio of a travel time
coefficient and the business or leisure traveler price coefficient. We find that the overall value of
airborne time is $24/hour, with business travelers valuing that time at $33/hour and leisure travelers
valuing it at $16/hour. This is aligned with previous estimates of the value of travel time that cluster
around $30/hour (e.g., Morrison and Winston (1989)). In all likelihood, travelers’ high willingness to
pay to avoid airport delays and connections indicate that those disruptions could result in late arrivals
that force meetings to be cancelled, hotel and other travel reservations to be lost or significantly altered,
and the like. The estimates also suggest that the main source of disutility from connecting flights is the
actual stop before reaching the destination rather than the length of the stop per se, while the fact that
our sample consists of dense markets with many flight alternatives may explain why the marginal value
of an additional flight is modest.17
Using the BLP GMM estimates for equation (11) along with equations (8) and (9), which are
estimated separately based on aircraft operating data, we calculate the marginal costs of the air travel
products and report the results in Table 3. The average marginal cost across the 20830 products is 9
cents per passenger mile; Berry and Jia (2010) obtain a lower estimate of 6 cents per passenger mile but
they do not restrict their sample to SF airport markets, which may have higher costs because they
include a higher share of airline flights that experiences delays from operating in congested conditions.
Moreover, our specification of airline marginal cost differs from theirs by explicitly accounting for
airlines’ costs based on hub and spoke operations. The average marginal cost of non-stop flights, 16
cents per passenger mile, is greater than the average marginal cost of connecting flights, 8 cents per
mile, possibly because airlines use larger more expensive aircraft and operate with somewhat lower load
16
The appendix presents calculations for sensitivity purposes based on coefficients obtained from OLS estimation, which
treats preferences as homogenous and assumes price and schedule delay are exogenous, and from instrumental variables (IV)
estimation as in Berry (1994), which treats preferences as homogenous and assumes price and schedule delay are
endogenous. In general, ignoring the endogeneity of price and schedule delay leads to implausible results. 17
The estimated value of flight frequency may also reflect imprecision from using an equation for schedule delay that needs
to be based on more recent data. However, we obtained a similar value when we directly specified flight frequency instead of
schedule delay in the demand model.
17
factors on non-stop flights.18
Turning to airlines, Southwest’s and JetBlue’s marginal costs are, as
expected, lower than the other (mainly legacy) carriers’ marginal costs. American’s and United’s costs
may be the highest among the legacy carriers because they tend to serve the most congested routes in
our network, while United’s costs may slightly exceed American’s costs because of its extensive
international operations at SFO.19
Among the three airports in the SF market, air travel products that
involve Oakland airport have the lowest marginal cost.
The final task of the model parameterization is to specify the short-run operating costs of an
airport n . We specify the function as Cobb-Douglas such that
n
n
n
s f sf
sfnnn
K
TQ
2
1
0
. (13)
Based on Oum, Yan, and Yu’s (2008) estimates of a short-run multi-output airport operating cost
function, we set 10.0 and 0.60 21 nn , which measure the cost elasticities with respect to
passengers and aircraft operations respectively,20
in the baseline simulations and calibrate n0 so that in
equilibrium the ratios of operating expenses to operating revenues at the SF airports are equal to the
ratios that were actually observed in 2007 given the applicable landing fees.21
We found that varying
the cost elasticities within plausible ranges had no notable effects on our findings.
Validation. To validate our empirical models, we compute the SPE of the airlines’ service-price
subgame given airport charges by simulating the baseline equilibrium (2007:3) under the current policy
that the SF airports are publicly owned.22
We show in the technical appendix that based on a
comparison of simulated with actual outcomes, our model generates credible predictions of air travel
activity at the SF airports as indicated by its close replication of the level of airport passengers and the
distribution of product prices, demands, and spoke passengers. Our model tends to underestimate flight
frequencies, but that is not surprising because we do not include connecting passengers whose flights do
not originate or terminate at an SF airport.
18
Of course, large aircraft become economical at an airport when the airport can consolidate traffic on spoke routes. At the
same time, recall that the landing weight (and cost) per seat increases with aircraft capacity. 19
The average airport delay among all products in the data is 34 minutes, while the average airport delay for both UA and
AA is 35 minutes. 20
Airports tend to exhaust scale economies in the long run when runway capacity is optimized (Morrison (1983)). The cost
elasticities used here imply increasing returns in the short run. 21
Based on their financial reports, the ratios in 2007 of real operating expenses to operating revenues are 0.86 at SFO, 1.34 at
SJC, and 1.03 at OAK. 22
Under this policy, commercial carriers pay the 2007 weight-based landing fee, but they are not charged for taking off from
an airport, and travelers pay passenger facility charges that are included in the fare.
18
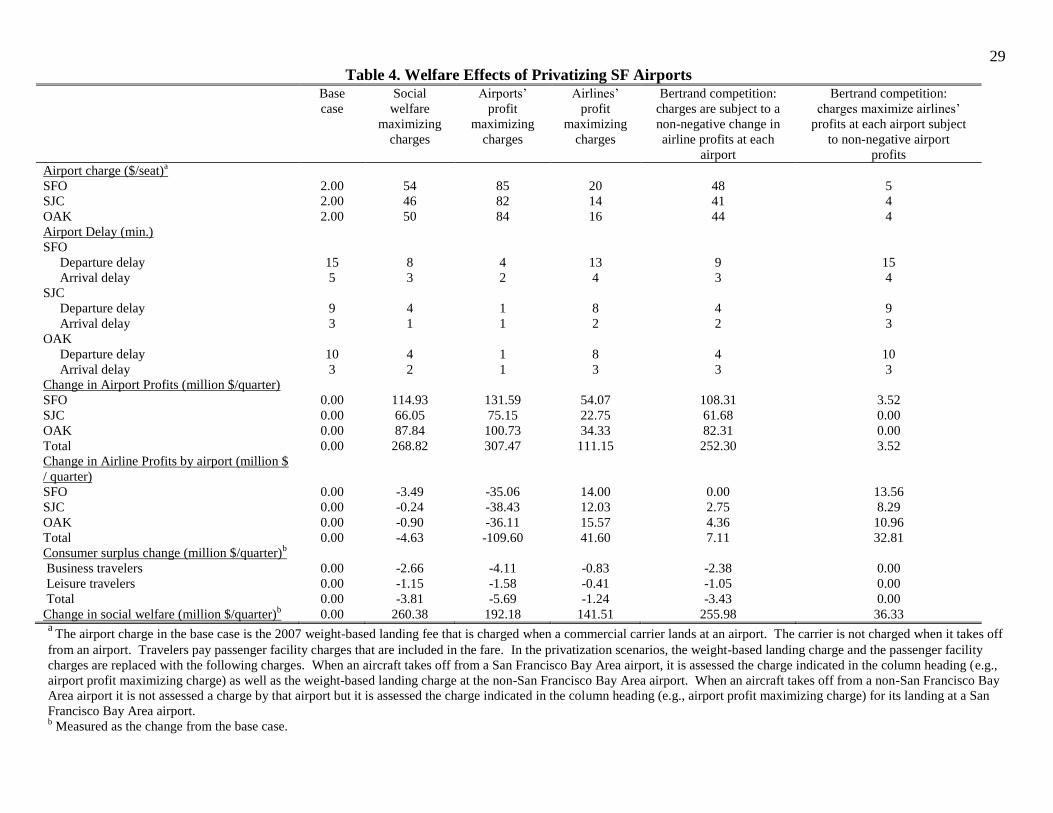
4. The Effects of Private Airport Competition
We quantify the economic effects of private San Francisco Bay Area airports engaging in
competition by comparing the base-case (public airport) equilibrium with equilibria generated under
alternative scenarios characterizing private airport competition. Each scenario results in a three-stage
sequential moves game and we describe our computational procedures for the different scenarios in the
appendix. It is appropriate to characterize the scenarios as capturing the effects of private airport
competition because the airports are independently setting runways charges to maximize profits without,
at this point, any governmental regulatory constraints.
When a SF airport is privatized, we assume that a carrier’s weight-based landing fee and
passenger facility charges are replaced with the appropriate take-off charge indicated in a particular
scenario. The carrier does pay a weight-based landing fee when it lands at a non-SF airport. When a
carrier takes off from a non-SF airport it is not assessed a charge by that airport, but it is assessed the
charge indicated in a particular scenario for landing at a privatized SF airport. The first column of table
4 presents the base-case equilibrium outcomes generated from weight-based landing fee charges at the
SF airports. We measure the welfare effects from alternative scenarios relative to the base case. In
column 2, we present another benchmark based on runway charges that maximize social welfare—the
sum of consumer surplus and airport and airline profits. Those charges confirm that current weight-
based landing fees are inefficient by generating substantial welfare gains, $260 million per quarter, but
the airports accrue all the benefits while both airlines and travelers are worse off.
Findings for Different Competitive Environments
We now turn to scenarios that collectively have the potential to offer insights on designing both
an efficient and feasible strategy of private airport competition. We first consider monopoly scenarios in
which the three airports are privatized and acquired by one owner who sets charges for all three airports.
One extreme case is that the owner behaves like an upstream monopolist and sets charges to maximize
total airport profit (third column). Even in this case welfare improves over the base case. As expected,
airport profits are the source of the welfare gain while travelers’ and airlines’ welfare declines sharply as
airport charges are nearly double socially optimal charges and confirm the double marginalization
problem in a vertical market structure: travelers pay excessive air fares because both the upstream
monopolist (airports) and the downstream oligopolists (airlines) raise prices above their own marginal
costs.
19
Economics theories suggest that the double marginalization problem can be ameliorated by
bargaining between upstream and downstream firms. Negotiated or contract prices have also been an
important feature of deregulated transportation markets with few competitors (Winston (1998)) and they
were previously used by Winston and Yan (2011) to assess highway privatization in an oligopolistic
setting. Bargaining between an airport and a large airline(s) could occur because such airlines are
involved in terminal investments and may have a large share of airport operations (for example, United
at SFO and Southwest at OAK). In the extreme case that the owner of the airports sets runway charges
to maximize total airline profits, charges are much lower than in the preceding cases (fourth column),
enabling airlines to gain from private airport competition and curbing travelers’ losses with some
sacrifice in social welfare.
The conflict between increasing social welfare and increasing each agent’s welfare could be
reduced by introducing market competition, where the three airports are privatized and acquired by
different owners who set profit-maximizing charges independently. Allowing bargaining in that situation
and a non-negative outcome for airlines compared with the base case, results in a social welfare gain that
is close to the upper bound, a gain instead of a loss for airlines, and only a modest loss for travelers
(column 5). Finally, as shown in the sixth column, it is possible for airports, airlines, and travelers to be
better-off from private airport competition if competition and bargaining generate airport charges that
maximize airline profits subject to a non-negative change in airports’ profits. Although that outcome
greatly improves the political feasibility of private airport competition, it does so by reducing the overall
welfare gain to a small fraction of the upper bound.
What do we learn from the experiments? First, allowing competition between airports with
different owners and bargaining between airports and airlines are essential components of an efficient
and politically feasible—in the sense of not generating intolerable losses to any agent—private airport
competition policy. Otherwise, airports would exercise considerable market power to set runway
charges that extract most if not all of the benefits. Second, the major obstacle preventing travelers from
gaining is the high pass-through rate from airport charges to airline fares. Even a modest increase in
airport charges (column 4), while increasing airports’ and airlines’ profits, harms travelers. At the same
time, the intensity of bargaining that keeps travelers from being harmed drives airport charges to such a
low level that the overall welfare gains are small (column 6). Accordingly, it would be desirable to
reduce the high pass-through rate from airport charges to air fares in a more competitive airline market.
We explored this possibility by computing the average fare increase in each market when the three
20
airports increased their current charges to $50 per seat under private airport competition (roughly $70
per passenger given the 70% load factor). Figure 1 shows that as the number of carriers in a market
increases, the pass-through rate decreases slightly from 88% to 84%, suggesting that airline competition
is not an important ingredient for a successful private airport competition policy.
Accounting for General Aviation
Another approach to benefiting commercial airline travelers is to recognize that some 20,000 to
30,000 general aviation (GA) operations per quarter use the San Francisco Bay Area airports (table 1)
and contribute to congestion and delays. GA travelers tend to have higher incomes and, in some cases,
more pressing trip purposes than commercial airline travelers have and are therefore likely to have a
greater willingness to pay for airport service. Thus differentiated airport prices, which cater to GA and
commercial airline travelers’ varying preferences, could increase airport profitability and overall welfare
gains even if the charges for commercial airlines are not high.
We did not initially include general aviation (GA) in our model because data on unscheduled
operations by origin-destination pair and by time of day are generally unavailable. But by making some
reasonable assumptions about GA operations, we can obtain some illustrative findings to help design a
market for private SF airport competition that would enhance both commercial airline travelers’ welfare
and the overall welfare gain. We adjusted the demand and operating cost functions that we developed
for commercial airline travel to calibrate GA demand and operating cost functions at each of the SF
airports, the values of different time components for GA travelers, and the delay functions accounting
for GA operations at each of the SF airports. Details of those calibrations are contained in the technical
appendix. We then incorporated those functions and parameters to analyze Bertrand oligopoly private
airport competition scenarios that accounted for GA operations. We assumed that private airports are
able to increase their charges for general aviation but that those charges are subject to a price cap, which
prevents them from exceeding twice the current landing charge of $140 per flight at SFO. Thus we
identify a potentially constructive role for government regulation. Given GA charges, airports compete
on charges for commercial carriers to optimize their own objectives subject to negotiations.
We seek “win-win” oligopoly bargaining solutions where the welfare of travelers and
commercial airlines does not decrease from the base case and airports make positive profits. Let
1,0 represent the bargaining power of an airport when it negotiates charges with the airlines; each
airport is assumed to set charges to maximize:
Profits Airlines' 1 ProfitsAirport .
21
We find that values of 17.0 lead to the win-win outcome, which suggests that given the capped GA
charge, airlines and airports have sufficient flexibility to negotiate charges that raise social welfare and
benefit travelers because their gain from less delay offsets the loss from higher fares.23
Table 5 presents
results for 17.0 and a solution that maximizes the sum of airlines and airports profits at each airport
subject to a non-negative change in commercial travelers’ welfare and a $280 price-cap on the GA
charge. We obtain a sizeable welfare gain because GA’s small current charge, which has little effect on
its contribution to delays that increases airlines’ and travelers’ costs, is replaced by a greater and more
efficient charge.24
Because the gains from private airport competition come at the expense of General Aviation,
including recreational flyers and commercial air taxis, it is useful to consider how their welfare could
improve. One approach is to stimulate competition among smaller private airports in the Bay Area.
Currently, with the major exception of Branson Missouri Airport, hardly any private airports offer
scheduled commercial service; in all likelihood because they face a significant disadvantage competing
against public airports that receive federal and local government subsides.25
GA’s welfare could
improve if smaller private airports, including newly privatized public airports, competed for (smaller)
aircraft that provide scheduled commercial service and that have unscheduled operations by, for
example, taking advantage of improvements in GPS technology that have enabled GA to have easier
access to smaller airports, by upgrading runways and gates, and by offering van and rental car services
to improve travelers’ access to the central city and other parts of the metropolitan area. In sum,
policymakers must resist the temptation to regulate the major SF airports to protect GA from higher
charges, and should encourage all airports to engage in market competition for commercial passengers
and recreational flyers so that all civilian aviation classifications could potentially gain from the policy.
Product differentiation at airports that, for example, differentiated service between business and
leisure commercial travelers would enhance both the efficiency and political feasibility of private airport
competition. But modeling product differentiation is difficult in our analysis because airlines, not
23
Airlines’ and airports’ flexibility to negotiate charges that lead to a win-win” situation is slightly reduced if we reduce the
price cap for GA. For example, if the price cap for GA is $140 instead of $280, then the airline bargaining weight cannot be
less than 0.085 to generate a bargaining outcome where the change in commercial travelers’ welfare is non-negative. 24
Morrison and Winston (1989) assessed the effects of congestion pricing at airports and contacted airport control towers to
obtain data on general aviation operations based on tower logs. They found that setting congestion tolls substantially
increased airport charges to GA, causing them to curtail operations at major airports which reduced delays experienced by
commercial carriers and travelers. 25
As part of its negotiations to operate privately, Branson Missouri Airport “gifted” some of its land to Taney County and
agreed not to receive federal funds from the Airport Improvement Program. In rare cases, the Secretary of Transportation has
funded private airports under the justification that they serve as “reliever” airports for congestion.
22
airports, are capable of segregating commercial travelers according to their travel preferences. Airport
services could be differentiated through the entry and exit behavior of airlines; for example, such
behavior has created a certain degree of product differentiation at the SF airports with Southwest, a low-
cost carrier, playing a dominant role at OAK and United, a legacy carrier, playing a dominant role at
SFO. Under private airport competition, an airport in a metropolitan area could differentiate its services
further to cater to certain carriers; those carriers could adjust their networks to use that airport more
frequently; and those travelers who prefer the airline and airport’s differentiated service would benefit.
5. Discussion
Our private airport competition empirical experiments based on air travel using the SF airports
have identified the importance of: 1. policymakers creating a competitive environment for airports
(upstream competition); 2. allowing airlines to negotiate with airports to prevent excessive airport
charges (upstream and downstream bargaining); 3. stimulating differentiated services provided by large
and smaller airports (upstream product differentiation). Policymakers in other U.S. metropolitan areas
that have the potential to benefit from private airport competition, such as Chicago, New York, Boston,
Washington, DC, and Los Angeles, could also use those insights to guide their strategy. Based on our
findings for the SF airports, the potential annual benefits from private airport competition nationwide
could amount to billions of dollars.
Moreover, the assumptions that we used to enable the analysis to be empirically tractable tend to
produce a downward bias in our estimates. First, we restricted commercial airlines’ entry and exit
behavior in response to airport charges (Assumption 2), which limits airports’ product differentiation
and enables them to face a less elastic demand from airlines. Relaxing the assumption would increase
airlines’ demand elasticity and make it more difficult for private airports to increase charges. It would
also enable airlines, as noted earlier, to adjust their networks by playing other airport hubs off against
the SF airports and therefore increase their bargaining power and airport competition. Our simulations
indicate that an increase in airlines’ bargaining power would increase the benefits of private airport
competition. Second, we have assumed aircraft sizes are fixed (Assumption 3) although it is possible
that airlines could respond to higher airport charges by increasing aircraft sizes and reducing flights,
which would increase charges but reduce delays. As shown in the appendix table A1, we find that if, for
example, airlines increase their aircraft sizes 50%, then the potential gains from private airport
competition are increased because the airlines’ gain from less delay exceeds their loss from higher
23
charges, airports’ profits increase, and the quarterly social welfare gains are an additional $100 million.
Third, we have assumed that airlines operate with a target average load factor (Assumption 5), which we
assumed was 70% in our simulations because, as discussed in the appendix, it enabled us to most closely
replicate observed outcomes based on our network of routes. Assuming a higher average load factor
would be more aligned with industry-wide average load factors during the last several years and would
cause airlines’ profits to increase by reducing average costs and would cause travelers’ welfare to
increase by reducing average fares. Of course, average load factors vary across routes; but capturing this
heterogeneity in an environment with higher load factors would generally show that the benefits to
airlines and travelers from private airport competition are even greater.
We noted that data limitations prevented us from including international routes in our analysis,
but we have discussed how we control for the effects of international air travel on air travel demand and
supply. The presence of international passengers lowers the target load factor to some extent on certain
domestic routes; hence, we set a 70% load factor in our simulations, which is lower than the 80%
industry average in domestic markets, to account for international and connecting passengers. In
addition, we have performed sensitivity analysis to explore the effects of assuming different load factors
and we have found that the findings from our simulations were not particularly affected. International
routes themselves do include congested domestic and international airports so travelers on those routes
would also benefit from private airport competition that reduces travel delays. At the same time, the pass
through rate of higher airport charges to higher fares may be limited on those international routes where
fares are still regulated.
Finally, we have considered airports’ pricing behavior only. Competition among private airports
would provide airports with the incentive to overcome regulatory hurdles to and to expedite construction
of additional runways to expand capacity and reduce delays26
; facilitate entry by allowing any carrier to
provide service that was willing to pay the cost of terminal facilities; work with airlines to improve the
efficiency of taxi and runway operations; improve operations to reduce costs27
; implement advances in
technology that could improve security and aircraft operations; and be more responsive to passengers by
introducing new services such as short-stay hotels and relaxation areas. Although an analysis that
incorporates those factors awaits further research, the findings that we have obtained for pricing
26
Private investors that have acquired foreign airports that have been privatized have made additional investments to expand
runway and terminal capacity. 27
In a worldwide comparison of airports, Oum, Yan, and Yu (2008) found that privatization has reduced airport costs by
promoting competition.
24
behavior suggest by themselves that the benefits from private airport competition may be quite large if
the policy is implemented properly.
25
References
Barnhart, Cynthia and Amy Cohn. 2004. “Airline Schedule Planning: Accomplishments and
Opportunities,” Manufacturing & Service Operations Management, Volume 6, Winter, pp. 3-22.
Basso, Leonard J. 2008. “Airport Deregulation: Effects on Pricing and Capacity,” International Journal
of Industrial Organization, volume 26, July, pp. 1015-1031.
Bel, Germa and Xavier Fageda. 2010. “Privatization, Regulation, and Airport Pricing: An Empirical
Analysis,” Journal of Regulatory Economics, Volume 37, April, pp. 142-161.
Berry, Steven, Michael Carnal, and Pablo Spiller. 2007. “Airline Hubs: Costs, Markups, and the
Implications of Customer Heterogeneity,” in Advances in Airline Economics, Competition Policy
and Antitrust, Volume 1, edited by Darin Lee, Elsevier, United Kingdom.
Berry, Steven and Panle Jia. 2010. “Tracing the Woes: An Empirical Analysis of the Airline Industry,”
American Economic Journal: Microeconomics, volume 2, August, pp. 1-43.
Berry, Steven, James Levinsohn, and Ariel Pakes. 1995. “Automobile Prices in Market Equilibrium,”
Econometrica, volume 63, July, pp. 841-890.
Belobaba, Peter, Amedeo Odoni, and Cynthia Barnhart (eds.). 2009. The Global Airline Industry, West
Sussex, UK: John Wiley.
Bilotkach, Volodymyr, Joseph A. Clougherty, Juergen Mueller, and Anming Zhang. 2012. “Regulation,
Privatization, and Airport Charges: Panel Data Evidence from European Airports,” Journal of
Regulatory Economics, volume 42, August, pp. 73-94.
Douglas George W. and James C. Miller. 1974. Economic Regulation of Domestic Air Transport:
Theory and Policy, Brookings Institution, Washington, DC.
Gillen, David W., William G. Morrison, and Christopher Stewart. 2003. Air Travel Demand Elasticities:
Concepts, Issues and Management, Department of Finance, Government of Canada, January.
Morrison, Steven A. 1983. “Estimation of Long-Run Prices and Investment Levels for Airport
Runways,” Research in Transportation Economics, volume 1, pp. 103-130.
Morrison, Steven A. and Clifford Winston. 2000. “The Remaining Role of Government Policy in the
Deregulated Airline Industry,” in Deregulation of Network Industries: What’s Next?, edited by
Sam Peltzman and Clifford Winston, Washington, DC, Brookings, pp. 1-40.
Morrison, Steven A. and Clifford Winston. 1989. “Enhancing the Performance of the Deregulated
Air Transportation System, Brookings Papers on Economic Activity: Microeconomics,
pp. 61-123.
26
Nevo, Aviv. 2000. “A Practitioner’s Guide to Estimation of Random Coefficients Logit Models of
Demand,” Journal of Economics and Management Strategy, volume 9, pp. 513-548.
Oum, Tae H., Jia Yan, and Chunyan Yu. 2008. “Ownership Forms Matter for Airport Efficiency: A
Stochastic Frontier Investigation of Worldwide Airports,” Journal of Urban Economics, volume
64, September, pp. 422-435.
Oum, Tae H., Anming Zhang, and Yiming Zhang. 1995. “Airline Network Rivalry,” Canadian Journal
of Economics, volume 28, pp. 836-857.
Starkie, David. 2001. “Reforming UK Airport Regulation,” Journal of Transport Economics and
Policy, volume 35, January, pp. 119-135.
Topkis, Donald. 1979. “Equilibrium Points in Nonzero-Sum n-Person Submodular Games,” SIAM
Journal of Control and Optimization, Volume 17, November, pp. 773-787.
Van Dender. 2007. “Determinants of Fares and Operating Revenues at US Airports,” Journal of Urban
Economics, Volume 62, September, pp. 317-336.
Vives, Xavier. 2005. “Complementarities and Games: New Developments,” Journal of Economic
Literature, Volume 43, June, pp. 437-479.
Winston, Clifford. 2013. “On the Performance of the US Transportation System: Caution Ahead,”
Journal of Economic Literature, volume 51, September, pp. 773-824.
Winston, Clifford.1998. “U.S. Industry Adjustment to Economic Deregulation,” Journal of Economic
Perspectives, volume 12, Summer, pp. 89-110.
Winston, Clifford and Jia Yan. 2011. “Can Privatization of U.S. Highways Improve Motorists’
Welfare?,” Journal of Public Economics, volume 95, August, pp. 993-1005.
Zhang, Anming and Yimin Zhang. 2003. “Airport Charges and Capacity Expansion: Effects of
Concessions and Privatization,” Journal of Urban Economics, volume 53, January, pp. 54-75.
27
Table 1. Summary Statistics for SF Airports
SFO SJC OAK
Total passengers in 2007 a
34,346,413 10,653,817 14,533,825
Average trip distance of commercial travelers (miles)b
2084
(577)
1993
(603)
1996
(614)
Average flying time of commercial travelers (hour)b 4.93
(1.27)
4.78
(1.29)
4.70
(1.32)
Total commercial flight operations in 2007:3 c
69,331 31,257 44,991
Average commercial aircraft size (seats)d 146
(45)
126
(42)
134
(26)
Total general aviation (GA) flight operations in 2007:3 c 29,588 17,610 23,901
Percent of GA operations that are air taxis in 2007:3 c
84.1 42.1 31.6
Average number of commercial flights in a 15 minute
interval in 2007:3 e
11
[1, 27]
6
[1, 15]
6
[1, 17]
Average departure delay in 2007:3 (min) f
15
(13)
9
(11)
10
(11)
Average arrival delay in 2007:3 (min) f
5
(4)
3
(3)
3
(3) a
Source: annual reports of the airports b
Source: DB1B. Numbers in parentheses are standard errors. c Source: http://aspm.faa.gov/opsnet/sys/Airport.asp
d Source: Back Aviation Solutions database. Numbers in parentheses are standard errors.
e Source: ASPM data base. Numbers in parentheses are minimal and maximal values.
f Source: ASPM database. Numbers in parentheses are standard errors.
28
Table 2. Demand Elasticities and Value of Time Components based on Demand Coefficients
Variables Heterogeneous preferences:
BLP GMM estimates
Aggregate price elasticity of demand for air travel
Overall
Business travelers
Leisure travelers
Value of Airborne time ($/hour)
Overall
Business travelers
Leisure travelers
Value of Airport delay ($/hour)
Overall
Business travelers
Leisure travelers
Value of flight frequency ($/flight)
Overall
Business travelers
Leisure travelers
Willingness to pay for non-stop flights ($)
Overall
Business travelers
Leisure travelers
Willingness to pay for connecting flights with a connection that is less than 1.5 hours ($)
Overall
Business travelers
Leisure travelers
-1.54
-1.35
-2.10
24
33
16
104
144
71
16
22
11
212
295
144
17
24
12
Table 3. Summary of Marginal Costs from BLP GMM estimates
Median marginal cost per mile ($ per passenger mile)
Overall
Non-stop products
Connecting products
By Airlines
American
United
Delta
US Airways
Continental
Northwest
Alaska
Southwest
JetBlue
Other non-low-cost carriers
Other low-cost carriers
By SF Airports
SFO
SJC
OAK
0.09
0.16
0.08
0.10
0.11
0.07
0.08
0.07
0.09
0.10
0.05
0.06
0.13
0.07
0.10
0.09
0.07
29
Table 4. Welfare Effects of Privatizing SF Airports
Base
case
Social
welfare
maximizing
charges
Airports’
profit
maximizing
charges
Airlines’
profit
maximizing
charges
Bertrand competition:
charges are subject to a
non-negative change in
airline profits at each
airport
Bertrand competition:
charges maximize airlines’
profits at each airport subject
to non-negative airport
profits
Airport charge ($/seat)a
SFO
SJC
OAK
Airport Delay (min.)
SFO
Departure delay
Arrival delay
SJC
Departure delay
Arrival delay
OAK
Departure delay
Arrival delay
Change in Airport Profits (million $/quarter)
SFO
SJC
OAK
Total
Change in Airline Profits by airport (million $
/ quarter)
SFO
SJC
OAK
Total
Consumer surplus change (million $/quarter)b
Business travelers
Leisure travelers
Total
Change in social welfare (million $/quarter)b
2.00
2.00
2.00
15
5
9
3
10
3
0.00
0.00
0.00
0.00
0.00
0.00
0.00
0.00
0.00
0.00
0.00
0.00
54
46
50
8
3
4
1
4
2
114.93
66.05
87.84
268.82
-3.49
-0.24
-0.90
-4.63
-2.66
-1.15
-3.81
260.38
85
82
84
4
2
1
1
1
1
131.59
75.15
100.73
307.47
-35.06
-38.43
-36.11
-109.60
-4.11
-1.58
-5.69
192.18
20
14
16
13
4
8
2
8
3
54.07
22.75
34.33
111.15
14.00
12.03
15.57
41.60
-0.83
-0.41
-1.24
141.51
48
41
44
9
3
4
2
4
3
108.31
61.68
82.31
252.30
0.00
2.75
4.36
7.11
-2.38
-1.05
-3.43
255.98
5
4
4
15
4
9
3
10
3
3.52
0.00
0.00
3.52
13.56
8.29
10.96
32.81
0.00
0.00
0.00
36.33 a
The airport charge in the base case is the 2007 weight-based landing fee that is charged when a commercial carrier lands at an airport. The carrier is not charged when it takes off
from an airport. Travelers pay passenger facility charges that are included in the fare. In the privatization scenarios, the weight-based landing charge and the passenger facility
charges are replaced with the following charges. When an aircraft takes off from a San Francisco Bay Area airport, it is assessed the charge indicated in the column heading (e.g.,
airport profit maximizing charge) as well as the weight-based landing charge at the non-San Francisco Bay Area airport. When an aircraft takes off from a non-San Francisco Bay
Area airport it is not assessed a charge by that airport but it is assessed the charge indicated in the column heading (e.g., airport profit maximizing charge) for its landing at a San
Francisco Bay Area airport. b Measured as the change from the base case.
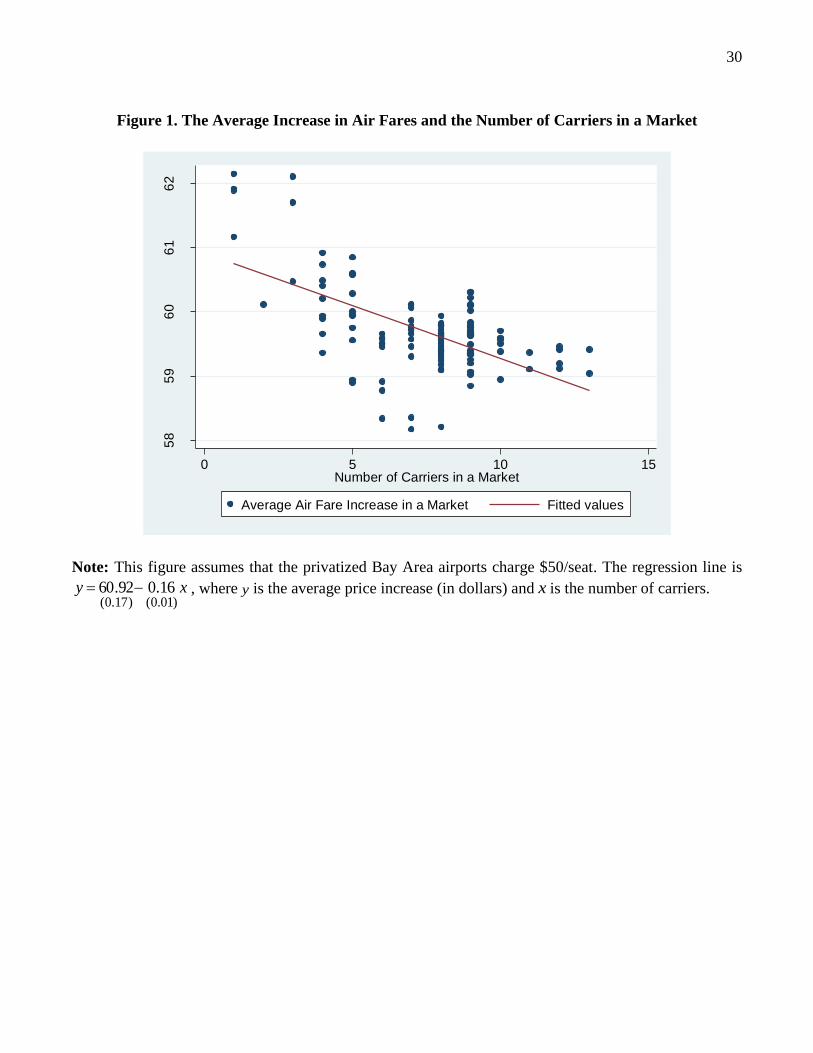
30
Figure 1. The Average Increase in Air Fares and the Number of Carriers in a Market
Note: This figure assumes that the privatized Bay Area airports charge $50/seat. The regression line is
xy)01.0()17.0(
16.092.60 , where y is the average price increase (in dollars) and x is the number of carriers.
58
59
60
61
62
Ave
rag
e A
ir F
are
In
cre
ase in
a M
ark
et
0 5 10 15Number of Carriers in a Market
Average Air Fare Increase in a Market Fitted values
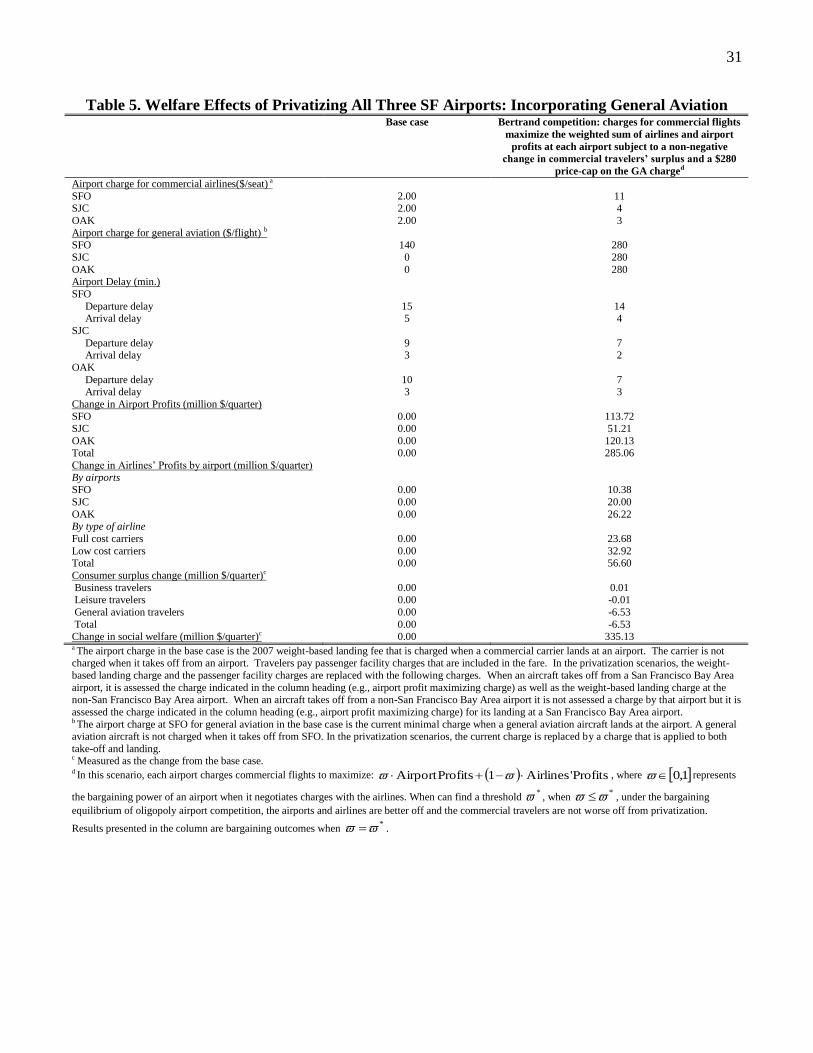
31
Table 5. Welfare Effects of Privatizing All Three SF Airports: Incorporating General Aviation Base case Bertrand competition: charges for commercial flights
maximize the weighted sum of airlines and airport
profits at each airport subject to a non-negative
change in commercial travelers’ surplus and a $280
price-cap on the GA charged
Airport charge for commercial airlines($/seat) a
SFO SJC
OAK
Airport charge for general aviation ($/flight) b
SFO
SJC
OAK Airport Delay (min.)
SFO
Departure delay Arrival delay
SJC
Departure delay Arrival delay
OAK
Departure delay Arrival delay
Change in Airport Profits (million $/quarter)
SFO SJC
OAK Total
Change in Airlines’ Profits by airport (million $/quarter)
By airports SFO
SJC
OAK By type of airline
Full cost carriers
Low cost carriers Total
Consumer surplus change (million $/quarter)c
Business travelers Leisure travelers
General aviation travelers
Total Change in social welfare (million $/quarter)c
2.00 2.00
2.00
140
0
0
15 5
9 3
10 3
0.00 0.00
0.00 0.00
0.00
0.00
0.00
0.00
0.00 0.00
0.00 0.00
0.00
0.00 0.00
11 4
3
280
280
280
14 4
7 2
7 3
113.72 51.21
120.13 285.06
10.38
20.00
26.22
23.68
32.92 56.60
0.01 -0.01
-6.53
-6.53 335.13
a The airport charge in the base case is the 2007 weight-based landing fee that is charged when a commercial carrier lands at an airport. The carrier is not charged when it takes off from an airport. Travelers pay passenger facility charges that are included in the fare. In the privatization scenarios, the weight-
based landing charge and the passenger facility charges are replaced with the following charges. When an aircraft takes off from a San Francisco Bay Area
airport, it is assessed the charge indicated in the column heading (e.g., airport profit maximizing charge) as well as the weight-based landing charge at the non-San Francisco Bay Area airport. When an aircraft takes off from a non-San Francisco Bay Area airport it is not assessed a charge by that airport but it is
assessed the charge indicated in the column heading (e.g., airport profit maximizing charge) for its landing at a San Francisco Bay Area airport. b The airport charge at SFO for general aviation in the base case is the current minimal charge when a general aviation aircraft lands at the airport. A general aviation aircraft is not charged when it takes off from SFO. In the privatization scenarios, the current charge is replaced by a charge that is applied to both
take-off and landing. c Measured as the change from the base case. d In this scenario, each airport charges commercial flights to maximize: Profits Airlines' 1 ProfitsAirport , where 1,0 represents
the bargaining power of an airport when it negotiates charges with the airlines. When can find a threshold * , when
* , under the bargaining
equilibrium of oligopoly airport competition, the airports and airlines are better off and the commercial travelers are not worse off from privatization.
Results presented in the column are bargaining outcomes when * .